Article

Combining Ability and Testcross Performance for Carotenoid Content of S2 Super Sweet Corn Lines Derived from Temperate Germplasm

by
Worawan Wasuwatthanakool
1,
Bhornchai Harakotr
1,*,
Yaowapha Jirakiattikul
1,
Khomsorn Lomthaisong
2 and
Khundej Suriharn
3,4
1
Department of Agricultural Technology, Faculty of Science and Technology, Thammasat University, Pathum Thani 12120, Thailand
2
Department of Chemistry, Faculty of Science, Khon Kaen University, Khon Kaen 40002, Thailand
3
Department of Agronomy, Faculty of Agriculture, Khon Kaen University, Khon Kaen 40002, Thailand
4
Plant Breeding Research Center for Sustainable Agriculture, Faculty of Agriculture, Khon Kaen University, Khon Kaen 40002, Thailand
*
Author to whom correspondence should be addressed.
Agriculture 2022, 12(10), 1561; https://doi.org/10.3390/agriculture12101561
Submission received: 24 August 2022 / Revised: 23 September 2022 / Accepted: 24 September 2022 / Published: 27 September 2022
(This article belongs to the Special Issue Germplasm Resources Exploration and Genetic Breeding of Crops)

Abstract

:
Understanding the impact of gene action and combining ability on targeted traits in a hybrid breeding program is imperative. The objective of this study was to estimate the genetic effect and combining ability of S2 super sweet corn lines on carotenoid content. Twenty S2 lines were crossed with two hybrid testers by using the line × tester mating design. Regarding parents, forty hybrids and two commercial checks were evaluated for carotenoid content across two different growing seasons between 2019 and 2020. The result indicated that the non-additive gene action governed the inheritance of carotenoid content. Several promising S2 lines for individual carotenoids were identified; only L20 possessed different and positive GCA values for all observed carotenoids. Moreover, genotype T2 was a promising tester to identify superior lines for creating biofortified sweet corn hybrids. Testcross hybrids with satisfactory performance, desirable SCA estimates, and involving at least one of the pairwise parents with positive and high GCA were successfully defined. Hybrid T2 × L20 had high lutein, zeaxanthin, β-cryptoxanthin, and total carotenoids contents (ranging from 12.58 to 74.01 µg/g of dry weight), whereas hybrid T2 × L9 showed the highest content of β-carotene (4.19 µg/g of dry weight). We propose that high GCA and line at least one of the pairwise parents be included in indirect selections for the hybrid breeding of high-carotenoid sweet corn.

Graphical Abstract

1. Introduction

Super sweet corn (Zea mays L. var. saccharata), one of the most preferred vegetable crops, is widely grown and consumed worldwide as a canned or frozen foodstuff. This corn type has an allelic mutant shrunken2 (sh2) gene that makes it suited for food processing because it accumulates starch at a constant rate and maintains high sugar levels [1]. Therefore, super sweet corn possesses significant shares in both national and global markets [2]. For instance, in Thailand, the domestic production of sweet corn increased from 100,000 tons in early 1992 to 357,118 tons at the end of 2019 [3]. Nowadays, Thailand is the world’s leading exporter of canned sweet corn, and 73% of the total production is concentrated in four provinces: Chiang Mai, Chiang Rai, Lampang, and Kanchanaburi. Apart from economic advantages, sweet corn offers abundant nutritional values including protein, lipids, minerals [4], and phytochemicals such as phenolics, flavonoids, and carotenoids [5]. Carotenoids are recognized as potent antioxidants [6] that benefit human health through reducing the risk of cancer, cardiovascular disease, and age-related macular degeneration (AMD) [7,8]. Carotenoids are the second largest group of naturally appearing lipid-soluble pigments, represented in yellow, orange, or red colors. Two of fifty carotenoid structures found in plants are predominant, namely xanthophylls (lutein, zeaxanthin, and β-cryptoxanthin) and carotenes (β-carotene and α-carotene) [9]. Within the xanthophylls group, lutein and zeaxanthin are major non-provitamin A in corn kernels. Several epidemiological studies have found that diets high in these two fractions can protect ocular tissues from phototoxic damage and improve visual acuity [7,9,10]. Likewise, provitamin A carotenoids, namely β-carotene and β-cryptoxanthin, are converted into retinol after ingestion, serving as the precursor of the light sensor molecules in the retina. An adequate intake of them can prevent degenerative eye damage, such as night blindness, xerophthalmia, Bitot’s spots, corneal ulcerations, and lesions [9]. However, low dietary sources of provitamin A, lutein, and zeaxanthin in traditional sweet corn have been reported by Baseggio et al. [11]. In contrast, sweet corn genotypes with high β-carotene have been developed to combat hypovitaminosis A and released to targeted populations in several developing countries [2,12].
The success of sweet corn hybrid development can be achieved by selecting superior parents that could be used to develop biofortified commercial corn cultivars. A thorough understanding of combining ability, which comprises general combining ability (GCA) and specific combining ability (SCA), is essential to identify superior parental lines and hybrids [13,14]. While the GCA is determined by the additive genetic effect, the SCA is determined by the non-additive genetic effect, arising largely from the variance of dominance, overdominance, and epistasis with respect to certain traits [15,16]. Line × tester analysis is one of the mating designs commonly applied in biometrical studies and could provide useful information on combining ability and testcross performance [17]. Combining ability using line x tester analysis has been reported in various corn types on yield, yield components [18,19], kernel nutritional qualities [20,21], and disease resistance [22,23]. Moreover, the combining ability analysis is used to estimate the modes of gene actions on desired traits, which could be manipulated by heterosis breeding or by the accumulation of fixable genes through repeated selections [24]. Additive gene effect was predominant on carotenoid contents in maize [13,25], while other studies reported the equal importance of both additive and non-additive gene effects on this trait [21,26,27,28,29]. The Lycopene epsilon cyclase (lcyE) gene is the key gene influencing how much flux goes into the α- and β-carotene biosynthetic pathways (e.g., lutein and zeaxanthin, respectively), whose two parallel branches bifurcate after carotenogenesis [26]. Four genes, namely phythoene synthase (PSY1), cytochrome P450-type monooxygenase (CYP97C), ferredoxin-dependent di-iron monooxygenase (HYD3), and carotenoid dioxygenase (ZmCCD1), were found to be responsible for underlying the diversity of Brazilian maize landraces on the content and composition of carotenoids. While PSY1, CYP97C, and HYD3 were more highly expressed at the late grain-filling stage and positively correlated with the total carotenoid content, ZmCCD1 was expressed at the early grain-filling stage and negatively correlated with the total carotenoid content [27].
However, such kinds of studies focusing on sweet corn genotypes on improved carotenoid content are still lacking. In the present study, we examined the combining ability on both total carotenoids and their fractions, constructed from tropical super sweet corn lines derived from temperate corn germplasm. The introduced temperate corn germplasm differs in climatic regions and is expected to expand the genetic diversity in tropical breeding [28,29]. Therefore, the objective of this study was to determine the genetic effect and to estimate the combining ability of super sweet corn lines on carotenoid content. The information obtained from this study will be useful for sweet corn hybrid breeding with better nutritional values.

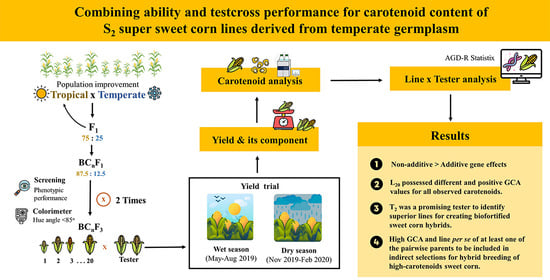
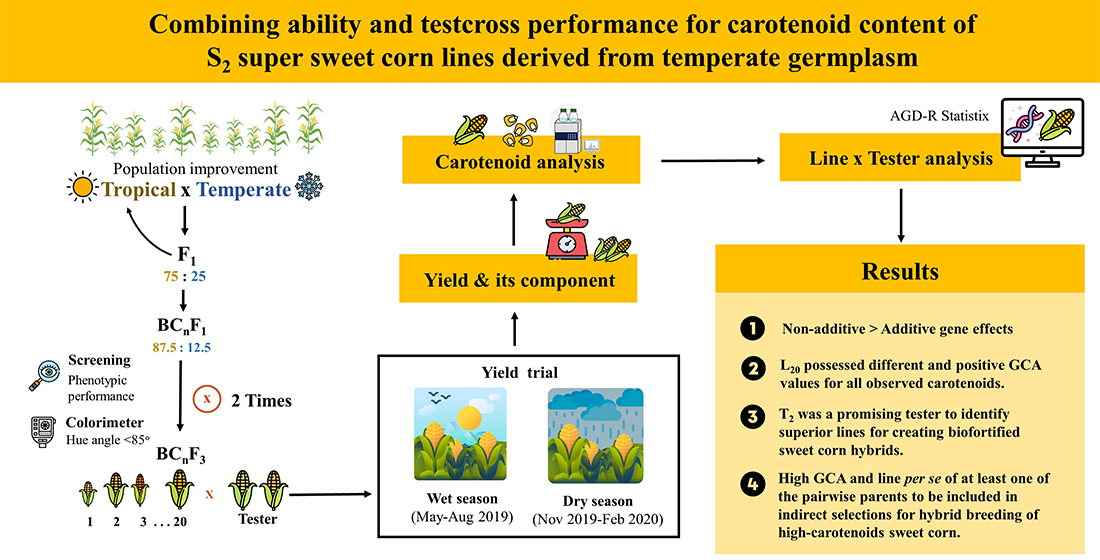
2. Materials and Methods

2.1. Plant Materials

Twenty S2 super sweet corn lines and two F1 hybrids as testers were used in this study (Table 1). These lines were developed from four tropical and temperate biparental crosses, which were obtained from the Plant Breeding Research Center for Sustainable Agriculture, Khon Kaen University, Thailand. Then, the progenies were backcrossed to tropical corn to enhance the adaptation and plant stand in the tropics. The top 10% of BC1F2 or BC2F2-derived lines were selected based on their phenotypic performance. The selected lines of each family were evaluated in the nursery of the Department of Agricultural Technology, Thammasat University, Thailand. The selection was made within and among families, and selected plants were self-pollinated to obtain F2:3 lines. Further selections were performed, emphasizing germination rate, good plant architecture, low ear placement, and good kernel sets. Moreover, sweet corn kernels with a hue angle value of less than 85°, which is the maximum angle for rapid kernel identification with high carotenoid levels, were subsequently selected [12] (Figure 1). The two F1 hybrids used as testers have a wide genetic distance, high yield, good adaptation, and light-yellow kernel pigmentation. A line × tester mating scheme was conducted by assigning 20 elite lines as lines and 2 hybrids as a tester, resulting in 40 progenies. This step was carried out in the dry season of 2018/2019 at the Research Farm in the Department of Agricultural Technology, Thammasat University, Pathum Thani, Thailand.

2.2. Field Experiment

Twenty lines, two hybrid testers, forty hybrids, and two check varieties were evaluated at the Research Farm, Thammasat University, Thailand during May–August 2019 (wet season) and November 2019–February 2020 (dry season). The experiment was conducted in a randomized complete block design (RCBD) with three replications. Each plot consisted of 2 rows 5 m long with a spacing of 0.75 m between rows and 0.25 m between hills in a row; hence, the plant density was 5.33 plants/m2. Thailand’s agricultural recommendations were followed. Fertilizer formula 15-15-15 of NPK was applied at the rate of 312.5 kg/ha before planting, and 156.25 kg/ha of fertilizer formula 46-0-0 was applied twice 20 and 40 days after planting. Weed control was accomplished by hand weeding at critical periods of the crop, whereas pesticides were applied when reaching economic injury level.
Hand pollination was carried out to avoid unintended pollen contamination. Five ears from each plot were harvested at the milk stage, or 20 days after pollination, as a sample for carotenoid analysis. Kernels located in the middle of cobs were manually separated, frozen in liquid nitrogen to stop the enzymatic activity, and then dried using the freeze-drying technique. All the samples were finely ground in a sample mill, sieved through a 60-mesh screen, thoroughly mixed, and stored at −20 °C until analysis.

2.3. Soil and Weather Data

The experimental field is located at 14°04′28.2″ N, 00°36′33.9″ E, 7.3 m above sea level. This site had clay soil (pH = 4.91), very low total nitrogen (0.08%) and available phosphorus (3.85 ppm), and high extractable potassium (165.96 ppm). Weather data, including total rainfall, relative humidity, temperature, and solar radiation, were collected from the nearest meteorological stations. Weather data can be seen in Figure S1.

2.4. Carotenoid Extraction and Analysis

The extraction was performed according to the method of Schaub et al. [30] with slight modifications. The milled samples (1 g) were transferred to 6 mL ethanol (containing 0.1% BHT) and then mixed with a vortex mixer. The tubes were heated in hot water at 85 °C for 3 min and then shaken. This step was repeated twice. The extracts were saponified with 120 µL of 80% KOH and shaken gently by hand. The saponified solutions were placed in an ice bath for 5 min before adding 4 mL of DI water and thoroughly mixing with the vortex mixer. After that, the samples were added with 3 mL of diethyl ether (DE):petroleum ether (PE) (1:1, v/v) and carefully shaken until two layers separated. The aqueous solution was transferred into a new test tube. This step was repeated twice, and the resulting layers were pooled. Consequently, the solution was adjusted to a final volume of 10 mL with PE:DE. The extracted solution was separated equally into two factions. The first fraction was used to determine the total carotenoid content of each sample. A UV–Vis spectrophotometer (Shimadzu mod. UV-128, Japan) was used to measure the absorbance at 450 nm. The total carotenoid content was expressed as micrograms per gram of dry weight (μg/g of dry weight), and it was calculated according to the following formula:
Total carotenoid content = A × V(mL) × 104
A1cm1% × W(g),
where A = absorbance; V = total extract volume; W = sample weight; A1cm1% = 2500 (β-carotene extinction coefficient in PE).
The second fraction was used to quantify each carotenoid. The extracts were concentrated until dry under nitrogen flux. After, samples were stored at −20 °C until further analysis.
The frozen carotenoid extract was dissolved in 1 mL of methyl tert-butyl ether (MTBE):methanol (75:25, v/v) and filtered through a 0.22 µm nylon membrane filter. The composition of solvents and the gradient elution conditions used were those described by Gupta et al. [31] with slight modifications. Reversed-phase HPLC analysis of carotenoids was performed using a Shimadzu system (Shimadzu, Japan) equipped with a binary pump (LC-20AC pump) and a diode array detector (SPD-M20A). Chromatographic separations were performed on a reversed-phase C30 column (250 × 4.6 mm, 3 μm diameter) coupled to a 20 × 4.6 mm C30 guard column (YMC Co., Japan). The mobile phases were (A) methanol/water (98:2, v/v), (B) methanol/water (95:5, v/v), and (C) MTBE. Gradient elution was 80% A, 20% C at 0 min, followed by a linear gradient to 60% A, 40% C to 2 min at a flow rate of 1.4 mL/min. The 2.01 min flow rate was changed to 1.00 mL/min and the gradient was changed to 60% B, 40% C followed by a linear gradient to 0% B, 100% C by 12 min and was returned to the initial condition by 13 min. A re-equilibration (7 min) was carried out at the initial concentration of 80% A, 20% C. Operating conditions were as follows: column temperature of 25 °C, injection volume of 10 μL, and monitoring wavelength of 450 nm. Moreover, peaks were verified with retention time and spectral characteristics by a diode array detector (range 350–600 nm) in both standards and samples. The results for the carotenoids were expressed as micrograms per g of dry weight (μg/g of dry weight).

2.5. Statistical Analysis

Analysis of variance of each growing season was performed, and the error variances were then tested for homogeneity [32]. The line × tester analysis and combining ability estimates for all observed traits were computed by Analysis of Genetic Designs in R (AGD-R) version 5.0 software. Mean comparisons were performed with the least significant difference (LSD) test by Statistix 10.0 [33].
The mean squares for male and female parents are independent estimates of GCA line and GCA tester effects, respectively, while the mean square of line × tester interaction is an estimate of the SCA effect [34,35]. The statistical model followed for combining ability analysis was that of Singh and Chaudhary [34] with proper modification regarding the line × tester multi-environment according to the AGD-R user manual [36]. The proportional contributions of lines (GCAL), testers (GCAT), and their interaction (SCAL×T) to the sum of squares of hybrids were assumed as the ratio between the sum of squares of each component and the sum of squares of hybrids [34]. Combining ability estimates (GCA and SCA), including their standard errors, were calculated following Singh and Chaudhary’s formula [34].

3. Results and Discussion

3.1. Line and Tester Analysis

The season was significant for all observed carotenoids (Table 2), indicating that contrasting climate profiles between wet and dry seasons significantly altered the carotenoid contents. Changes in weather parameters such as temperature, solar radiation, relative humidity, and rainfall seemed to interfere with the accumulation of carotenoids among tested genotypes in this study. This assumption was supported by previous studies [37]. The hybrid was significant on all observed carotenoids, suggesting that our tested progenies derived from the line × tester mating fashion were diverse enough to evaluate. The existing variabilities of corn germplasm on carotenoids have been reported [21,25,28,38,39]. Hybrid × season interaction was also significant for all observed carotenoids, indicating that each tested hybrid had different responses to different growing seasons based on carotenoid content. This corroborated previous results [25]. Thus, evaluation of the effect of either germplasm or selected progenies on carotenoid content should be conducted across diverse environments. Moreover, this also revealed that there was a certain number of hybrids that were suitable for growing in specific environments.
The GCA effects of line and tester were significant on all observed carotenoids, indicating that our parental lines possessed diverse levels of favorable alleles during hybrid formation. Likewise, the SCA effect on these attributes was also significant. Moreover, this result exhibited that hybrids had better or worse performance than expected and had considerable complementation degrees in the frequency of alleles presenting dominance or over-dominance [40]. The interaction between the GCA line and season was significant on all observed carotenoids. This result suggested that the GCA-based line selection should be applied to each environment; however, the interaction between SCA and season was also significant, and it supposed that the crossbreeding process was not stable across the assessed environments.
A better understanding of the magnitudes of additive and non-additive variance components is important for formulating a breeding strategy on desired traits. The proportion of dominance variance to the total variance was predominant for lutein (93.73%), zeaxanthin (100%), β-cryptoxanthin (95.46%), β-carotene (100%), and total carotenoid content (69.95%) (Table 2). The more dominant gene effect was important, and the less additive gene effect existed. The increased importance of the dominant gene effect on certain traits could be attributed to inbreeding and the accumulation of homozygotic loci [28]. The predominance of non-additive gene action was found in our study’s selection criteria; therefore, selections could be performed at later generations. This means that low-intensity selection (i) is applied in early breeding cycles to avoid the fixation of deleterious alleles, and increasing selection intensities could be performed in further selection cycles (F5–F7) to fix the favorable alleles and harness heterosis.
On the other hand, previous investigations reported the large contribution of additive gene effect instead of non-additive effects on lutein, zeaxanthin, β-cryptoxanthin, and β-carotene of maize [13,25]. Halilu et al. [28] found the predominance of additive gene action on β-cryptoxanthin and non-additive gene actions on grain yield, β-carotene, α-carotene, and provitamin-A. Other studies reported the importance of additive and non-additive gene effects on dried kernel carotenoids of maize [21,38,41]. The contrasting reports on the carotenoid content of corn may be due to differences in the genetic background of materials used, experimental conditions, mating design, or even carotenoid analysis methods.
Low estimates of narrow-sense heritability were noticed on carotenoids, ranging from 0% to 24% (Table 1). Similar results have been reported by Halilu et al. [28], where zero broad- and narrow-sense heritability values for β-cryptoxanthin and α-carotene occurred in tropical-adapted maize. However, other research has found medium to high broad-sense heritability estimates for these traits [13,38,39,41,42]. These results confirmed that the contrasting of this key parameter correlated with genetic backgrounds and/or environmental factors. Moreover, low estimates of heritability indicated that phenotypic selection was not an effective method for improving carotenoid content in corn kernels. Harjes et al. [26] found that kernel color trends have a moderate positive correlation with total carotenoids but only a weak positive correlation with individual carotenoids. The molecular approaches may prove much more efficient than selection based on color alone. Marker-assisted selection (MAS) for favorable alleles of the carotenoid biosynthesis genes, for example, lcyE (lycopene epsilon cyclase) and crtRB1 (β-carotene hydroxylase 1), has been used to increase the level of carotenoids [26,43]. On the other hand, recurrent selection could be used as a potential strategy for improving quantitative traits such as carotenoid content in corn kernels [24]. Dhliwayo et al. [44] reported that S1 recurrent selection could increase lutein and zeaxanthin in three diverse maize populations. Additionally, during two cycles of selection, this method could enhance the contents of lutein, zeaxanthin, β-carotene, and total carotenoid of waxy corn populations, ranging from 18.5% to 196.6%, as compared with the base population [45]. Finally, because of the predominance of non-additive gene action and low heritability value, genetic gains from recurrent selection of carotenoids in the base population constructed from 20 S2 lines presented a suitable breeding strategy for short- and long-term breeding goals.

3.2. Evaluation of Hybrid Performance

With this study, we aimed to establish new super sweet corn hybrids with high carotenoid contents. Thus, the performance of each tested hybrid on carotenoid compositions was investigated. Unfortunately, the superior hybrids having high contents of all carotenoid fractions were not able to be identified (Table 3 and Table S1). Across two different growing seasons, the mean of total carotenoid content ranged from 29.78 µg/g of dry weight (T1 × L8) (Table S1) to 74.01 µg/g of dry weight (T2 × L20) (Table 3 and Table S1). Among hybrids, the top 10 hybrids had higher total carotenoid content as much as 51.85% and 40.78% than that of average commercial checks and the best commercial check, respectively. On average, the top 10 hybrids produced 34.56 µg/g of dry weight of lutein content, surpassing both the mean of commercial checks by 12.27 µg/g of dry weight and the mean of the best commercial check (Check 1) by 11.26 µg/g of dry weight. For zeaxanthin content, the mean of the top 10 hybrids was 43.21 µg/g of dry weight that was 17.63 µg/g of dry weight (68.92%) higher than the mean of all checks and 11.02 µg/g of dry weight (34.23%) over the best check (Check 2). Fanning et al. [12] and O’Hare et al. [46] improved zeaxanthin concentration in sweet corn kernels, reaching about 80–100 µg/g DW, based on 75% moisture content, which is 2 times higher than the best hybrids of this study. However, this study is an early step in parental selection. Consequently, the selected promising lines could be further developed to be suitable parental lines. The top 10 hybrids on average showed 7.11 µg/g of dry weight of β-cryptoxanthin higher than that of the commercial checks means. Moreover, the β-carotene content of the top 10 hybrids was higher than the average checks and the best check, representing 25.84% and 18.31%, respectively. Among the top 10 hybrids, genotype T2 × L20 possessed high contents of all observed carotenoids, excluding β-carotene, making this genotype a promising hybrid for biofortified sweet corn (Table 3). This hybrid was derived from T2 and L20 parental lines with positive and high GCA for carotenoid contents (Table 4); this could explain the superiority of hybrid T2 × L20. This result also illustrated that a proper selection of parental lines based on GCA would be effective to achieve superior hybrids.

3.3. General Combining Ability (GCA) and Specific Combining Ability (SCA)

General combining ability has been widely adopted in crop breeding to assist line selections instead of line per se alone. Promising lines with a good line per se and GCA on targeted traits are preferred. With a few exceptions, the contributions of sweet corn lines and testers to hybrids were not consistent across carotenoid profiles in this study (Table 4). Favorable genotypes with high carotenoid content were represented by high parental means and positive GCA values. The parental means of 20 lines on five carotenoid parameters differed significantly from the parental means with total carotenoid content. Parental line L20 was the only one with high contents of all observed carotenoids, while other lines showed adequate performances on certain fractions, e.g., L4 and L17 on lutein; L1, L4, and L9 on zeaxanthin; L5, L9, and L10 on β-cryptoxanthin; and L10, L11, L12, L15, and L19 on β-carotene.
Eight parental lines, L1, L2, L9, L10, L13, L16, L19, and L20, revealed adequate GCA on carotenoid content, of which genotype L20 was the best, presenting a large number of favorable alleles of carotenoid that existed in this genotype (Table 4). The GCA values of genotypes L4 and L15 were negative, indicating that these lines had a lack of favorable alleles of lutein, zeaxanthin, β-cryptoxanthin, β-carotene, and total carotenoid content. Moreover, the S2 lines had greater contributions than the testers on all observed carotenoids. Genetic materials and cross direction during hybrid formation using the line × tester scheme were plausible reasons.
The ideal tester for hybrid breeding should appeal following criteria including the one that performed well, was efficient at classifying the relative performances among lines, and was practical during hybrid formation. Several factors have been considered to choose appropriate testers in hybrid breeding, including gene frequency of favorable alleles, average testcross performance, the magnitude of variance estimates, and GCA effects [23,47]. Elite inbred lines are the logical choice for testers in commercial hybrid breeding [48]. However, a single-cross hybrid with outstanding combining ability would be a reasonable tester for a breeding program that lacks reliable inbred testers [49]. A previous study on combining ability assigned maize F1 hybrids as testers in their mating design, and this method could identify superior three-way cross hybrids and heterotic groups [50]. Moreover, in sweet corn, two parameters, seed germination rate and seedling vigor, are critical issues determining the efficiency of hybrid seed production. Assigning F1 hybrids as female testers like in our study could enhance the germination rate and seedling vigor of female plants and hybrid seed production due to the good seed set of female ears; thus, this concept will benefit hybrid seed producers. Our preliminary study found that F1 hybrids can be effectively assigned to identify our breeding lines better than the inbred lines. Therefore, in this study, two F1 hybrids differing in carotenoid content and heterotic groups were used.
The results indicate that suitable testers for individual traits were identified, but not for multiple traits (Table 4). The T2 tester had significant and positive GCA estimates for lutein, β-cryptoxanthin, β-carotene, and total carotenoid content across two seasons, while the T1 tester had a positive GCA estimate for zeaxanthin, and they can thus be regarded as suitable testers. The T2 tester consistently identified most of the tested lines that formed the best testcross identified carotenoid content in the present study, although the relative ranks were not identical (Table 3 and Table S1). Moreover, the T2 tester identified two lines forming testcrosses showing a significant and positive GCA estimate for most studies except zeaxanthin, whereas the T1 tester did not identify any line (Table 4). All the criteria used to identify the best tester favored the selection of the T2 testers as promising candidates to separate superior S2 lines for the hybridization and development of biofortified sweet corn hybrids.
Both general and specific combining abilities should be considered when interpreting the results of inbred lines evaluation during hybrid formation. It was ideal to associate high GCA and SCA values since they were two fundamental criteria used in population selection, namely high mean and the greatest genetic variance [35,51]. Hybrids with high hybrid means and positive SCA values are favorable. The contribution of sweet corn hybrids to hybrids was not stable across carotenoids, with a few exceptions (Table S1). However, several hybrids showed impressive SCA for carotenoid content.
Two major fractions of carotenoids, namely lutein and zeaxanthin, were emphasized in this study. The two positive and highest SCA estimates were found in T2 × L12 and T2 × L18 for lutein, and in T1 × L10 and T2 × L12 for zeaxanthin (Table S1). These hybrids involved one to two parental pairs that had positive GCA estimates. Both the top five high-lutein hybrids (T2 × L2, T2 × L17, T2 × L14, T2 × L20, and T2 × L5) and the top five high-zeaxanthin hybrids (T2 × L20, T1 × L20, T1 × L10, T2 × L2, and T1 × L19) (Table 2 and Table S1) were composed of at least a male line with adequate GCA. A similar pattern was also found in the other three carotenoid fractions. Regarding β-cryptoxanthin, β-carotene, and total carotenoid content, high and positive SCA estimates involved at least one parent presenting high GCA. However, we also noticed that a hybrid with high and positive SCA was derived from a parental pair with negative GCA. This result indicated that both S2 lines and testers possessed genes that are complementary.

4. Conclusions

The non-additive variance was predominantly prevailing for all the carotenoid content that can be exploited in hybrid breeding. L20, the superior line with positive and high GCA values, was the best general combiner for all the traits, whereas T2 could be considered the best tester. Moreover, the testcross hybrids with efficient performance and desirable SCA estimates involve at least one of the parents with positive GCA. T2 × L20 had high contents of all traits that were found in T2 × L9, except β-carotene. Although sweet corn hybrids with high carotenoids have a greater advantage for growers and consumers, high yield and satisfactory eating quality are the primary goals of breeding programs. Thus, the selected promising S2 lines could be further developed to be elite inbred lines and selected through combining ability by intercrossing with lines originating from other gene pools with high yield and palatability for establishing single-cross hybrids in the future.

Supplementary Materials

The following supporting information can be downloaded at: https://www.mdpi.com/article/10.3390/agriculture12101561/s1, Figure S1: Total rainfall, relative humidity, temperature, and solar radiation during crop growth at the Experimental Field, Thammasat University, Thailand in the wet season 2019 (a) and dry season 2019/20 (b); Table S1: Mean and specific combining ability (SCA) of 40 super sweet corn hybrids and two commercial checks for carotenoid contents evaluated across two seasons between 2019 and 2020.

Author Contributions

Conceptualization, B.H., W.W., Y.J., K.L. and K.S.; Formal analysis, B.H., W.W., Y.J. and K.S.; Methodology, B.H., W.W. and K.L.; Writing—original draft, B.H. and W.W.; Writing—review and editing, B.H., Y.J. and K.S.; Project administration, B.H.; Funding acquisition, B.H. All authors have read and agreed to the published version of the manuscript.

Funding

This study was supported by the Thammasat University Research Fund, Contract No. TUFT 2/2564, and the Thailand Toray Science Foundation through Science and Technology Research Grants National Science and Technology for the year 2018.

Institutional Review Board Statement

Not applicable.

Data Availability Statement

The data that support the findings of this study are available from the corresponding author upon reasonable request.

Acknowledgments

We acknowledge the Department of Agricultural Technology, Faculty of Science and Technology, Thammasat University, Thailand for providing research facilities. The sweet corn germplasm used for improved base populations was supplied by the Plant Breeding Research Center for Sustainable Agriculture, Khon Kaen University, Thailand. The authors wish to thank Theerapun Chumroenphat for the guidance provided in the chemical analyses and Abil Dermail for proofreading of the manuscript.

Conflicts of Interest

The authors declare no conflict of interest.

References

  1. Ruanjaichon, V.; Khammona, K.; Thunnom, B.; Suriharn, K.; Kerdsri, C.; Aesomnuk, W.; Yongsuwan, A.; Chaomueang, N.; Thammapichai, P.; Arikit, S.; et al. Identification of gene associated with sweetness in corn (Zea mays L.) by genome-wide association study (GWAS) and development of a functional SNP marker for predicting sweet corn. Plants 2021, 10, 1239. [Google Scholar] [CrossRef]
  2. Mehta, B.K.; Muthusamy, V.; Baveja, A.; Chauhan, H.S.; Chhabra, R.; Bhatt, V.; Chand, G.; Zunjare, R.U.; Singh, A.K.; Hossain, F. Composition analysis of lysine, tryptophan and provitamin-A during different stages of kernel development in biofortified sweet corn. J. Food Comp. Anal. 2020, 94, 103625. [Google Scholar] [CrossRef]
  3. Food and Agriculture Organization. FAOSTAT. Available online: http://www.fao.org/faostat/en/#home (accessed on 30 June 2020).
  4. Swapna, G.; Jadesha, G.; Mahadevu, P. Sweet corn-A future healthy human nutrition food. Int. J. Curr. Microbiol. App. Sci. 2020, 9, 3859–3865. [Google Scholar] [CrossRef]
  5. Sheng, S.; Li, T.; Liu, R.H. Corn phytochemicals and their health benefits. J. Food Sci. 2018, 7, 185–195. [Google Scholar]
  6. Palozza, P.; Krinsky, N.I. Antioxidant effects of carotenoids in vivo and in vitro: An overview. Meth. Enzymol. 1992, 213, 403–452. [Google Scholar]
  7. Moeller, S.M.; Jacques, P.F.; Blumberg, J.B. The potential role of dietary xanthophylls in cataract and age-related macular degeneration. J. Am. Coll. Nutr. 2000, 19, 522S–527S. [Google Scholar] [CrossRef]
  8. Dwyer, J.H.; Navab, M.; Dwyer, K.M.; Hassan, K.; Sun, A.; Shircore, A.; Hama-Levy, S.; Hough, G.; Wang, X.; Drake, T.; et al. Oxygenated carotenoids lutein and progression of early atherosclerosis. Circulation 2001, 103, 2922–2927. [Google Scholar] [CrossRef]
  9. Trono, D. Carotenoids in cereal food crops: Composition and retention throughout grain storage and food processing. Plants 2019, 8, 551. [Google Scholar] [CrossRef]
  10. Abdel-Aal, E.-S.M.; Akhtar, H.; Zaheer, K.; Ali, R. Dietary source of lutein and zeaxanthin carotenoids and their role in eye health. Nutrients 2013, 5, 1169–1185. [Google Scholar] [CrossRef]
  11. Baseggio, M.; Murray, M.; Magallanes-Lundback, M.; Nicholas Kaczmar, N.; Chamness, J.; Buckler, E.S.; Smith, M.E.; Penna, D.D.; Tracy, W.F.; Gore, M.A. Natural variation for carotenoids in fresh kernels is controlled by uncommon variants in sweet corn. Plant Genome 2020, 13, e20008. [Google Scholar] [CrossRef]
  12. Fanning, K.; Martin, I.; Wong, L.; Keating, V.; Pun, S.; Hare, O.J. Screening sweetcorn for enhanced zeaxanthin concentration. J. Sci. Food Agric. 2010, 90, 91–96. [Google Scholar] [CrossRef]
  13. Li, R.; Xiao, L.H.; Wang, J.; Lu, Y.L.; Rong, T.Z.; Pan, G.T.; Wu, Y.Q.; Tang, Q.; Lan, H.; Cao, M.J. Combining ability and parent-offspring correlation of maize (Zea may L.) grain β-carotene content with a complete diallel. J. Integr. Agric. 2013, 12, 19–26. [Google Scholar] [CrossRef]
  14. Khokhar, E.S.; Shakeel, A.; Maqbool, M.A.; Abuzar, M.K.; Zareen, S.; Aamir, S.A.; Asadullah, M. Studying combining ability and heterosis in different cotton (Gossypium hirsutum L.) genotypes for yield and yield contributing traits. Pak. J. Agric. Sci. 2018, 31, 55–68. [Google Scholar] [CrossRef]
  15. Rojas, B.A.; Sprague, G.F. A comparison of variance components in corn yield trials. III general and specific combining ability and their interactions with locations and years. Agron. J. 1952, 44, 462–466. [Google Scholar] [CrossRef]
  16. Falconer, D.S. Introduction to Quantitative Genetics, 3rd ed.; Longman Scientific and Technical, Co.: New York, NY, USA, 1989. [Google Scholar]
  17. Sharma, H.C.; Dhillan, M.K.; Reddy, B.V.S. Expression of resistance to Atherigona soccata in F1 hybrids involving shoot fly-resistant and susceptible cytoplasmic male-sterile and restorer lines of sorghum. Plant Breed. 2006, 125, 473–477. [Google Scholar] [CrossRef]
  18. Elmyhum, M. Estimation of combining ability and heterosis of quality protein maize inbred lines. Afr. J. Agric. Res. 2013, 8, 6309–6317. [Google Scholar]
  19. Amin, M.N.; Amirurzaman, M.; Ahmed, A.; Ali, M.R. Evaluation of inbred lines of maize (Zea mays L.) through line x tester method. Bangladesh J. Agric. Res. 2014, 39, 675–683. [Google Scholar] [CrossRef]
  20. Kahriman, F.; Egesel, C.Ö.; Orhun, G.E.; Alaca, B.; Avci, F. Comparison of graphical analyses for maize genetic experiments: Application of biplots and polar plot to line x tester design. Chil. J. Agric. Res. 2016, 76, 285–293. [Google Scholar] [CrossRef]
  21. Maqbool, M.A.; Aslam, M.; Khan, M.S.; Beshir, A.; Ahan, M. Evaluation of single cross yellow maize hybrids for agronomic and carotenoid traits. Int. J. Agric. Biol. 2017, 19, 1087–1098. [Google Scholar] [CrossRef]
  22. Fountain, J.C.; Abbas, H.K.; Scully, B.T.; Li, H.; Lee, R.D.; Kemerait, R.C.; Guo, B. Evaluation of maize inbred lines and topcross progeny for resistance to pre-harvest aflatoxin contamination. Crop J. 2019, 7, 118–125. [Google Scholar] [CrossRef]
  23. Zebire, D.; Menkir, A.; Adetimirin, V.; Mengesha, W.; Meseka, S.; Gedil, M. Effectiveness of yellow maize testers with varying resistance reactions to Striga hermonthica for evaluating the combining ability of maize inbred lines. Agronomy 2020, 10, 1276. [Google Scholar] [CrossRef]
  24. Maqbool, M.A.; Aslam, M.; Beshir, A.; Khan, M.S. Breeding for provitamin A biofortification of maize (Zea mays L.). Plant Breed. 2018, 137, 451–469. [Google Scholar] [CrossRef]
  25. Egesel, C.O.; Wong, J.C.; Lambert, R.J.; Rocheford, T.R. Combining ability of maize inbred for carotenoid and tocopherols. Crop Sci. 2003, 43, 818–823. [Google Scholar] [CrossRef]
  26. Harjes, C.E.; Rocheford, T.R.; Bai, L.; Brutnell, T.P.; Kandianis, C.B.; Sowinski, S.G.; Stapleton, A.E.; Vallabhaneni, R.; Williams, M.; Wurtzel, E.T.; et al. Natural genetic variation in lycopene epsilon cyclase tapped for maize biofortification. Science 2008, 319, 330–333. [Google Scholar] [CrossRef]
  27. da Silva Messias, R.; Galli, V.; Silva, S.D.D.A.; Rombaldi, C.V. Carotenoid biosynthetic and catabolic pathways: Gene expression and carotenoid content in grains of maize landraces. Nutrients 2014, 6, 546–563. [Google Scholar] [CrossRef]
  28. Halilu, A.D.; Ado, S.G.; Aba, D.A.; Usman, I.S. Genetics of carotenoids for provitamin A biofortification in tropical-adapted maize. Crop J. 2016, 4, 313–322. [Google Scholar] [CrossRef]
  29. Menkir, A.; Olowolafe, M.O.; Ingelbrecht, I.; Fawole, I.; BaduApraku, B.; Vroh, B.I. Assessment of testcross performance and genetic diversity of yellow endosperm maize lines derived from adapted × exotic backcrosses. Theor. Appl. Genet. 2006, 113, 90–99. [Google Scholar] [CrossRef]
  30. Maize Quick Carotenoid Extraction Protocol. Available online: http://www.cropsci.uiuc.edu/faculty/rocheford/quick_carotenoid_analysis_protocol.pdf (accessed on 20 June 2019).
  31. Gupta, P.; Sreelakshmi, Y.; Sharma, R. A rapid and sensitive method for determination of carotenoids in plant tissues by high performance liquid chromatography. Plant Methods 2015, 11, 5–16. [Google Scholar] [CrossRef]
  32. Gomez, K.A.; Gomez, A.A. Statistical Procedures for Agricultural Research, 2nd ed.; An International Rice Research Institute Book, Co., Inc.: New York, NY, USA, 1984. [Google Scholar]
  33. Statistix 10 Data analysis Software for Researchers. Available online: https://www.statistix.com (accessed on 11 November 2014).
  34. Singh, R.K.; Chaudhary, B.D. Biometrical Methods in Quantitative Genetic Analysis; Kalyani Publishers: New Delhi, India, 1985. [Google Scholar]
  35. Hallauer, A.R.; Carena, M.J.; Miranda, J.B. Quantitative Genetics in Maize Breeding; Springer: New York, NY, USA, 2010. [Google Scholar]
  36. Rodríguez, F.; Alvarado, G.; Pacheco, A.; Crossa, J.; Burgueno, J. AGD-R (Analysis of Genetic Designs with R for Windows) Version 5.0; International Maize and Wheat Improvement Center: Mexico City, Mexico, 2018. [Google Scholar]
  37. Mengesha, T.; Cao, F.B.; Wasim, I.; Wu, F.B. Differences in physiological and biochemical characteristics in response to single and combined drought and salinity stresses between wheat genotypes differing salt tolerance. Physiol. Plant 2019, 165, 134–143. [Google Scholar]
  38. Chander, S.; Guo, Y.; Zhang, Y.; Li, J. Comparison of nutritional traits variability in selected eighty-seven inbreds from Chinese maize (Zea mays L.) germplasm. J. Agric. Food Chem. 2008, 56, 6506–6511. [Google Scholar] [CrossRef]
  39. Muthusamy, V.; Hossain, F.; Thirunavukkarasu, N.; Saha, S.; Agrawal, P.K.; Gupta, H.S. Genetic analyses of kernel carotenoids in novel maize genotypes possessing rare allele of ß-carotene hydroxylase gene. Cereal Res. Commun. 2016, 44, 669–680. [Google Scholar] [CrossRef]
  40. Durães, N.N.L.; Crevelari, J.A.; Vettorazzi, J.C.F.; Ferreira, J.A.; de Abreu Santana, F.; Pereira, M.G. Combining ability for traits associated with yield and quality in super sweet corn (Zea mays L. saccharata). Crop Sci. 2017, 11, 1188–1194. [Google Scholar] [CrossRef]
  41. Suwarno, W.B.; Pixley, K.V.; Palacios-Rojas, N.; Kaeppler, S.M.; Babu, R. Formation of heterotic groups and understanding genetic effects in a provitamin A biofortified maize breeding program. Crop Sci. 2014, 54, 14–24. [Google Scholar] [CrossRef]
  42. Wong, J.C.; Lambert, R.J.; Wurtzel, E.T.; Rocheford, T.R. QTL and candidate genes phytoene synthase and zeta-carotene desaturase associated with the accumulation of carotenoids in maize. Theor. Appl. Genet. 2004, 108, 349–359. [Google Scholar] [CrossRef]
  43. Yan, J.; Kandianis, C.B.; Harjes, C.E.; Bai, L.; Kim, E.H.; Yang, X.; Skinner, D.; Fu, Z.; Mitchell, S.; Li, Q.; et al. Rare genetic variation at Zea mays crtRB1 increases β-carotene in maize grain. Nat. Genet. 2010, 42, 322–327. [Google Scholar] [CrossRef]
  44. Dhliwayo, T.; Palacios-Rojas, N.; Crossa, J.; Pixley, K.V. Effects of S1 recurrent selection for provitamin A carotenoid content for three open-pollinated maize cultivars. Crop Sci. 2014, 54, 2449–2460. [Google Scholar] [CrossRef]
  45. Khamkhoh, W.; Ketthaisong, D.; Lomthaisong, K.; Lertrat, K.; Suriharn, K. Recurrent selection method for improvement of lutein and zeaxanthin in orange waxy corn populations. Aust. J. Crop Sci. 2019, 13, 566–573. [Google Scholar] [CrossRef]
  46. O’Hare, T.J.; Fanning, K.; Martin, I. Zeaxanthin biofortification of sweet-corn and factors affecting zeaxanthin accumulation and colour change. Arch. Biochem. Biophys. 2015, 572, 184–187. [Google Scholar] [CrossRef]
  47. Castellanos, J.S.; Hallauer, A.R.; Córdova, H.S. Relative performance of testers to identify elite lines of corn (Zea mays L.). Maydica 1998, 43, 217–226. [Google Scholar]
  48. Bernardo, R. Breeding for Quantitative Traits in Plants, 3rd ed.; Stemma Press: Woodbury, MN, USA, 2020. [Google Scholar]
  49. Fasahat, P.; Rajabi, A.; Rad, J.M.; Derera, J. Principles and utilization of combining ability in plant breeding. Biom. Biostat. Int. J. 2016, 4, 1–22. [Google Scholar] [CrossRef]
  50. Pswarayi, A.; Vivek, B.S. Combining ability amongst CIMMYT’s early maturing maize (Zea mays L.) germplasm under stress and non-stress conditions and identification of testers. Euphytica 2008, 162, 353–362. [Google Scholar] [CrossRef]
  51. Sprague, G.F.; Tatum, L.A. General vs. specific combining ability in single crosses of corn. J. Am. Soc. Agron. 1942, 34, 923–932. [Google Scholar] [CrossRef]
Figure 1. Scheme of the S2 super sweet corn lines development from a cross between tropical and temperate germplasm.
Agriculture 12 01561 g001
Table 1. List of S2 super sweet corn lines, testers, and commercial check varieties used in this study.
No.CodePedigreePopulationDescriptionRelative Carotenoid
Content 1/
1L1Sugar-75/TSC-BC2-4-51Linehigh
2L2Sugar-75/TSC-BC2-6-21Linelow
3L3Sugar-75/TSC-BC2-8-11Linelow
4L4Sugar-75/TSC-BC2-10-51Linehigh
5L5Sugar-75/TSC-BC2-11-21Linemedium
6L6Sugar-75/TSC-BC2-16-51Linelow
7L7Sugar-75/TSC-BC2-22-11Linemedium
8L8Sugar-75/TSC-BC2-25-11Linemedium
9L9Sugar-75/TSC-BC2-28-31Linehigh
10L10Sugar-75/TSC-BC2-29-71Linemedium
11L11Sugar-75/TSC-BC2-31-31Linemedium
12L12Sugar-75/TSC-BC2-32-41Linemedium
13L13Hibrix-3//KV/Delectable-BC1-11-9(2)2Linemedium
14L14Hibrix-3//P4546/Montauk-BC1-10-6(1)2Linemedium
15L15Hibrix-3//P4546/Montauk-BC1-11-72Linehigh
16L16Hibrix-3//P4546/Montauk-BC1-16-72Linemedium
17L17Hibrix-3//Jumbo Sweet/Delectable-BC1-5-32Linehigh
18L18Hibrix-3//Jumbo Sweet/Delectable-BC1-5-52Linemedium
19L19Hibrix-3//Jumbo Sweet/Delectable-BC1-13-52Linemedium
20L20Hibrix-3//Jumbo Sweet/Delectable-BC1-17-42Linehigh
21T1Dr.Pek’s Wan 54 Tester 1high
22T2Hibrix-53 Tester 2low
23C1Dr.Pek’s 1351 Check 1high
24C2Hibrix-59 Check 2low
1/ Total carotenoid contents were analyzed at maturity stage (35 days after anthesis).
Table 2. Combined analysis of variance for carotenoid contents of sweet corn evaluated across two seasons between 2019 and 2020.
SOVdf 1/Mean Squares
LUT 2/ZEAβ-CXβ-CTTCC
Season (S)1537.00 **1566.00 **39.50 **5.77 **1090.00 **
Rep/S21.370.800.090.021.77
Hybrid (H)39110.00 **178.00 **24.61 **0.83 **316.00 **
GCAL191042.00 **213.00 **30.24 **0.91 **264.00 **
GCAT184.78 **109.00 **181.63 **0.77 **3383.00 **
SCA1987.61 **149.00 **10.71 **0.76 **207.00 **
H × S3931.11 **82.19 **7.47 **0.49 **149.90 **
GCAL × S1935.28 **83.79 **7.39 **0.56 **80.81 **
GCAT × S184.78 **0.000.190.067.71
SCA × S1924.18 **85.48 **7.94 **0.43 **226.00 **
Pooled error1560.810.770.190.022.88
Proportion of genetic variance (%)
Ơ2A 6.2704.54030.05
Ơ2D 93.7310095.4610069.95
h2ns (%) 604024
1/ df, degree of freedom; GCAL, general combining ability of line; GCAT, general combining ability of tester; SCA, specific combining ability; Ơ2A, additive genetic variance; Ơ2D, non-additive genetic variance; h2ns, narrow-sense heritability. 2/ LUT, lutein, ZEA, zeaxanthin; β-CX, β-cryptoxanthin; β-CT, β-carotene; TCC, total carotenoid content. ** significant at p ≤ 0.01 probability level.
Table 3. Performance of top ten hybrids sorted on total carotenoid contents and two commercial checks of super sweet corn evaluated across two seasons between 2019 and 2020.
HybridsCarotenoid Contents (µg/g of Dry Weight)
LUT 1/ZEAβ-CXβ-CTTCC
T2 × L2035.83 ab 2/47.59 a12.85 a3.58 c74.01 a
T2 × L1627.72 def33.04 gh7.81 g3.25 ef67.74 b
T2 × L1436.01 ab29.79 klm7.96 g2.58 opq65.03 c
T2 × L1124.64 hi30.35 kl9.37 de3.34 de64.08 cd
T1 × L2028.10 de45.93 b10.66 c3.14 efg62.46 de
T2 × L534.90 b34.62 f9.02 ef3.12 fgh61.11 e
T2 × L1736.03 ab27.77 op5.79 mno3.03 g–k61.08 e
T2 × L129.95 c32.54 hi6.73 h–l2.83 lmn60.61 e
T1 × L1322.39 k–n35.86 e8.65 f2.62 opq60.20 e
T2 × L829.58 c29.08 mn6.67 h–l2.74 mno57.76 f
Mean of top ten hybrids34.5643.2111.893.3660.45
Check 123.30 jk20.96 u3.93 tu2.50 pqr42.94 o
Check 221.27 opq32.19 hij6.17 lmn2.84 j–n36.67 q
Mean of checks22.2925.584.782.6739.81
Grand mean25.6830.236.962.9651.72
C.V. (%)3.432.886.194.813.24
1/ LUT, lutein; ZEA, zeaxanthin; β-CX, β-cryptoxanthin; β-CT, β-carotene; TCC, total carotenoid content. 2/ Means followed by the same letters in the same column are not significantly different at the 0.05 probability level as determined by LSD.
Table 4. Parental means and general combining ability (GCA) on carotenoid contents of super sweet corn evaluated across two seasons between 2019 and 2020.
Lines/
Testers
LUT 1/ZEAβ-CXβ-CTTCC
Mean 2/GCAMeanGCAMeanGCAMeanGCAMeanGCA
Lines
L117.36 c–g 3/1.76 **62.36 a1.89 **4.34 d–h−1.53 **3.74 bcd0.89 **71.78 bc8.71 **
L212.97 e–h2.98 **17.09 f–i3.89 **5.69 c–h2.73 **3.53 cde−0.15 *29.34 m0.49
L37.60 h1.04 *13.24 hi−3.12 **2.28 h−1.26 **2.54 efg−0.49 **22.03 n−11.30 **
L454.28 a−1.25 **55.54 a−2.61 **7.60 b–e−1.65 **3.04 d–g−0.24 **68.84 c−9.69 **
L514.36 d–h2.38 **17.73 f–i2.29 **9.74 ab−0.004.30 abc−0.21 **40.71 hi−0.98
L613.44 e–h−4.86 **22.59 d–i−3.69 **2.34 gh−0.77 **3.10 d–g−0.29 **25.17 n5.40 **
L718.51 c–f−0.3034.70 bc−1.98 **4.03 e–h−1.46 **2.67 efg0.1039.28 ij5.57 **
L89.34 fgh3.17 **26.92 c–g2.38 **3.65 fgh−0.90 **2.45 g−0.63 **36.50 jk−7.03 **
L922.26 b–e−0.2361.94 a−3.21 **9.99 ab0.43 *2.98 d–g1.38 **82.24 a3.68 **
L1020.27 b–e0.75 *24.96 c–h2.39 **13.25 a2.06 **4.91 a0.79 **43.15 gh−2.81 **
L1120.78 b–e−4.43 **25.08 c–h−3.36 **5.74 c–h−1.32 **4.52 ab0.15 *48.59 f−0.36
L1220.42 b–e−2.82 **34.10 bcd−2.24 **7.24 b–f0.75 **4.73 a−0.33 **56.58 e2.38 **
L139.21 fgh1.95 **12.12 i2.47 **4.09 e–h1.85 **3.27 d–g−0.40 **33.89 kl−1.56 *
L1413.40 e–h2.32 **19.78 f–i−0.335.37 c–h−0.41 *3.49 c–f−0.51 **36.59 jk−1.53 *
L1516.03 c–h−5.78 **19.63 f–i−6.40 **8.56 bc−0.11 *4.68 ab−0.15 *61.90 d−2.83 **
L1616.82 c–h−4.14 **33.75 bcd3.20 **2.36 gh0.70 **2.70 efg−0.21 **44.86 fg10.34 **
L1744.59 a1.35 **41.30 b−4.52 **7.99 bcd−2.35 **3.11 d–g−0.51 **72.54 bc−1.68 *
L1829.24 b2.24 **28.80 c–f−2.76 **5.40 c–h0.122.94 d–g−0.43 **59.40 de−0.43
L198.51 gh2.28 **15.91 ghi3.62 **4.25 d–h−0.89 **4.59 ab0.52 **32.62 lm−12.55 **
L2024.27 bc1.59 **31.92 b–e12.09 **9.84 ab4.04 **4.65 ab0.44 **72.99 b16.16 **
Testers
T123.30 bcd−1.83 **20.96 e–i0.86 **3.93 eh−1.10 **2.51 fg−0.09 **42.94 ghi−4.82 **
T221.22 b–e1.83 **32.19 b–e−0.86 **6.17 b–e1.10 **2.84 d–g0.09 **36.67 jk4.82 **
SE Line 0.58 0.61 0.28 0.10 1.20
SE Tester 0.18 0.19 0.09 0.33 0.38
1/ LUT, lutein; ZEA, zeaxanthin; β-CX, β-cryptoxanthin; β-CT, β-carotene; TCC, total carotenoid content. 2/ Means are expressed in µg/g of dry weight. 3/ Means followed by the same letters in the same column are not significantly different at the 0.05 probability level as determined by LSD. * and ** GCA estimates are significantly different from zero at ≥SE and ≥2SE, respectively.
Publisher’s Note: MDPI stays neutral with regard to jurisdictional claims in published maps and institutional affiliations.

