Article

Detection and Analysis of Sow Targets Based on Image Vision

1
College of Water Conservancy & Civil Engineering, China Agricultural University, Beijing 100083, China
2
Chongqing Academy of Animal Sciences, Chongqing 402460, China
3
New Hope Liuhe Co., Ltd., Beijing 100102, China
*
Authors to whom correspondence should be addressed.
Agriculture 2022, 12(1), 73; https://doi.org/10.3390/agriculture12010073
Submission received: 17 November 2021 / Revised: 27 December 2021 / Accepted: 1 January 2022 / Published: 6 January 2022
(This article belongs to the Special Issue Digital Innovations in Agriculture)

Abstract

:
In large-scale sow production, real-time detection and recognition of sows is a key step towards the application of precision livestock farming techniques. In the pig house, the overlap of railings, floors, and sows usually challenge the accuracy of sow target detection. In this paper, a non-contact machine vision method was used for sow targets perception in complex scenarios, and the number position of sows in the pen could be detected. Two multi-target sow detection and recognition models based on the deep learning algorithms of Mask-RCNN and UNet-Attention were developed, and the model parameters were tuned. A field experiment was carried out. The data-set obtained from the experiment was used for algorithm training and validation. It was found that the Mask-RCNN model showed a higher recognition rate than that of the UNet-Attention model, with a final recognition rate of 96.8% and complete object detection outlines. In the process of image segmentation, the area distribution of sows in the pens was analyzed. The position of the sow’s head in the pen and the pixel area value of the sow segmentation were analyzed. The feeding, drinking, and lying behaviors of the sow have been identified on the basis of image recognition. The results showed that the average daily lying time, standing time, feeding and drinking time of sows were 12.67 h(MSE 1.08), 11.33 h(MSE 1.08), 3.25 h(MSE 0.27) and 0.391 h(MSE 0.10), respectively. The proposed method in this paper could solve the problem of target perception of sows in complex scenes and would be a powerful tool for the recognition of sows.

1. Introduction

In China, African swine fever is ravaging farms across the country, the pig-raising industry is set to be upgraded with technological innovations [1]. At present, the management of livestock production mainly relies on experienced farmers [2], which is time-consuming and greatly dependent on individual judgments [3]. With the rapid expansion of the farms and the increased number of livestock, new technologies are urgently needed to improve production efficiency. The technologies of precision livestock farming have proved a success in many fields, and machine vision perception in pigs is one of the key applications [4]. In the production of sows, the sows’ reproductive performance most important factor in the production efficiency of a pig farm [5,6,7,8]. The quick recovery of sows after giving birth can help to increase their follow-up breeding rate. In this process, the observation, identification, and tracking of sows are essential for better farm management and production performance [9]. Identifying sows through contact-free machine vision tracking is a first step in the development of smart pig farms [10,11,12,13]. With the development of machine vision technology and artificial intelligence (AI), the behavior of animals can even be perceived without human participation in daily management [14].
Object detection is a type of machine vision technique for detecting the region of interest (target object) in digital images, which has been of considerable interest in precision livestock farming [15,16,17,18,19,20,21]. In recent years, a series of object detection algorithms [22,23,24] based on deep learning have been developed with advantages of high precision, fast speed, and strong practicability in the field. Deep learning technology has been used for the detection of animal objects [14,25,26,27,28] and has also been used for the assessment of animal welfare [12,29,30,31]. The Convolutional Neural Network (CNN) based on deep learning has shown superior performance in pig image segmentation, behavior recognition, posture detection, and identification [29,32,33,34,35]. However, these applications are mostly in a simple scene and controlled condition with limited disturbances.
In a pig house, objects with different shapes, colors, and influencing factors, such as illumination, occlusion, and adhesion, will challenge the performance of target detection. Through literature, it is found that the YOLO method has been widely used in animal detections, but it also requires high hardware capacity which is very expensive [36]. In the follow-up study, the application of real-time sow detection will be performed in large-scale farms, therefore, the cost and running speed of the sow detection models needs to be comprehensively considered. The deep learning algorithms called Mask R-CNN and UNet-Attention have shown good detection capabilities on targets of various circumstances and have been successfully applied in many fields [37,38], with relatively low expense in hardware and high calculating speed. In the algorithm of UNet-Attention, an attention mechanism is added to improve the effectiveness of the model, which focuses on regional information conducive to object realization and suppresses irrelevant information. The UNet-Attention model has a simple algorithm statement, and even low-resolution information could be easily located and recognized. Its segmentation speed is fast, which can meet the purpose of real-time monitoring of sows. The algorithm based on the Mask Scoring R-CNN framework is supposed to solve image segmentation from complex backgrounds [39]. The Mask RCNN is designed for image instance segmentation, which has an advantage in instance segmentation from the complex background image [38]. Both algorithms do not require high hardware capacity and can rapidly recognize the target form images, which are suitable for real time and large-scale applications in the future.
Up until now, very few studies have been reported in the sow image segmentation using the UNet-Attention and Mask R-CNN algorithms. Therefore, it is necessary to analyze these two algorithms for the sow’s object detection in complex scenes.
In this study, deep learning and image analysis technologies have been used to rapidly acquire sow information in complex scenes. The main contents are as follows: Development of sow target detection method based on deep learning algorithms; Assessment of the segmentation and recognition performances in sow detection between Unet-Attention and Mask-RCNN algorithms; Identity and analysis of sows’ behaviors in the pen, based on the segmentation.

2. Materials and Methods

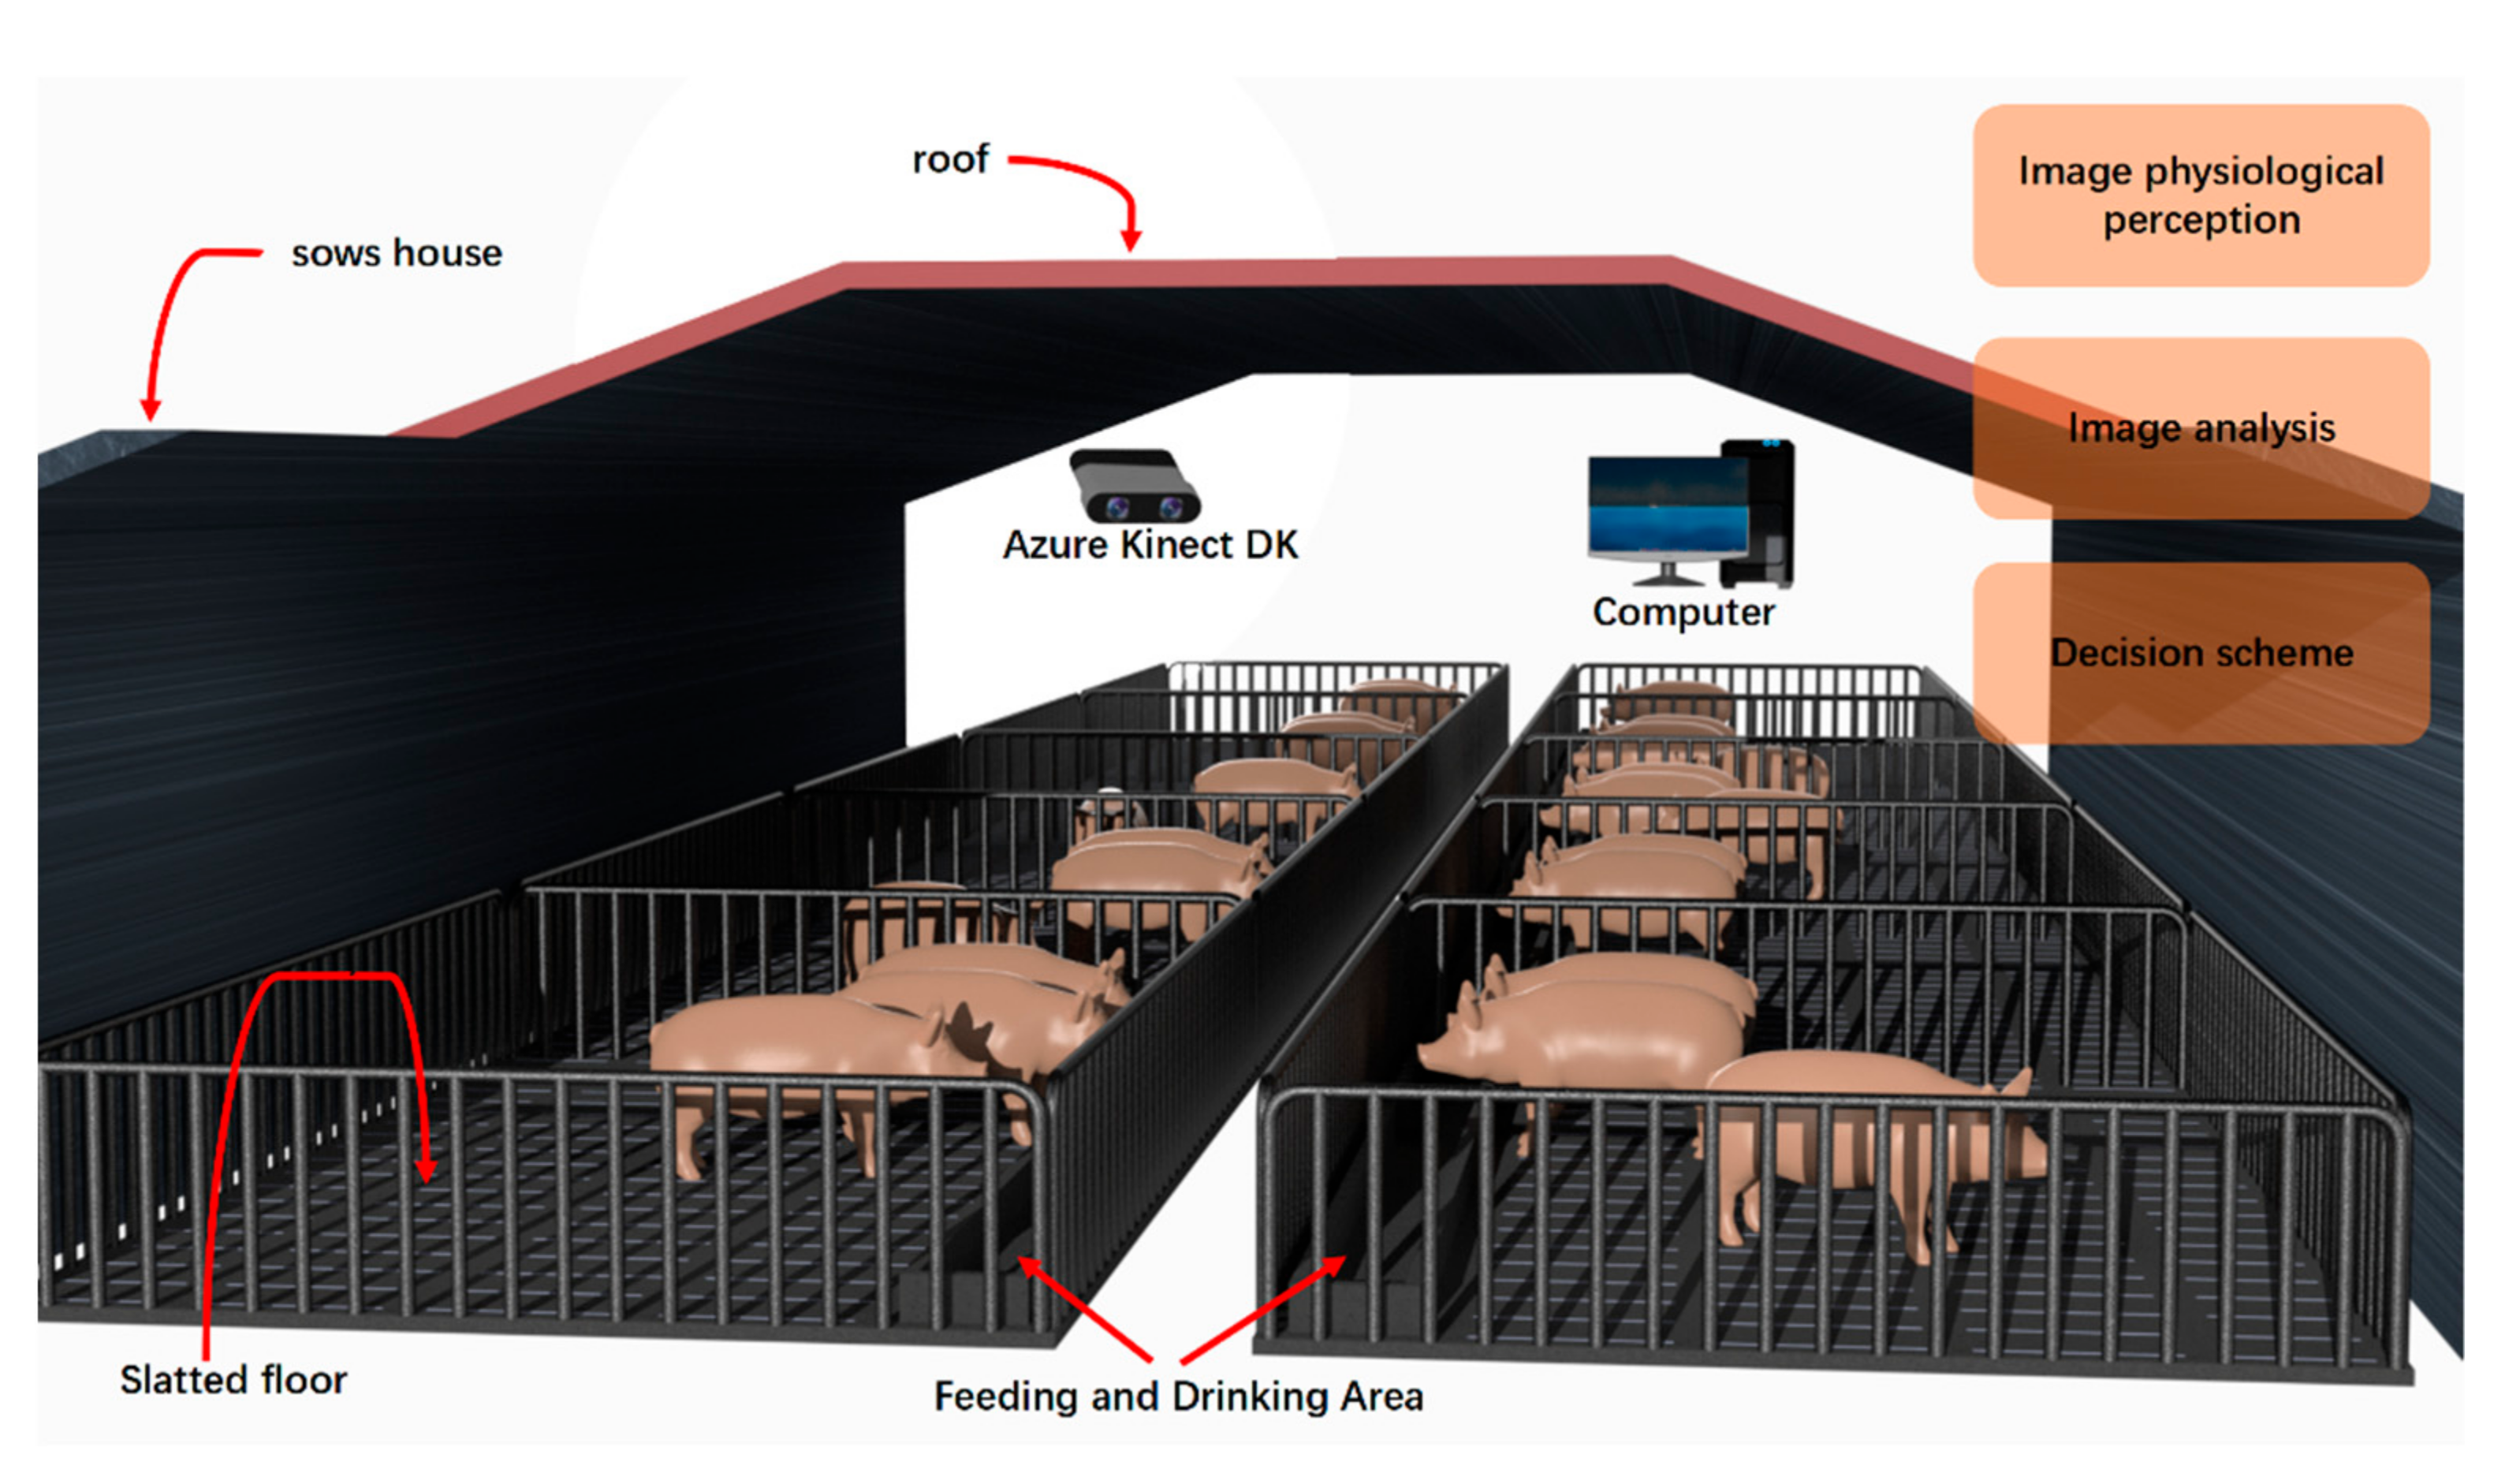
2.1. Animal and Housing

The experiment was conducted on a pig farm in Shandong province, China. The target objects were randomly selected Yorkshire pigs of 2nd–3rd Birth, weighing 245–260 kg. There were a number of 416,873 images were collected. These sows were raised in large pens and fed once a day at 10:00 a.m. and provided ad libitum water from the drinking trough. The sows can move freely in the pen. Due to free movement and contact of the sows, adhesion of sows in images often occurred. The room temperature was maintained at 29–30 °C. The size of the large pen was 3.15 m (L) × 2.06 m (W) × 2.44 m (H). The schematic diagram of the pig raising system is shown in Figure 1.

2.2. Data Acquisition Platform

The image acquisition equipment was Azure Kinect DK (Microsoft Corporation, U.S.). The camera continuously collected digital images and videos in .mkv format (16:9; 1920 ∗ 1080 pixels), with a sampling frequency of 60 Hz. As shown in Figure 1, the camera was connected to a computer through a USB 3.0 cable for storing data. The open source programming language of Python was used in the acquisition procedures.
The Kinect DK captured images of the sow as well as other things of feeder, drinking trough, railings, floor, etc., which formed a complex environment during the target detection process. The preprocessing procedures were as follow:
  • The collected video set in .mkv format was processed into .JPG format images through Python language, and then labeled with the Labelme software to form a .json format file.
  • In the training process, to increase the robustness of the Convolutional Neural Network, the input image of the sow was augmented. The data augmentation mainly used horizontal and vertical flipping, cropping, scale transformation, and rotation. The diversity of the data was also increased in this process.

2.3. Model Development

The program was run under the Pytorch framework in the Ubuntu16.04 system, and CUDA8.0 and cuDNN5.0 were used to accelerate training. The Central Processing Unit (CPU) of deep learning machines was Corei7-8700k (Intel), and the graphics processing unit (GPU) was GTX1080Ti (NVIDIA), and the memory was 32 GB. The data-set had a total number of 416,873 images. The image structure similarity algorithms were used for selection [40] to avoid a large number of similar images. A number of 15,094 images were sorted out. The data-set was divided into the training set and test set, according to the ratio of 9:1. The images were evenly divided into two data-set according to the complexity (stocking density and scale) during training and testing processes. Two optimized deep learning models Unet-Attention and Mask R-CNN were developed for analysis.

2.3.1. Development of the Sow Detection Model Based on Unet-Attention

The Unet-Attention was an algorithm based on the Unet network structure, which had been proposed by Ozan Oktay [37]. To better extract the sows from complex backgrounds in this study, the convolution kernel of stage2 to stage4 in the Attention module was replaced with deformable convolution (DCNV2). The network structure is shown in Figure 2 [37].
Unet-Attention included two stages, with the first stage of down-sampling and the second stage of up-sampling. The down-sampling part was Visual Geometry Group Network 16 (VGG16), and the feature maps corresponding to the down-sampling layer were spliced in the up-sampling stage to achieve feature fusion. Before the down-sampling features were spliced with the up-sampling features, the attention block was used to re-adjust the down-sampling features. This module generated a gating signal to control the importance of features at different spatial locations. Specifically, the input features ( x l ) were scaled with attention coefficients (α) computed in Attention Gate (AG), and the spatial regions were selected by analyzing both the activations and contextual information provided by the gating signal (g) collected from a wide scale. The grid resampling of attention coefficients was done using trilinear interpolation [37]. The Attention Block is shown in Figure 3:
In the application of Unet-Attention, the input image was progressively filtered and downsampled by factor 2 at each scale in the encoding part of the Unet network. The Ags filtered the features propagated through the skip connections. The feature selectivity in Ags was achieved by using contextual information (gating) extracted in wide scales (Figure 3).
The Equation (1) of Attention Block is as follows:
q a t t l = ψ T ( σ 1 ( W χ T χ i l + W g T g i + b g ) ) + b ψ α i l = σ 2 ( q a t t l ( χ i l , g i ; Θ a t t ) )
where α i is the attention coefficient, x l is the input features of channels change, Ψ Τ ,   W are operations of vectorization, g is the gating signal, l is convolution layer, Φ l is the trainable kernel parameters, I is the pixel vector σ 2 corresponds to the sigmoid activation function, parameters Θ a t t contains: linear transformations b g , b ψ are model bias terms.
In the process, g and x l were multiplied by the weight matrix, which could be learned through backpropagation. The importance of each element was determined according to the goal of the algorithm. The term of attention was introduced to increase the weight matrix and to learn the importance of each element and the target.
The uNet-Attention algorithm used a deformable convolution kernel. Compared with the traditional convolution kernel whose size was fixed, the sampling method of the deformable convolution kernel was obtained through learning, mainly by adding offsets to the traditional convolution sampling points to obtain new sampling points and at the same time adding a modulation mechanism.
The deformable convolution can not only offset the input but also adjust the weight of each position input, as shown in Equation (2).
y ( p ) = k = 1 K w k x ( p + p k + Δ p k ) Δ m k
where the convolution kernel has k sampling positions, wk and pk represent the weight of the k position and the preset offset respectively, Δ m k is set to add the weight of each sampling point.
For the loss function of the uNet-Attention algorithm, the Focal Loss was adopted, For y 0 , p was the probability of the output of the model α , which balanced the contribution of positive and negative samples to the final loss, as shown in Equation (3).
L p =       α ( 1 y ) γ l o g y ,     y = 1 ( 1 α ) y γ l o g ( 1 y ) ,     y = 0
Intuitively, the modulation factor reduced the loss contribution of the simple example and extended the low loss range of the samples [41].

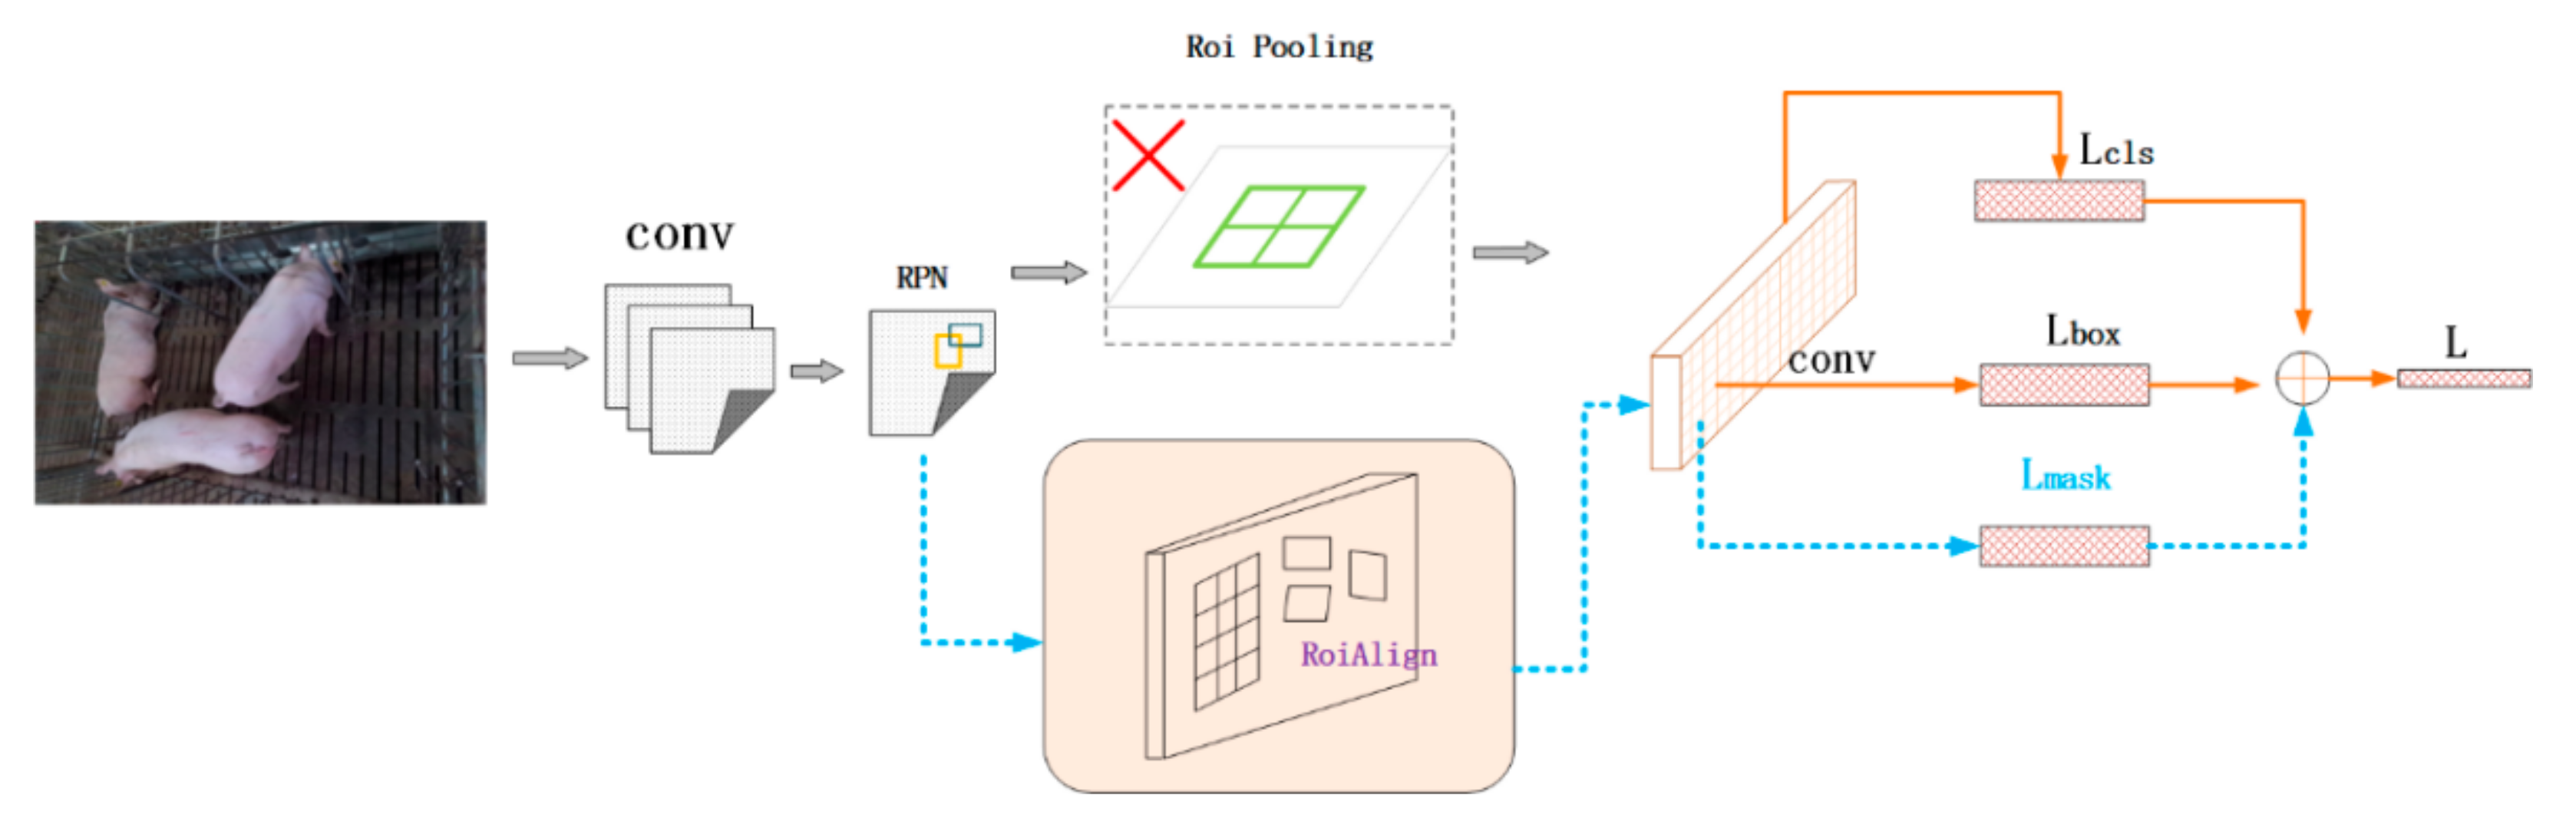
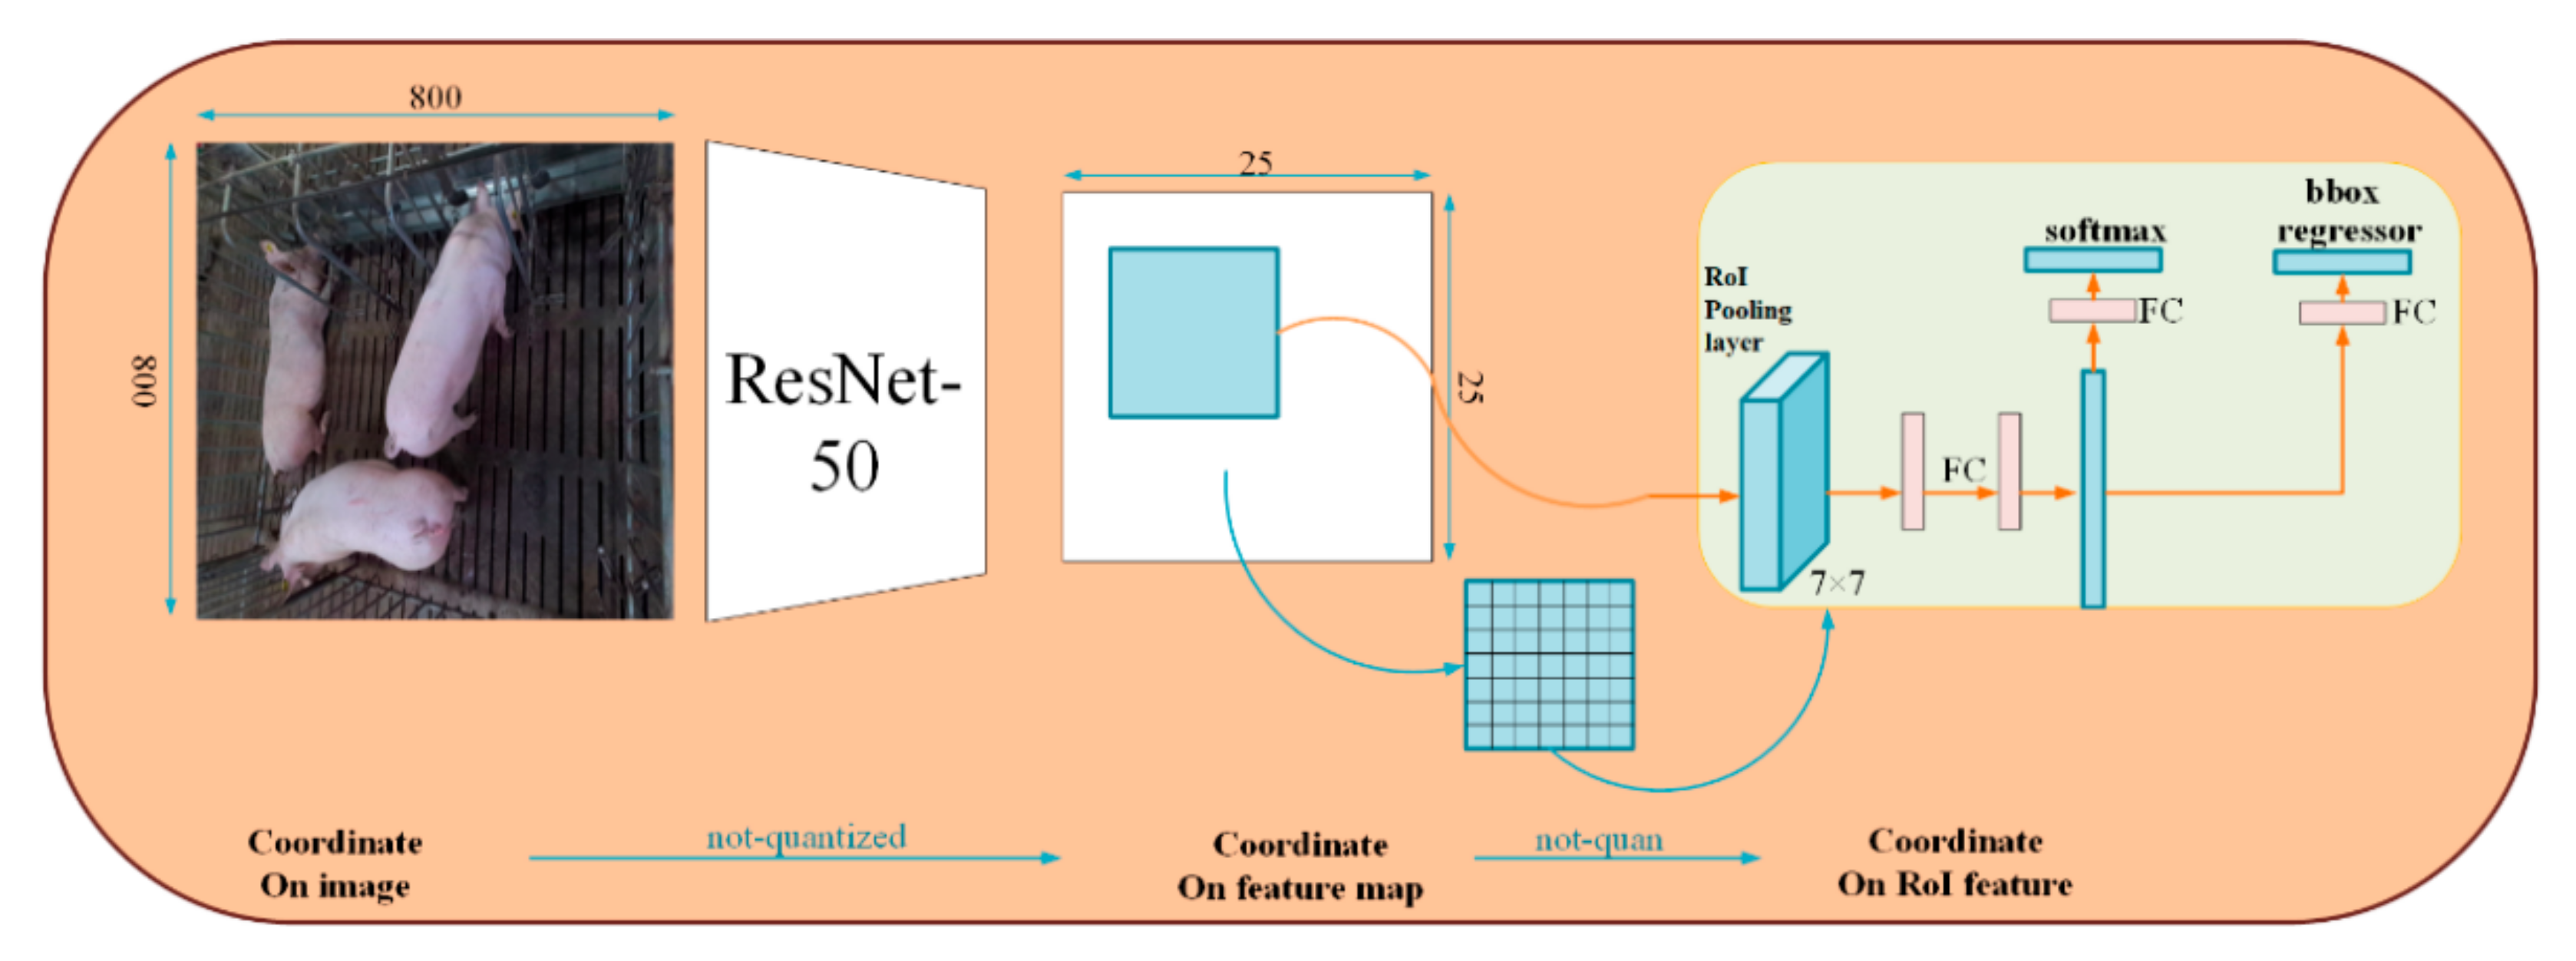
2.3.2. Development of Sow Detection Model Based on Mask-RCNN

The Mask-RCNN is a model for instance segmentation, developed on the basis of Faster R-CNN, a region-based convolutional neural network. The Mask Branch of a small network of Fully Convolutional Networks for Semantic Segmentation (FCN) is supplemented in the Mask-RCNN model. During the process of Mask-RCNN, images were loaded and correspondingly preprocessed using pixel-level prediction to get the label map. The preprocessed images were then put into a pre-trained neural network (ResNeXt, etc.) to obtain the feature maps. A predetermined ROI (Region of interest) for each point in the feature map was set to get multiple candidate ROIs. Next, the candidate ROIs to the Region Proposal Network (RPN) were used for binary classification (foreground or background) and Bounding-Box (BB) regression and filtration. The ROI Align operation was performed on the remaining ROIs. The Mask-RCNN model used a per-pixel sigmoid. In the training step, for ROI in the Kth category, only the Kth mask contributes to Lmask of average binary cross-entropy loss. The overall process is shown in Figure 4 [38].
Backbone is a series of feature maps that convolutional layer was used to extract images. The backbone of Mask-RCNN was deep residual network 50 (ResNet-50), which provided a favorable train of thought for training deeper networks. ResNet used cross-layer connections to make training easier. The ResNet-50 backbone was used along with the improvement of training performance and speed. The FPN (feature pyramid networks) structure was composed of three parts: bottom-up, top-down, and horizontal connection. This structure could merge the features of each level to make it have both strong semantic and spatial information. The stage2 to stage4 in ResNet-50 convolution kernel was replaced with 5 identity blocks of deformable convolution DCN (Deep Cross Network) and ResNet-50.
Mask-RCNN was decomposed into three modules: Faster R-CNN, ROI Align, and FCN.
There was an ROI Align after ‘head section’, which was to enlarge the output dimension of ROI Align, to be more accurate when predicting mask. The ROI Align mainly canceled the quantization operation and used the method of bilinear interpolation to obtain the image value of pixels with floating-point coordinates, transforming the whole feature aggregation process into a continuous operation [38]. The process is illustrated in Figure 5.
There was no quantitative deviation for the ROI Align solution. The pixels in the original image and the pixels in the featured map were completely aligned, which could improve the detection accuracy of the model and promote the algorithm ability for instance segmentation.
For the loss function of the Mask-RCNN algorithm, on the basis of the Fast Region-based Convolutional Network method (Fast R-CNN), a third loss function for mask generation was added. The mask branch had an output of the Kmm dimension for each ROI, where K represented two-class masks for encoding mm images, and each mask had K categories. The mask map had K channels, which represented the number of possible categories of the target. When calculating Lmask, only k-th map of these K maps were processed, and this k represented the object category of the ROI area located by another recognition branch. For an ROI belonging to the k-thcategory, Lmask only considered the k-th mask, and other mask inputs did not contribute to the loss function. Such a definition would allow a mask to be generated for each category, and there would be no inter-class competition. The multi-task loss function is as follow [38]:
L = L cls + L box + L mask

2.4. Assessment of the Model

In this study, a dataset of images of sows in the pen was used to assess the proposed algorithms. The performance of the classification was measured by Equations (5) and (6). The obtained results from the detection models were assumed positive or negative.
P = T P T P + F P
R = T P T P + F N
where the number of correctly classified samples, that was the actually positive instances (samples) were classified as positive, as true positives (TP), and the number of incorrectly classified instances that were actually negative but classified as positive by the classifier was defined as false positives (FP). The number of erroneously classified instances that were actually positive but classified as negative by the classifier was defined as false negatives (FN), and the number of negative instances that were actually negative and classified as negative by the classifier was defined as true negatives (TN). P represented for precision, which was the accuracy rate. R was recall, which was the recall rate.
The models were also assessed using the indicator of Intersection-over-Union (IoU), which was a standard for measuring the accuracy of detecting corresponding objects in a specific data set. The IoU represented the overlap rate or degree of overlap between the generated candidate bound and the ground truth bound, in other words, the ratio of their intersection and union. C was Candidate bound and G was Ground truth bound. The expression is as follows:
IoU = a r e a C a r e a G a r e a C a r e a G
The Average Precision (AP) was used to evaluate the performance of the proposed models, which averaged the precision rates of all categories by combining IoU as the boundary. The AP measured the accuracy of the algorithm predictions and illustrated the percentage of algorithm positive predictions. The Average Recall (AR) referred to the maximum recall rate in a given number of the test results, and the average value was calculated on all IoUs and all categories. The IoU threshold value was defined as 0.50:0.75:0.95 to calculate the AP and AR and denoted as AP50/AR50, AP75/AR75 and AP95/AR95, respectively. To comprehensively analyze the model performance, different threshold values were used, and non-maximal suppression was applied during the calculations. The AP was also calculated based on area sizes in pixels with less than 32 2 , between 32 2 and 96 2 , and larger than 96 2 , which corresponds to APsmall、APmedium and APlarge, respectively. The term of maxDets referring to the maximum detection number of targets in an image was used for defining the detection range.

2.5. Sow Behavior Recognition Based on Image Segmentation

Sows have a higher awareness of regional space in a group-raising state and could form a fixed area for behaviors of feeding and drinking, lying and moving around [42]. As shown in Figure 6, it is a schematic diagram of the position of the sows in the pen. The dark green part is the shared trough for the sows to feed and drink. The staff cleaned the water tank at 7:30 every morning and maintained a continuous water supply. At 9:50 in the morning, the water in the shared trough would be emptied, and the dry feed was then concentrated and fed at 10:00–10:30 in the morning. After 10:30, the staff cleaned the trough to prevent the left feed from becoming moldy. The drinking water was again switched on to maintain ad libitum water supply.
The green part in the image is the sow’s feeding and drinking area. When the sow’s head segmentation image was in the green area, the behavior of feeding or drinking behavior was recognized (the area in the red box in the figure). Due to the particularity of the sow feeding process, only the period of 10:00–10:30 in the morning was used for feeding, and if the head of the sow was detected in the feeding and drinking area during this period, it was judged as the sow’s feeding behavior. On the contrary, in other periods, if the head of the sow was detected in this area, it would be recognized as the sow’s drinking behavior.
In Figure 6, when the sow’s head was detected in the gray area, and the sow is judged as standing and lying behaviors. Aiming at how to distinguish lying down and standing behaviors, this paper used the pixel value area method to identify the lying and standing behaviors of sows. The IMAQ tool in the LabVIEW software (National Instruments, United States) created the frame and calculated the image width (in pixels). The image type was set to Grayscale, and the IMAQ tool extracted a monochrome plane, and the image Dst Out function was a reference to the target image. When ‘Image Dst’ was connected, ‘Image Dst Out’ was the same as ‘Image Dst’. Then, the ROI To Mask function in the IMAQ tool selected the region of interest, and finally, the pixel value was obtained. The block diagram in LabVIEW is as shown in Figure 7.

3. Results and Discussions

3.1. Performance of the Developed Models

In the complex pig house environment, the established deep learning target detection algorithms perfectly identified the target object of the sow as shown in Table 1, Table 2 and Table 3. The collected image data had been treated with preprocessing, model establishment, and model recognition. The AP and AR were used as the performance evaluation indices, as summarized in Table 1 and Table 2. In the Tables, area referred to the number of pixels in the segmentation mask, and the maxDets was the maximum detection threshold of each image. It can be seen in Table 1 and Table 2, the higher the value of IoU, the lower the accuracy and recall rates. Table 3 shows the average precisions of Mask-RCNN under different settings, where APs, APm, and APl stand for AP of small, medium and large objects, respectively. In the algorithm evaluation, AP50 was generally selected. The IoU threshold of the detector was greater than 0.5, and the accuracy of MaskRCNN reached 96.8%. At the same time, the model also defined different values, such as IoU and area for calculation. According to Table 1 and Table 2, the final model operation results were not as good as the model with IoU greater than 0.5.
A test set of sow images was used to verify the trained models. From Table 1, Table 2 and Table 3, it can be seen that the Mask-RCNN algorithm shows better object detection performance. The training and test images were filtered by the similarity algorithm [43] to get preprocessed image data for predictions. Some scholars used image processing to recognize the postures of animals [44,45], but the current segmentation performance was not good for animals in complex environments. Interference from floors, railings, brackets, feeders, drinking troughs affected the detection accuracy and could be misidentified as the sow target.
In this study, the Mask-RCNN algorithm accurately outlined the target object from the complex background. The sow segmentation outcome determined the performance of the algorithm. Figure 8 and Figure 9 show the target object of perception using Mask-RCNN and UNet-Attention algorithms. The segmentation results were evaluated using the completeness of the outlines. It was found that the Mask-RCNN algorithm performed better than UNet-Attention in the segmentation.
The targets in the image were usually overlapped, and the irrelevant objects could be mis-detected. In the algorithm process, non-target samples, such as railings, feeders and drinking troughs were often identified as the target. The UNet-Attention algorithm could also be affected by the patterns on the sows’ backs. If there were overlaps or only part of the target in the image, the accuracy of detection and recognition could be poor. The model structure of the UNet-Attention algorithm could reduce its detection efficiency in the target of the sow. The optimization of the loss function and the network structure in the UNet-Attention algorithm was preferred, and certain layers could be flexibly customized according to the information of the target and surrounding environment [46,47]. The Mask-RCNN was based on He et al.’s (2018) work [38], which gained the detection results using Feature Pyramid Network (FPN) and a divided Network [48]. Mask RCNN had competitions among classes, and the network produced each class of mask. The addition of the ROI Align layer, the interpolation of the feature map, and the direct ROI Pooling quantization operation made the obtained mask have a slight offset from the actual object position. In this research, the Mask-RCNN algorithm of target segmentation performed well. Figure 10 shows the advantages of the Mask-RCNN algorithm in the detection: when the epoch was close to 30, the model had a better convergence effect. After starting training, the status of training was monitored by indicators, such as loss, loss-mask, loss-objectness, and others. Figure 10 shows that the loss has a downward trend after each complete iteration (a complete iteration means that all samples have been passed through). A proper learning rate could be ensured after each round of complete training, and the loss was reduced to a smaller extent after a period of time. The curves in Figure 10 also show some jumps up and down, which are related to the batch size set during stochastic gradient descent. When the batch size was very small, there would be a large degree of instability. If the batch size was set larger, it would be relatively stable.
The UNet-Attention algorithm built a model on a fully connected convolutional layer, which only needed a small amount of training image data to get accurate segmentation. The computing speed of a computer would be slow to process the target with sizes and shapes in big differences. Moreover, the prediction result of the UNet-Attention model was not very satisfactory in treating a sow with patterns on its back.
In the literature on pig image segmentation, some authors have proposed an interactive image segmentation method based on improved graph cuts aiming at a specific target pig [49]. To segment pig images in a complex background, an image segmentation algorithm based on wavelet modulus maximum and edge growth has been proposed, but the algorithm processing process is relatively cumbersome [50]. The traditional detection algorithms of Haar + AdBoost and HOG + SVM only had the accuracy of 65.8 and 37.3, respectively [51]. The deep learning methods have achieved higher accuracy compared with traditional ones. A study proposed the use of infrared thermal imaging cameras to fuse infrared optical images to improve the effect of pig contour segmentation, with a success rate of 94% [52]. Zhang et al. (2019) proposed a real-time sow behavior detection algorithm based on deep learning (SBDA-DL), with an accuracy of 93.4% [51]. In this study, the Mask-RCNN algorithm had a high accuracy rate (96.8%) and could achieve sow contour segmentation well. The speed of Mask-RCNN was 720 ms, which could meet the requirement of real-time monitoring of sows.

3.2. Analysis of Poor Segmentation

Under the interference of railings, debris, and drinking troughs in the pig house, the segmentation effect of Mask-RCNN was good, as shown in Figure 8. It could realize image segmentation of sows in a complex pig pen, and the shape and position of sows in the pen could be further identified.
However, the segmentation effect of the UNet-Attention model was poor. As shown in Figure 11, the markings on the sow affected the segmentation performance (Figure 11a,c), and the railing, as well as the drinking trough in the pen (Figure 11b,c), would be incorrectly segmented as a sow target.
The UNet-Attention model is a classic network, which has a large number of applications in image segmentation tasks. However, the same network structure may show different performances in different scenarios. Increasing the network layers may improve the segmentation performance to specifically satisfy the segmentation of sows.

3.3. Image Recognition of Sow Behaviors and Positions

The activity behavior and location of the sow in the pen is an indicator to evaluate the animal’s living conditions. In this study, the image segmentation algorithm was used to determine the position and contour of the sow’s head, and then to determine the behavior of the sow. If the head of the sow was in the drinking and feeding area, it could be determined that the sow was drinking or feeding. The change in the pixel area of the contour of the sow could determine whether the sow was standing or lying down.
There were fixed areas for different behaviors of sows in group housing [42]. As shown in Figure 12, the sows are feeding and drinking at the pen trough, and the sows’ heads were in the blue box, which represented the feeding and drinking area. When the sow’s head was detected in the blue box, it could be judged as feeding or drinking behavior. As mentioned in the section on materials and methods, when the time was from 10:00–10:30 every morning, it was judged to be the feeding behavior of the sow. On the contrary, at other times of the day, it was judged as drinking behaviors.
The green box in Figure 12 is the lying and activity area of the sow pen. The lying and standing behaviors were distinguished based on the size of the image segmentation area. In addition, binary grayscale image of sows with different behaviors and positions (Figure 13). The pixel area value of the standing behavior was {2214–2641}, and the pixel value area range of lying behavior was {3025–3299}, therefore, for the data collected in this study, when the pixel value area of the segmented image of the sow was less than 3025, it was judged as a standing behavior. Meanwhile, a lying sow had a pixel value greater than 3025. However, the above data was based on a small amount of data, and there would also be the influence of individual body size differences, so this method was suitable for samples of sows of similar body size and weight.
Analyzing the active and resting behaviors of the sow after weaning could effectively get the physiological status of the sow. As shown in Figure 14, a sow is randomly selected, and within 24 h, the percentage of time spent on different behaviors has been analyzed. The circle inscribed in the blue rectangle, numbered 1 in the picture is the sow resting state in the lying area, and the time is more concentrated after the lights are turned off at night. Number 2 is that the sow stands in the active area, and the time is concentrated in the daytime. Numbers 3 and 4 are sows standing in the feeding and drinking area. Since the daily feeding time is a fixed 30 min, the sow’s feeding time is from 10:00–10:30, numbered as 4. The rest time is the proportion of the sow’s drinking behavior, numbered as 3. This analysis could effectively figure out the sow’s daily activity and rest patterns within 24 h.
Table 4 shows the lying, standing, drinking and feeding time of 6 sows within 24 h. The average lying, standing, and drinking time of sows was 12.67 h, 11.33 h, and 3.25 h, respectively. Figure 15 shows the cumulative timetable of different behaviors of six sows in 24 h. The average time spent on lying down for sows in 24 h accounted for 52.8%, while the percentage of standing time was 47.2%. Due to the noise caused by the staff working in the house during the daytime, the sows spent much time standing. However, when the barn became quiet, sows were more likely to lie down and rest.
Figure 15 and Figure 16 show the proportion of time spent by sows in the lying behavior within 24 h. During the period from 21:00 to 7:00, there was no light in the pig house. The sows rested intensively, so the lying time accounted for a relatively high proportion, and the average hourly proportion of lying behavior accounts for 97.53%. The house was quiet from 14:00 to 16:00. The sows were mostly lying down and resting. The average hourly proportion of lying was 84.7% from 14:00 to 16:00. In Figure 17, sows mainly lied down and rested from 20:00 to 6: 00 the next morning, so the average drinking time was 0. From 7:00 to 11:00 and from 15:00 to 19:00, the proportion of drinking water increased, and the average hourly drinking behavior accounted for 43.73%.

3.4. Application of the Sow Target Detection Model and Its Perspectives

With the development of livestock husbandry, precision livestock farming technology becomes more and more popular. In Europe, there are relevant policy requirements for the identification and traceability of farm animals, which mainly involved stress and welfare [53]. In particular, the technology has brought a lot of conveniences, greatly reduced the amount of labor and workload, improved production efficiency, and laid the foundation for large-scale operations. As mentioned in this article, sow behavior can be judged through image segmentation and further analyzing the sow’s drinking, lying and standing time. At the same time, comprehensively judge the physiological state of the sow. In recent years, the Internet of Things (IoT) has also been widely applied in the precision farming process. Livestock production can be remotely monitored and controlled in real-time, which greatly improves production efficiency [54,55,56,57]. It is of great significance to apply the sow recognition algorithm to efficiently and accurately identify the physiological behaviors of the sow. The algorithm proposed in this paper is part of the follow-up precision sow perception system, which will be later deployed together with IoT technology for production evaluation and decision-making.
Meanwhile, the model should have a high accuracy rate, and portable controllers embedded in the algorithms can be optimized to adapt to various complex pig house environments. As shown in Figure 18, in the follow up study, a real-time monitoring system will be developed. The Mask-RCNN algorithm will be firstly used to segment the image of sows, and the sow’s position and shape will be obtained after segmentation. After that, the sow’s behavior recognition will be performed, and finally, precision control of the micro-environment and management in the barn will be conducted to better raise the sows.

4. Conclusions

An approach for sow target detection based on deep learning for complex pig house environments has been proposed. A data acquisition system with two types of algorithms of UNet-Attention and Mask-RCNN was established. It has been found that Mask-RCNN had a better recognition rate, completeness, and faster running speed in analyzing the sow image dataset compared with UNet-Attention. The shape and position of sows in a pen can be detected through the segmentation, and the sow’s behavior of eating, drinking and lying can also be identified. In the follow-up study, the network layer structure of the model will be optimized to achieve a better recognition effect. The Mask-RCNN algorithm will be further investigated for real-time monitoring of sows in large scale production.

Author Contributions

Data curation, K.L., C.Z.; Formal analysis, K.L., C.Z.; Investigation, K.L., C.Z.; Methodology, K.L., C.Z., X.D., S.P., P.Z., H.W. and T.Y.; Project administration, G.T. and C.Z.; Software, K.L., C.Z., T.Y.; Supervision, G.T. and C.Z.; Writing—original draft, K.L., C.Z.; Writing—review & editing, K.L., C.Z., X.D., G.T. and S.P. All authors have read and agreed to the published version of the manuscript.

Funding

This research was funded by the National Key Research and Development Program of China (grant number: 2016YFD0700204), Research on the Technology of Creating Comfortable Environment in Pig House (YF202103), and Chongqing Technology Innovation and Application Development Project (grant number: cstc2019jscx-gksbX0093).

Institutional Review Board Statement

All sows were managed by trained staff under standard guidelines, Chongqing, China. The study proposal was approved by The Laboratory Animal Ethical Committee of China Agricultural University (AW41211202-5-1).

Informed Consent Statement

Informed consent was obtained from all subjects involved in the study.

Data Availability Statement

The data presented in this study are available from the corresponding author on reasonable request.

Conflicts of Interest

The authors declare no conflict of interest.

References

  1. Hoy, S. Precision pig farming. Innovative Technologies and decision models for pig farming. Tierärztl. Prax. Ausg. Grosstiere/Nutztiere 2009, 37, 184. [Google Scholar]
  2. Peltoniemi, O.; Oliviero, C.; Yun, J.; Grahofer, A.; Björkman, S. Management practices to optimize the parturition process in the hyperprolific sow. J. Anim. Sci. 2020, 98, S96–S106. [Google Scholar] [CrossRef]
  3. Kashiha, M.; Bahr, C.; Haredasht, S.A.; Ott, S.; Moons, C.P.; Niewold, T.A.; Ödberg, F.O.; Berckmans, D. The automatic monitoring of pigs water use by cameras. Comput. Electron. Agric. 2013, 90, 164–169. [Google Scholar] [CrossRef]
  4. Lao, F.; Brown-Brandl, T.; Stinn, J.P.; Liu, K.; Teng, G.; Xin, H. Automatic recognition of lactating sow behaviors through depth image processing. Comput. Electron. Agric. 2016, 125, 56–62. [Google Scholar] [CrossRef] [Green Version]
  5. Weng, R.-C. Variations in the body surface temperature of sows during the post weaning period and its relation to subsequent reproductive performance. Asian-Australas. J. Anim. Sci. 2020, 33, 1138–1147. [Google Scholar] [CrossRef]
  6. Lopes, T.P.; Padilla, L.; Bolarin, A.; Rodriguez-Martinez, H.; Roca, J. Ovarian follicle growth during lactation determines the reproductive performance of weaned sows. Animals 2020, 10, 1012. [Google Scholar] [CrossRef] [PubMed]
  7. Iida, R.; Pineiro, C.; Koketsu, Y. Removal of sows in Spanish breeding herds due to lameness: Incidence, related factors and reproductive performance of removed sows. Prev. Veter.-Med. 2020, 179, 105002. [Google Scholar] [CrossRef] [PubMed]
  8. Hwang, J.; Yoe, H. Study of the Ubiquitous Hog Farm System Using Wireless Sensor Networks for Environmental Monitoring and Facilities Control. Sensors 2010, 10, 10752–10777. [Google Scholar] [CrossRef] [PubMed]
  9. Thongkhuy, S.; Chuaychu, S.B.; Burarnrak, P.; Ruangjoy, P.; Juthamanee, P.; Nuntapaitoon, M.; Tummaruk, P. Effect of backfat thickness during late gestation on farrowing duration, piglet birth weight, colostrum yield, milk yield and reproductive performance of sows. Livest. Sci. 2020, 234, 103983. [Google Scholar] [CrossRef]
  10. Chen, C.; Zhu, W.; Steibel, J.; Siegford, J.; Han, J.; Norton, T. Recognition of feeding behavior of pigs and determination of feeding time of each pig by a video-based deep learning method. Comput. Electron. Agri. 2020, 176, 105642. [Google Scholar] [CrossRef]
  11. Ott, S.; Moons, C.P.H.; Kashiha, M.A.; Bahr, C.; Tuyttens, F.A.M.; Berckmans, D.; Niewold, T.A. Automated video analysis of pig activity at pen level highly correlates to human observations of behavioral activities. Livest. Sci. 2014, 160, 132–137. [Google Scholar] [CrossRef]
  12. Riekert, M.; Klein, A.; Adrion, F.; Hoffmann, C.; Gallmann, E. Automatically detecting pig position and posture by 2D camera imaging and deep learning. Comput. Electron. Agric. 2020, 174, 105391. [Google Scholar] [CrossRef]
  13. Marsot, M.; Mei, J.; Shan, X.; Ye, L.; Feng, P.; Yan, X.; Li, C.; Zhao, Y. An adaptive pig face recognition approach using Convolutional Neural Networks. Comput. Electron. Agric. 2020, 173, 105386. [Google Scholar] [CrossRef]
  14. Zhuang, X.; Zhang, T. Detection of sick broilers by digital image processing and deep learning. Biosyst. Eng. 2019, 179, 106–116. [Google Scholar] [CrossRef]
  15. Xiao, Y.; Tian, Z.; Yu, J.; Zhang, Y.; Liu, S.; Du, S.; Lan, X. A review of object detection based on deep learning. Multimed. Tools Appl. 2020, 79, 23729–23791. [Google Scholar] [CrossRef]
  16. Hossain, S.; Lee, D.-J. Deep learning-based real-time multiple-object detection and tracking from aerial imagery via a flying robot with gpu-based embedded devices. Sensors 2019, 19, 3371. [Google Scholar] [CrossRef] [PubMed] [Green Version]
  17. Tang, C.; Ling, Y.; Yang, X.; Jin, W.; Zheng, C. Multi-view object detection based on deep learning. Appl. Sci. 2018, 8, 1423. [Google Scholar] [CrossRef] [Green Version]
  18. Algarni, A.D. Efficient object detection and classification of heat emitting objects from infrared images based on deep learning. Multimed. Tools Appl. 2020, 79, 13403–13426. [Google Scholar] [CrossRef]
  19. Lu, S.; Wang, B.; Wang, H.; Chen, L.; Linjian, M.; Zhang, X. A real-time object detection algorithm for video. Comput. Electr. Eng. 2019, 77, 398–408. [Google Scholar] [CrossRef]
  20. Aziz, L.; Salam, S.B.H.; Sheikh, U.U.; Ayub, S. Exploring deep learning-based architecture, strategies, applications and current trends in generic object detection: A comprehensive review. IEEE Access 2020, 8, 170461–170495. [Google Scholar] [CrossRef]
  21. Bamne, B.; Shrivastava, N.; Parashar, L.; Singh, U. Transfer learning-based Object Detection by using Convolutional Neural Networks. In Proceedings of the 2020 International Conference on Electronics and Sustainable Communication Systems (ICESC), Coimbatore, India, 2–4 July 2020; pp. 328–332. [Google Scholar]
  22. Yann, L.C.; Bengio, Y.; Hinton, G. Deep learning. Nature 2015, 521, 436–444. [Google Scholar]
  23. Guo, Y.; Liu, Y.; Oerlemans, A.; Lao, S.; Wu, S.; Lew, M.S. Deep learning for visual understanding: A review. Neurocomputing 2016, 187, 27–48. [Google Scholar] [CrossRef]
  24. Ren, S.; He, K.; Girshick, R.; Sun, J. Faster R-CNN: Towards real-time object detection with region proposal networks. IEEE Trans. Pattern Anal. Mach. Intell. 2017, 39, 1137–1149. [Google Scholar] [CrossRef] [Green Version]
  25. Poursaberi, A.; Bahr, C.; Pluk, A.; Van Nuffel, A.; Berckmans, D. Real-time automatic lameness detection based on back posture extraction in dairy cattle: Shape analysis of cow with image processing techniques. Comput. Electron. Agric. 2010, 74, 110–119. [Google Scholar] [CrossRef]
  26. Salau, J.; Haas, J.H.; Junge, W.; Thaller, G. Automated calculation of udder depth and rear leg angle in Holstein-Friesian cows using a multi-Kinect cow scanning system. Biosyst. Eng. 2017, 160, 154–169. [Google Scholar] [CrossRef]
  27. Traffano-Schiffo, M.V.; Castro-Giraldez, M.; Colom, R.J.; Fito, P.J. Development of a spectrophotometric system to detect white striping physiopathy in whole chicken carcasses. Sensors 2017, 17, 1024. [Google Scholar] [CrossRef] [PubMed] [Green Version]
  28. Girshick, R.; Donahue, J.; Darrell, T.; Malik, J. Region-based convolutional networks for accurate object detection and segmentation. IEEE Trans. Pattern Anal. Mach. Intell. 2015, 38, 142–158. [Google Scholar] [CrossRef]
  29. Nasirahmadi, A.; Sturm, B.; Edwards, S.; Jeppsson, K.-H.; Olsson, A.-C.; Müller, S.; Hensel, O. Deep learning and machine vision approaches for posture detection of individual pigs. Sensors 2019, 19, 3738. [Google Scholar] [CrossRef] [PubMed] [Green Version]
  30. Zhang, L.; Gray, H.; Ye, X.; Collins, L.; Allinson, N. Automatic individual pig detection and tracking in pig farms. Sensors 2019, 19, 1188. [Google Scholar] [CrossRef] [Green Version]
  31. Kim, J.; Chung, Y.; Choi, Y.; Sa, J.; Kim, H.; Chung, Y.; Park, D.; Kim, H. Depth-based detection of standing-pigs in moving noise environments. Sensors 2017, 17, 2757. [Google Scholar] [CrossRef] [Green Version]
  32. Han, S.; Zhang, J.; Zhu, M.; Wu, J.; Kong, F. Review of automatic detection of pig behaviors by using image analysis. IOP Conf. Ser. Earth Environ. Sci. 2017, 69, 012096. [Google Scholar] [CrossRef]
  33. Gangsei, L.E.; Kongsro, J. Automatic segmentation of Computed Tomography (CT) images of domestic pig skeleton using a 3D expansion of Dijkstra’s algorithm. Comput. Electron. Agric. 2016, 121, 191–194. [Google Scholar] [CrossRef]
  34. Guo, Y.-Z.; Zhu, W.-X.; Jiao, P.-P.; Ma, C.-H.; Yang, J.-J. Multi-object extraction from topview group-housed pig images based on adaptive partitioning and multilevel thresholding segmentation. Biosyst. Eng. 2015, 135, 54–60. [Google Scholar] [CrossRef]
  35. Hansen, M.F.; Smith, M.L.; Smith, L.N.; Salter, M.G.; Baxter, E.; Farish, M.; Grieve, B. Towards on-farm pig face recognition using convolutional neural networks. Comput. Ind. 2018, 98, 145–152. [Google Scholar] [CrossRef]
  36. Hu, J.-Y.; Shi, C.-J.R.; Zhang, J.-S. Saliency-based YOLO for single target detection. Knowl. Inf. Syst. 2021, 63, 717–732. [Google Scholar] [CrossRef]
  37. Oktay, O.; Schlemper, J.; Folgoc, L.L.; Lee, M.; Heinrich, M.; Misawa, K.; Rueckert, D. Attention u-net learning where to look for the pancreas. arXiv 2018, arXiv:1804.03999. [Google Scholar]
  38. He, K.; Gkioxari, G.; Dollár, P.; Girshick, R. Mask R-CNN. arXiv 2018, arXiv:1703.06870v3. [Google Scholar]
  39. Tu, S.; Liu, H.; Li, J.; Huang, J.; Li, B.; Pang, J.; Xue, Y. Instance Segmentation Based on Mask Scoring R-CNN for Group-housed Pigs. Presented at the 2020 International Conference on Computer Engineering and Application (ICCEA); Institute of Electrical and Electronics Engineers (IEEE), Piscataway Township, NJ, USA, 18–20 March 2020; pp. 458–462. [Google Scholar]
  40. Lowe, D.G. Distinctive image features from scale-invariant keypoints. Int. J. Comput. Vis. 2004, 60, 91–110. [Google Scholar] [CrossRef]
  41. Lin, T.Y.; Goyal, P.; Girshick, R.; He, K.; Dollár, P. Focal Loss for Dense Object Detection. arXiv 2018, arXiv:1708.02002. [Google Scholar]
  42. Simonsen, H.B. Behavior and distribution of fattening pigs in the multi-activity pen. Appl. Anim. Behav. Sci. 1990, 27, 311–324. [Google Scholar] [CrossRef]
  43. Wang, Z.; Bovik, A.C.; Sheikh, H.R.; Simoncelli, E.P. Image quality assessment: From error visibility to structural similarity. IEEE Trans. Image Process. 2004, 13, 600–612. [Google Scholar] [CrossRef] [PubMed] [Green Version]
  44. Porto, S.M.C.; Arcidiacono, C.; Anguzza, U.; Cascone, G. A computer vision-based system for the automatic detection of lying behavior of dairy cows in free-stall barns. Biosyst. Eng. 2013, 115, 184–194. [Google Scholar] [CrossRef]
  45. Viazzi, S.; Bahr, C.; Van Hertem, T.; Schlageter-Tello, A.; Romanini, C.; Halachmi, I.; Lokhorst, C.; Berckmans, D. Comparison of a three-dimensional and two-dimensional camera system for automated measurement of back posture in dairy cows. Comput. Electron. Agric. 2014, 100, 139–147. [Google Scholar] [CrossRef]
  46. Wang, X.; Xiao, T.; Jiang, Y.; Shao, S.; Sun, J.; Shen, C. Repulsion Loss: Detecting Pedestrians in a Crowd. arXiv 2018, arXiv:1711.07752. [Google Scholar]
  47. Zhang, S.; Wen, L.; Bian, X.; Lei, Z.; Li, S.Z. Occlusion-Aware R-CNN: Detecting Pedestrians in a Crowd. In Proceedings of the Transactions on Petri Nets and Other Models of Concurrency XV, Munich, Germany, 8–14 September 2018; pp. 657–674. [Google Scholar]
  48. Lin, T.; Dollár, P.; Girshick, R.B.; He, K.; Hariharan, B.; Belongie, S. Feature Pyramid Networks for Object Detection. In Proceedings of the IEEE Conference on Computer Vision and Pattern Recognition, Honolulu, HI, USA, 21–26 July 2017. [Google Scholar]
  49. Sun, L.; Li, Y.; Zou, Y. Pig image segmentation method based on improved Graph Cut algorithm. Nongye Gongcheng Xuebao/Trans. Chin. Soc. Agric. Eng. 2017, 33, 196–202. [Google Scholar]
  50. Yang, L.; Zhu, W.X. Image segmentation of pig using wavelet modulus and edge growth. Appl. Mech. Mater. 2014, 687–691, 3695–3698. [Google Scholar] [CrossRef]
  51. Zhang, Y.; Cai, J.; Xiao, D.; Li, Z.; Xiong, B. Real-time sow behavior detection based on deep learning. Comput. Electron. Agric. 2019, 163, 104884. [Google Scholar] [CrossRef]
  52. Liu, B.; Zhu, W.; Ji, B.; Ma, C. Automatic registration of IR and optical pig images based on contour match of radial line feature points. Trans. Chin. Soc. Agric. Eng. 2013, 29, 153–160. [Google Scholar]
  53. Carillo, F.; Abeni, F. An Estimate of the Effects from Precision Livestock Farming on a Productivity Index at Farm Level. Some Evidences from a Dairy Farms’ Sample of Lombardy. Animals 2020, 10, 1781. [Google Scholar] [CrossRef]
  54. Nasirahmadi, A.; Sturm, B.; Olsson, A.-C.; Jeppsson, K.-H.; Müller, S.; Edwards, S.; Hensel, O. Automatic scoring of lateral and sternal lying posture in grouped pigs using image processing and Support Vector Machine. Comput. Electron. Agric. 2019, 156, 475–481. [Google Scholar] [CrossRef]
  55. Ammendrup, S.; Füssel, A.E. Legislative requirements for the identification and traceability of farm animals within the European Union. Rev. Sci. Tech. 2001, 20, 437–444. [Google Scholar] [CrossRef] [PubMed] [Green Version]
  56. Zamora-Izquierdo, M.A.; Santa, J.; Martínez, J.A.; Martínez, V.; Skarmeta, A.F. Smart farming IoT platform based on edge and cloud computing. Biosyst. Eng. 2019, 177, 4–17. [Google Scholar] [CrossRef]
  57. Banhazi, T.M.; Lehr, H.; Black, J.L.; Crabtree, H.; Schofield, P.; Tscharke, M.; Berckmans, D. Berckmans precision livestock farming: An international review of scientific and commercial aspects. Int. J. Agric. Boil. Eng. 2012, 5, 1–9. [Google Scholar]
Figure 1. Data acquisition platform.
Agriculture 12 00073 g001
Figure 2. Block diagram of the Unet-Attention segmentation model.
Agriculture 12 00073 g002
Figure 3. The proposed AG Attention Block.
Agriculture 12 00073 g003
Figure 4. Mask-RCNN overall flow chart.
Agriculture 12 00073 g004
Figure 5. Characteristics of ROI Align.
Agriculture 12 00073 g005
Figure 6. A schematic diagram of sows in the pen. Note: In order to ensure that each sow has a larger living space, three sows could be accommodated in the real pen at a time. In order to better illustrate the current situation, there are six sows drawn in this schematic diagram.
Agriculture 12 00073 g006
Figure 7. Block diagram of calculating pixel value in LabVIEW.
Agriculture 12 00073 g007
Figure 8. Target detection of Mask-RCNN: (a) without adhesion; (b,c) with adhesion. The green outline is the segmentation outcome.
Agriculture 12 00073 g008
Figure 9. The target detection using UNet-Attention model, (a) without adhesion; (b,c) with adhesion. The pink outline is the segmentation outcome. The (df) are the processing binary diagrams of (ac), respectively.
Agriculture 12 00073 g009
Figure 10. Performance index of the Mask-RCNN model algorithm. (Note: Loss is the total loss function of the model; loss-classifier and loss-box-reg are the rpn classification error; loss-mask is the segmentation error; loss-objectness and loss-rpn-box-reg are the model’s detection error).
Agriculture 12 00073 g010
Figure 11. Performance effect of the UNet-Attention algorithm.
Agriculture 12 00073 g011
Figure 12. Image segmentation of sows with behaviors and different areas (The blue box: drinking and feeding areas; The green box: activity and lying areas).
Agriculture 12 00073 g012
Figure 13. Binary grayscale image of sows with different behaviors and positions.
Agriculture 12 00073 g013
Figure 14. The proportion time of different sow behaviors in 24 h (1, lying down; 2, standing sows in the active area; 3, standing sows in the feeding and drinking area, and drinking water; 4 the sow being eats in the drinking and feeding area).
Agriculture 12 00073 g014
Figure 15. The distribution of time spent on lying, standing, feeding and drinking within 24 h.
Agriculture 12 00073 g015
Figure 16. Percentage of lying time in 24 h.
Agriculture 12 00073 g016
Figure 17. Percentage of drinking time in 24 h.
Agriculture 12 00073 g017
Figure 18. PLF (Precision Livestock Farming) of sow information perception diagram.
Agriculture 12 00073 g018
Table 1. The Average Precision (AP) rates of Mask-RCNN and UNet-Attention.
ModelAPIoUAreamaxDets
Mask-RCNN0.7720.50:0.95all100
0.9680.50all100
0.9480.75all100
0.0000.50:0.95small100
0.0830.50:0.95medium100
0.7920.50:0.95large100
UNet-Attention0.0100.50:0.95all100
0.0250.50all100
0.0060.75all100
0.0000.50:0.95small100
0.0000.50:0.95medium100
0.0460.50:0.95large100
0.0100.50:0.95all100
Table 2. The Average Recall (AR) rates of Mask-RCNN and UNet-Attention.
ModelARIoUAreamaxDets
Mask-RCNN0.2910.50:0.95all1
0.8020.50:0.95all10
0.8020.50:0.95all100
0.0000.50:0.95small100
0.1350.50:0.95medium100
0.8230.50:0.95large100
UNet-Attention0.0040.50:0.95all1
0.0300.50:0.95all1
0.1670.50:0.95all5
0.0000.50:0.95small100
0.0000.50:0.95medium100
0.1760.50:0.95large100
Table 3. Mask -RCNN performance Indicators.
TaskAPAP50AP75APsmallAPmediumAPlarge
Bbox0.65860.96680.85430.00000.10100.6751
Segm0.77200.96820.94800.00000.08260.7925
Table 4. Timetable for sows in standing, lying, feeding and drinking within 24 h.
123456Average ValueMean Square Error
Lying time/h13.51211131412.512.671.08
Standing time/h10.51213111011.511.331.08
Drinking time/h3.53.03.03.53.53.03.250.27
Feeding time/h0.50.40.50.40.250.30.3910.10
Publisher’s Note: MDPI stays neutral with regard to jurisdictional claims in published maps and institutional affiliations.

