Article

Survival of Salmonella Typhimurium, Listeria monocytogenes, and ESBL Carrying Escherichia coli in Stored Anaerobic Biogas Digestates in Relation to Different Biogas Input Materials and Storage Temperatures

Livestock Infectiology and Environmental Hygiene, Institute of Animal Science, University of Hohenheim, 70599 Stuttgart, Germany
*
Author to whom correspondence should be addressed.
Agriculture 2022, 12(1), 67; https://doi.org/10.3390/agriculture12010067
Submission received: 30 November 2021 / Revised: 2 January 2022 / Accepted: 4 January 2022 / Published: 5 January 2022
(This article belongs to the Special Issue Animal Hygiene on Farms - Realising Animal Health Prevention)

Abstract

:
Anaerobic digestates derived from agricultural mesophilic biogas plants are mainly used as organic fertilizers. However, animal derived pathogens could persist in the anaerobic digestates (ADs) posing an epidemiological risk. The present study investigated whether storage of ADs could reduce Salmonella Typhimurium, Listeria monocytogenes, and ESBL carrying Escherichia coli and whether reduction rates are dependent on temperature and substrate. Quantified bacterial suspensions were used to inoculate ADs derived from five biogas plants using different input materials to investigate the substrate dependence of the pathogen reduction. ADs were stored over six months with four different temperature profiles each representing six consecutive months, and, thus, the four seasons. Pathogen reduction during storage was shown to be strongly dependent on the temperature but also on the type of AD. This influence was higher at low temperatures. At higher temperatures (spring and summer profiles), a 5-log reduction was achieved after twelve weeks for S. Typhimurium, after twenty weeks for E. coli (ESBL) and after twenty-four weeks for L. monocytogenes in all ADs, respectively. In contrast at lower temperatures (autumn and winter profiles), a 5-log reduction was reached after twenty-four weeks for S. Typhimurium and not reached for ESBL-E. coli and L. monocytogenes. In conclusion, storing the ADs after the biogas process improves the hygienic quality and reduce the risk of introducing pathogens to the environment, but each case should be evaluated individually considering the composition of the ADs and the storage temperatures.

1. Introduction

Over the last few decades, intense livestock farming has strongly increased resulting in high amounts of manure. However, manure is known to harbor a wide range of microorganism, some of which could be pathogenic to both human and animals, or multiresistant to antimicrobials [1,2,3,4,5,6].
Many farms use manure as a co-substrate in anaerobic digesters for biogas production and the resulting anaerobic biogas digestates (ADs) are mainly used as organic fertilizers and soil conditioners. However, pathogenic bacteria could persist in ADs and application of digestates poses an epidemiological risk to animals and humans [7,8]. Maintenance or re-infection with already existing pathogens in the farms might occur if in-house input materials for the biogas plants are processed. In addition, it is common for biogas plants to use slurry and manure from different livestock farms and, thus, animal species as input material. ADs from these biogas plants pose an increased risk for the introduction of pathogens and, thus, infections into animal farms. Moreover, it is increasingly common for ADs to be used not only as fertilizers but also, in their separated form, as alternative bedding material. The direct contact of the animals with the separated ADs significantly increases the risk of infection. Possible transmission to humans could also be a problem due to potential contamination of food or groundwater as well as through aerosols. Important pathogens including Salmonella spp., Listeria monocytogenes, and Escherichia coli were intensively investigated [7,9,10,11,12]. Furthermore, substantial health problems associated with multiresistant bacteria in feces (e.g., manure, sludge, and slurry) are increasingly attracting attention [6,13,14,15]. Therefore, it is necessary to reduce the microbiological risk potential of ADs before the different application scenarios.
For this, three different options are possible, i.e., inactivation during the fermentation process within the biogas plant, pretreatment of the input material, or disinfection of the output ADs, each of which has specific advantages and disadvantages concerning its inactivation efficacy and especially its practicability. Pathogen reduction during anaerobic fermentation depends on many factors, such as fermentation temperature, fermentation time, and the initial number of bacterial species in the feedstock [6]. Temperature profiles are crucial for pathogen inactivation and several studies have reported that mesophilic temperature is able to reduce but not to fully inactivate pathogens and antibiotic resistance carrying Enterobacteriaceae [9,13,16,17]. Thermal treatment of the input material or the output ADs would be an effective option for the inactivation of pathogens, however, also associated with major technical and financial efforts by the operator. A subsequent composting of AD and, thus, sanitation is conceivable, but also associated with greater technical and logistical efforts. However, the temperature profiles used in each biogas plant are primarily optimized for biogas yield not for sanitation.
Another possible solution may be the inactivation of pathogens during storage of the AD over a defined time. Storage of organic fertilizers including ADs is one important part of the legal requirements before their application. It is well known that storage of solid and fluid manure is suitable to reduce pathogens, thus, improving the microbiological quality of organic fertilizers [2,18,19,20,21]. Moreover, storage as an inactivation option can easily be included in the agrarian daily routine. However, the efficacy of the inactivation undoubtedly depends on management and storage conditions especially the temperature profile during the storage process as well as pH value and slurry dry matter content mainly influenced by the kind and nature of the used input materials [18,19,22,23,24,25,26]. A slurry store or solid manure heap may often consist of excreta of different ages from different animal houses and pathogen inactivation in manure is likely to be longer during winter than in summer, because of lower ambient temperatures [27]. Nevertheless, storage as an inactivation option should easily be included in the agrarian daily routine.
Therefore, the aim of the present study was to evaluate the disinfection potential of the storage of ADs derived from different input materials at defined temperature conditions mimicking the four seasons. For this, survival of Salmonella enterica ssp. enterica serovar Typhimurium, Listeria monocytogenes, and ESBL carrying Escherichia coli as zoonotic pathogens was monitored over a time of six month. The results of this study provide new information on the safety success of long-term storage of AD in dependence on time, temperature, and substrate, and, therefore, the potential for routine application.

2. Materials and Methods

2.1. Anaerobic Digestate Preparation

Anaerobic digestate samples (referred to as AD-A to AD-E) were derived from five different mesophilic biogas plants from five different farms. Each biogas plant (A to E) was operated with different input materials (different portions of manure and slurry from cattle, swine, horses, and poultry as well as maize silage). The input material compositions are listed in Table 1. Before the start of the laboratory trials, ADs were kept at 4 °C until use. The AD samples were analyzed for pH and for total nitrogen and nitrogen in ammonium nitrate before and after ending the experiments at the State Office for Agricultural Chemistry, University of Hohenheim.

2.2. Pathogen Inoculum Preparation

Salmonella Typhimurium, L. monocytogenes and an ESBL-E. coli were selected as pathogens for this study. The strains S. Typhimurium and L. monocytogenes originated from digested residues derived from mesophilic biogas plants, and the used ESBL-E. coli (2081/3009) from bovine feces (diagnostic isolate). All used isolates were proved for taxonomical identity and biological characteristics using 16S rDNA sequencing and biochemical assays. The ESBL status of the E. coli isolate was proved by Agar diffusion assay and PCR. Pure cultures were grown on trypticase soy agar (TSA; Oxoid, Wesel, Germany) at 37 °C for 24 h. Bacteria were collected by washing the plates with sterile phosphate buffered saline (PBS). Bacterial counts of each suspension were determined. For this, serial dilutions (10−1 to 10−12) of each suspension were plated in duplicate on PALCAM Agar (Oxoid) for L. monocytogenes, XLT 4 Agar (Oxoid) for S. Typhimurium and Brilliance ESBL Agar (Oxoid) for ESBL-E. coli. The agar plates were incubated at 37 °C for 24 h at least before the colony forming units (cfu) were counted.

2.3. Experimental Setup

Each anaerobic digestate (n = 5, A to E) was inoculated with S. Typhimurium, L. monocytogenes and an ESBL-E. coli, respectively, and thoroughly mixed to obtain homogenous mixtures. Final concentrations of pathogens in the ADs were 1.0 × 10⁸ cfu/g for ESBL-E. coli and S. Typhimurium and 1.0 × 10⁷ cfu/g for L. monocytogenes, respectively. For each testing, three replicates were incubated.
To assess the reduction of the pathogens in the anaerobic digestates during storage the inoculated ADs were incubated under defined conditions in four temperature chambers simulating the average monthly temperature over six months. Chamber 1 simulated the period from January to June, chamber 2 from April to September, chamber 3 from July to December, and chamber 4 from October to March. Each monthly temperature was held for 30 days, then samples were taken, and the temperatures changed accordingly to the following month. The temperatures used in the climate chambers are shown in Table 2 and represent the long time monthly average temperature in Hohenheim. The data was provided by the Institute of Physics and Meteorology, University of Hohenheim. Every month, the temperatures in the chambers were changed accordingly.

2.4. Quantitative Microbiological Analyses during Storage Experiments

To indirectly quantify the pathogens in the inoculated ADs, monthly drawn samples (20 g) were suspended in 180 mL 0.9% NaCl. The NaCl suspension was serially diluted, and 1 mL of the diluted samples (10−1 to 10−9) were used to inoculate three vials of growth media: MacConkey broth (selective; Merck, Darmstadt, Germany) for ESBL-E. coli, buffered peptone water (non-selective; Merck) for S. Typhimurium, and Listeria enrichment broth (selective; Merck) for L. monocytogenes. The inoculated MacConkey broth and buffered peptone water samples were incubated at 37 °C for 24 h. Listeria enrichment broth samples were incubated at 30 °C for 48 h. After 4 h incubation, Listeria enrichment supplement was added to each sample. After 24 h, 0.1 mL from each vial of the buffered peptone water was transferred into 10 mL of Rappaport–Vassiliadis medium (Merck) and incubated for further 24 h at 37 °C.
After enrichment procedures contents of each vial was streaked in duplicate on selective agar (PALCAM Agar for L. monocytogenes, XLT 4 Agar for Salmonella Typhimurium and Brilliance ESBL Agar for ESBL-E. coli). All plates were incubated at 37 °C. Growth of E. coli and Salmonella was assessed after 24 h of incubation, and Listeria colonies were evaluated after 24 and 48 h post inoculation. Enumeration of pathogens was performed using the MPN table according to DeMan (1983).

2.5. Data Analysis

Data analysis was performed with Microsoft Excel 2019 and SAS for Windows statistical software version 9.4. A mixed model analysis was applied with the bacterial count as the dependent variable. A macro was used to plot the letters in cooperation with the Department of Biostatistics, University of Hohenheim [28,29]. Letters are indicated in the respective figures. Identical letters mean no significant differences, different letters mean significant differences between the anaerobic digestates. The value p  <  0.05 was considered significant. Means and standard deviation were calculated using Microsoft Excel 2019.

3. Results

3.1. Analysis of the Anaerobic Biogas Digestates

At the beginning and after 24 weeks of storage, the composition of the anaerobic digestate samples regarding pH, total nitrogen, and nitrogen bound in ammonium nitrate (N-NH4) was determined. The results are presented in Table 3. The initial pH in the different AD samples varied from 7.7 to 8.3 at the beginning of the experiment. In the experiments, the pH values were variable with the lowest pH of 7.4 in the anaerobic digestate AD-E (containing 60% cattle slurry/manure and horse manure and 40% maize silage) after the incubation with the temperature profile 2 conditions (spring-summer) and the highest pH of 8.8 in AD-C (60% cattle slurry and 40% mixture of horse, cattle, and poultry manure and maize silage) after incubation with either the temperature profile 1 conditions (winter-spring) or the temperature profile 4 conditions (autumn-winter). Nitrogen contents remained nearly constant during the experiments with the highest variation in the AD-A (total nitrate from 0.460% to 0.392%; N-NH4 from 0.210% to 0.196%). Statistical evaluation of the composition parameters revealed no significant differences. Therefore, these parameters were not further considered.

3.2. Survival of Salmonella Typhimurium, Listeria monocytogenes, and ESBL Carrying Escherichia coli

To investigate the influence of seasonal differences on the pathogen reduction, the four seasons were simulated in four temperature chambers in parallel. The long-term monthly mean temperature values measured at the University of Hohenheim (located in the southwest of Germany) were used to create seasonal temperature profiles that cover a six-month-storage period throughout the year. This procedure enabled recording possible influences of the storage temperature and, thus, of the season. The following periods and associated temperatures were chosen for the experiments (Table 2): profile 1: January to June (winter-spring profile), profile 2: April to September (spring-summer profile), profile 3: July to December (summer-autumn profile), and profile 4: October to March (autumn-winter profile). Two reduction thresholds were used: Threshold 1 is defined as a reduction of 4 log10 levels according to Fröschle et al., 2015 [30], threshold 2 was set as a reduction of 5 log10 levels according to the Regulation (EU) No. 142/2011.
To investigate the dependence of the reduction rates on the composition of the ADs, we inoculated ADs from five different used biogas plants operated with different input materials (Table 1). All ADs contained different proportions of maize silage as well as of slurry and manure from different animal species. All used ADs were tested negatively for the presence of naturally occurring salmonellae, Listeria, and ESBL-E. coli.

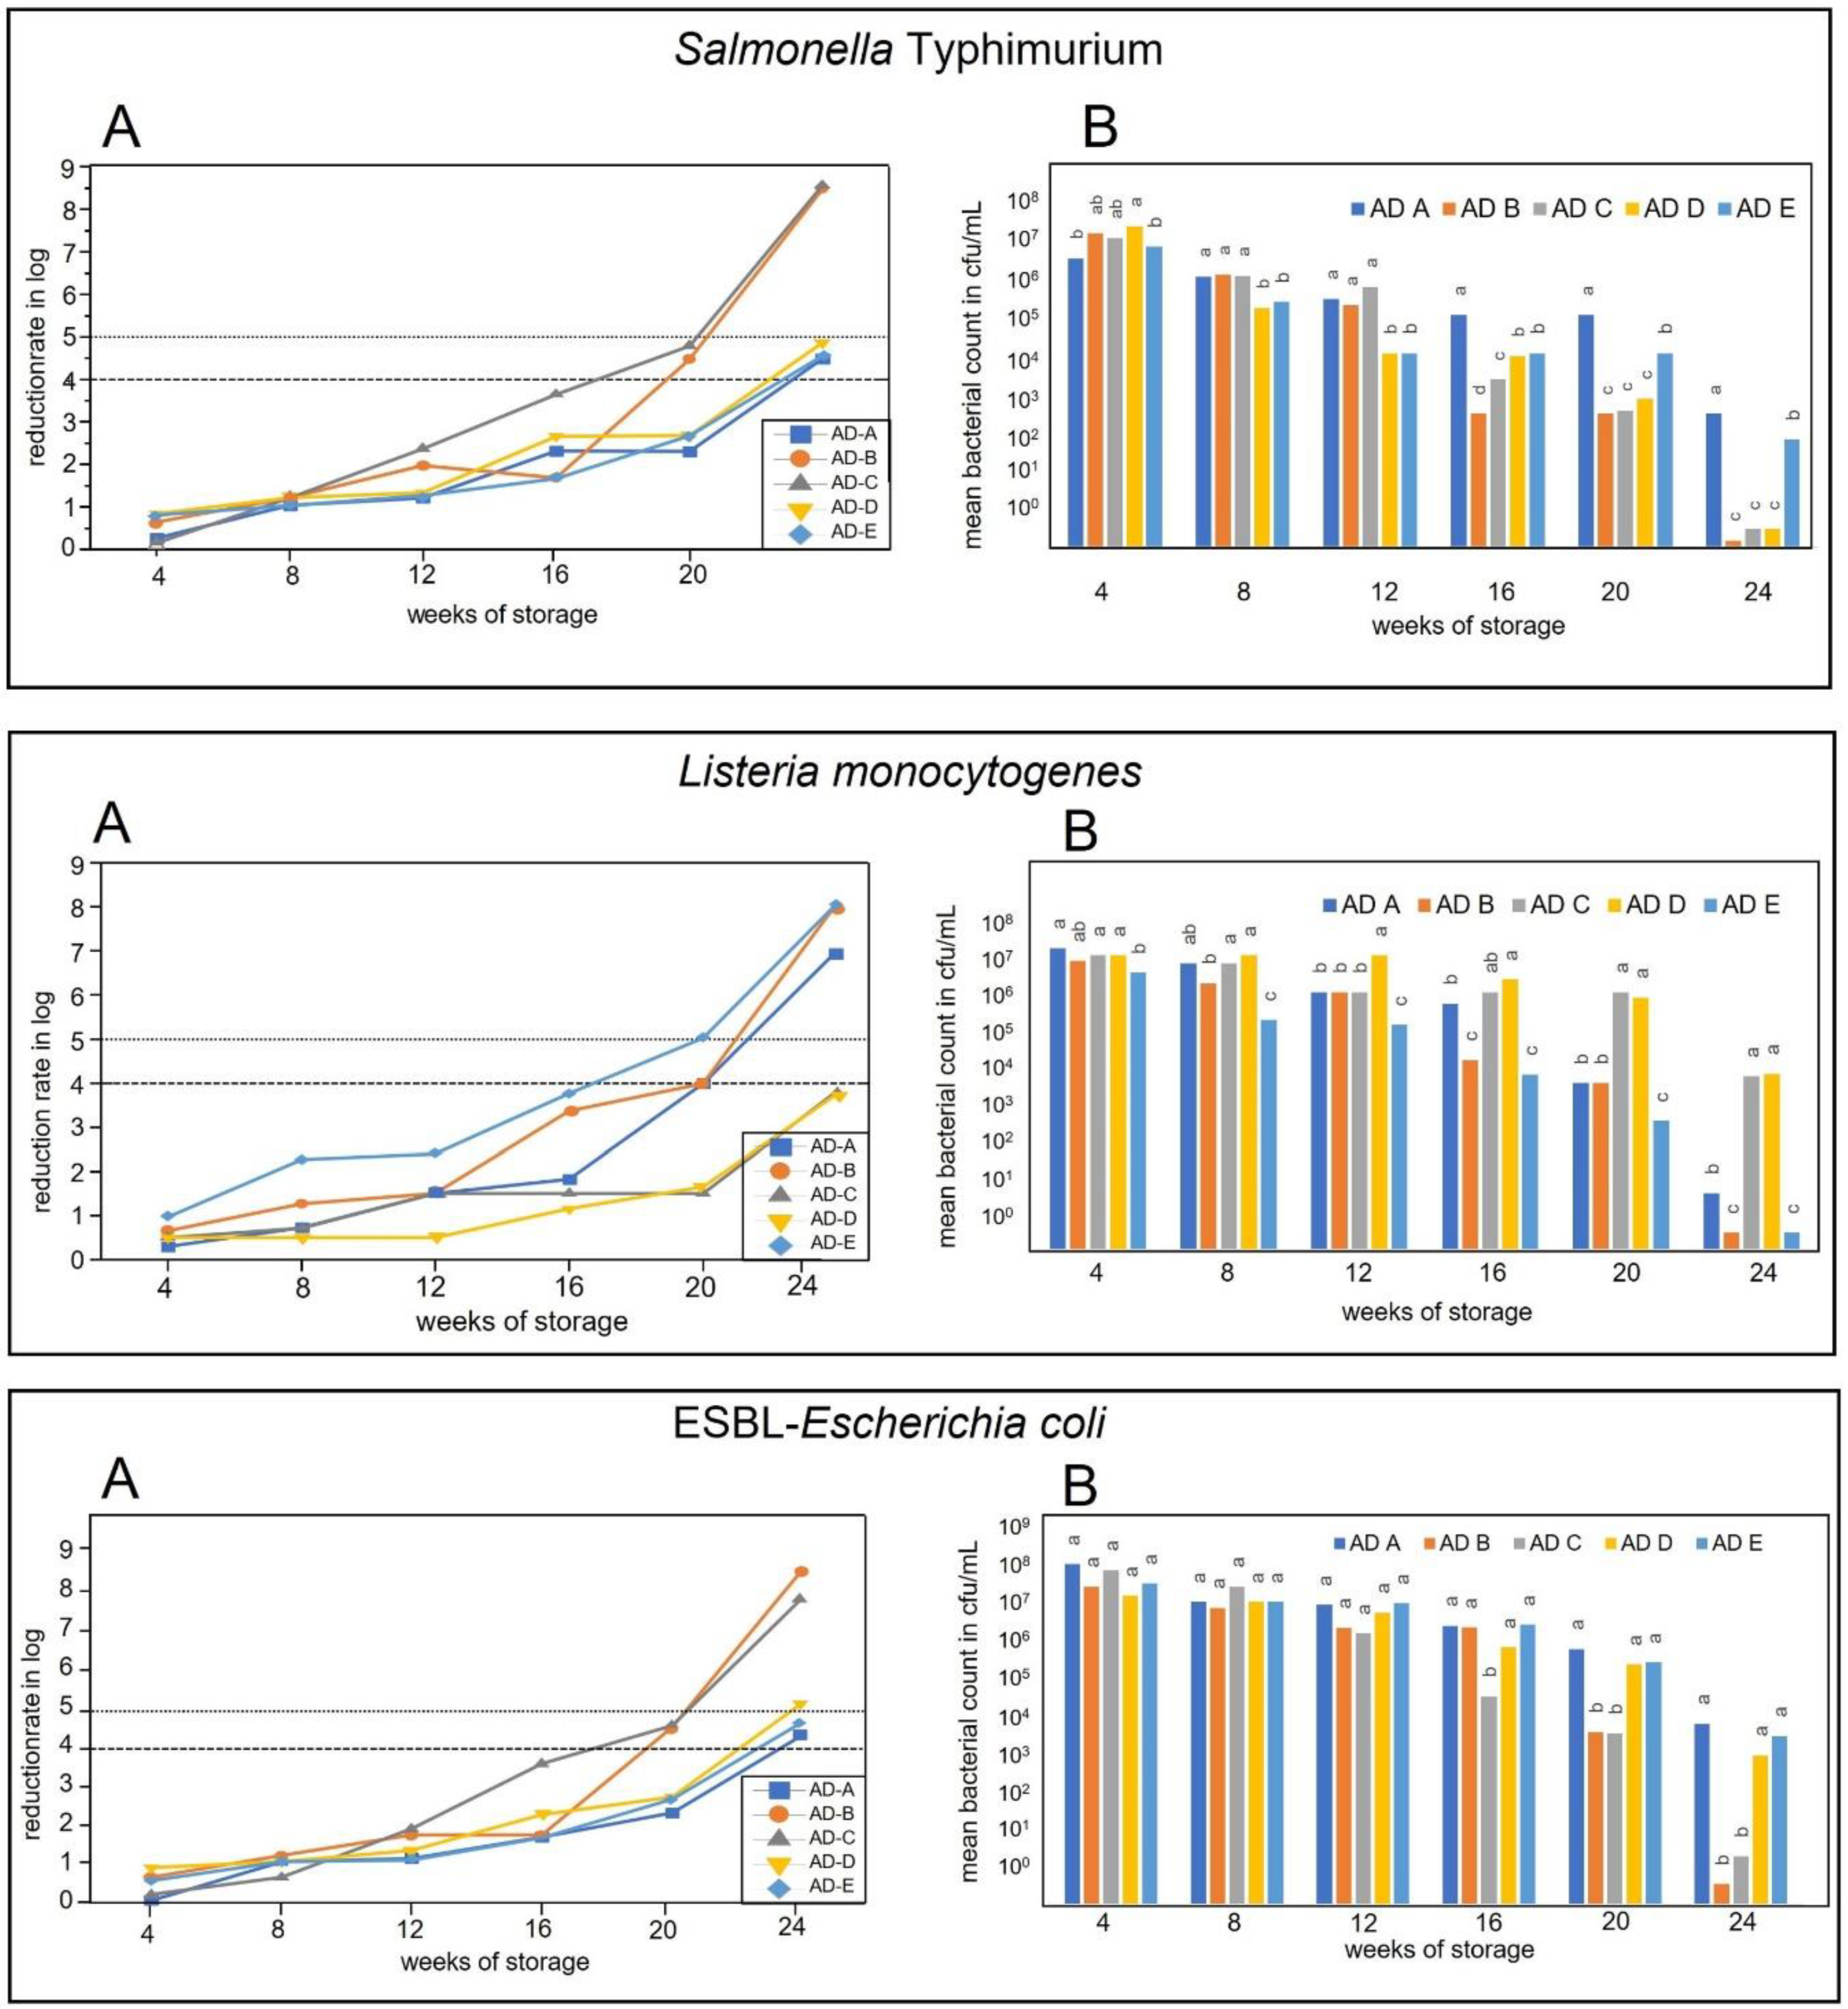
3.2.1. Inactivation during Storage in Temperature Profile 1 Conditions (January to June)

The inactivation rates in temperature profile 1 conditions (January to June, Table 2) for S. Typhimurium, L. monocytogenes, and ESBL-E. coli in the five different anaerobic biogas digestates (AD-A, AD-B, AD-C, AD-D, AD-E) are shown in Figure 1. Overall, we found significant differences in the reduction rates between the inoculated ADs for all pathogens. In addition, the storage with profile 1 temperatures resulted in significant differences between the investigated pathogens. The highest reduction rates in temperature profile 1 were observed for S. Typhimurium. The S. Typhimurium content reached the predetermined 4-log reduction limit after 12 weeks for the AD-D and AD-E, after 16 weeks p.i. for AD-B and AD-C, and after 24 weeks for AD-A. The 5-log reduction threshold was reached for all inoculated ADs after 24 weeks of storage. Storage of L. monocytogenes resulted in 4-log reduction rates only for AD-C after 20 weeks and for AD-A and AD-B after 24 weeks of storage. The L. monocytogenes content of AD-D and AD-E remained above both predetermined thresholds. For ESBL-E. coli also only moderate reduction rates were observed after 16 weeks of storage independent of the inoculated AD. The set 4-log threshold value was reached after 20 weeks for AD-B and AD-C and after 24 weeks for the remaining ADs. ESBL-E. coli contents met the 5-log limit value after 24 weeks for only three ADs (AD-B, AD-C, and AD-D). Significant differences in the reduction rates were observed during storage in the different inoculated ADs for all investigated pathogens throughout the experiments (p ≤ 0.05). Only for ESBL-E. coli, significant differences in the reduction rates in the different inoculated ADs were found only after 16 weeks for one AD, and for two ADs after 20 and 24 weeks of storage (Figure 1).

3.2.2. Inactivation during Storage in Temperature Profile 2 Conditions (April to September)

Storage under temperature profile 2 conditions also revealed several significant differences between the different pathogens and between different Ads (Figure 2). Salmonella Typhimurium reduction was higher than for L. monocytogenes and E. coli-ESBL until week 16. In detail, the content of S. Typhimurium reached the 4-log reduction threshold after 12 weeks (AD-B, AD-C, AD-D, and AD-E) or after 16 weeks (AD-A). The 5-log reduction value was reached in AD-B and AD-C also after 12 weeks, in AD-D and AD-E after 16 weeks, and only in AD-A after 20 weeks of storage. For ESBL-E. coli, the predetermined 4-log reduction value was reached after 12 weeks for two inoculated ADs (AD-B, AD-E), after 16 weeks for AD-A and AD-C, and only after 20 weeks for AD-D. The threshold of 5-log reduction was met after 12 weeks for AD-B, after 16 weeks for AD-A, AD-C, and AD-E, or after 20 weeks of storage for AD-D. Anaerobic digestates inoculated with L. monocytogenes reached both the 4-log and the 5-log reduction threshold after 16 weeks (AD-E) or after 20 weeks (AD-D) or after 24 weeks of storage (AD-A, AD-B, AD-C), respectively. Significant differences in L. monocytogenes reduction rates between the different inoculated ADs were found throughout the experiments (p ≤ 0.05; Figure 2).

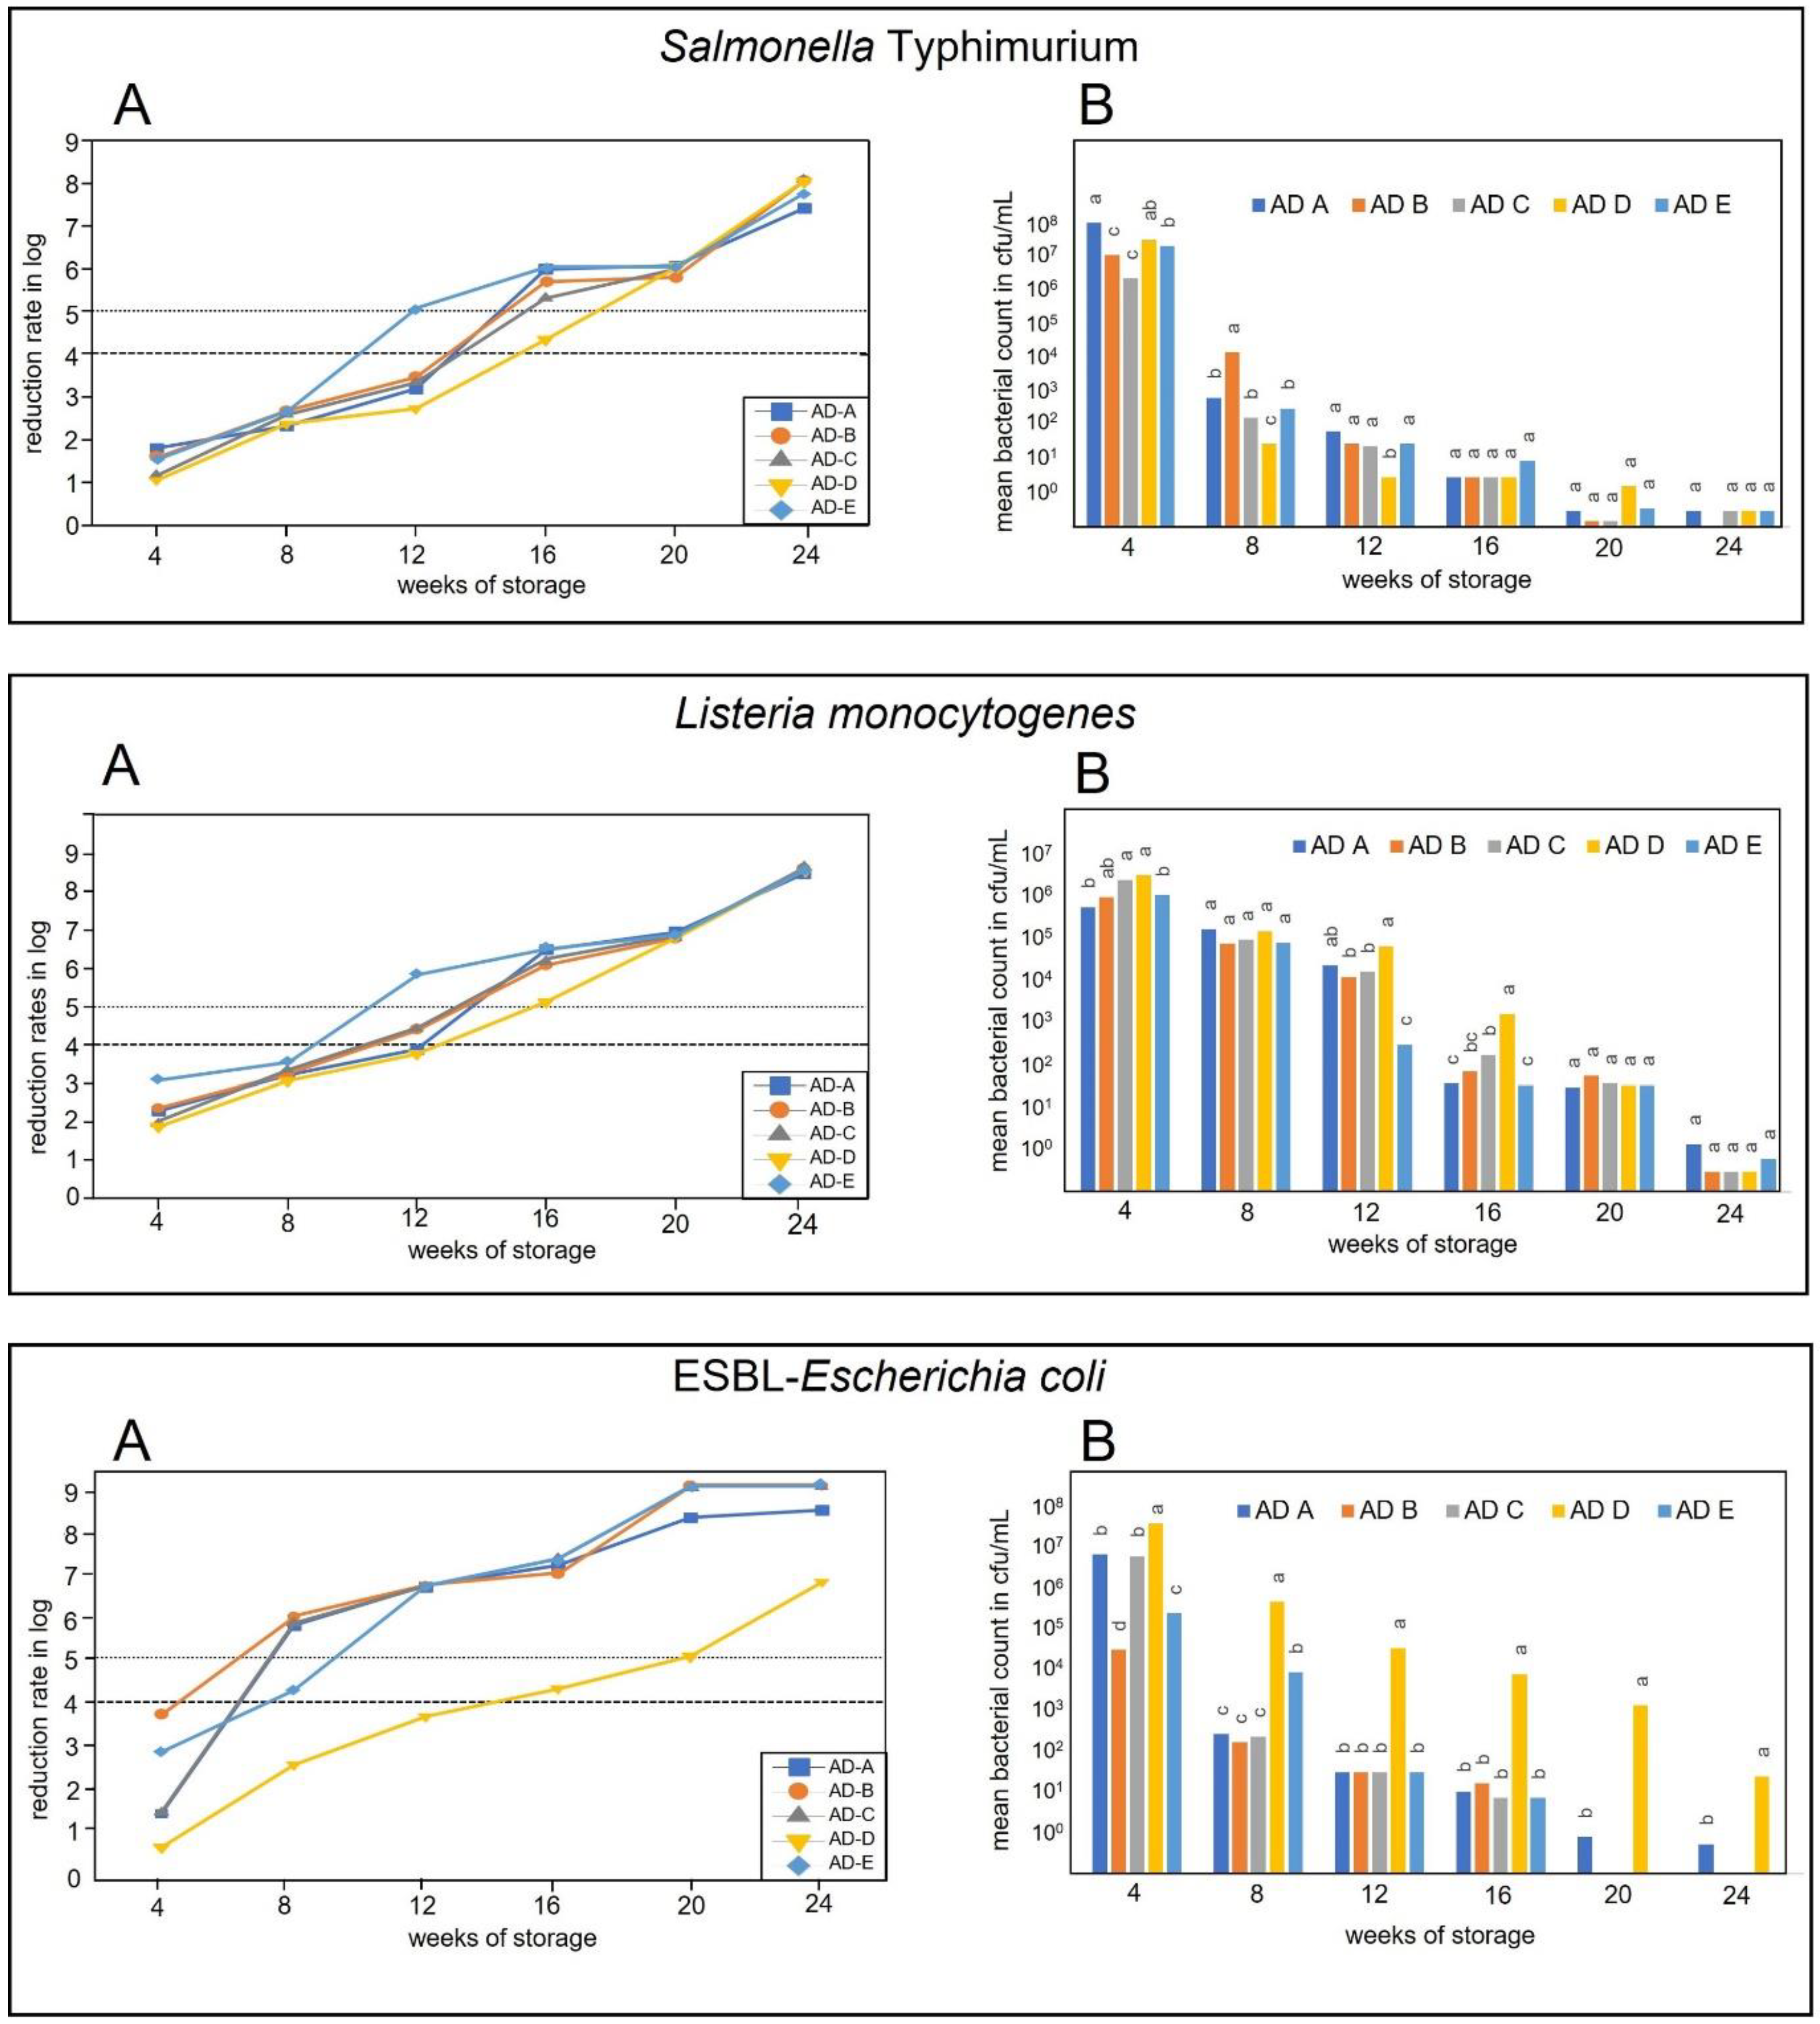
3.2.3. Inactivation during Storage in Temperature Profile 3 Conditions (July to December)

The highest reduction rates were observed during temperature profile 3 for all three pathogens (Figure 3). Again, significant differences between the different pathogens and different ADs could be observed (p ≤ 0.05; Figure 3). The S. Typhimurium content reached both predetermined limits (4-log and 5-log reduction levels) after eight weeks of storage for all ADs except for AD-B (after 12 weeks of storage). Significant differences between the different ADs were found only at analysis time point four, eight, and 12 weeks post inoculation. ESBL-E. coli contents also reached the 4-log limit after eight weeks of storage except for AD-D (after 16 weeks of storage). The 5-log limit was also met after eight weeks for AD-A, AD-B and AD-C, after 12 weeks of storage for AD-E and after 16 weeks for AD-D. Storage in AD-D resulted in significant differences of the bacterial content when compared to the other ADs during the whole experiment.

3.2.4. Inactivation during Storage in Temperature Profile 4 Conditions (October to March)

During the storage in the temperature simulating the months October to March, we observed the lowest reduction rates for all pathogens (Figure 4). For all pathogens significant differences (p ≤ 0.05; Figure 4) could be observed between the different inoculated ADs at all time points investigated except for L. monocytogenes after 12 weeks of storage. All pathogens remained detectable in all inoculated ADs until the end of the storage periods of 24 weeks. In detail, Salmonella Typhimurium was coincidently reduced to values below the 4-log as well as 5-log reduction thresholds in three inoculated ADs (AD-A, AD-B, AD-C) after 12 weeks and in AD-E after 16 weeks of storage. The 4-log reduction level in AD-D was achieved after 12 weeks and the 5-log reduction level only after 24 weeks of storage. Storage of ESBL-E. coli in AD-A and AD-E under temperature profile 4 conditions could not reduce the bacterial content ≥ 4-log ranges after 24 months. In AD-C and AD-D, ESBL-E. coli were reduced ≥5-log ranges after 20 weeks. In AD-D, the 4-log reduction level for ESBL-E. coli was reached after 20 weeks, and the 5-log reduction level after 24 weeks of storage. A similar situation was found for L. monocytogenes: Only storage in two ADs (AD-A and AD-E) fulfilled reduction rates ≥ 4-log ranges. In AD-A, both predetermined reduction limits were reached coincidently after 24 weeks. In AD-E, the reduction level of ≥4-log ranges was observed after 20 weeks and the set reduction level of ≥5-log ranges after 24 weeks. In AD-B, AD-C, and AD-D, storage under temperature profile 4 conditions did not reduce the bacterial content ≥ 4-log ranges after 24 months.

4. Discussion

Livestock animals often excrete a variety of pathogens that could persist and propagate in manure and even during the mesophilic anaerobic digestion in biogas plants [31]. One possible strategy to reduce pathogen contents in manure and manure-derived substrates and to minimize epidemiological risks could be storage of the organic materials [32,33]. Environmental factors known to influence the survival behavior of pathogens in organic materials like composts or ADs include temperature, moisture, pH, particle size, and indigenous microbiota [34,35,36]. In the present study, the survival behavior of the three zoonotic pathogens S. Typhimurium, L. monocytogenes, ESBL-E. coli was investigated in five different ADs stored in in different temperature profiles. To include a practical orientation in our study, the used temperatures were adapted to long-term monthly mean temperature values. All ADs were derived from different biogas plants, which were run with different input materials (manure from different animal species and different compositions). We observed that all inoculated ADs can principally provide long-term survival conditions for the three pathogens. For example, S. Typhimurium and ESBL-E. coli survived storage for >6 months in all inoculated ADs during the temperature profile 1 (January to June) and profile 4 (October to March) and L. monocytogenes for >6 months in all inoculated ADS during all applied temperature profiles. Other studies investigating the survival in ADs are rare. However, our findings are supported by studies investigating other animal derived organic materials. For example, Wang et al. (2017) [37] found that STEC survived for over 125 days in dairy compost stored at 4 °C and 22 °C. Another study showed that organic composts derived from dairy and poultry could provide long-term survival of E. coli and S. enterica for >168 days at 5 °C [36]. Fukushima et al. (1999) [38] found the long-term survival of Shiga toxin-producing E. coli (STEC) in dairy manure with up to 12 weeks at 25 °C, up to 18 weeks at 15 °C, and up to 14 weeks at 5 °C. In the study of Vinnerås (2007) [39], Enterococcus sp., Salmonella sp. and Clostridia sp. remained detectable in pig manure after 50 days of storage at 20 °C. Obviously, the high inoculation doses in our study are responsible for the long survival periods. However, the high levels of 107 to 108 bacteria/mL material are necessary if the maximum inactivation potential of a hygienization method is to be investigated in a comparable way. The Regulation (EU) No. 142/2011 defined a reduction of 5 log10 levels (threshold 2 in our study) for S. Senftenberg and Enterococcus faecalis in biogas plant processes for a sufficient reduction of biological risks. Other authors define a reduction of 4 log10 levels (threshold 1 in the present study) as sufficient sanitation to minimize epidemiological risks [30].
As expected, the reduction levels for all three pathogens were strongly dependent on the temperature profile. Both, threshold 1 (4 log10 reduction) and threshold 2 (5 log10 reduction) were reached fastest in temperature profile 3 (mimicking July to December), followed by temperature profile 2 (April to September). This is in accordance with other laboratory studies showing that Salmonella and/or E. coli showed higher reduction rates in organic waste, livestock waste, in manure and manured soil stored at higher temperatures [18,19,26,40,41,42,43,44,45,46].
Nevertheless, our study also clearly showed that other matrix factors contribute to the pathogen reduction because our reduction rates significantly differed in the different inoculated AD in almost all experimental approaches. Looking at the reduction rates at the last sampling time after 24 weeks, it was found for ESBL-E. coli that in AD-D (consisting of 60% turkey manure/turkey solid manure and 40% NawaRo) the reduction rates were lowest in all temperature profiles. Significant reduction rate differences between the ADs became also obvious for S. Typhimurium and L. monocytogenes after 24 weeks of storage, especially during temperature profiles 1 and 4. So, it was shown that S. Typhimurium had the lowest reduction rates in AD-A and AD-E, L. monocytogenes in AD-C and AD-D (temperature profile 1) and AD-B, AD-C and AD-D (temperature profile 4), respectively. Obviously, the substrate-dependent effects found are less pronounced at higher temperatures. A substrate dependence of the tenacity of pathogens is also described in the study of ARRUS et al. (2006) [42], in which the tenacity of Salmonella in pig slurry from different pig farms (breeding, rearing, and fattening) was investigated. Salmonella survived significantly longer in manure from breeding at 4 °C and significantly shorter at 37 °C compared to manure from other farms (rearing, fattening). These differences were attributed primarily to differences in nitrogen contents of the manure [42]. The ADs used in this study also showed differences in total nitrogen and ammonium nitrogen content, with AD-A and AD-E having the lowest nitrogen concentrations. However, since the reduction rates of the three pathogens studied were very different with respect to the ADs, the present study does not allow any general statements to be made as to whether a high ammonium content increases or decreases the tenacity of bacterial pathogens in fermentation products. Other factors potentially influencing the bacterial survival in different ADs include pH and metal concentrations [26,40,47] but also different indigenous microbial flora. Other studies reported that composts the degree of maturation influences the reduction rates of L. monocytogenes [48,49].
Interestingly, the overall reduction rates of L. monocytogenes were significantly lower than those of S. Typhimurium and ESBL-E. coli, respectively. Higher survival rates and/or longer persistence of L. monocytogenes in different animal derived wastes compared to other pathogens were also found in other studies. Nicholson et al. (2005) [20] reported that L. monocytogenes survived longer in stored slurry and wastewater than E. coli O157, S. Typhimurium and Campylobacter jejuni. The anaerobic digestion biogas process was shown to have less ability to reduce L. monocytogenes contamination [50]. In addition, longer persistence of L. monocytogenes compared to Salmonella Derby, and Campylobacter coli was also described in ADs [51]. Listeria monocytogenes is long known to be a ubiquitous opportunistic pathogen and particularly resistant to different environmental factors [11], including bacterial growth at low temperatures and in a wide pH range. In addition, L. monocytogenes is known to harbor an extensive genomic regulatory repertoire, which was assumed to be the reason for the high adaptation capacity to different environments and also the ability to adapt expression patterns to specific niches (transcriptional reshaping; [52,53].

5. Conclusions

In conclusion, considering the results obtained in our study pathogenic bacteria like L. monocytogenes, S. Typhimurium, and ESBL-E. coli do not grow but survive during storage of anaerobic digestates for certain time periods. However, the amount of the three investigated pathogens significantly decreased over the storage time. The ratio of reduction significantly depends on the storage temperatures but also on the AD composition. To circumvent epidemiological risks, every storage of ADs should be considered individually because there are no general biosafety recommendations available that could be applied to all plants and anaerobic digestates.

Author Contributions

Conceptualization, L.E.H. and W.P.; methodology, L.E.H. and T.S.; analyses and validation, T.S. and K.H.; investigation, T.S.; writing—original draft preparation, T.S. and K.H.; writing—review and editing, L.E.H.; project administration, L.E.H.; funding acquisition, W.P. and L.E.H. All authors have read and agreed to the published version of the manuscript.

Funding

This research was funded by the Fachagentur Nachwachsende Rohstoffe (FNR) a promotor of the German Federal Ministry for Food and Agriculture, grant number “22003313”.

Institutional Review Board Statement

Not applicable.

Informed Consent Statement

Not applicable.

Data Availability Statement

All data generated or analysed during this study are included in this published article.

Conflicts of Interest

The authors declare no conflict of interest.

References

  1. Sahlström, L. A review of survival of pathogenic bacteria in organic waste used in biogas plants. Bioresour. Technol. 2003, 87, 161–166. [Google Scholar] [CrossRef]
  2. Hutchison, M.L.; Walters, L.D.; Avery, S.M.; Munro, F.; Moore, A. Analyses of livestock production, waste storage, and pathogen levels and prevalences in farm manures. Appl. Environ. Microbiol. 2005, 71, 1231–1236. [Google Scholar] [CrossRef] [Green Version]
  3. Gerba, C.P.; Smith, J.E., Jr. Sources of pathogenic microorganisms and their fate during land application of wastes. J. Environ. Qual. 2005, 34, 42–48. [Google Scholar]
  4. Sidhu, J.P.; Toze, S.G. Human pathogens and their indicators in biosolids: A literature review. Environ. Int. 2009, 35, 187–201. [Google Scholar] [CrossRef] [PubMed]
  5. Madec, J.Y.; Haenni, M.; Nordmann, P.; Poirel, L. Extended-spectrum β-lactamase/AmpC- and carbapenemase-producing Enterobacteriaceae in animals: A threat for humans? Clin. Microbiol. Infect. 2017, 23, 826–833. [Google Scholar] [CrossRef] [Green Version]
  6. Collis, R.M.; Burgess, S.A.; Biggs, P.J.; Midwinter, A.C.; French, N.P.; Toombs-Ruane, L.; Cookson, A.L. Extended-Spectrum Beta-Lactamase-Producing Enterobacteriaceae in Dairy Farm Environments: A New Zealand Perspective. Foodborne Pathog. Dis. 2019, 16, 5–22. [Google Scholar] [CrossRef]
  7. Smith, S.R.; Lang, N.L.; Cheung, K.H.; Spanoudaki, K. Factors controlling pathogen destruction during anaerobic digestion of biowastes. Waste Manag. 2005, 25, 417–425. [Google Scholar] [CrossRef]
  8. Goberna, M.; Podmirseg, S.M.; Waldhuber, S.; Knapp, B.A.; García, C.; Insam, H. Pathogenic bacteria and mineral N in soils following the land spreading of biogas digestates and fresh manure. Appl. Soil Ecol. 2011, 49, 18–25. [Google Scholar] [CrossRef]
  9. Wagner, A.O.; Malin, C.; Gstraunthaler, G.; Illmer, P. Survival of selected pathogens in diluted sludge of a thermophilic waste treatment plant and in NaCl-solution under aerobic and anaerobic conditions. Waste Manag. 2009, 29, 425–429. [Google Scholar] [CrossRef]
  10. Wagner, A.O.; Gstraunthaler, G.; Illmer, P. Survival of bacterial pathogens during the thermophilic anaerobic digestion of biowaste: Laboratory experiments and in situ validation. Anaerobe 2008, 14, 181–183. [Google Scholar] [CrossRef]
  11. Avery, L.M.; Anchang, K.Y.; Tumwesige, V.; Strachan, N.; Goude, P.J. Potential for Pathogen reduction in anaerobic digestion and biogas generation in Sub-Saharan Africa. Biomass Bioenerg. 2014, 70, 112–124. [Google Scholar] [CrossRef]
  12. Fu, B.; Jiang, Q.; Liu, H.B.; Liu, H. Quantification of viable but nonculturable Salmonella spp. and Shigella spp. during sludge anaerobic digestion and their reactivation during cake storage. J. Appl. Microbiol. 2015, 119, 1138–1147. [Google Scholar] [CrossRef]
  13. Resende, J.A.; Diniz, C.G.; Silva, V.L.; Otenio, M.H.; Bonnafous, A.; Arcuri, P.B.; Godon, J.J. Dynamics of antibiotic resistance genes and presence of putative pathogens during ambient temperature anaerobic digestion. J. Appl. Microbiol. 2014, 117, 1689–1699. [Google Scholar] [CrossRef]
  14. Schauss, T.; Glaeser, S.P.; Gütschow, A.; Dott, W.; Kämpfer, P. Improved detection of extended spectrum beta-lactamase (ESBL)-producing Escherichia coli in input and output samples of German biogas plants by a selective pre-enrichment procedure. PLoS ONE 2015, 10, e0119791. [Google Scholar] [CrossRef]
  15. von Salviati, C.; Laube, H.; Guerra, B.; Roesler, U.; Friese, A. Emission of ESBL/AmpC-producing Escherichia coli from pig fattening farms to surrounding areas. Vet. Microbiol. 2015, 175, 77–84. [Google Scholar] [CrossRef]
  16. Alfa, M.I.; Adie, D.B.; Igboro, S.B.; Oranusi, U.S.; Dahunsi, S.O.; Akali, D.M. Assessment of biofertilizer quality and health implications of anaerobic digestion effluent of cow dung and chicken droppings. Renew. Energy 2014, 63, 681–686. [Google Scholar] [CrossRef] [Green Version]
  17. Orzi, V.; Scaglia, B.; Lonati, S.; Riva, C.; Boccasile, G.; Alborali, G.L.; Adani, F. The role of biological processes in reducing both odor impact and pathogen content during mesophilic anaerobic digestion. Sci. Total Environ. 2015, 526, 116–126. [Google Scholar] [CrossRef] [PubMed]
  18. Himathongkham, S.; Bahari, S.; Riemann, H.; Cliver, D. Survival of Escherichia coli O157:H7 and Salmonella typhimurium in cow manure and cow manure slurry. FEMS Microbiol. Lett. 1999, 178, 251–257. [Google Scholar] [CrossRef] [Green Version]
  19. Kudva, I.T.; Blanch, K.; Hovde, C.J. Analysis of Escherichia coli O157:H7 survival in ovine or bovine manure and manure slurry. Appl. Environ. Microbiol. 1998, 64, 3166–3174. [Google Scholar] [CrossRef] [PubMed] [Green Version]
  20. Nicholson, F.A.; Groves, S.J.; Chambers, B.J. Pathogen survival during livestock manure storage and following land application. Bioresour. Technol. 2005, 96, 135–143. [Google Scholar] [CrossRef]
  21. You, Y.; Rankin, S.C.; Aceto, H.W.; Benson, C.E.; Toth, J.D.; Dou, Z. Survival of Salmonella enterica serovar Newport in manure and manure-amended soils. Appl. Environ. Microbiol. 2006, 72, 5777–5783. [Google Scholar] [CrossRef] [Green Version]
  22. Jones, P.W.; Bew, J.; Burrows, M.R.; Matthews, P.R.; Collins, P. The occurrence of salmonellas, mycobacteria and pathogenic strains of Escherichia coli in pig slurry. Epidemiol. Infect. 1976, 77, 43–50. [Google Scholar] [CrossRef] [PubMed] [Green Version]
  23. Zhao, T.; Doyle, M.P.; Shere, J.; Garber, L. Prevalence of enterohemorrhagic Escherichia coli O157:H7 in a survey of dairy herds. Appl. Environ. Microbiol. 1995, 61, 1290–1293. [Google Scholar] [CrossRef] [Green Version]
  24. Wang, G.; Zhao, T.; Doyle, M.P. Fate of enterohemorrhagic Escherichia coli O157:H7 in bovine feces. Appl. Environ. Microbiol. 1996, 62, 2567–2570. [Google Scholar] [CrossRef] [Green Version]
  25. Stanley, K.N.; Wallace, J.S.; Currie, J.E.; Diggle, P.J.; Jones, K. The seasonal variation of thermophilic campylobacters in beef cattle, dairy cattle and calves. J. Appl. Microbiol. 1998, 85, 472–480. [Google Scholar] [CrossRef]
  26. Himathongkham, S.; Riemann, H. Destruction of Salmonella typhimurium, Escherichia coli O157:H7 and Listeria monocytogenes in chicken manure by drying and/or gassing with ammonia. FEMS Microbiol. Lett. 1999, 171, 179–182. [Google Scholar] [CrossRef] [PubMed] [Green Version]
  27. Plachá, I.; Venglovský, J.; Sasáková, N.; Svoboda, I.F. The effect of summer and winter seasons on the survival of Salmonella typhimurium and indicator micro-organisms during the storage of solid fraction of pig slurry. J. Appl. Microbiol. 2001, 91, 1036–1043. [Google Scholar] [CrossRef] [PubMed] [Green Version]
  28. Piepho, H.-P. An Algorithm for a Letter-Based Representation of All-Pairwise Comparisons. J. Comput. Graph. Stat. 2004, 13, 456–466. [Google Scholar] [CrossRef]
  29. Piepho, H.-P. A SAS macro for generating letter displays of pairwise mean comparisons. Commun. Biom. Crop Sci. 2012, 7, 4–13. [Google Scholar]
  30. Fröschle, B.; Heiermann, M.; Lebuhn, M.; Messelhäusser, U.; Plöchl, M. Hygiene and Sanitation in Biogas Plants. Biogas Sci. Technol. 2015, 151, 63–99. [Google Scholar] [CrossRef]
  31. Le Maréchal, C.; Druilhe, C.; Repérant, E.; Boscher, E.; Rouxel, S.; Le Roux, S.; Poëzévara, T.; Ziebal, C.; Houdayer, C.; Nagard, B.; et al. Evaluation of the occurrence of sporulating and nonsporulating pathogenic bacteria in manure and in digestate of five agricultural biogas plants. Microbiologyopen 2019, 8, e872. [Google Scholar] [CrossRef]
  32. Costa, A.; Gusmara, C.; Gardoni, D.; Zaninelli, M.; Tambone, F.; Sala, V.; Guarino, M. The effect of anaerobic digestion and storage on indicator microorganisms in swine and dairy manure. Environ. Sci. Pollut. Res. Int. 2017, 24, 24135–24146. [Google Scholar] [CrossRef] [PubMed]
  33. McCarthy, G.; Lawlor, P.G.; Gutierrez, M.; O’Sullivan, L.; Murphy, A.; Zhan, X.; Gardiner, G.E. An assessment of Salmonella survival in pig manure and its separated solid and liquid fractions during storage. J. Environ. Sci. Health. Part B 2015, 50, 135–145. [Google Scholar] [CrossRef] [PubMed]
  34. Kim, J.; Luo, F.; Jiang, X. Factors impacting the regrowth of Escherichia coli O157:H7 in dairy manure compost. J. Food Prot. 2009, 72, 1576–1584. [Google Scholar] [CrossRef] [PubMed]
  35. Kim, J.; Shepherd, M.W., Jr.; Jiang, X. Evaluating the effect of environmental factors on pathogen regrowth in compost extract. Microb. Ecol. 2009, 58, 498–508. [Google Scholar] [CrossRef]
  36. Chen, Z.; Kim, J.; Jiang, X. Survival of Escherichia coli O157:H7 and Salmonella enterica in animal waste-based composts as influenced by compost type, storage condition and inoculum level. J. Appl. Microbiol. 2018, 124, 1311–1323. [Google Scholar] [CrossRef]
  37. Wang, H.; Dharmasena, M.; Chen, Z.; Jiang, X. Persistence of Non-O157 Shiga Toxin-Producing Escherichia coli in Dairy Compost during Storage. J. Food Prot. 2017, 80, 1999–2005. [Google Scholar] [CrossRef]
  38. Fukushima, H.; Hoshina, K.; Gomyoda, M. Long-term survival of shiga toxin-producing Escherichia coli O26, O111, and O157 in bovine feces. Appl. Environ. Microbiol. 1999, 65, 5177–5181. [Google Scholar] [CrossRef] [Green Version]
  39. Vinnerås, B. Comparison of composting, storage and urea treatment for sanitising of faecal matter and manure. Bioresour. Technol. 2007, 98, 3317–3321. [Google Scholar] [CrossRef]
  40. Ajariyakhajorn, C.; Goyal, S.M.; Robinson, R.A.; Johnston, L.J.; Clanton, C.A. The survival of Salmonella anatum, pseudorabies virus and porcine reproductive and respiratory syndrome virus in swine slurry. New Microbiol. 1997, 20, 365–369. [Google Scholar]
  41. Mawdsley, J.L.; Bardgett, R.D.; Merry, R.J.; Pain, B.F.; Theodorou, M.K. Pathogens in livestock waste, their potential for movement through soil and environmental pollution. Appl. Soil Ecol. 1995, 2, 1–15. [Google Scholar] [CrossRef]
  42. Arrus, K.M.; Holley, R.A.; Ominski, K.H.; Tenuta, M.; Blank, G. Influence of temperature on Salmonella survival in hog manure slurry and seasonal temperature profiles in farm manure storage reservoirs. Livest. Sci. 2006, 102, 226–236. [Google Scholar] [CrossRef]
  43. Semenov, A.V.; van Bruggen, A.H.; van Overbeek, L.; Termorshuizen, A.J.; Semenov, A.M. Influence of temperature fluctuations on Escherichia coli O157:H7 and Salmonella enterica serovar Typhimurium in cow manure. FEMS Microbiol. Ecol. 2007, 60, 419–428. [Google Scholar] [CrossRef] [Green Version]
  44. García, R.; Baelum, J.; Fredslund, L.; Santorum, P.; Jacobsen, C.S. Influence of temperature and predation on survival of Salmonella enterica serovar Typhimurium and expression of invA in soil and manure-amended soil. Appl. Environ. Microbiol. 2010, 76, 5025–5031. [Google Scholar] [CrossRef] [PubMed] [Green Version]
  45. Bui, X.T.; Wolff, A.; Madsen, M.; Bang, D.D. Fate and Survival of Campylobacter coli in Swine Manure at Various Temperatures. Front. Microbiol. 2011, 2, 262. [Google Scholar] [CrossRef] [Green Version]
  46. Klein, M.; Brown, L.; Ashbolt, N.J.; Stuetz, R.M.; Roser, D.J. Inactivation of indicators and pathogens in cattle feedlot manures and compost as determined by molecular and culture assays. FEMS Microbiol. Ecol. 2011, 77, 200–210. [Google Scholar] [CrossRef]
  47. Park, G.W.; Diez-Gonzalez, F. Utilization of carbonate and ammonia-based treatments to eliminate Escherichia coli O157:H7 and Salmonella Typhimurium DT104 from cattle manure. J. Appl. Microbiol. 2003, 94, 675–685. [Google Scholar] [CrossRef] [Green Version]
  48. Lemunier, M.; Francou, C.; Rousseaux, S.; Houot, S.; Dantigny, P.; Piveteau, P.; Guzzo, J. Long-term survival of pathogenic and sanitation indicator bacteria in experimental biowaste composts. Appl. Environ. Microbiol. 2005, 71, 5779–5786. [Google Scholar] [CrossRef] [Green Version]
  49. Paniel, N.; Rousseaux, S.; Gourland, P.; Poitrenaud, M.; Guzzo, J. Assessment of survival of Listeria monocytogenes, Salmonella Infantis and Enterococcus faecalis artificially inoculated into experimental waste or compost. J. Appl. Microbiol. 2010, 108, 1797–1809. [Google Scholar] [CrossRef]
  50. Bonetta, S.; Ferretti, E.; Bonetta, S.; Fezia, G.; Carraro, E. Microbiological contamination of digested products from anaerobic co-digestion of bovine manure and agricultural by-products. Lett. Appl. Microbiol. 2011, 53, 552–557. [Google Scholar] [CrossRef]
  51. Maynaud, G.; Pourcher, A.M.; Ziebal, C.; Cuny, A.; Druilhe, C.; Steyer, J.P.; Wéry, N. Persistence and Potential Viable but Non-culturable State of Pathogenic Bacteria during Storage of Digestates from Agricultural Biogas Plants. Front. Microbiol. 2016, 7, 1469. [Google Scholar] [CrossRef] [PubMed] [Green Version]
  52. Piveteau, P.; Depret, G.; Pivato, B.; Garmyn, D.; Hartmann, A. Changes in gene expression during adaptation of Listeria monocytogenes to the soil environment. PLoS ONE 2011, 6, e24881. [Google Scholar] [CrossRef] [PubMed] [Green Version]
  53. Vivant, A.L.; Desneux, J.; Pourcher, A.M.; Piveteau, P. Transcriptomic Analysis of the Adaptation of Listeria monocytogenes to Lagoon and Soil Matrices Associated with a Piggery Environment: Comparison of Expression Profiles. Front. Microbiol. 2017, 8, 1811. [Google Scholar] [CrossRef] [PubMed]
Figure 1. (A): Reduction rates of S. Typhimurium, L. monocytogenes, and ESBL-E. coli during storage in temperature profile 1 as a function of time (weeks of storage) and the composition of anaerobic digestates (AD-A, AD-B, AD-C, AD-D, and AD-E; Table 1). The dashed line indicates the 4-log reduction threshold, the dotted line indicates the 5-log reduction threshold. (B): Quantitative re-isolation of S. Typhimurium, L. monocytogenes, and ESBL-E. coli and statistical evaluation of the influence of the different anaerobic digestates (AD-A to AD-E) on the inactivation of Salmonella Typhimurium, L. monocytogenes, and ESBL-E. coli under temperature profile 1 conditions. Different letters (a, b, c) as indicated on the respective bar mean significant differences between the anaerobic digestates (p <  0.05).
Agriculture 12 00067 g001
Figure 2. (A): Reduction rates of S. Typhimurium, L. monocytogenes, and ESBL-E. coli during storage in temperature profile 2 as a function of time (weeks of storage) and the composition of anaerobic digestates (AD-A, AD-B, AD-C, AD-D, and AD-E; Table 1). The dashed line indicates the 4-log reduction threshold, the dotted line indicates the 5-log reduction threshold. (B): Quantitative re-isolation of S. Typhimurium, L. monocytogenes, and ESBL-E. coli and statistical evaluation of the influence of the different anaerobic digestates (AD-A to AD-E) on the inactivation of Salmonella Typhimurium, L. monocytogenes, and ESBL-E. coli under temperature profile 2 conditions. Different letters (a, b, c, d) as indicated on the respective bar mean significant differences between the anaerobic digestates (p <  0.05).
Agriculture 12 00067 g002
Figure 3. (A): Reduction rates of S. Typhimurium, L. monocytogenes, and ESBL-E. coli during storage in temperature profile 3 as a function of time (weeks of storage) and the composition of anaerobic digestates (AD-A, AD-B, AD-C, AD-D, and AD-E; Table 1). The dashed line indicates the 4-log reduction threshold, the dotted line indicates the 5-log reduction threshold. (B): Quantitative re-isolation of S. Typhimurium, L. monocytogenes, and ESBL-E. coli and statistical evaluation of the influence of the different anaerobic digestates (AD-A to AD-E) on the inactivation of Salmonella Typhimurium, L. monocytogenes, and ESBL-E. coli under temperature profile 3 conditions. Different letters (a, b, c, d) as indicated on the respective bar mean significant differences between the anaerobic digestates (p <  0.05).
Agriculture 12 00067 g003
Figure 4. (A): Reduction rates of S. Typhimurium, L. monocytogenes, and ESBL-E. coli during storage in temperature profile 4 as a function of time (weeks of storage) and the composition of anaerobic digestates (AD-A, AD-B, AD-C, AD-D, and AD-E; Table 1). The dashed line indicates the 4-log reduction threshold, the dotted line indicates the 5-log reduction threshold. (B): Quantitative re-isolation of S. Typhimurium, L. monocytogenes, and ESBL-E. coli and statistical evaluation of the influence of the different anaerobic digestates (AD-A to AD-E) on the inactivation of Salmonella Typhimurium, L. monocytogenes, and ESBL-E. coli under temperature profile 4 conditions. Different letters (a, b, c, d, e) as indicated on the respective bar mean significant differences between the anaerobic digestates (p  <  0.05).
Agriculture 12 00067 g004
Table 1. Different anaerobic digestates (ADs) as defined by the input materials of the corresponding biogas plants.
ADInput Material of the Biogas Plant
A70% pig and cattle slurry
30% maize silage
B60% pig slurry
40% maize silage
C60% cattle slurry
40% horse, cattle and poultry manure and maize silage
D60% poultry slurry and poultry manure
40% maize silage
E60% cattle slurry, cattle, and horse manure
40% maize silage
Table 2. Overview on temperature profiles.
MonthJanFebMarchAprilMayJuneJulyAugSeptOctNovDec
Temperature (°C)1.11.95.510.214.317.819.118.814.510.35.51.8
profile 1
(winter-spring) 1
Agriculture 12 00067 i001
profile 2
(spring-summer)
Agriculture 12 00067 i001
profile 3
(summer-autumn)
Agriculture 12 00067 i001
profile 4
(autumn-winter)
Agriculture 12 00067 i002 Agriculture 12 00067 i002
1 Blue bar means the period of the respective temperature profile.
Table 3. Analysis of the anaerobic digestates (pH, total nitrogen, and NH4-N).
Before StorageAfter 24 Months of Storage
Anaerobic
Digestate
Temperature
Profile 1
Temperature
Profile 2
Temperature
Profile 3
Temperature
Profile 4
total N 1 %0.460.4150.3920.4560.444
AD-ANH4-N 2 %0.210.2170.1960.2460.243
pH7.77.77.87.58.4
total N %0.690.6940.6960.6940.94
AD-BNH4-N %0.430.4960.4760.4770.491
pH7.97.97.77.87.8
total N %0.710.7050.7060.7070.699
AD-CNH4-N %0.360.4050.3960.4070.392
pH8.38.88.07.78.8
total N %0.760.7610.7500.7480.756
AD-DNH4-N %0.400.3740.430.4280.415
pH8.17.98.37.98.3
total N %0.440.4330.4150.2310.399
AD-ENH4-N %0.120.1310.1470.0160.124
pH7.78.27.48.17.6
1 Total nitrogen. 2 Nitrogen bound in ammonium nitrate.
Publisher’s Note: MDPI stays neutral with regard to jurisdictional claims in published maps and institutional affiliations.

