Article

Modeling Basin-Scale Impacts of Cultivation Practices on Cotton Yield and Water Conservation under Various Hydroclimatic Regimes

1
College of Land Science and Technology, China Agricultural University, Beijing 100193, China
2
USDA-ARS Conservation and Production Research Laboratory, Bushland, TX 79012, USA
3
Texas A&M AgriLife Research and Extension Center at Vernon, Vernon, TX 76384, USA
*
Author to whom correspondence should be addressed.
Agriculture 2022, 12(1), 17; https://doi.org/10.3390/agriculture12010017
Submission received: 30 November 2021 / Revised: 23 December 2021 / Accepted: 23 December 2021 / Published: 24 December 2021
(This article belongs to the Topic Water Management in the Era of Climatic Change)

Abstract

:
The SWAT model equipped with an improved auto-irrigation function was used to assess the impacts of cultivation practices on irrigated and dryland cotton yield and water conservation in the Texas Panhandle. Results showed the largest irrigation depth led to reductions in irrigation and crop evapotranspiration (ETc) with slightly increased cotton yields compared to the baseline scenarios under different hydroclimatic regimes. However, soil water content and surface runoff values were increased when using the largest irrigation depth. The opposite results were observed for the small irrigation depth. Early planting of cotton resulted in decreased irrigation and ETc, and increased cotton yields under both irrigated and dryland conditions, particularly in normal and wet years. By contrast, the late planting scenarios indicated the opposite for those variables. Simulated hydrologic variables were relatively stable using various maturity cultivars. Nevertheless, greater than 10% reductions in irrigated cotton yield under diverse hydroclimatic years and dryland yields during normal and wet years were identified in the long-season cotton. The opposite was determined for the short-season cotton. These outcomes suggest that a larger irrigation depth, earlier planting date, and short-season cultivar are promising cultivation practices for improving cotton yield and water conservation in the Texas Panhandle.

Graphical Abstract

1. Introduction

Upland cotton (Gossypium hirsutum L.) is an economically significant fiber crop in Texas, United States (U.S.). According to the National Agricultural Statistics Service [1], the total value of cotton lint and seed production is approximately 2.1 billion USD per year in Texas. The semi-arid Texas Panhandle is one of the most essential cotton production regions in the U.S. This region holds enormous potential for growing both irrigated and dryland cotton, where cotton was grown on ~1,755,000 ha in 2019, which accounted for approximately 32% of the U.S. total cotton acreage [1]. However, cotton growth and yield in this region are often negatively affected by many abiotic factors such as drought, extreme weather events, and irrigation water availability.
Climate and cultivation practices are treated as two major drivers affecting water conservation and crop production in the Texas Panhandle. Cultivation practices that maintain or improve the resilience of the agroecosystem, typically at a basin or regional scale, are promising in this challenging semi-arid environment [2,3]. Pursuing high cotton yield has driven the extensive use of the southern Ogallala Aquifer, which has resulted in a significant decline in the groundwater level with minimal recharge [4,5]. Decreased groundwater levels have led to changes in cultivation practices that reduce water pumping from the southern Ogallala Aquifer while maintaining cotton profitability. Therefore, recommendations on alternative cultivation practices for cotton production, including using different maturity cultivars [6,7], irrigation application depths (per application) [8], and planting dates [9,10], are necessary to explore, which are also relatively easy ways for growers to incorporate into an agricultural production system.
Genetic advances in cultivar maturity have the potential to preserve profitable yields under water and temperature stresses. The rationale for short- and long-season cultivars aims to take advantage of increased growing season precipitation and decreased temperature stress (heat or cold stress) during major growth stages depending on regional hydroclimatic conditions [11]. Similar to the short- and long-season cultivars, alternative planting dates may provide an opportunity to reduce the period of crop stress according to the local environment [9,12,13]. In the semi-arid Texas Panhandle, cotton is an important cash crop managed under both irrigation and dryland conditions [1]. Cotton is generally seeded in mid-May and harvested around the end of October. Early or late planting dates offer a window to make full use of in-season precipitation and optimum temperature according to hydroclimatic variability between years. Regarding irrigation management, changes in irrigation application depth have shown positive effects on water conservation in semi-arid agriculture [8,14].
The Soil and Water Assessment Tool (SWAT) model has been used to conduct effects studies for agricultural cultivation practices [15,16]. However, little comprehensive information is available for the effects of cultivation practices concerning water conservation and crop production in an intensively irrigated region. The objectives of this study were therefore to: (1) assess the impacts of irrigation application depths on water conservation for irrigated cotton in the Double Mountain Fork Brazos (DMFB) basin; and (2) evaluate the effects of alternative planting dates and maturity cultivars on water balances and cotton yield under both irrigation and dryland conditions. The widely used agro-hydrologic model, the SWAT [17], was chosen in this research [18,19,20]. The SWAT model, equipped with the more physically-based management allowed depletion (MAD) auto-irrigation function [21], was selected to assess the cultivation practices on water conservation and cotton yield in the DMFB basin in the Texas Panhandle.

2. Materials and Methods
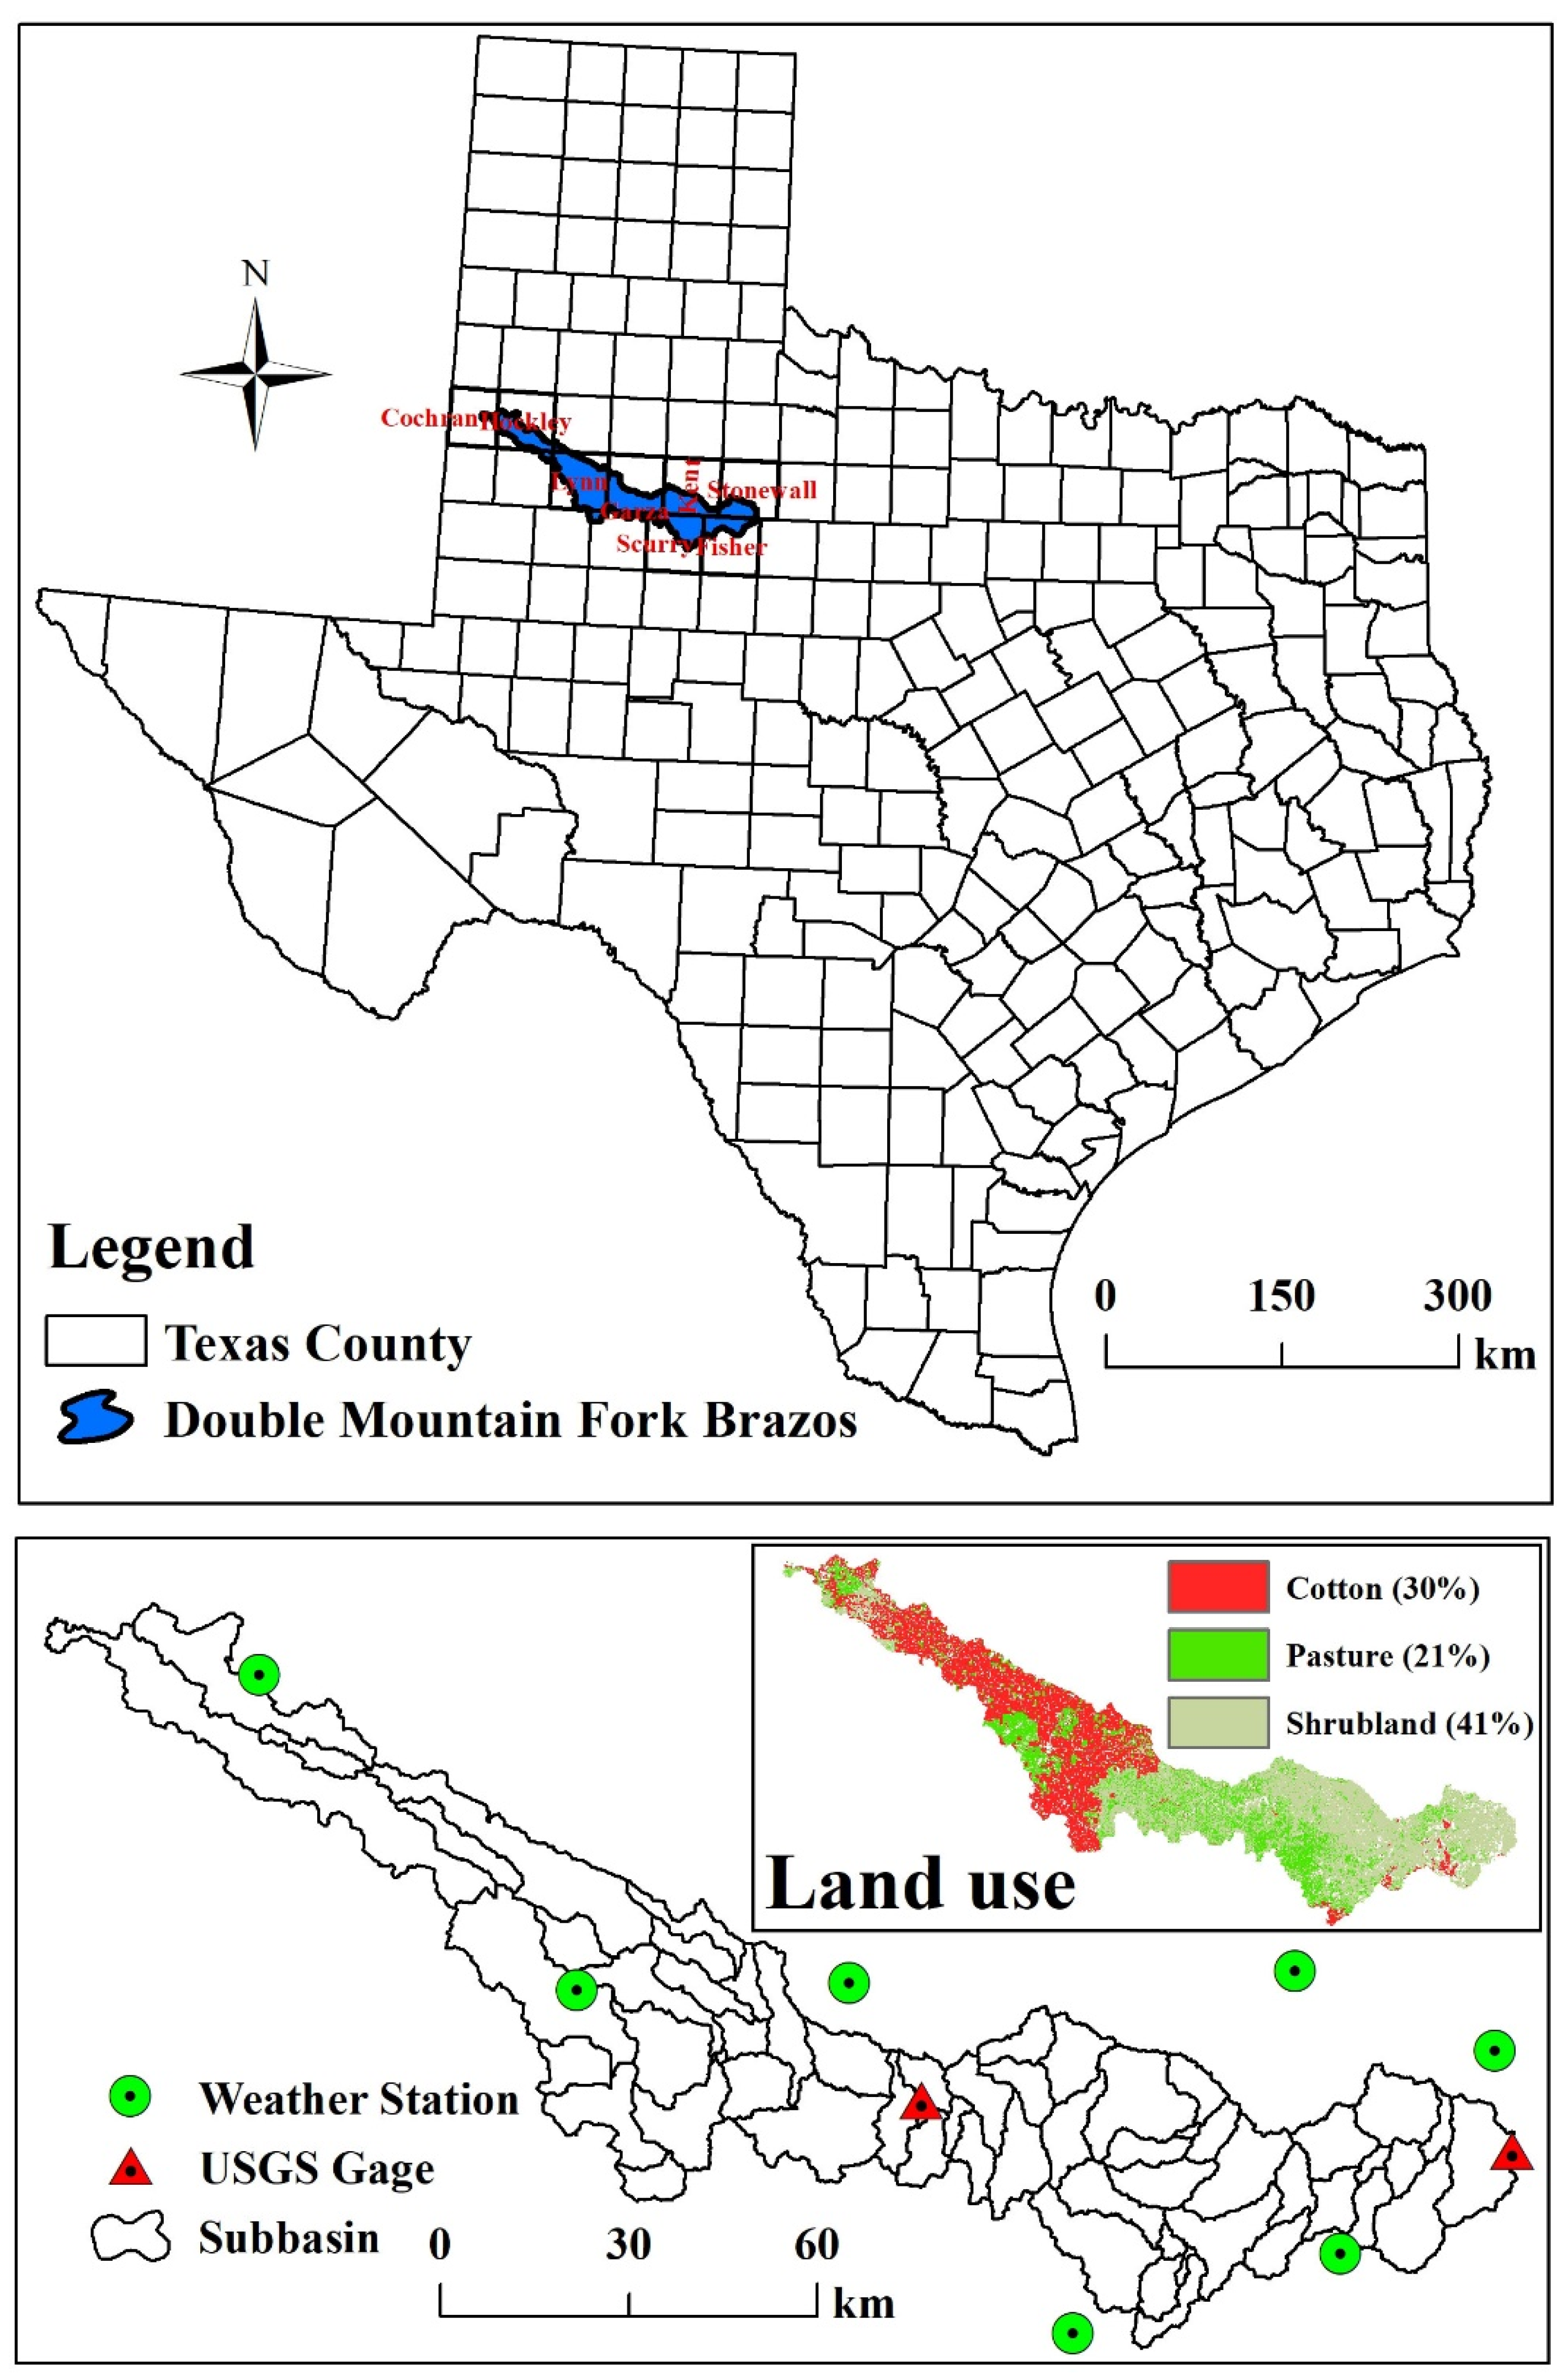
2.1. Study Region

The DMFB basin in the Texas Panhandle has a delineated area of approximately 6000 km2 (The values of elevation range from 495 to 1152 m, and the average value is approximately 809 m.) (Figure 1). The long-term average annual precipitation across the study basin ranges from 457 to 559 mm, and the long-term mean annual maximum and minimum temperatures are approximately 24 °C and 9 °C, respectively. The topography of the DMFB basin is relatively flat. There is a long history of cotton cultivation in the study basin and cotton is grown in approximately 30% of the basin (Figure 1). The dominant types of soil in the DMFB basin are Amarillo sandy loam and Acuff sandy clay loam [22].
Daily precipitation, minimum air temperature, and maximum air temperature data from 1990 to 2009 were obtained from seven National Oceanic and Atmospheric Administration-National Centers for Environmental Information (NOAA-NCEI) weather stations within and adjacent to the DMFB basin (Figure 1). Two U.S. Geological Survey (USGS) gages within the DMFB basin (08079600 and 08080500; Gage I and Gage II) containing streamflow data from 1994 to 2009 were accessed in this study.

2.2. Descriptions of SWAT and SWAT-MAD

The SWAT model is a continuous-time, semi-distributed, process-based, and basin-scale agro-hydrologic model [17]. The primary model components consist of hydrology, crop growth, and water quality and the major data needed for setting up the model for a basin are elevation, land use, soil, climate, and management practices [23]. The SWAT model has been commonly used to simulate basin-scale best management practices on hydrologic cycles and crop production worldwide [24,25,26]. Recently, a more representative MAD auto-irrigation method was developed by Chen et al. [21] and integrated into the SWAT model (hereafter referred to as SWAT-MAD). The MAD auto-irrigation method triggers irrigation according to a pre-defined allowable depletion percentage of plant available water, determined by the crop-specific maximum rooting depth and soil-specific characteristics [21]. The ArcSWAT (version 2012.10_2.19; revision 664; Stone Environmental, Inc., Montpelier, VT) for the ArcGIS 10.2.2 platform was used in this study. The SWAT Calibration and Uncertainty Procedures (SWAT-CUP 2012) with the Sequential Uncertainty Fitting version-2 (SUFI-2) [27] was used for the model calibration and validation for streamflow with the goal of maximizing Nash–Sutcliffe efficiency (NSE). The NSE [28], coefficient of determination (R2) [29], and percent bias (PBIAS) [30] were used to evaluate the performance of the SWAT-MAD model in the DMFB basin.
The SWAT-MAD model was calibrated and validated for streamflow data at two USGS gages and county-level crop yields of both irrigated and dryland cotton. The SWAT-MAD model was also evaluated by county-level seasonal irrigation requirements of cotton and percolation amount. The calibrated parameter values for the SWAT-MAD model are listed in Table S1. A detailed description of the SWAT-MAD model setup, calibration, and validation for the DMFB basin is provided in the Supplementary Materials. The SWAT-MAD model calibration and validation performance statistics for monthly streamflow at the stream gages (Table 1) were well above the “satisfactory” range suggested by Moriasi et al. [31]. The R2 and overall PBIAS were 0.21 and 2.3% when comparing SWAT-MAD simulated and observed irrigated cotton lint yield in Lynn County [1] in the DMFB basin. The simulated irrigation for cotton by the MAD auto-irrigation method (346.9 mm) was very close to the local survey data [32]. The SWAT-MAD model simulated percolation amount was also comparable with the values from local reports and literature [33].

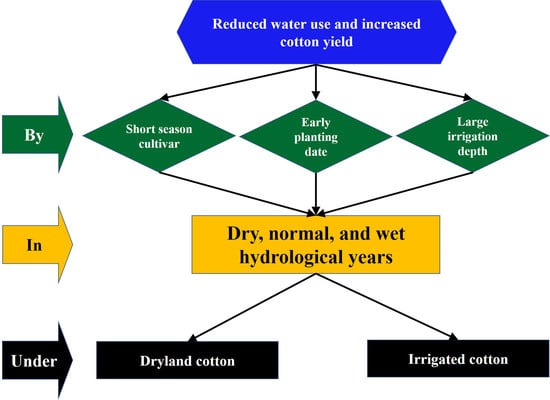
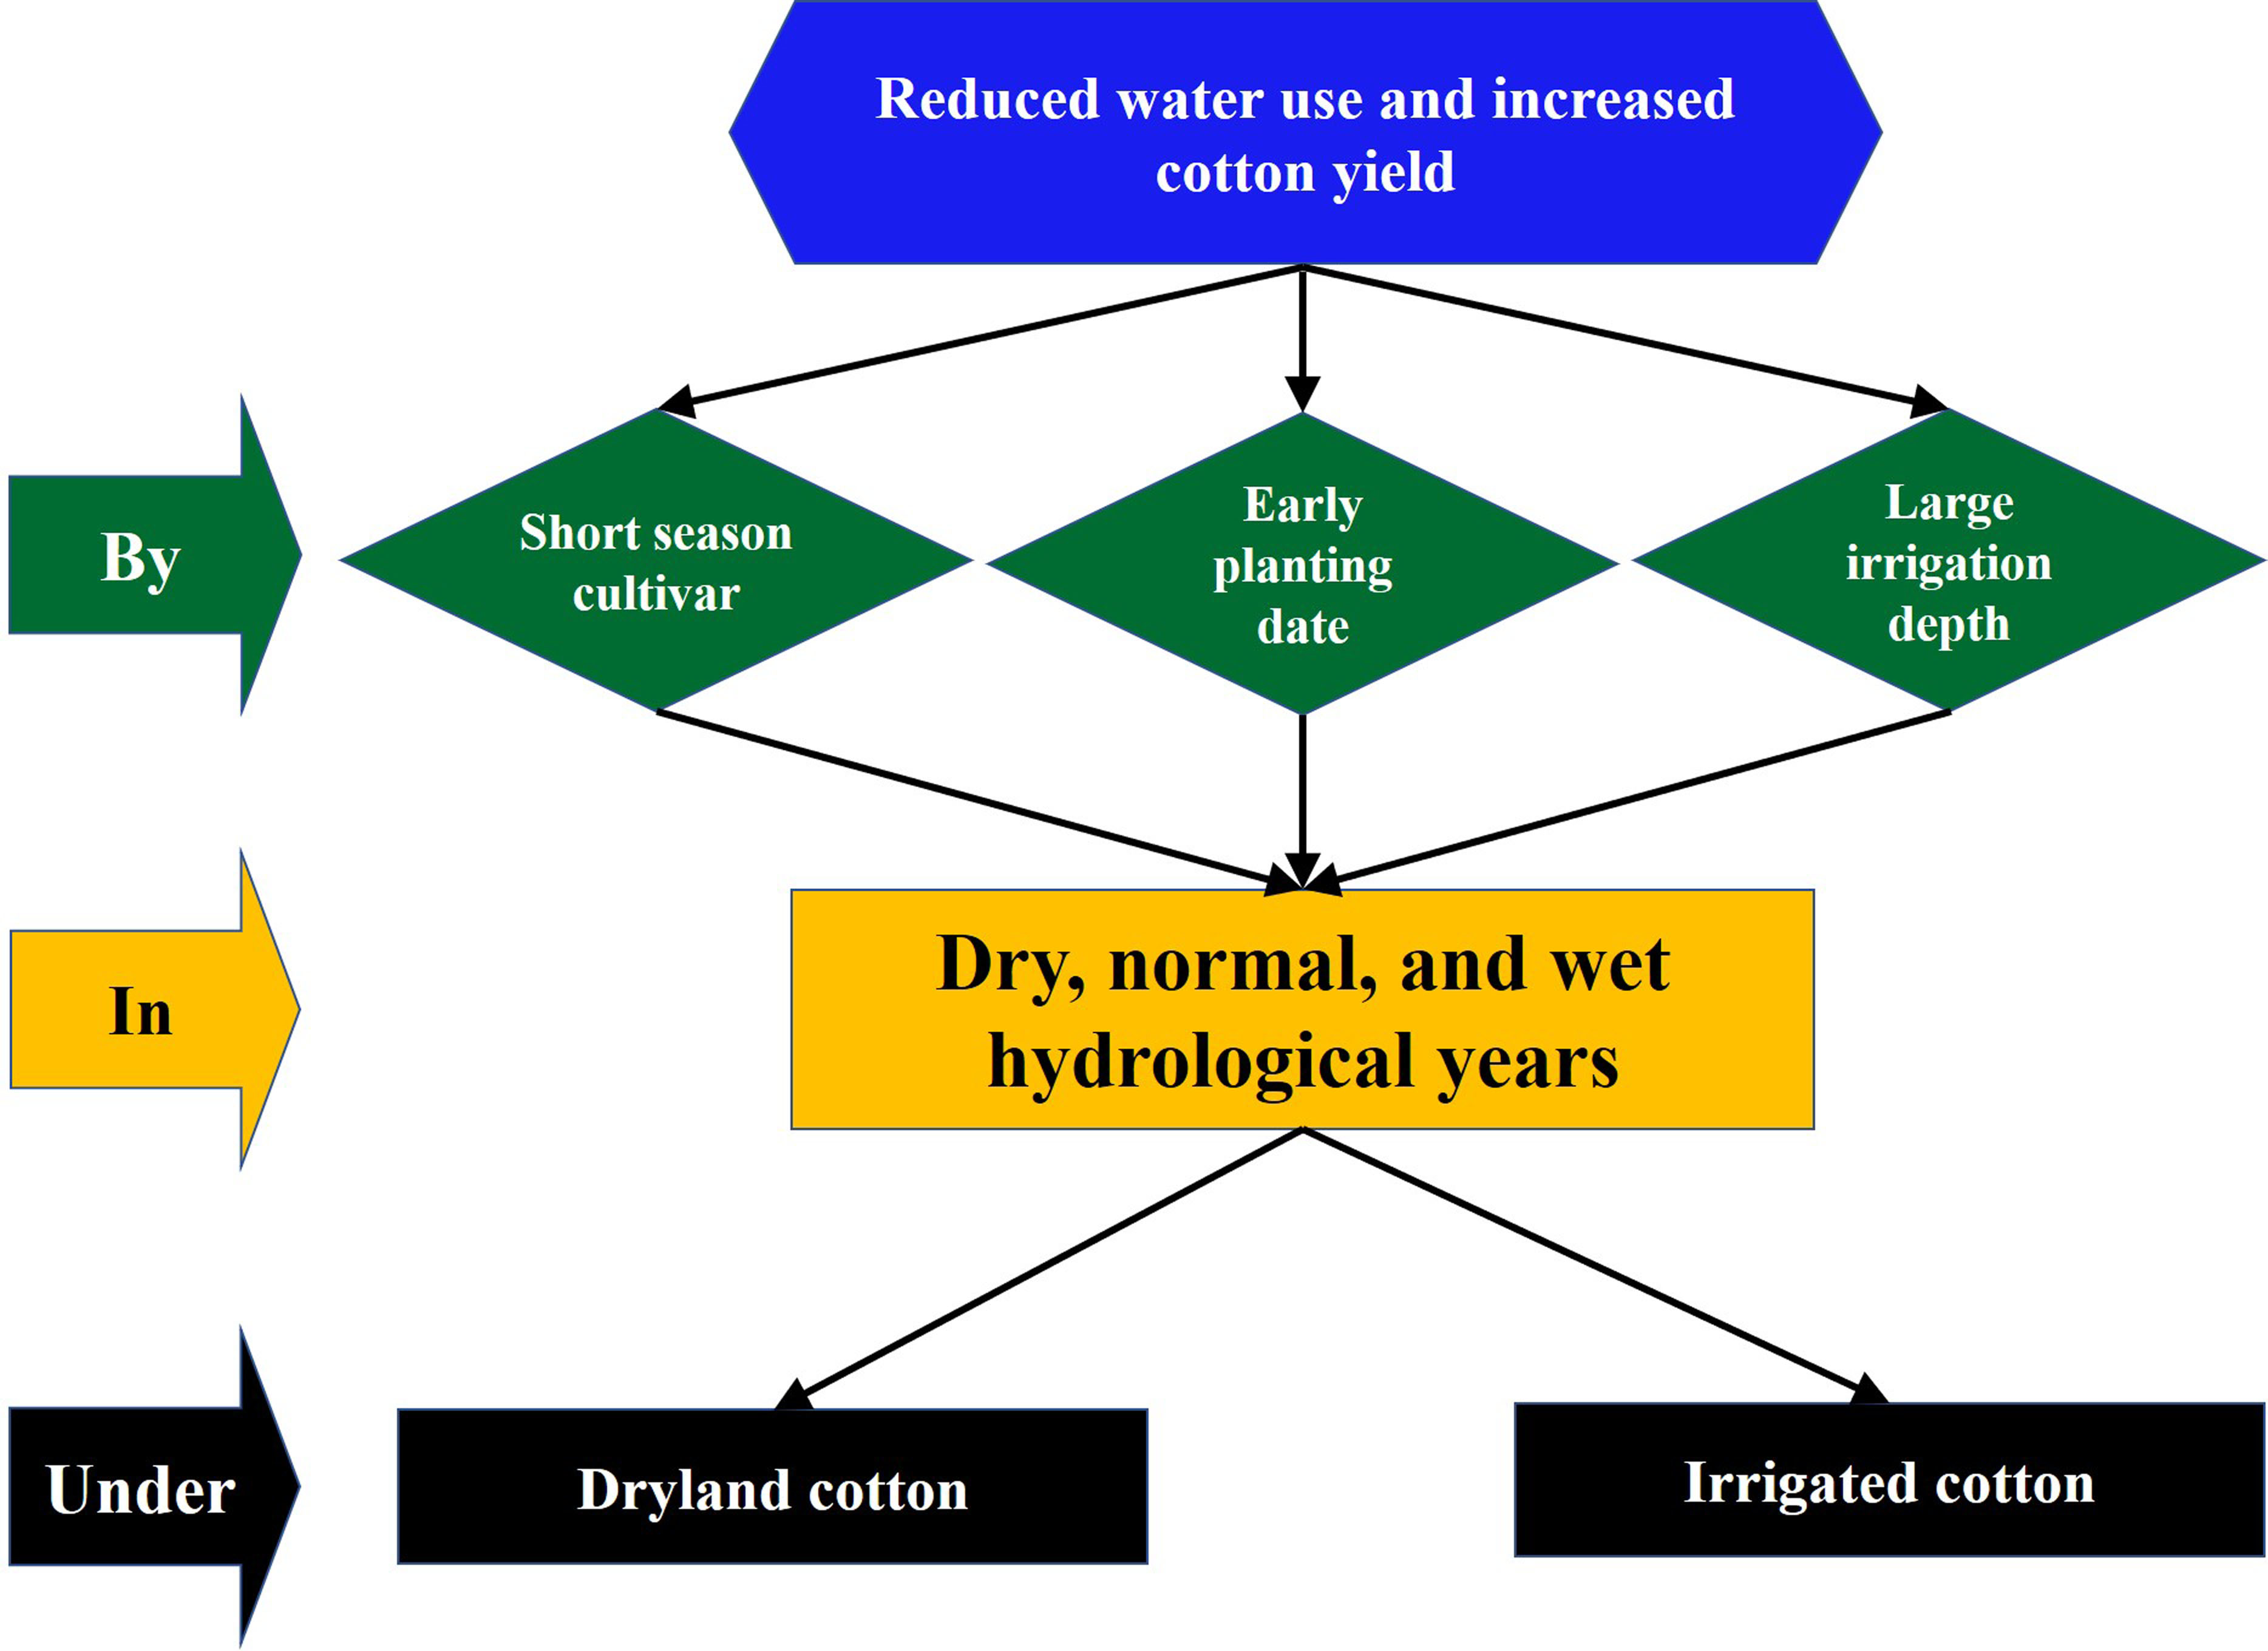
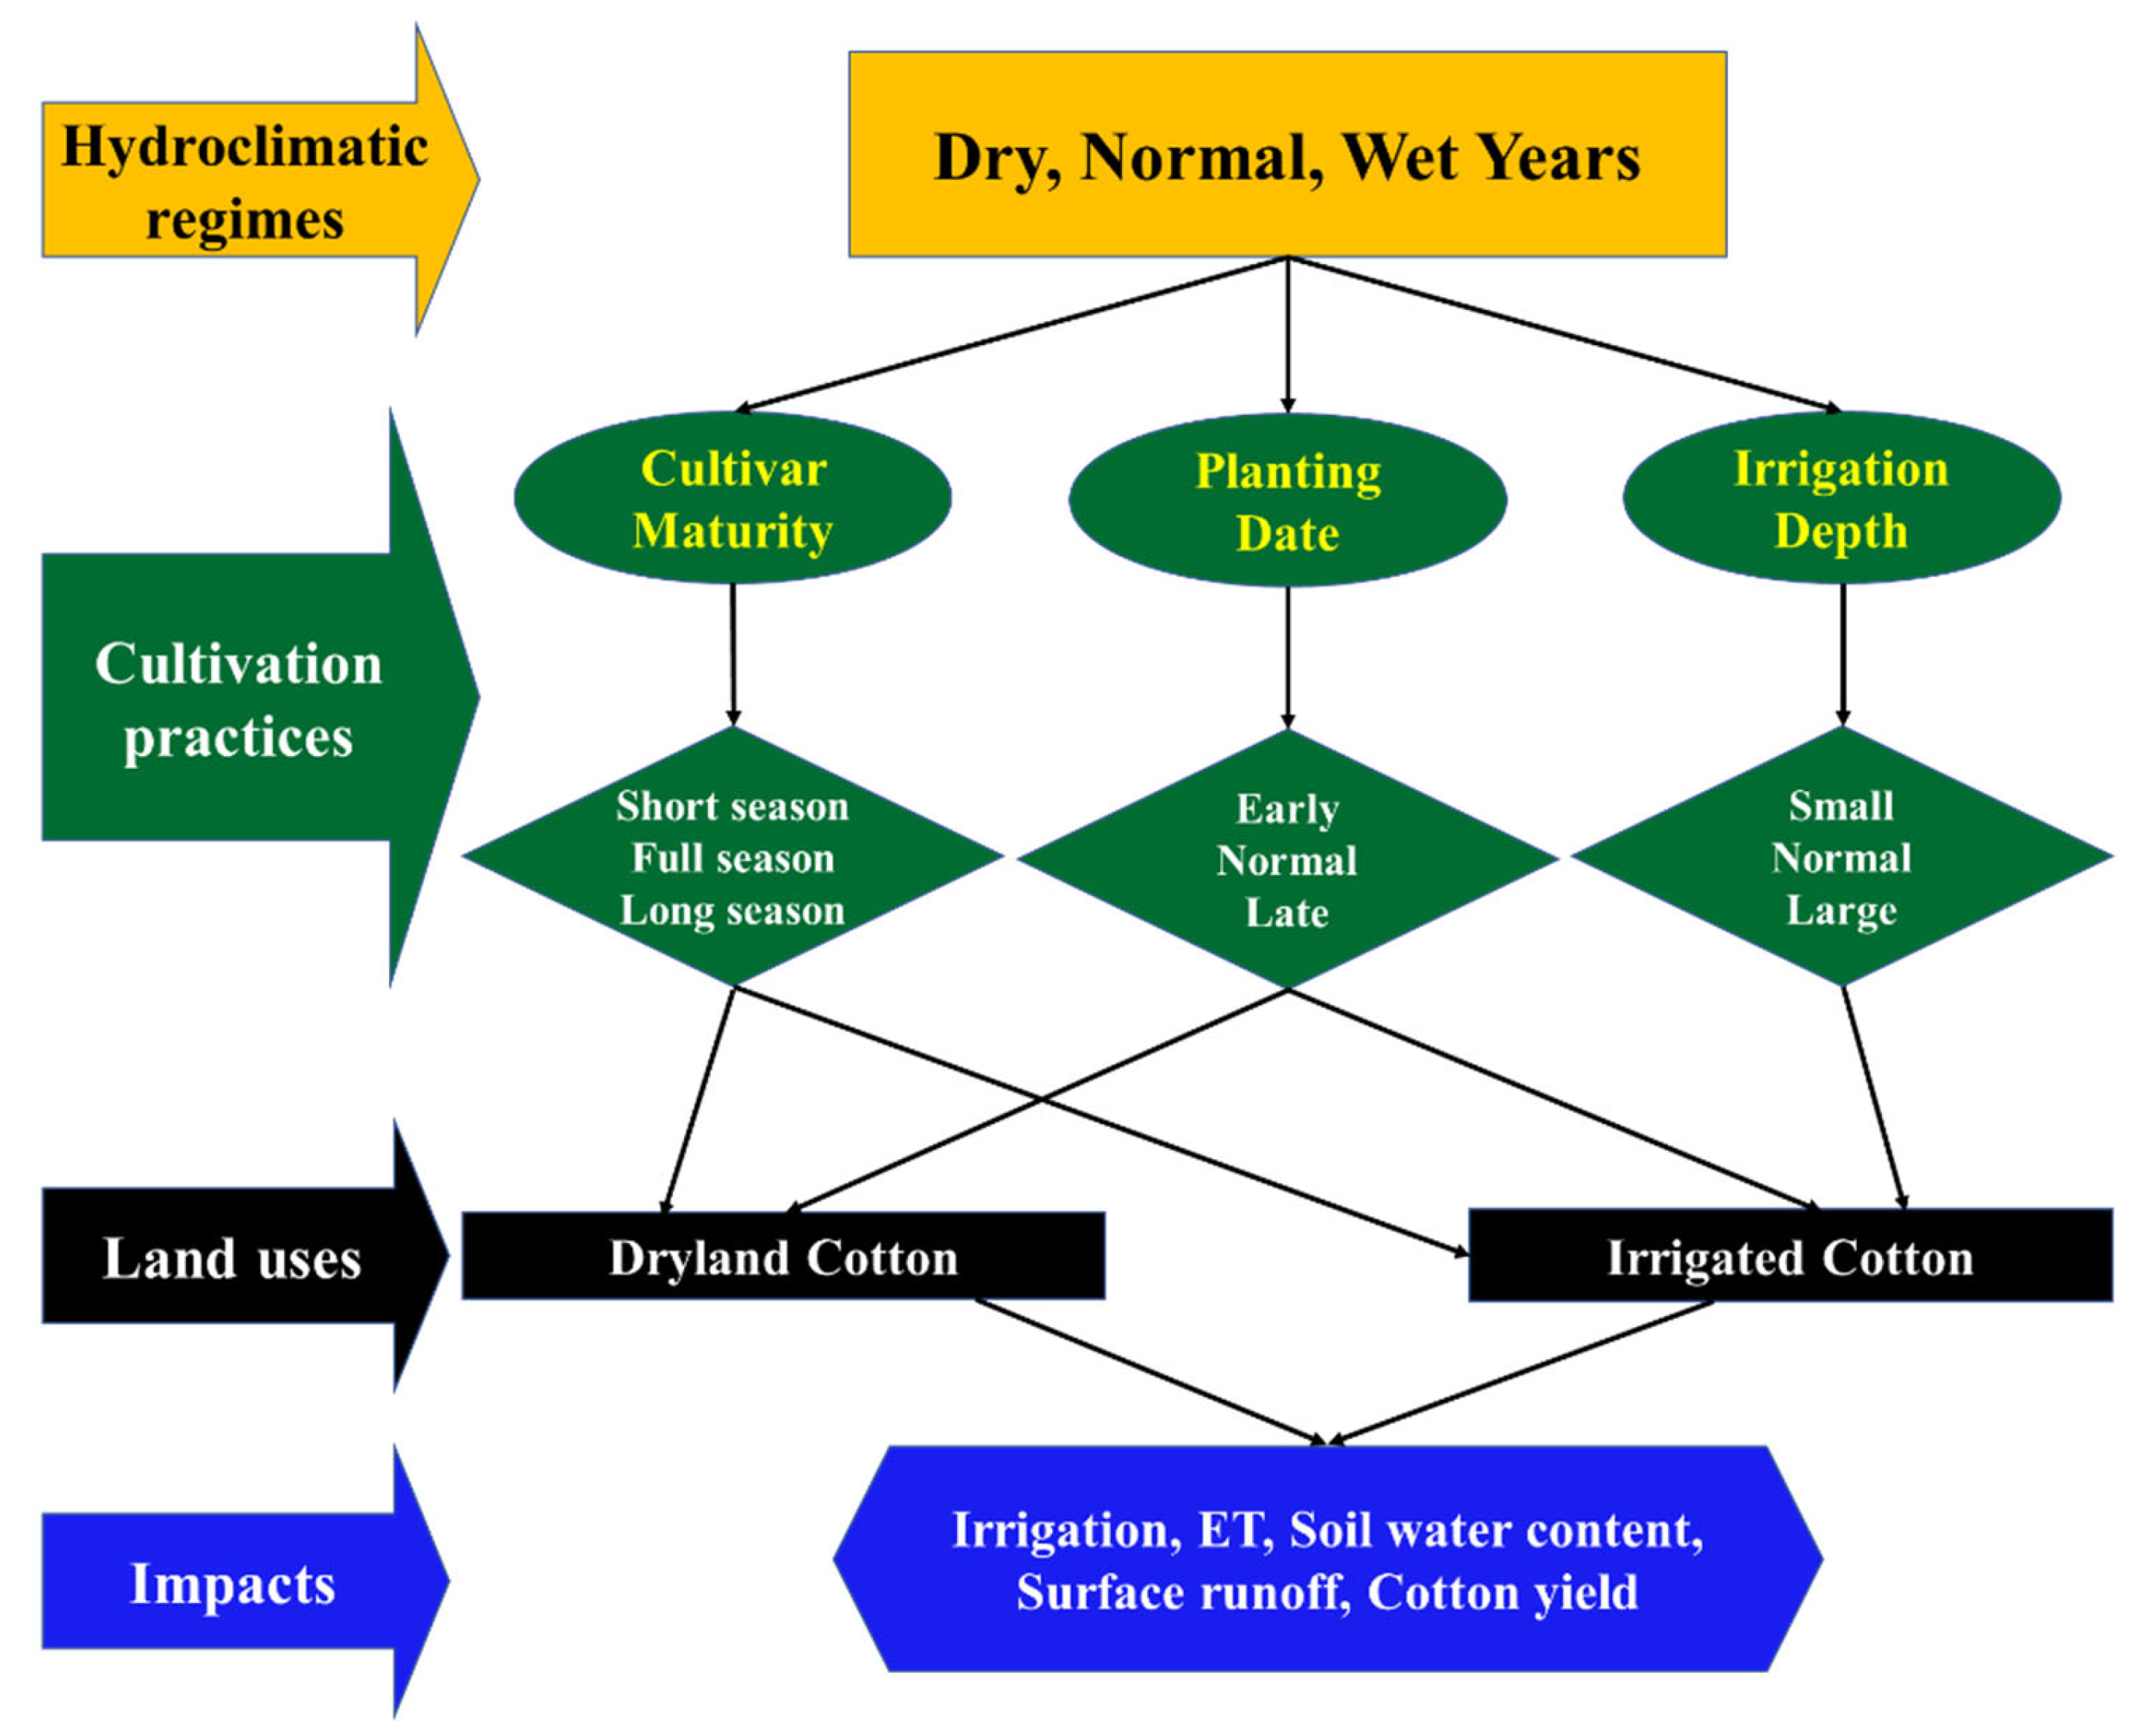
2.3. Scenario Development

The primary management practices of irrigated and dryland cotton under the baseline scenario in the DMFB basin are listed in Table 2. A flowchart of the modeled cultivation practices in the Texas Panhandle is shown in Figure 2. As for the classification of hydroclimatic years, if the precipitation of an individual year was 25% lower than the long-term average (1994–2009) annual precipitation of 517 mm, it was identified as a dry year. Likewise, if the precipitation of an individual year was 25% higher than the long-term average, it was treated as a wet year. The remaining years were considered normal years. According to the aforementioned classification of the hydroclimatic regimes, the dry years were 1994, 1998, and 2003. The wet years were 1997, 2004, and 2007. For the scenario development of alternative cultivation practices, ten scenarios were simulated under each hydroclimatic condition in this study, including two alternative irrigation application depths of 12.7 mm (0.5 inch) and 38.1 mm (1.5 inches) per application for irrigated cotton, two alternative planting dates of early planting (a half month ahead) and late planting (a half month delay) for irrigated and dryland cotton, and two alternative maturity cultivars of short-season cotton (5% less accumulation of heat units to maturity) and long-season cotton (5% more) (Table 3). The selected irrigation application depths represent associated irrigation management by local growers across the Texas Panhandle due to diverse well capacities and soil water holding capacities. The alternative planting dates chosen in this study cover the usual cotton planting window in this region. The short- and long-season cotton cultivars are commonly used locally in response to the changing climate and management needs.

3. Results and Discussion

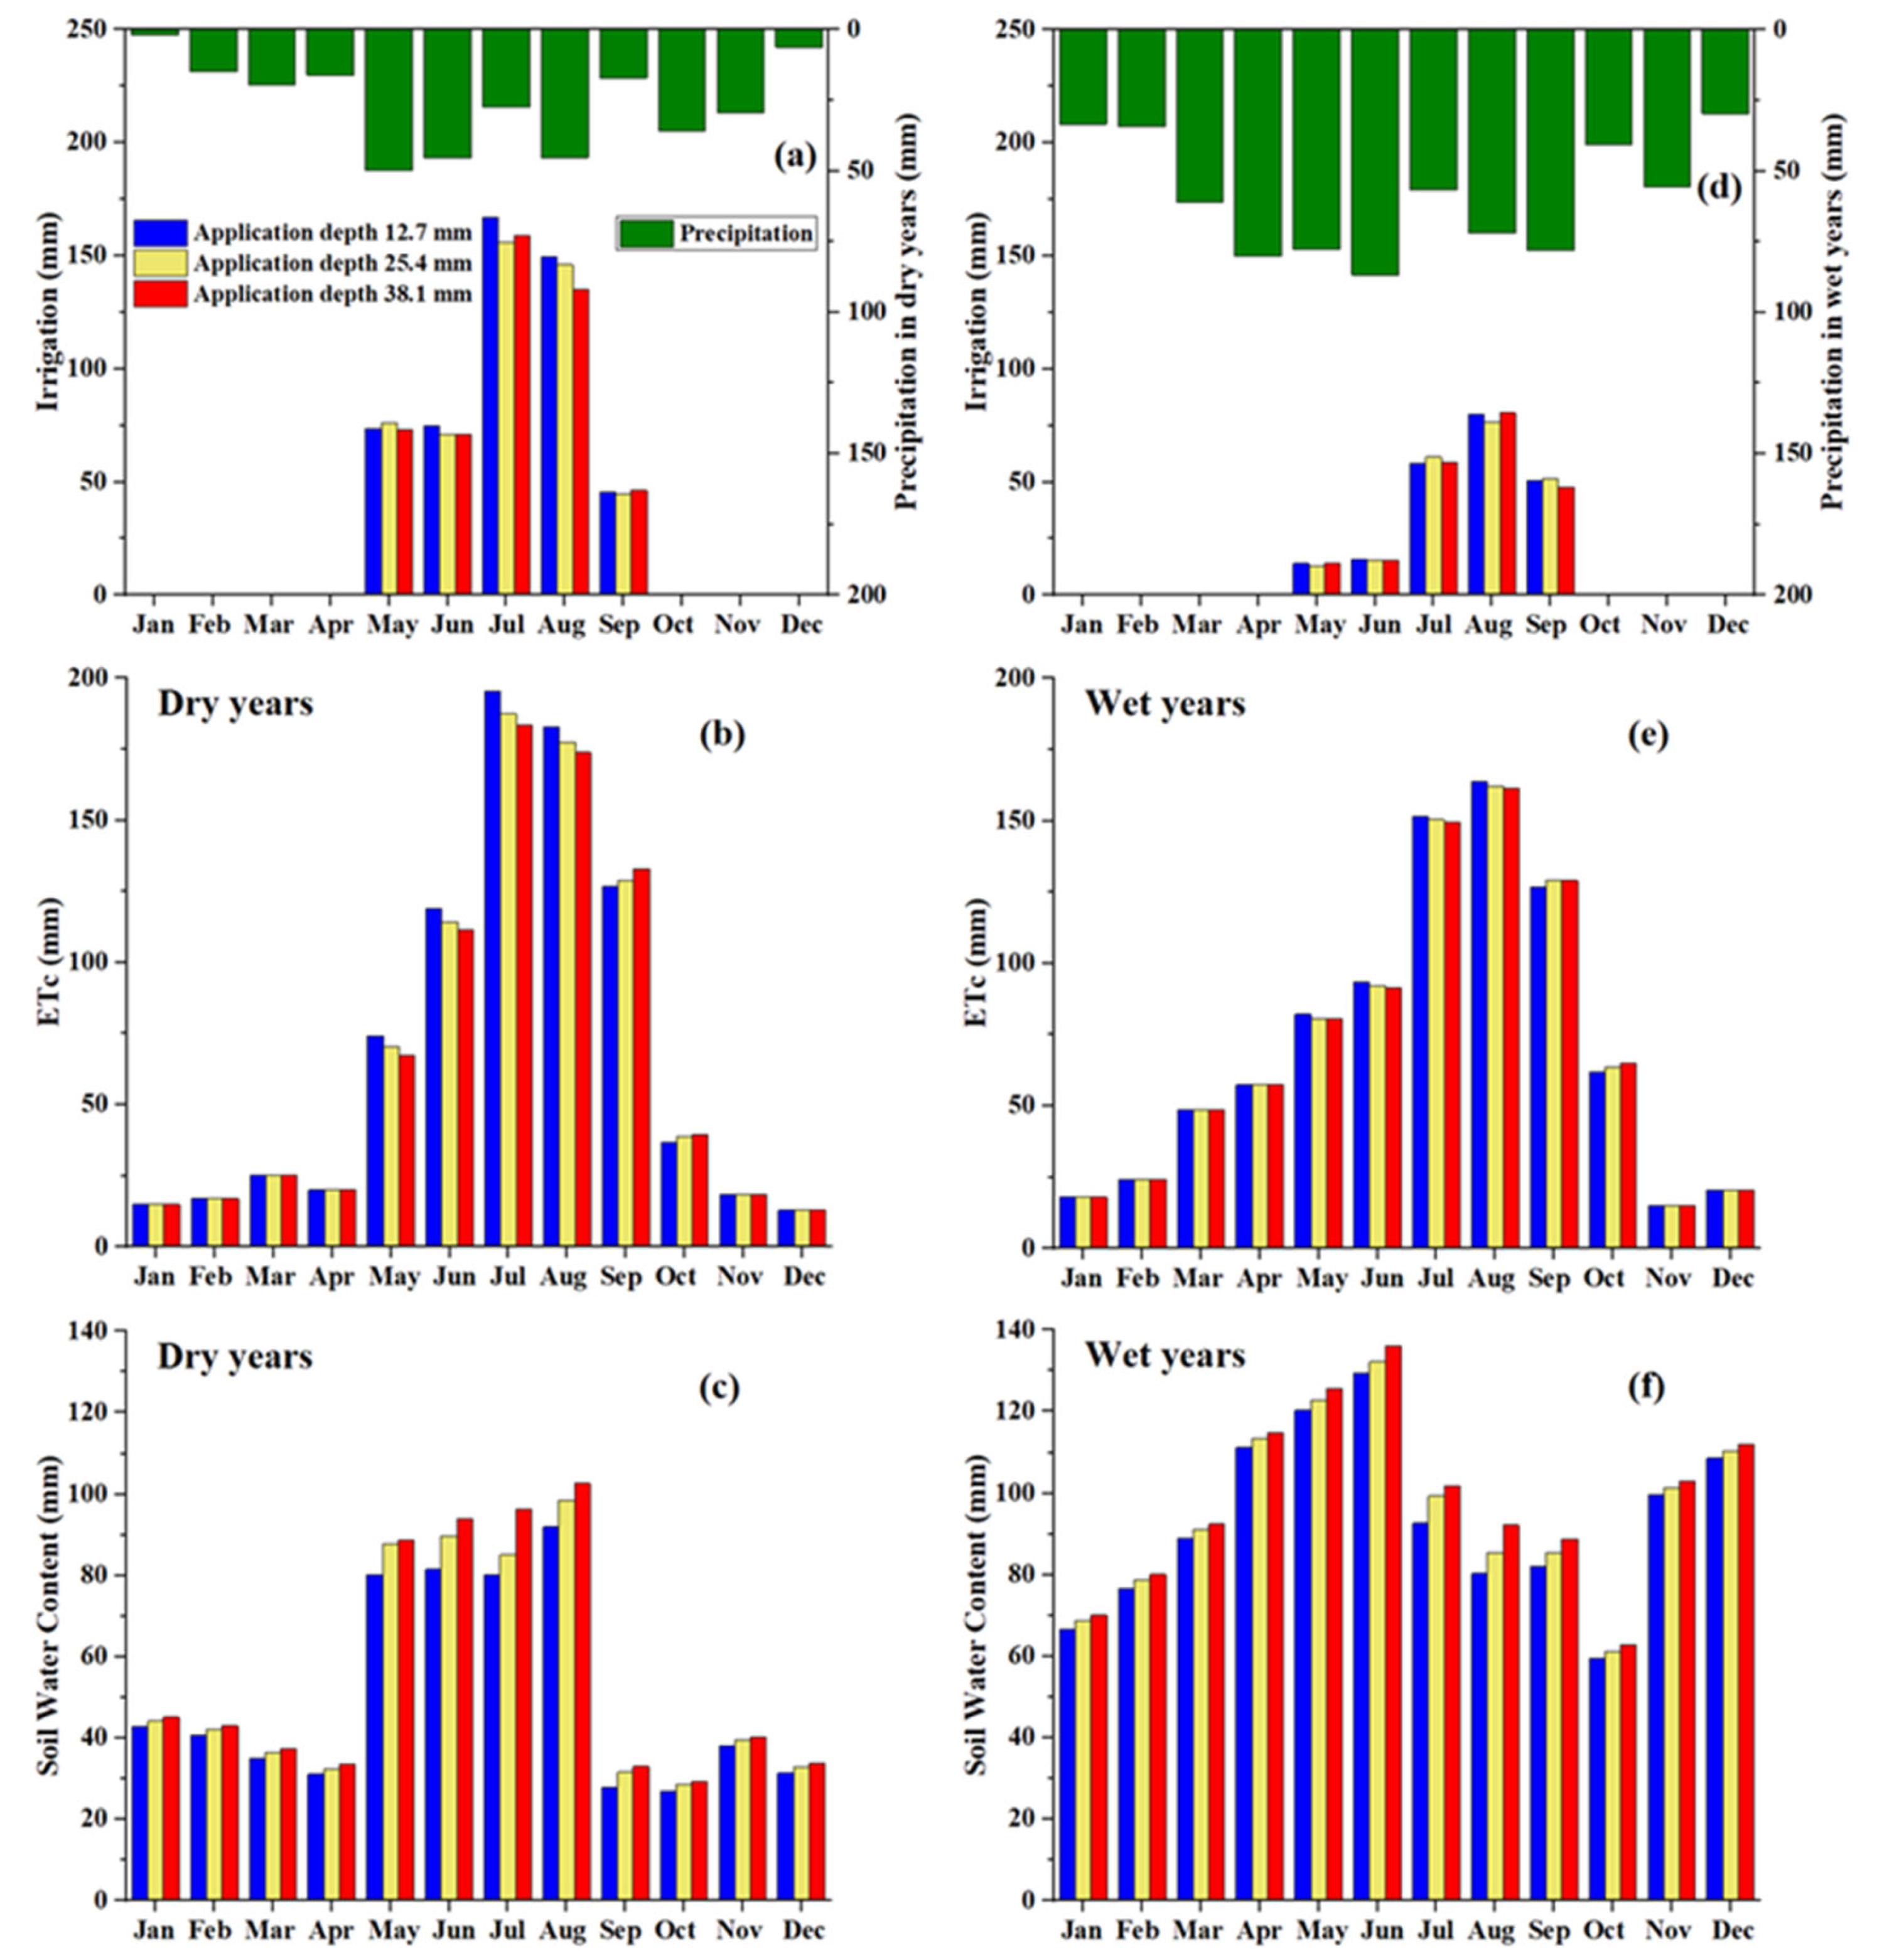
3.1. Simulated Yearly and Monthly Water Balances in Dry, Normal, and Wet Years under the Alternative Irrigation Application Depths

In the dry years, the seasonal cotton irrigation amount was 3.5% larger with a small irrigation application depth of 12.7 mm as compared to the baseline irrigation depth of 25.4 mm. In contrast, a 1.8% reduction in seasonal cotton irrigation amount was simulated for the large irrigation depth of 31.8 mm relative to the baseline depth (Table 4). Those changes are a 3.6% increase and a 2.4% decrease for small and large irrigation application depths, respectively, in the normal years (Table 4). However, less than 1% variation was found using the alternative irrigation application depths during the wet years (Table 4), when precipitation was relatively abundant.
An increase in seasonal irrigation amounts with the small irrigation depth led to the increased ETc of 2.1%, 1.5%, and 0.2% in the dry, normal, and wet years, respectively, compared to their respective baseline scenarios. In contrast, ETc decreased by 1.1%, 1.1%, and 0.1% in dry, normal, and wet years, respectively, when using the large irrigation application depth (Table 4). Increasing the irrigation application depth could reduce irrigation frequency to supplement the seasonal water requirements of crops and reduce evaporative water losses associated with irrigation events [34,35]. Evaporative losses associated with irrigation events are greatest during crop vegetative growth periods when incomplete canopy conditions exist. These losses are largely mitigated in quickly maturing crops such as corn (Zea mays L.) [8]. However, cotton typically matures at a much slower rate than other agricultural crops, extending the time that the soil surface is subject to evaporative losses following irrigation. Furthermore, cotton may not reach full canopy closure in certain years. As such, less frequent irrigation of greater depth are more likely to result in reduced seasonal irrigation requirements for crops such as cotton.
Reductions in soil water content, surface runoff, and water yield (the total amount of water leaving the field) were found for the irrigated cotton scenario with the small irrigation application depth under different hydroclimatic regimes compared to the baseline scenarios. However, opposite results were found for the large irrigation application depth scenario under various hydroclimatic years. For instance, soil water content, surface runoff, and water yield decreased by 4.7%, 57.5%, and 2.7%, respectively, with the small irrigation depth, while those hydrologic parameters increased by 2.5%, 115.4%, and 3.3%, respectively, with the large irrigation depth as compared to the baseline scenario in the dry years (Table 4). It is evident that the smaller irrigation depth can result in relatively lower soil water content and runoff. Under the alternative full irrigation management conditions, the cotton yield only showed slight changes (Table 4). There was an increasing trend for cotton yield under the large irrigation depth while a decreasing tendency under the small irrigation depth in diverse hydroclimatic years. Therefore, maintaining/enhancing cotton yield while reducing groundwater pumping from the Ogallala Aquifer in the Texas Panhandle could be achieved using a large irrigation application depth.
The monthly balance analysis showed that the peak irrigation and ETc occurred in July during the dry years (Figure 3a,b) and in August during the wet years (Figure 3d,e) in the irrigated cotton land use. In the dry years of irrigated cotton, there was a high soil water content during the cotton growing season from May to August (Figure 3c). Nevertheless, the soil water content was relatively low in the growing season, especially from July to October during the wet years (Figure 3f). Generally, the smaller irrigation application depth resulted in greater irrigation and ETc (Figure 3a,b,d,e). For example, the irrigation amounts increased by 5.6% and 7.2% in June and July, respectively, in the dry years using the small irrigation application depth compared to the baseline irrigation depth (Figure S1a). The irrigation amount increased by 10.2% in May in the wet years (Figure S1d). The range of increased ETc from May to August varied by 3.0–5.2% and 1.0–1.8% during the dry and wet years, respectively, using the small irrigation depth (Figure S1b,e). The monthly soil water content consistently decreased under the small irrigation depth relative to the baseline irrigation depth in the dry and wet years (Figure 3c and Figure S1c). By contrast, the larger irrigation depth maintained a higher soil water content compared to the baseline irrigation depth (Figure 3f and Figure S1f). In the normal years, overall, the small irrigation depth also led to an increase in irrigation and ETc while soil water content decreased (Figure S2). However, the large irrigation depth caused reductions in irrigation and ETc and maintained a high soil water content.

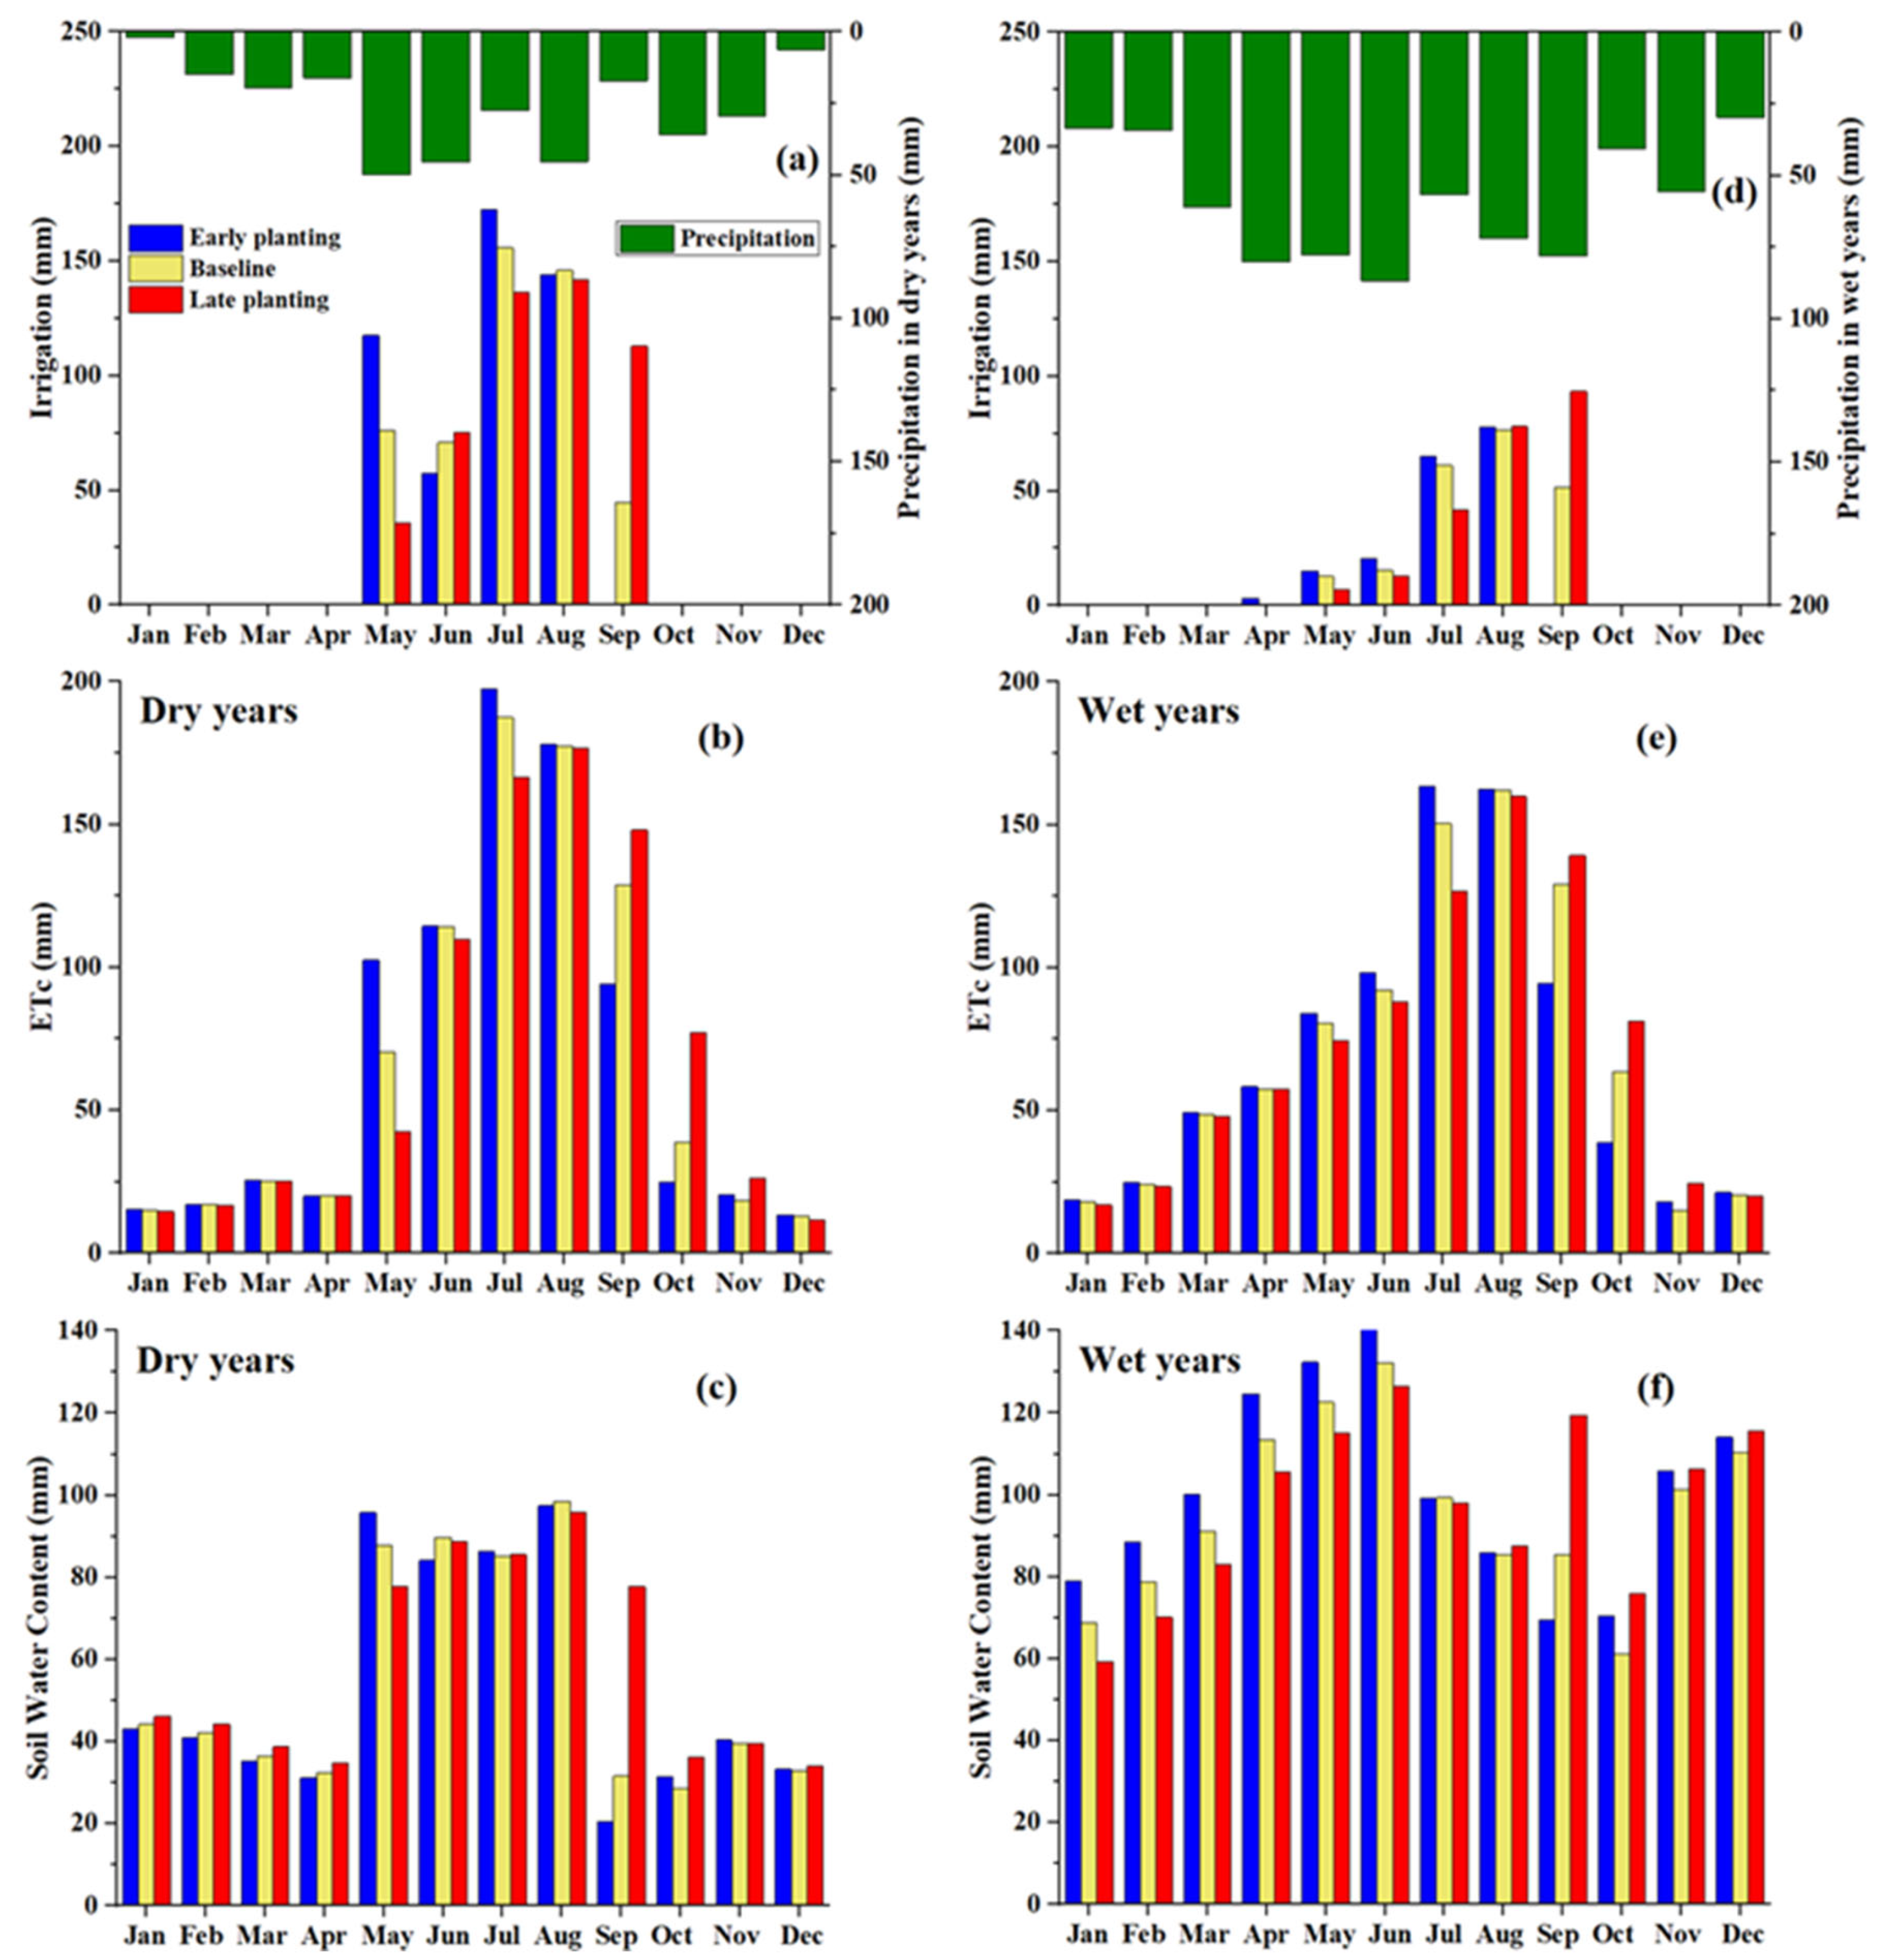
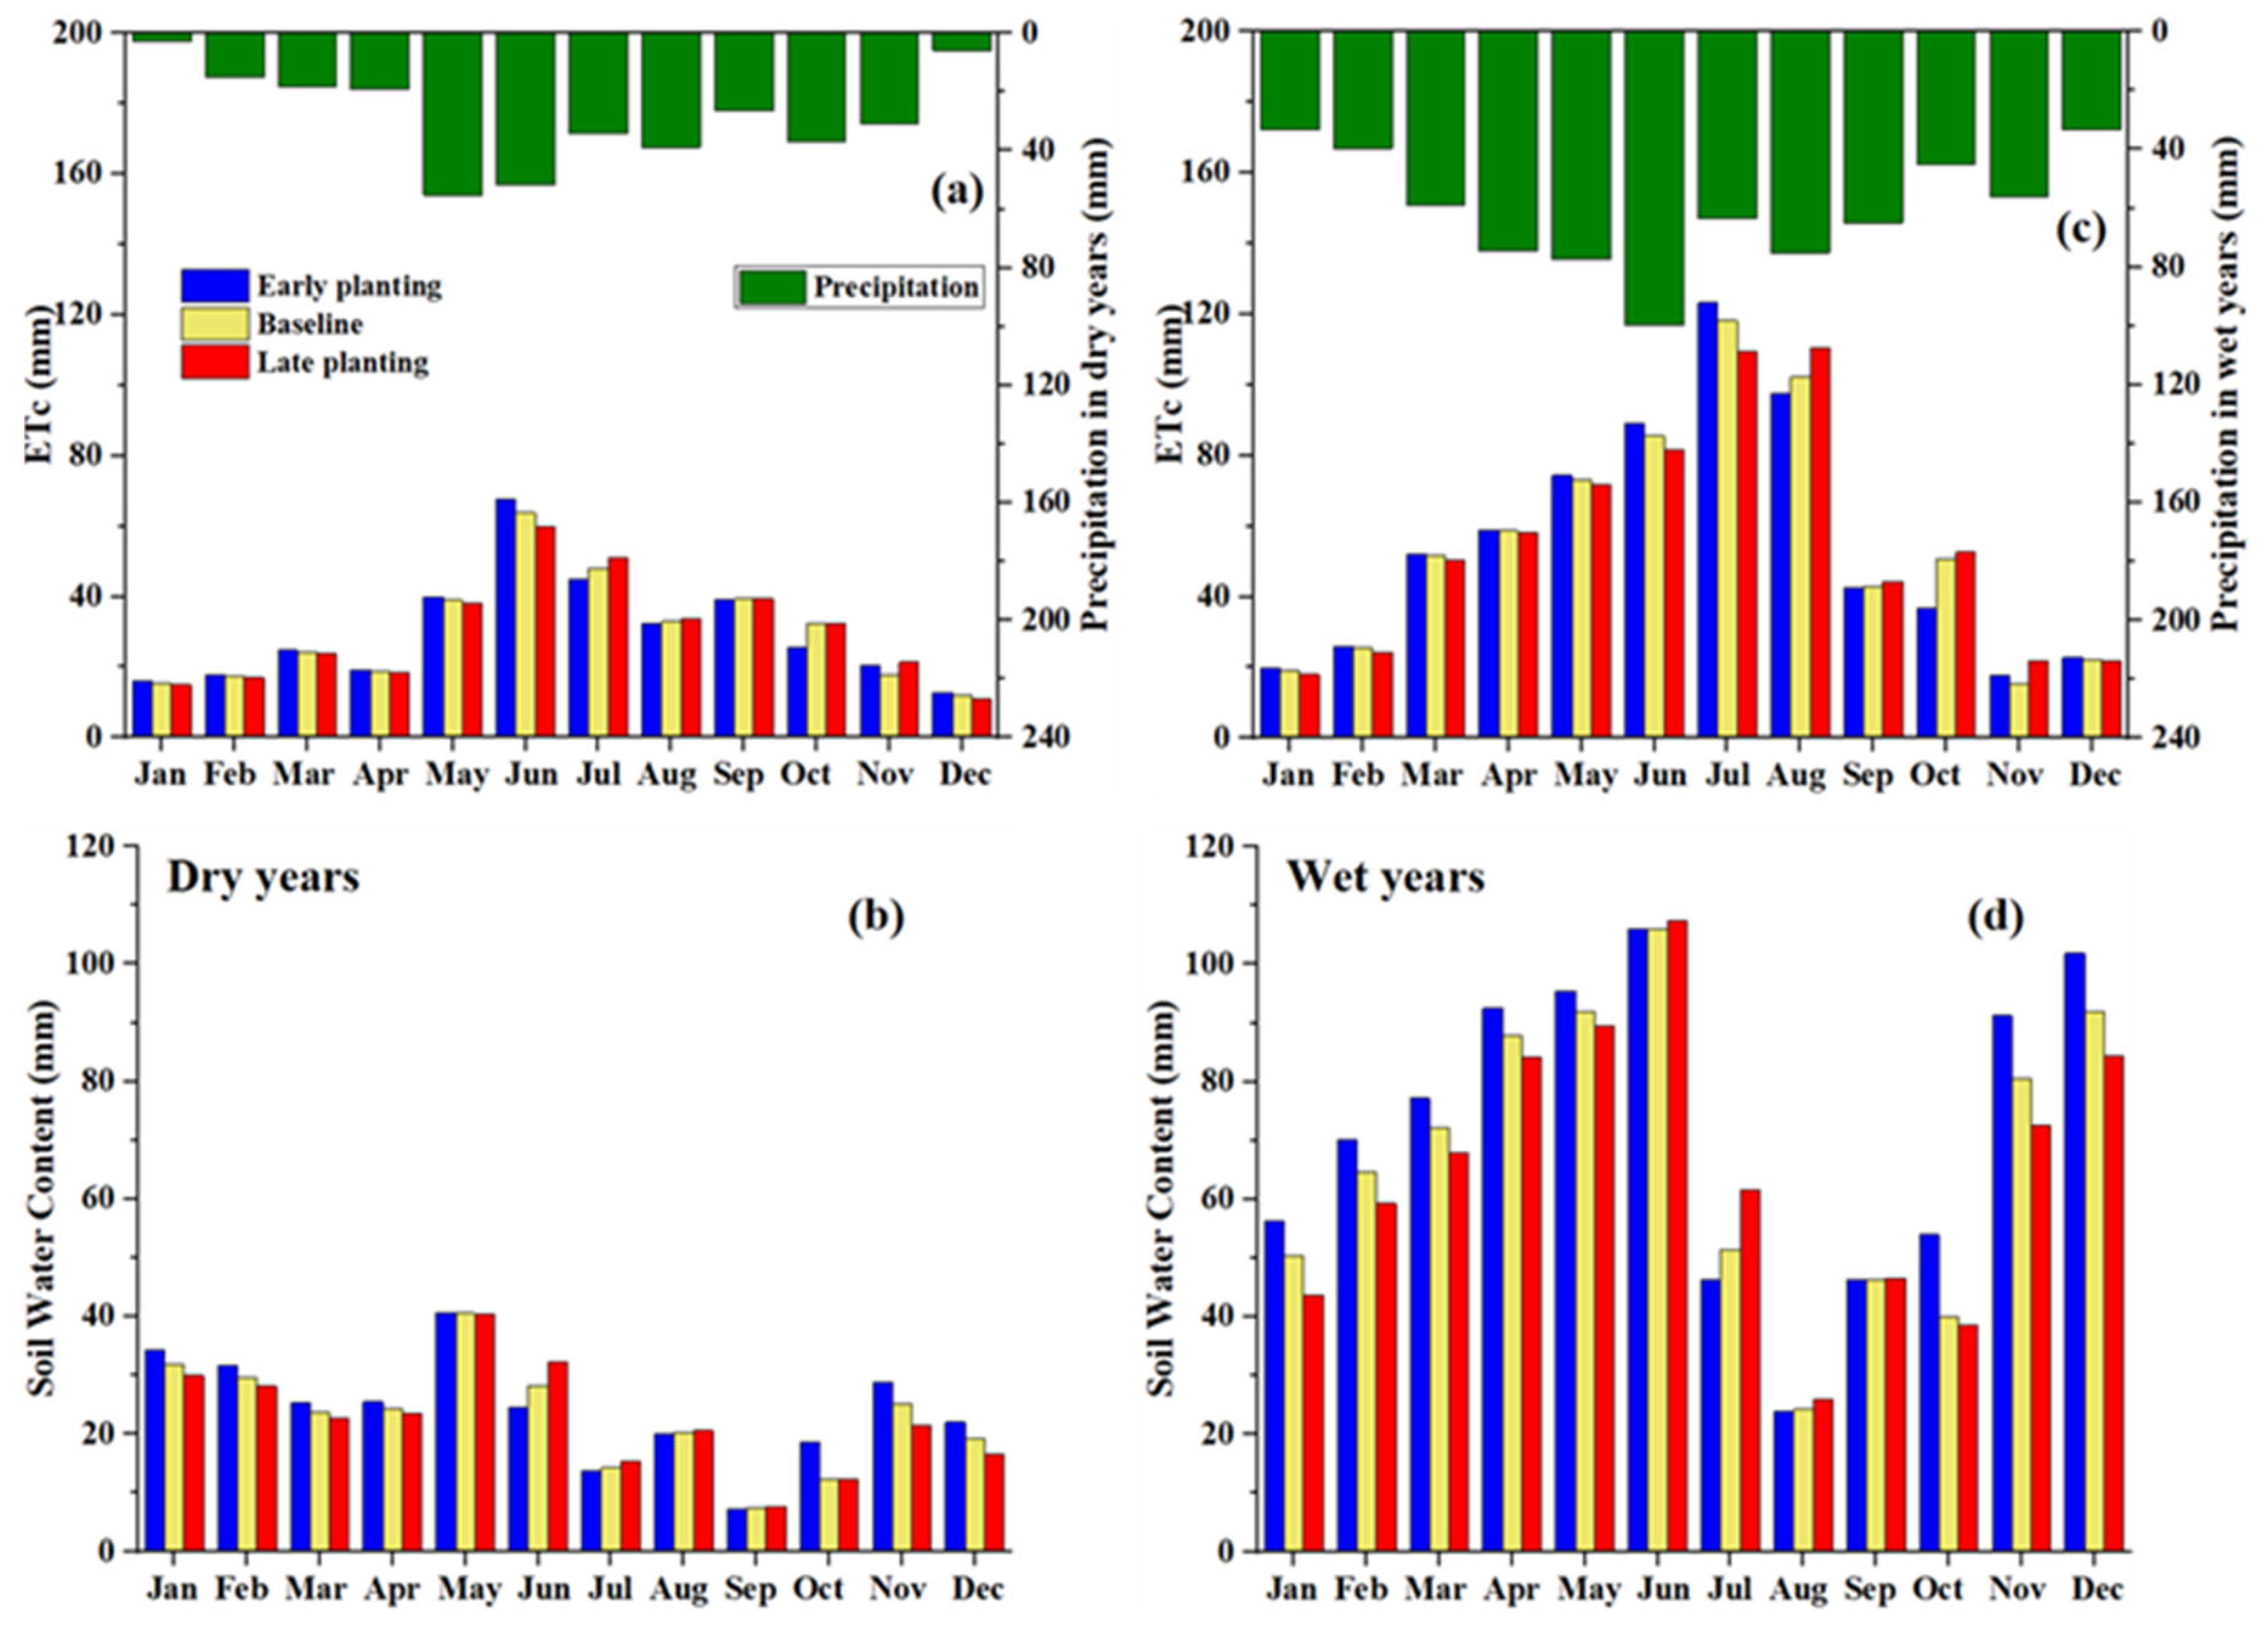
3.2. Impacts of Planting Dates on Water Conservation and Irrigated and Dryland Cotton Yield

Simulated irrigation amount increased by 7.3% with late planting of cotton during wet years relative to the baseline planting date (Table 4). However, early planting resulted in a reduction in irrigation amount by 16.4% during the wet years. This reduction was mainly caused by sufficient early season rainfall during the wet years in the Texas Panhandle. The percentage changes in ETc were within ±4% under different hydroclimatic years and planting dates (Table 4). A large variation was found in soil water content according to the hydroclimatic years and planting dates. The absolute changes in surface runoff and water yield were relatively small in the dry and normal years irrespective of the planting dates (Table 4). However, the surface runoff increased by 18.7% and 46.6% in the case of the early and late planting dates in the wet years, respectively. Simulated cotton yields were decreased by 14.4%, 25.4%, and 26.4% for the delayed planting date in the dry, normal, and wet years, respectively (Table 4). However, 1.3%, 7.6%, and 5.1% increase in irrigated cotton yield was found with early planting date in the dry, normal, and wet years, respectively (Table 4). Planting and harvesting dates impacted cotton growth and yield [36,37]. Early planting dates could extend the growing season and help producers avoid inclement weather in the late season [38]. Mauget et al. [10] also found that early planting could increase cotton yield by maximizing growing season degree days and total cool hours in the Texas Panhandle. Cotton requires accumulations of larger amounts of heat units to maturity compared to corn and sorghum (Sorghum bicolor L.) [39]. Therefore, the early planting of cotton might be feasible in improving yield and water conservation.
In the study basin, cotton is usually planted in the middle of May according to local field studies. Planting of cotton a half month ahead caused a clear increase in irrigation compared to the baseline planting date in May (54.5% and 24.3%) and July (10.7% and 15.6%) in the dry and normal years, and the late planting led to an apparent increase in irrigation in September of 151.8%, 77.6%, and 81.5% during the dry, normal, and wet years, respectively (Figure 4a,d and Figures S3a,d and S4a,b). A similar trend to irrigation was detected for monthly cotton ETc from May to September using the alternative planting dates under three hydroclimatic years (Figure 4b,e and Figures S3b,e and S4c,d). There were clearly high soil water contents in September (146.4%, 37.6%, and 39.7%) with the delayed planting of cotton for dry, normal, and wet years, which was associated with the increased irrigation amounts with the late planting date (Figure 4c,f and Figures S3c,f and S4e,f).
The assessment of results from the dryland cotton HRUs provided a better comparison because rainfall was the sole source of water input. Thus, the hydroclimatic years were the dominant factors for water balances. Results indicated a negligible change in ETc with the alternate planting dates under three hydroclimatic years (Table 5). An increase in soil water content was found in the case of the early planting of dryland cotton under different hydroclimatic regimes (Table 5). However, a decrease in soil water content was identified for the late planting date. Generally, the late planting date resulted in reductions in surface runoff and water yield, particularly in the wet years. An evident increase in surface runoff (42.4%) and water yield (28.5%) were also found for the early planting date in the wet years (Table 5). The delayed planting of dryland cotton led to an evident reduction in cotton yield of 9.8%, 21.1%, and 20.5% during the dry, normal, and wet years, respectively (Table 5). Nevertheless, dryland cotton yields increased by 0.7%, 9.4%, and 5.4% during dry, normal, and wet years, respectively, for the early planting date. Therefore, to increase both irrigated and dryland cotton yields, early sowing may be warranted in the Texas Panhandle.
Under the dryland cotton land use, changes in ETc were noticed in June (6.0% increase) and July (6.4% decrease) with the early planting date in the dry years relative to the baseline planting date (Figure 5a and Figure S5a). The opposite trends were found for the late planting date in the dry years. In the normal years, considerable variation in ETc was found in June (9.8% increase) and October (25.5% decrease) with early planting of dryland cotton (Figure S6a,b). Relatively small absolute changes were noticed for the delayed planting in the normal years. Notable changes in ETc were found in July (4.3% increase) and August (4.5% decrease) for the early planting in the wet years (Figure 5c and Figure S3c). By contrast, a 7.4% decrease and an 8.2% increase in ETc were detected in July and August, respectively, for the late planting date in the wet years. The marked increases in soil water content were only found in June (14.1%) and July (14.9% and 19.6%) during the dry, normal, and wet years, respectively, for the late planting date. However, distinct increases in soil water content were found from October to December and from October to May with the early planting of dryland cotton during the dry years and the normal and wet years, respectively (Figure 5b,d and Figures S5b,d and S6c,d).

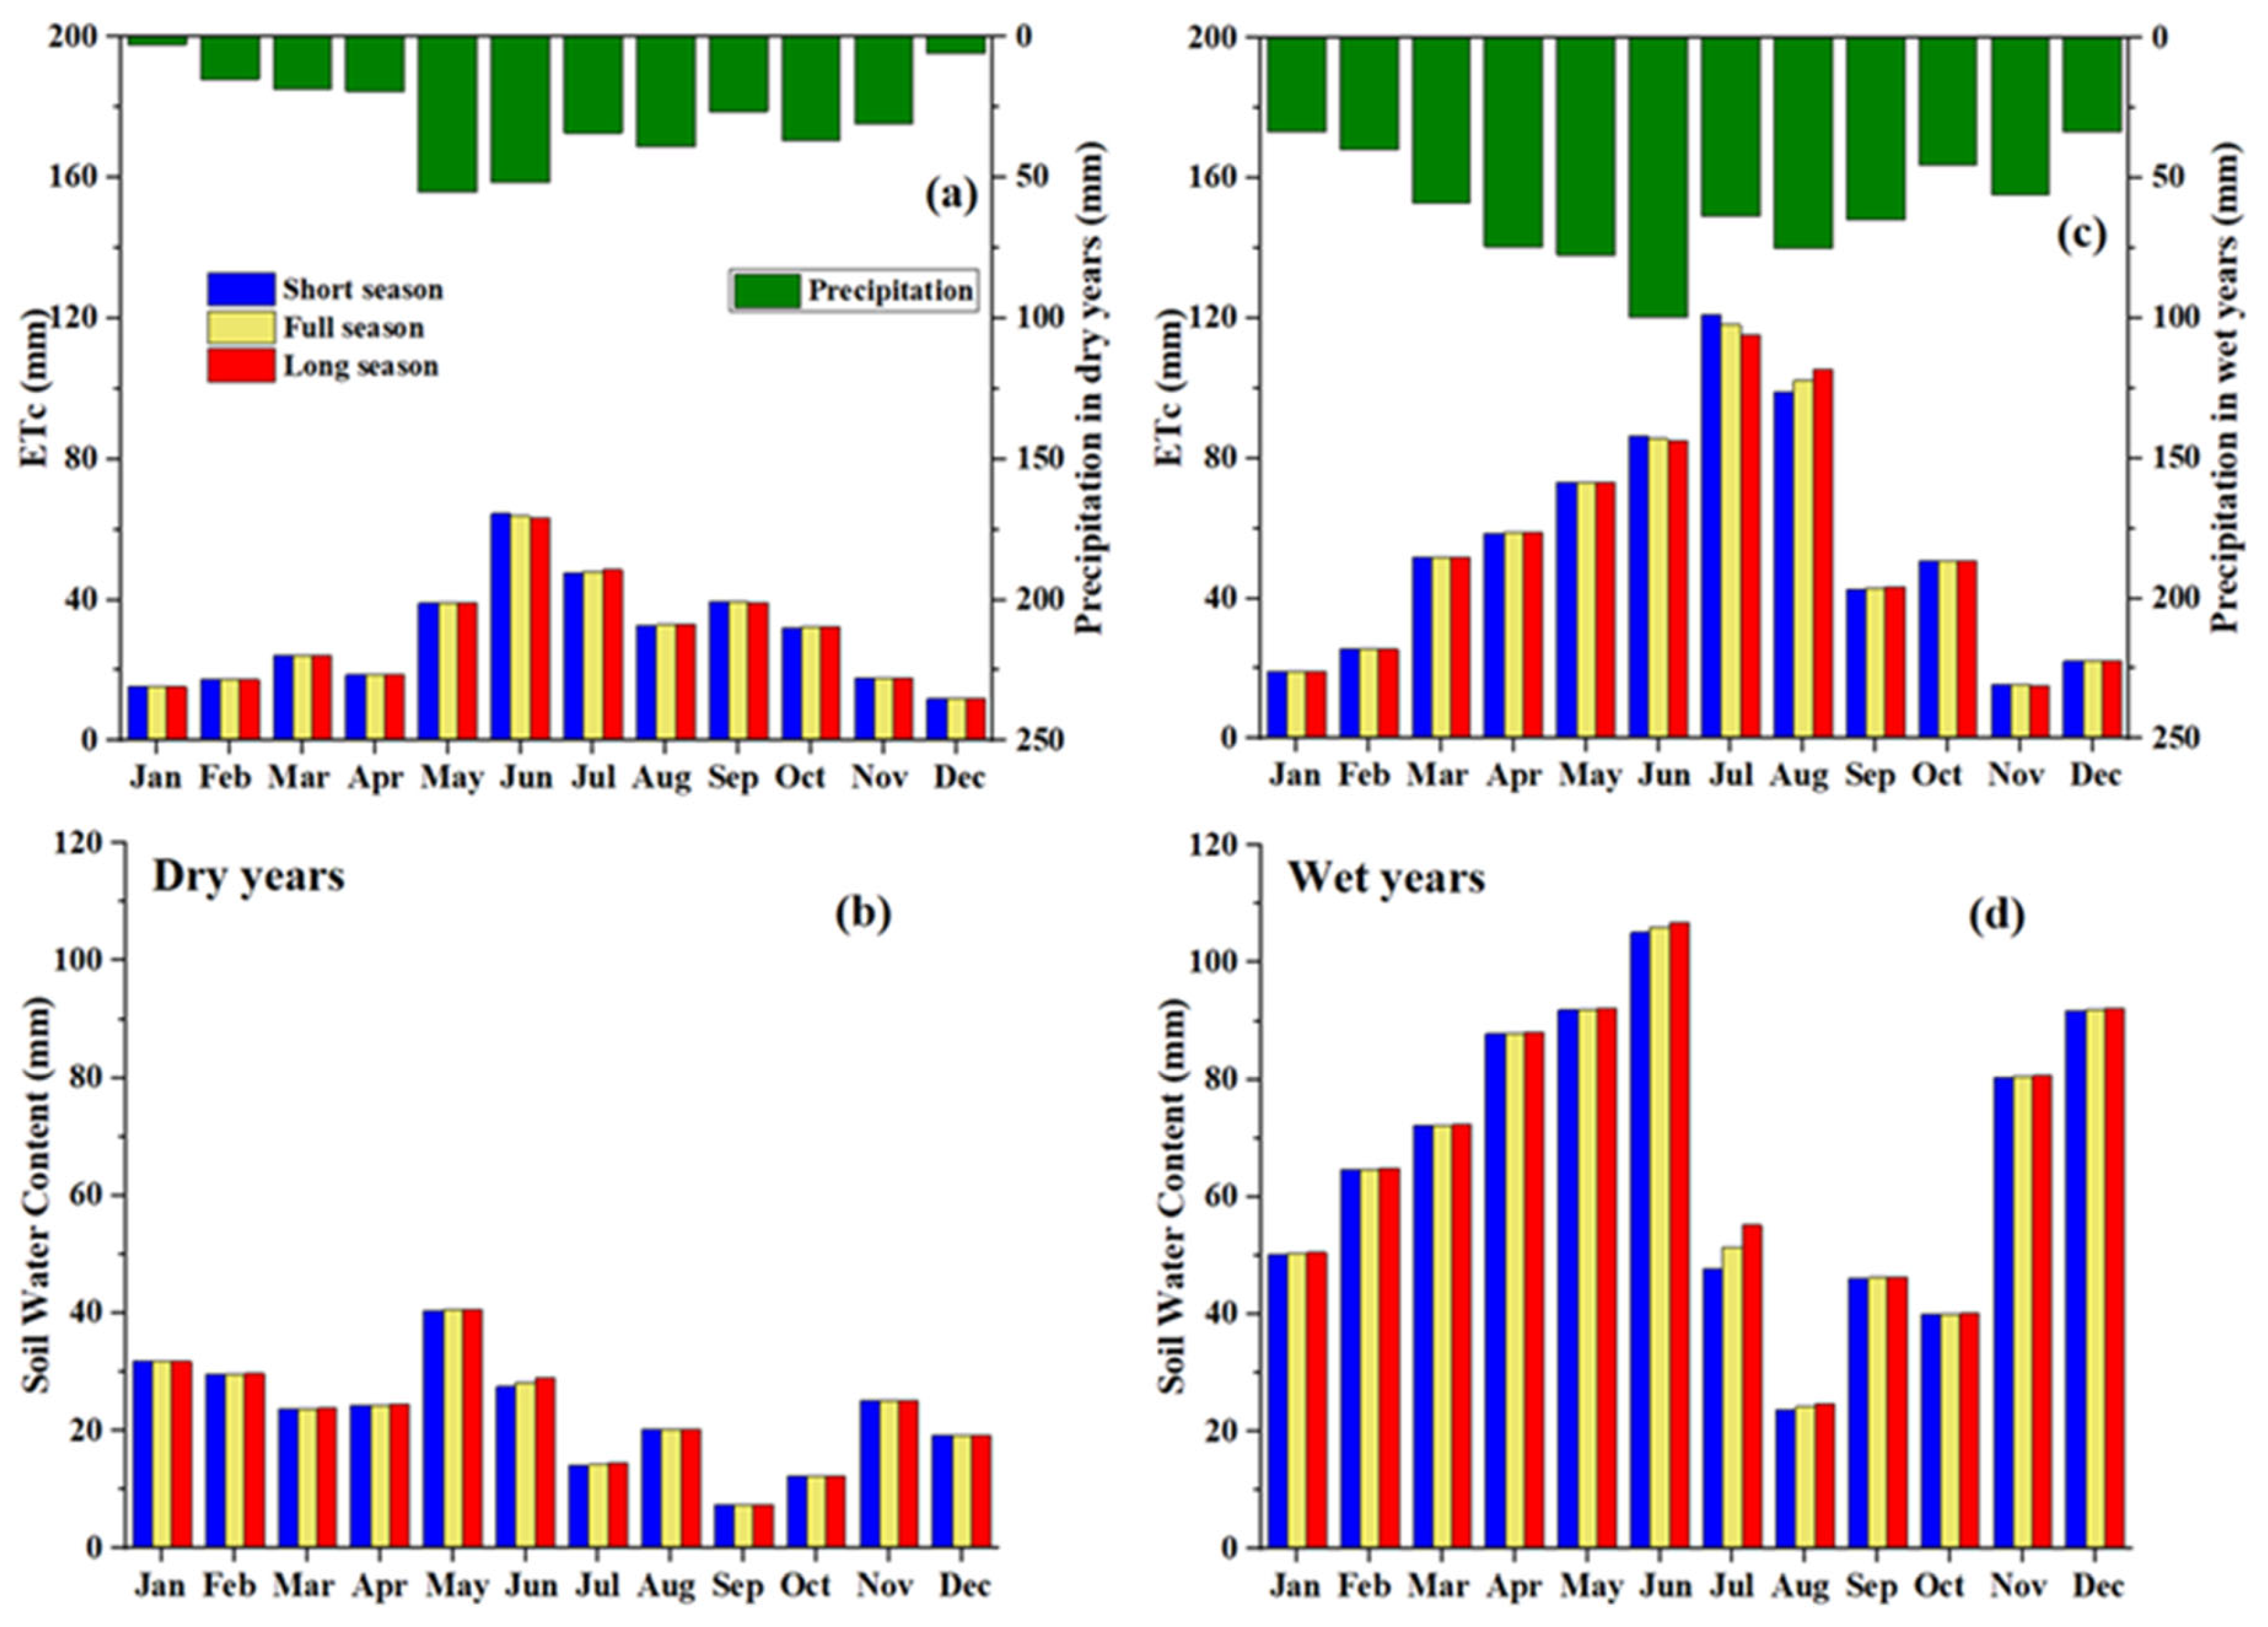
3.3. Effects of Different Cotton Maturity Cultivars under Both Irrigation and Dryland Conditions on Water Balances and Cotton Production

The absolute differences in the studied hydrologic parameters were small when using different maturity cotton cultivars under both irrigation and dryland management regardless of hydroclimatic years (Table 4 and Table 5). However, the short-season cultivar produced 11.6%, 15.7%, and 19.2% higher irrigated cotton yield during the dry, normal, and wet years, respectively, compared to their respective baseline scenarios. Those increases in dryland cotton yields were 4.0%, 10.1%, and 10.0% in the dry, normal, and wet years. Similar percentage reductions were found with the long-season cultivar in various hydroclimatic regimes under the irrigation and dryland conditions (Table 4 and Table 5). Like alternate planting dates, different maturity cotton cultivars highlighted the importance of heat unit accumulation for crop development. The concept of heat units emerged from observations that plants do not grow below a threshold temperature. This temperature for cotton is 15.6 °C. Cotton growth and development are directly related to accumulated heat units when there are no other environmental limiting factors [40]. Recently, Masasi et al. [41] also reported that under adequate irrigation supply, cotton yield responds positively and strongly to the increase of heat units using the AquaCrop model in the U.S. Southern Great Plains. As for the monthly analysis, small recognizable changes in irrigation and ETc were found in June and July in the dry years among diverse maturity cultivars (Figure 6a,b and Figure S7a,b,d,e). A clear decrease in irrigation and ETc was found in July with the long-season cultivar in the normal and wet years (Figure 6d,e and Figures S7a,b,d,e and S8a,b,c,d). In general, no considerable changes were noticed in soil water content with the changes in maturity cotton cultivars in the case of irrigated cotton under three hydroclimatic regimes (Figure 6c,f and Figures S7c,f and S8e,f). There was almost no influence of maturity cultivars on ETc and soil water content under dryland cotton farming (Figure 7 and Figures S9 and S10). Although the current climate in the Texas Panhandle is suitable for cotton production, short-season cultivars are more promising for a yield increase. It is worth noting that the short-season cultivar is crucial for dryland management as it can mature early and reduce water stress duration relative to the full- and long-season cultivars in this semi-arid environment. Therefore, the selection of appropriate maturity cultivars is necessary in view of the challenging environment for cotton production in the Texas Panhandle.

4. Conclusions

An assessment of some potential cultivation practices on water conservation and cotton production was performed in the DMFB basin in the semi-arid Texas Panhandle region using the SWAT-MAD model. Modeling results indicated that using a relatively small irrigation application depth for cotton resulted in increased seasonal irrigation and ETc under various hydroclimatic years. By contrast, the large irrigation application depth for cotton showed water-saving and yield-boosting effects. The early planting date demonstrated the potential for water conservation and yield increase for cotton under both irrigation and dryland conditions, which allowed for the accumulation of relatively high heat unit totals for crop physiological maturity. It is intuitive that the early planting date could favor a yield increase more in the normal and wet years compared to the dry years. Similar to early planting, the short-season cotton cultivar highlighted great potential for yield improvement under this climatic condition. In summary, larger irrigation application depths for cotton could primarily support groundwater conservation. Early planting of irrigated and dryland cotton might be considered for enhancing cotton yields and reducing water consumption in the Texas Panhandle, especially in wetter years. Additionally, using a short-season cultivar could be an option for further improving cotton production capacity and narrowing the yield gap in the Texas Panhandle. In this study, we did not completely consider the spatial variations in agricultural inputs/practices due to the limited information available. In addition, the spatial inconsistency with the actual field boundaries based on the HRU definition could result in some uncertainties. Therefore, the modeling results have a certain level of uncertainty when representing the real world. For these reasons, producers should be cautious when interpreting our findings for decision making in their specific fields.

Supplementary Materials

The following supporting information can be downloaded at: https://www.mdpi.com/article/10.3390/agriculture12010017/s1, Table S1: Default and calibrated values of hydrologic and cotton growth parameters using the SWAT-MAD model in the Double Mountain Fork Brazos basin. Figure S1: Change percentages of average monthly irrigation, crop evapotranspiration (ETc), and soil water content under dry and wet years using different irrigation application depths relative to the baseline irrigation depth in the irrigated cotton HRUs in the Double Mountain Fork Brazos basin. Figure S2: Comparison of average monthly irrigation, crop evapotranspiration (ETc), and soil water content under normal years using different irrigation application depths in the irrigated cotton HRUs in the Double Mountain Fork Brazos basin. Figure S3: Change percentages of average monthly irrigation, crop evapotranspiration (ETc), and soil water content under dry and wet years using various planting dates relative to the baseline planting date in the irrigated cotton HRUs in the Double Mountain Fork Brazos basin. Figure S4: Comparison of average monthly irrigation, crop evapotranspiration (ETc), and soil water content under normal years using various planting dates in the irrigated cotton HRUs in the Double Mountain Fork Brazos basin. Figure S5: Change percentages of average monthly crop evapotranspiration (ETc) and soil water content under dry and wet years using various planting dates relative to the baseline periods in the dryland cotton HRUs in the Double Mountain Fork Brazos basin. Figure S6: Comparison of average monthly crop evapotranspiration (ETc) and soil water content under normal years using various planting dates in the dryland cotton HRUs in the Double Mountain Fork Brazos basin. Figure S7: Change percentages of average monthly irrigation, crop evapotranspiration (ETc), and soil water content under dry and wet years using diverse maturity cultivars relative to the baseline cultivar in the irrigated cotton HRUs in the Double Mountain Fork Brazos basin. Figure S8: Comparison of average monthly irrigation, crop evapotranspiration (ETc), and soil water content under normal years using diverse maturity cultivars in the irrigated cotton HRUs in the Double Mountain Fork Brazos basin. Figure S9: Change percentages of average monthly crop evapotranspiration (ETc) and soil water content under dry and wet years using diverse maturity cultivars relative to the baseline cultivar in the dryland cotton HRUs in the Double Mountain Fork Brazos basin. Figure S10: Comparison of average monthly crop evapotranspiration (ETc) and soil water content under normal years using diverse maturity cultivars in the dryland cotton HRUs in the Double Mountain Fork Brazos basin.

Author Contributions

Conceptualization, L.T., Y.Z., and Y.C.; methodology, L.T., Y.Z., and Y.C.; software, L.T., Y.Z., Y.C., and G.W.M.; data curation, L.T., Y.Z., Y.C., and S.A.; writing—original draft preparation, L.T.; visualization, L.T. and Y.Z.; investigation, L.T., Y.Z., G.W.M., S.A., and D.K.B.; supervision, Y.C.; writing—reviewing and editing, Y.Z., Y.C., G.W.M., S.A., and D.K.B. All authors have read and agreed to the published version of the paper.

Funding

This research was funded by the Chinese Universities Scientific Fund under award number 1191-15051002. The APC was funded by 1191-15051002. The research was also supported by the National Institute of Food and Agriculture, U.S. Department of Agriculture under award numbers NIFA-2021-67019-33684 and NIFA-2012-67009-19595.

Institutional Review Board Statement

Not applicable.

Informed Consent Statement

Not applicable.

Data Availability Statement

Data sharing is not applicable.

Acknowledgments

This research was supported partially by the Ogallala Aquifer Program, a consortium between the USDA-Agricultural Research Service, Kansas State University, Texas A&M AgriLife Research, Texas A&M AgriLife Extension Service, Texas Tech University, and West Texas A&M University. We gratefully thank the anonymous reviewers for their valuable comments and suggestions for improving this paper.

Conflicts of Interest

The authors declare no conflict of interest.

References

  1. National Agricultural Statistics Service (NASS). 2019. Available online: https://www.nass.usda.gov (accessed on 6 October 2020).
  2. Ale, S.; Omani, N.; Himanshu, S.K.; Bordovsky, J.P.; Thorp, K.R.; Barnes, E.M. Determining optimum irrigation termination periods for cotton production in the Texas High Plains. Trans. ASABE 2020, 63, 105–115. [Google Scholar] [CrossRef]
  3. Crouch, M.; Guerrero, B.; Amosson, S.; Marek, T.; Almas, L. Analyzing potential water conservation strategies in the Texas Panhandle. Irrig. Sci. 2020, 38, 559–567. [Google Scholar] [CrossRef]
  4. Colaizzi, P.D.; Gowda, P.H.; Marek, T.H.; Porter, D.O. Irrigation in the Texas High Plains: A brief history and potential reductions in demand. Irrig. Drain. 2009, 58, 257–274. [Google Scholar] [CrossRef]
  5. Warren, J.; Stoecker, A.; Gatlin, J.; Ramaswam, K.; Jones, R.; Campiche, J.; Paul, A. Optimizing the Economic Value Water from Ogallala Aquifer Used for Irrigation; Final Technical Report; Oklahoma State University: Stillwater, OK, USA, 2017; Available online: https://ojs.library.okstate.edu/osu/index.php/OWRC/article/view/7313 (accessed on 24 December 2021).
  6. Gowda, P.H.; Baumhardt, R.L.; Esparza, A.M.; Marek, T.H.; Howell, T.A. Suitability of cotton as an alternative crop in the Ogallala Aquifer region. Agron. J. 2007, 99, 1397–1403. [Google Scholar] [CrossRef] [Green Version]
  7. Wheeler, E.; Johnson, J.; Segarra, E.; Johnson, P. The impacts of the Ogallala Aquifer characteristics on water use and conservation: The case of Hale County. In Proceedings of the High Plains Groundwater Resources: Challenges and Opportunities; Rainwater, K.A., Zobeck, T.M., Eds.; Lubbock, TX, USA, 7–9 December 2004, Texas Tech University, Water Resources Center: Lubbock, TX, USA, 2004; pp. 72–81. [Google Scholar]
  8. Marek, G.W.; Marek, T.H.; Evett, S.R.; Chen, Y.; Heflin, K.R.; Moorhead, J.E.; Brauer, D.K. Irrigation management effects on crop water productivity for maize production in the Texas High Plains. Water. Conserv. Sci. Eng. 2021, 6, 37–43. [Google Scholar] [CrossRef]
  9. Liu, X. Effect of Different Production Practices on the Development of Verticillium Wilt and Cotton Fiber Quality. PhD. Dissertation, Texas Tech University, Lubbock, TX, USA, 2017. [Google Scholar]
  10. Mauget, S.; Ulloa, M.; Dever, J. Planting date effects on cotton lint yield and fiber quality in the U.S. Southern High Plains. Agriculture 2019, 9, 82. [Google Scholar] [CrossRef] [Green Version]
  11. Chen, J.P.; Xu, W.W.; Burke, J.J.; Xin, Z.G. Role of phosphatidic acid in high temperature tolerance in maize. Crop. Sci. 2010, 50, 2506–2515. [Google Scholar] [CrossRef]
  12. Lauer, J. Proven Corn Management Practices and Practical Tips when Prices Are Down. 2000. Available online: http://corn.agronomy.wisc.edu/AA/pdfs/A026.pdf (accessed on 10 October 2020).
  13. Xue, Q.; Marek, T.H.; Xu, W.; Bell, J. Irrigated corn production and management in the Texas High Plains. J. Contemp. Water. Res. Educ. 2017, 162, 31–41. [Google Scholar] [CrossRef] [Green Version]
  14. Himanshu, S.K.; Ale, S.; Bordovsky, J.; Darapuneni, M. Evaluation of crop-growth-stage-based deficit irrigation strategies for cotton production in the Southern High Plains. Agric. Water. Manage. 2019, 225, 105782. [Google Scholar] [CrossRef]
  15. Dechmi, F.; Skhiri, A. Evaluation of best management practices under intensive irrigation using SWAT model. Agric. Water. Manage. 2013, 123, 55–64. [Google Scholar] [CrossRef] [Green Version]
  16. Sun, C.; Ren, L. Assessing crop yield and crop water productivity and optimizing irrigation scheduling of winter wheat and summer maize in the Haihe plain using SWAT model. Hydrol. Process. 2014, 28, 2478–2498. [Google Scholar] [CrossRef]
  17. Arnold, J.G.; Srinivasan, R.; Muttiah, R.S.; Williams, J.R. Large area hydrologic modeling and assessment Part I: Model Development. J Am. Water Resour. Assoc. 1998, 34, 73–89. [Google Scholar] [CrossRef]
  18. McInerney, D.; Thyer, M.; Kavetski, D.; Githui, F.; Thayalakumaran, T.; Liu, M.; Kuczera, G. The importance of spatiotemporal variability in irrigation inputs for hydrological modeling of irrigated catchments. Water. Resour. Res. 2018, 54, 6792–6821. [Google Scholar] [CrossRef]
  19. Qi, J.; Zhang, X.; McCarty, G.W.; Sadeghi, A.M.; Cosh, M.H.; Zeng, X.; Gao, F.; Daughtry, C.S.T.; Huang, C.; Lang,, M.; et al. Assessing the performance of a physically-based soil moisture module integrated within the Soil and Water Assessment Tool. Environ. Model. Softw. 2018, 109, 329–341. [Google Scholar] [CrossRef]
  20. Wu, D.; Cui, Y.; Wang, Y.; Chen, M.; Luo, Y.; Zhang, L. Reuse of return flows and its scale effect in irrigation systems based on modified SWAT model. Agric. Water. Manag. 2019, 213, 280–288. [Google Scholar] [CrossRef]
  21. Chen, Y.; Marek, G.W.; Marek, T.H.; Brauer, D.K.; Srinivasan, R. Improving SWAT auto-irrigation functions for simulating agricultural irrigation management using long-term lysimeter field data. Environ. Model. Softw. 2018, 99, 25–38. [Google Scholar] [CrossRef]
  22. Soil Survey Staff. Keys to Soil Taxonomy, 11th ed.; USDA—Natural Resources Conservation Service: Washington, DC, USA, 2014.
  23. Srinivasan, R.; Zhang, X.; Arnold, J. SWAT ungauged: Hydrological budget and crop yield predictions in the upper Mississippi river basin. Trans. ASABE 2010, 53, 1533–1546. [Google Scholar] [CrossRef]
  24. Padhiary, J.; Swain, J.B.; Patra, K.C. Optimized irrigation scheduling using SWAT for improved crop water productivity. Irrig. Drain. 2020, 69, 387–397. [Google Scholar] [CrossRef]
  25. Uniyal, B.; Jha, M.K.; Verma, A.K.; Anebagilu, P.K. Identification of critical areas and evaluation of best management practices using SWAT for sustainable watershed management. Sci. Total. Environ. 2020, 744, 140737. [Google Scholar] [CrossRef]
  26. Zhang, X.; Ren, L. Simulating and assessing the effects of seasonal fallow schemes on the water-food-energy nexus in a shallow groundwater-fed plain of the Haihe River basin of China. J. Hydrol. 2021, 595, 125992. [Google Scholar] [CrossRef]
  27. Abbaspour, K.C.; Vejdani, M.; Haghighat, S. SWAT-CUP Calibration and Uncertainty Programs for SWAT. In MODSIM 2007: International Congress on Modelling and Simulation; Oxley, L., Kulasiri, D., Eds.; Modelling and Simulation Society of Australia and New Zealand: Melbourne, VIC, Australia, 2007; pp. 1603–1609. [Google Scholar]
  28. Nash, J.E.; Sutcliffe, J.V. River flow forecasting through conceptual models part I—A discussion of principles. J. Hydrol. 1970, 10, 282–290. [Google Scholar] [CrossRef]
  29. Legates, D.R.; McCabe, G.J. Evaluating the use of “goodness-of-fit” measures in hydrologic and hydroclimatic model validation. Water. Resour. Res. 1999, 35, 233–241. [Google Scholar] [CrossRef]
  30. Gupta, H.V.; Sorooshian, S.; Yapo, P.O. Status of automatic calibration for hydrologic models: Comparison with multilevel expert calibration. J. Hydrol. Eng. 1999, 4, 135–143. [Google Scholar] [CrossRef]
  31. Moriasi, D.N.; Arnold, J.G.; Van Liew, M.W.; Bingner, R.L.; Harmel, R.D.; Veith, T.L. Model evaluation guidelines for systematic quantification of accuracy in watershed simulations. Trans. ASABE 2007, 50, 885–900. [Google Scholar] [CrossRef]
  32. National Agricultural Statistics Service (NASS)—Irrigation and Water Management Survey. 2020. Available online: https://www.nass.usda.gov/Surveys/Guide_to_NASS_Surveys/Farm_and_Ranch_Irrigation (accessed on 10 October 2020).
  33. Chen, Y.; Marek, G.; Marek, T.; Moorhead, J.; Heflin, K.; Brauer, D.; Gowda, P.; Srinivasan, R. Assessment of alternative agricultural land use options for extending the availability of the Ogallala Aquifer in the Northern High Plains of Texas. Hydrol. 2018, 5, 53. [Google Scholar] [CrossRef] [Green Version]
  34. Marek, G.W.; Chen, Y.; Marek, T.H.; Heflin, K.R.; O’Shaughnessy, S.A.; Gowda, P.H.; Brauer, D.K. Assessing planting date effects on seasonal water use of full-and short-season maize using SWAT in the southern Ogallala Aquifer region. Irrig. Sci. 2020, 38, 77–87. [Google Scholar] [CrossRef]
  35. Mekonentiku, K.; Singh, P. Identification of gaps and remedies for Center Pivot Sprinkler Irrigation System in North-West Ethiopia. J. Energy Res. Rev. 2019, 3, 1–6. [Google Scholar] [CrossRef] [Green Version]
  36. Davidonis, G.H.; Johnson, A.S.; Landivar, J.A.; Fernandez, C.J. Cotton fiber quality is related to boll location and planting date. Agron. J. 2004, 96, 42–47. [Google Scholar] [CrossRef]
  37. Unruh, B.L.; Silvertooth, J.C. Planting and irrigation termination timing effects on the yield of Upland and Pima cotton. J. Prod. Agric. 1997, 10, 74–79. [Google Scholar] [CrossRef]
  38. Steiner, J.J.; Jacobsen, T.A. Time of planting and diurnal soil temperature effects on cotton seedling field emergence and rate of development. Crop. Sci. 1992, 32, 238–244. [Google Scholar] [CrossRef]
  39. Esparza, A.M.; Gowda, P.H.; Baumhardt, R.L.; Marek, T.; Howell, T.A. Heat unit availability for cotton production in the Ogallala Aquifer region of the United States. J. Cotton. Sci. 2007, 11, 110–117. [Google Scholar]
  40. Peng, S.; Krieg, D.R.; Hicks, S.K. Cotton lint yield response to accumulated heat units and soil water supply. Field. Crops Res. 1989, 19, 253–262. [Google Scholar] [CrossRef]
  41. Masasi, B.; Taghvaeian, S.; Gowda, P.H.; Marek, G.; Boman, R. Validation and application of AquaCrop for irrigated cotton in the Southern Great Plains of US. Irrig. Sci. 2020, 38, 593–607. [Google Scholar] [CrossRef]
Figure 1. Location, land uses, weather stations, and stream gaging stations of the Double Mountain Fork Brazos basin.
Agriculture 12 00017 g001
Figure 2. Flowchart of the modeled cultivation practices in the Texas Panhandle.
Agriculture 12 00017 g002
Figure 3. Comparison of average monthly irrigation (a,d), crop evapotranspiration (ETc) (b,e), and soil water content (c,f) during dry and wet years using different irrigation application depths in the irrigated cotton HRUs in the Double Mountain Fork Brazos basin.
Agriculture 12 00017 g003
Figure 4. Comparison of average monthly irrigation (a,d), crop evapotranspiration (ETc) (b,e), and soil water content (c,f) during dry and wet years using different planting dates in the irrigated cotton HRUs in the Double Mountain Fork Brazos basin.
Agriculture 12 00017 g004
Figure 5. Comparison of average monthly crop evapotranspiration (ETc) (a,c) and soil water content (b,d) during dry and wet years using different planting dates in the dryland cotton HRUs in the Double Mountain Fork Brazos basin.
Agriculture 12 00017 g005
Figure 6. Comparison of average monthly irrigation (a,d), crop evapotranspiration (ETc) (b,e), and soil water content (c,f) during dry and wet years using different maturity cultivars in the irrigated cotton HRUs in the Double Mountain Fork Brazos basin.
Agriculture 12 00017 g006
Figure 7. Comparison of average monthly crop evapotranspiration (ETc) (a,c) and soil water content (b,d) during dry and wet years using different maturity cultivars in the dryland cotton HRUs in the Double Mountain Fork Brazos basin.
Agriculture 12 00017 g007
Table 1. Performance statistics for monthly streamflow prediction on two USGS gages in the Double Mountain Fork Brazos basin using the SWAT-MAD model.
StreamflowGage I (08079600)Gage II (08080500)
Calibration
(1994–2001)
Validation
(2002–2009)
Calibration
(1994–2001)
Validation
(2002–2009)
Nash-Sutcliffe efficiency
(NSE)
0.86
(Very good #)
0.59
(Satisfactory)
0.63
(Satisfactory)
0.64
(Satisfactory)
R20.880.710.670.75
Percent bias (PBIAS; %)14.6
(Good)
8.5
(Very good)
12.9
(Good)
−12.6
(Good)
# General model performance ratings suggested by Moriasi [31] for monthly predictions of streamflow.
Table 2. Management practices for irrigated and dryland cotton production under the baseline scenario in the Double Mountain Fork Brazos basin.
No.OperationsDescriptionManagement Information
Irrigated cotton (generic variety)
1Tillage (Tillage on 1 April)
TILL_IDTillage IDGeneric spring plowing #
2Fertilizer application (1 May)
FERT_IDFertilizer IDUrea
FRT_KGAmount of fertilizer applied300.7 (kg ha−1) #
3Begin growing season (Planting on 15 May)Default
Accumulation of heat units to maturity2354 °C-day ξ
4Auto irrigation (Start date: 15 May; End date: 15 September)
WSTRS_IDWater stress identifierManagement allowed depletion
AUTO_WSTRSWater stress threshold0.75
IRR_MXIrrigation application depth25.4 mm (1 inch)
5Harvest and kill (Harvest and kill on 31 October)Default
Dryland cotton (generic variety)
1Tillage (Tillage on April 1)
TILL_IDTillage IDGeneric spring plowing #
2Fertilizer application (1 May)
FERT_IDFertilizer IDUrea
FRT_KGAmount of fertilizer applied150 (kg ha−1) #
3Begin growing season (Planting on 15 May)Default
Accumulation of heat units to maturity2354 °C-day ξ
4Harvest and kill (Harvest and kill on 31 October)Default
# The management methods and parameters were based on published reports and local expertise. ξ Accumulation of heat units to maturity for cotton was estimated using the SWAT-PHU program (https://swat.tamu.edu/software/; accessed on 24 December 2021).
Table 3. Descriptions of simulated scenarios in the Double Mountain Fork Brazos basin.
Scenario IDScenario Description
(1)Irrigation application depth of 12.7 mm in irrigated cotton HRUs (Small irrigation depth)
(2)Irrigation application depth of 38.1 mm in irrigated cotton HRUs (Large irrigation depth)
(3)Accumulation of heat units to maturity for cotton reduced by 5% (2236 °C-day) in irrigated cotton HRUs (Short-season irrigated cotton)
(4)Accumulation of heat units to maturity for cotton increased by 5% (2472 °C-day) in irrigated cotton HRUs (Long-season irrigated cotton)
(5)Accumulation of heat units to maturity for cotton reduced by 5% (2236 °C-day) in dryland cotton HRUs (Short-season dryland cotton)
(6)Accumulation of heat units to maturity for cotton increased by 5% (2472 °C-day) in dryland cotton HRUs (Long-season dryland cotton)
(7)Planting date of 1 May and harvest date of 15 October in irrigated cotton HRUs (Early planting of irrigated cotton)
(8)Planting date of 30 May and harvest date of 15 November in irrigated cotton HRUs (Late planting of irrigated cotton)
(9)Planting date of 1 May and harvest date of 15 October in dryland cotton HRUs (Early planting of dryland cotton)
(10)Planting date of 30 May and harvest date of 15 November in dryland cotton HRUs (Late planting of dryland cotton)
Table 4. Comparison of the average annual water balance parameters and cotton yield under three hydroclimatic regimes using different irrigation application depths, planting dates, and maturity cultivars in the irrigated cotton HRUs in the Double Mountain Fork Brazos basin.
ScenariosIrrigation (mm)ETc (mm)Soil Water
Content (mm)
Surface
Runoff (mm)
Water
Yield (mm)
Cotton
Yield (Mg ha−1)
Baseline dry years493.4825.932.90.00041.153.07
Small irrigation depth510.6 (3.5 #)843.3 (2.1)31.4 (−4.7)0.0002 (−57.5)1.12 (−2.7)3.03 (−1.4)
Large irrigation depth484.4 (−1.8)817.0 (−1.1)33.7 (2.5)0.0009 (115.4)1.19 (3.3)3.12 (1.6)
Early planting491.4 (−0.4)823.0 (−0.4)33.3 (1.1)0.0018 (332.0)1.17 (1.3)3.11 (1.3)
Late planting502.2 (1.8)835.2 (1.1)34.1 (3.6)0.0005 (29.1)1.15 (−0.1)2.63 (−14.4)
Short season500.1 (1.4)832.7 (0.8)32.7 (−0.6)0.0005 (22.2)1.16 (0.8)3.43 (11.6)
Long season489.3 (−0.8)822.0 (−0.5)32.9 (−0.2)0.0005 (18.0)1.14 (−0.9)2.69 (−12.3)
Baseline normal years341.9812.958.64.375.592.68
Small irrigation depth354.0 (3.6)825.4 (1.5)56.4 (−3.7)4.12 (−5.8)5.32 (−4.9)2.65 (−1.0)
Large irrigation depth333.5 (−2.4)804.2 (−1.1)60.3 (3.0)4.56 (4.4)5.81 (3.9)2.70 (0.8)
Early planting336.6 (−1.5)806.0 (−0.9)62.9 (7.3)4.48 (2.5)5.71 (2.0)2.88 (7.6)
Late planting327.0 (−4.4)802.6 (−1.3)51.3 (−12.5)4.43 (1.4)5.64 (0.8)2.00 (−25.4)
Short season350.1 (2.4)820.5 (0.9)58.7 (0.1)4.33 (−0.8)5.58 (−0.3)3.10 (15.7)
Long season334.5 (−2.2)805.7 (−0.9)59.4 (1.3)4.42 (1.2)5.64 (0.8)2.27 (−15.4)
Baseline wet years217.0861.6110.43.134.622.19
Small irrigation depth218.6 (0.8)863.2 (0.2)108.6 (−1.6)2.80 (−10.7)4.26 (−7.8)2.17 (−1.2)
Large irrigation depth216.3 (−0.3)860.5 (−0.1)112.0 (1.4)3.37 (7.5)4.89 (5.7)2.20 (0.5)
Early planting181.4 (−16.4)831.7 (−3.5)114.1 (3.3)3.72 (18.7)5.18 (12.0)2.31 (5.1)
Late planting232.7 (7.3)860.1 (−0.2)115.7 (4.8)4.59 (46.6)6.12 (32.4)1.61 (−26.4)
Short season219.5 (1.2)866.3 (0.5)110.1 (−0.3)3.11 (−0.8)4.61 (−0.3)2.62 (19.2)
Long season209.1 (−3.6)853.0 (−1.0)111.6 (1.1)3.31 (5.7)4.79 (3.7)1.79 (−18.3)
# The number in the parentheses is the percent change using an alternative scenario relative to the respective baseline scenario.
Table 5. Comparison of the average annual water balance parameters and cotton yield under three hydroclimatic regimes using various planting dates and maturity cultivars in the dryland cotton HRUs in the Double Mountain Fork Brazos basin.
ScenarioETc (mm)Soil Water
Content (mm)
Surface
Runoff (mm)
Water
Yield (mm)
Cotton
Yield (Mg ha−1)
Baseline dry years360.219.20.1700.410.76
Early planting360.8 (0.16 #)22.0 (14.5)0.167 (−1.9)0.41 (−0.5)0.76 (0.7)
Late planting360.7 (0.14)16.5 (−13.9)0.160 (−5.9)0.40 (−2.5)0.68 (−9.8)
Short season360.1 (−0.01)19.2 (0.13)0.169 (−0.2)0.41 (−0.08)0.79 (4.0)
Long season360.2 (0.01)19.2 (−0.03)0.170 (0.2)0.41 (0.09)0.72 (−5.2)
Baseline normal years490.138.62.613.001.44
Early planting491.0 (0.18)46.9 (21.6)2.68 (2.9)3.08 (2.6)1.58 (9.4)
Late planting490.1 (−0.01)31.5 (−18.5)2.59 (−0.7)2.98 (−0.6)1.14 (−21.1)
Short season490.1 (0.003)38.4 (−0.4)2.60 (−0.2)3.00 (−0.2)1.59 (10.1)
Long season490.1 (−0.003)38.7 (0.4)2.61 (0.2)3.01 (0.2)1.30 (−10.1)
Baseline wet years664.691.91.332.031.77
Early planting660.7 (−0.58)101.8 (10.8)1.89 (42.4)2.60 (28.5)1.87 (5.4)
Late planting664.6 (−0.002)84.3 (−8.3)1.14 (−14.1)1.83 (−9.8)1.41 (−20.5)
Short season664.6 (0.004)91.8 (−0.14)1.32 (−0.5)2.02 (−0.3)1.95 (10.0)
Long season664.6 (−0.003)92.0 (0.15)1.34 (0.6)2.04 (0.4)1.59 (−10.3)
# The number in the parentheses is the percent change using an alternative scenario relative to the respective baseline scenario.
Publisher’s Note: MDPI stays neutral with regard to jurisdictional claims in published maps and institutional affiliations.

