
Mango Postharvest Technologies: An Observational Study of the Yieldwise Initiative in Kenya


Abstract
:1. Introduction
2. Materials and Methods
2.1. Data Collection
2.2. Data Review
2.2.1. Independent Variables
2.2.2. Dependent Variables
2.3. Statistical Analysis
3. Results
3.1. Harvesting Tools
3.2. Cold Stores
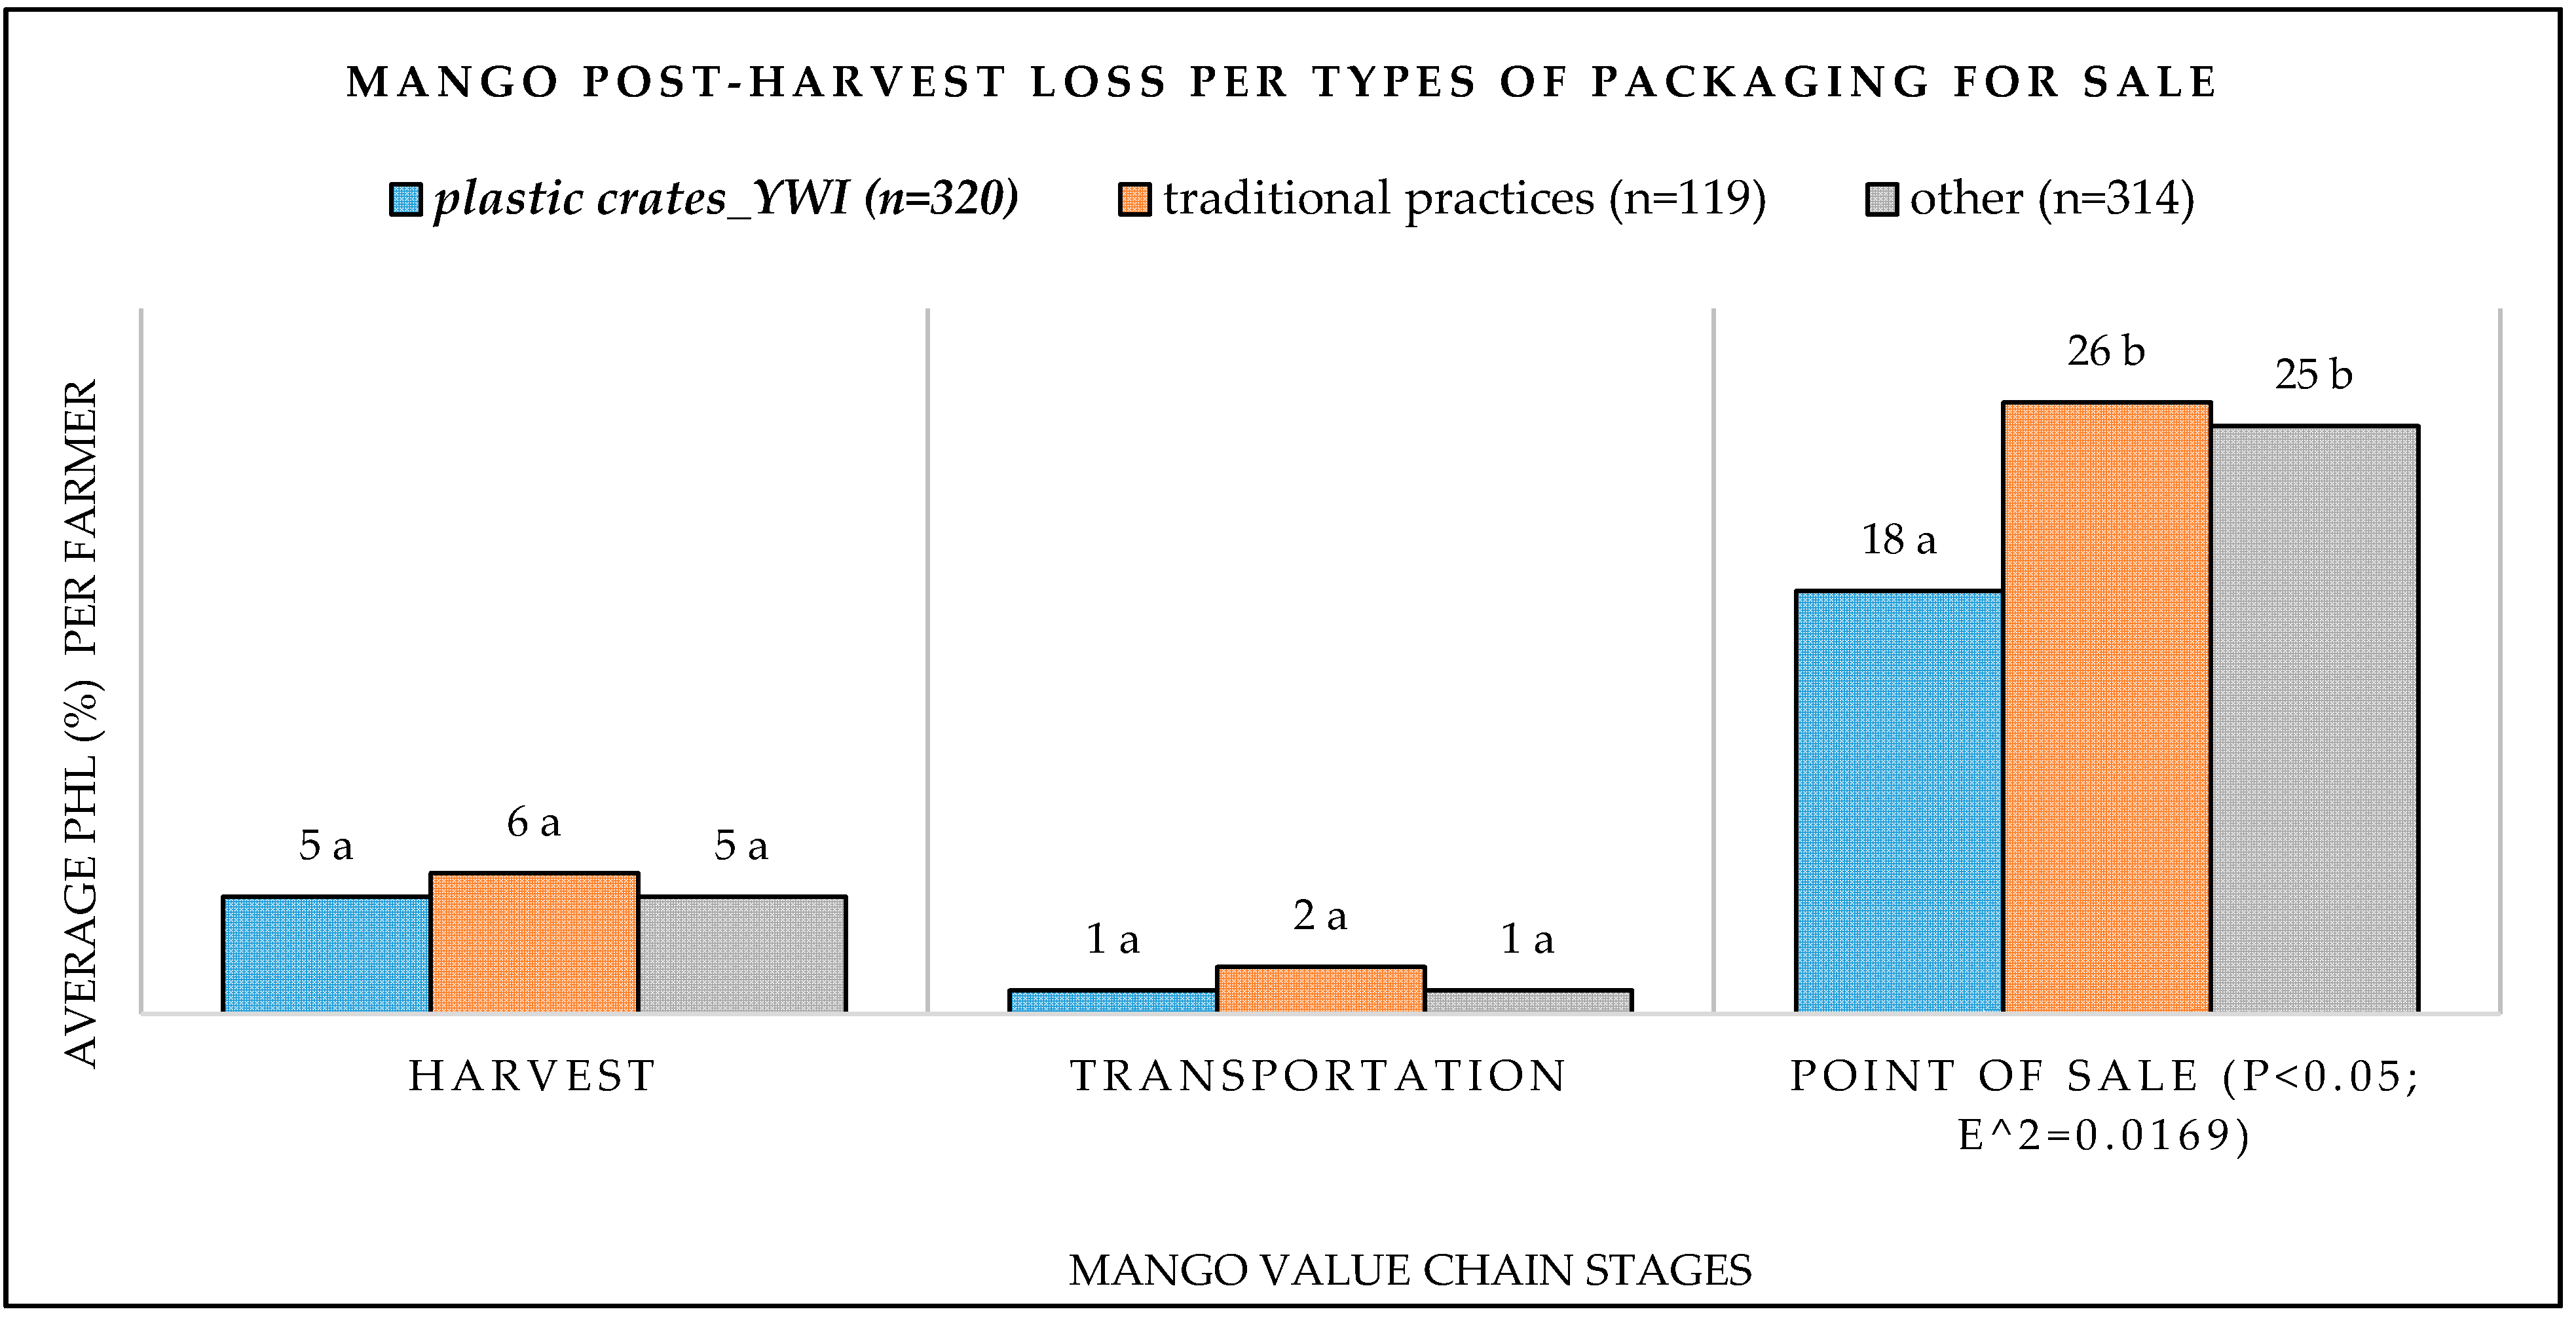
3.3. Plastic Crates
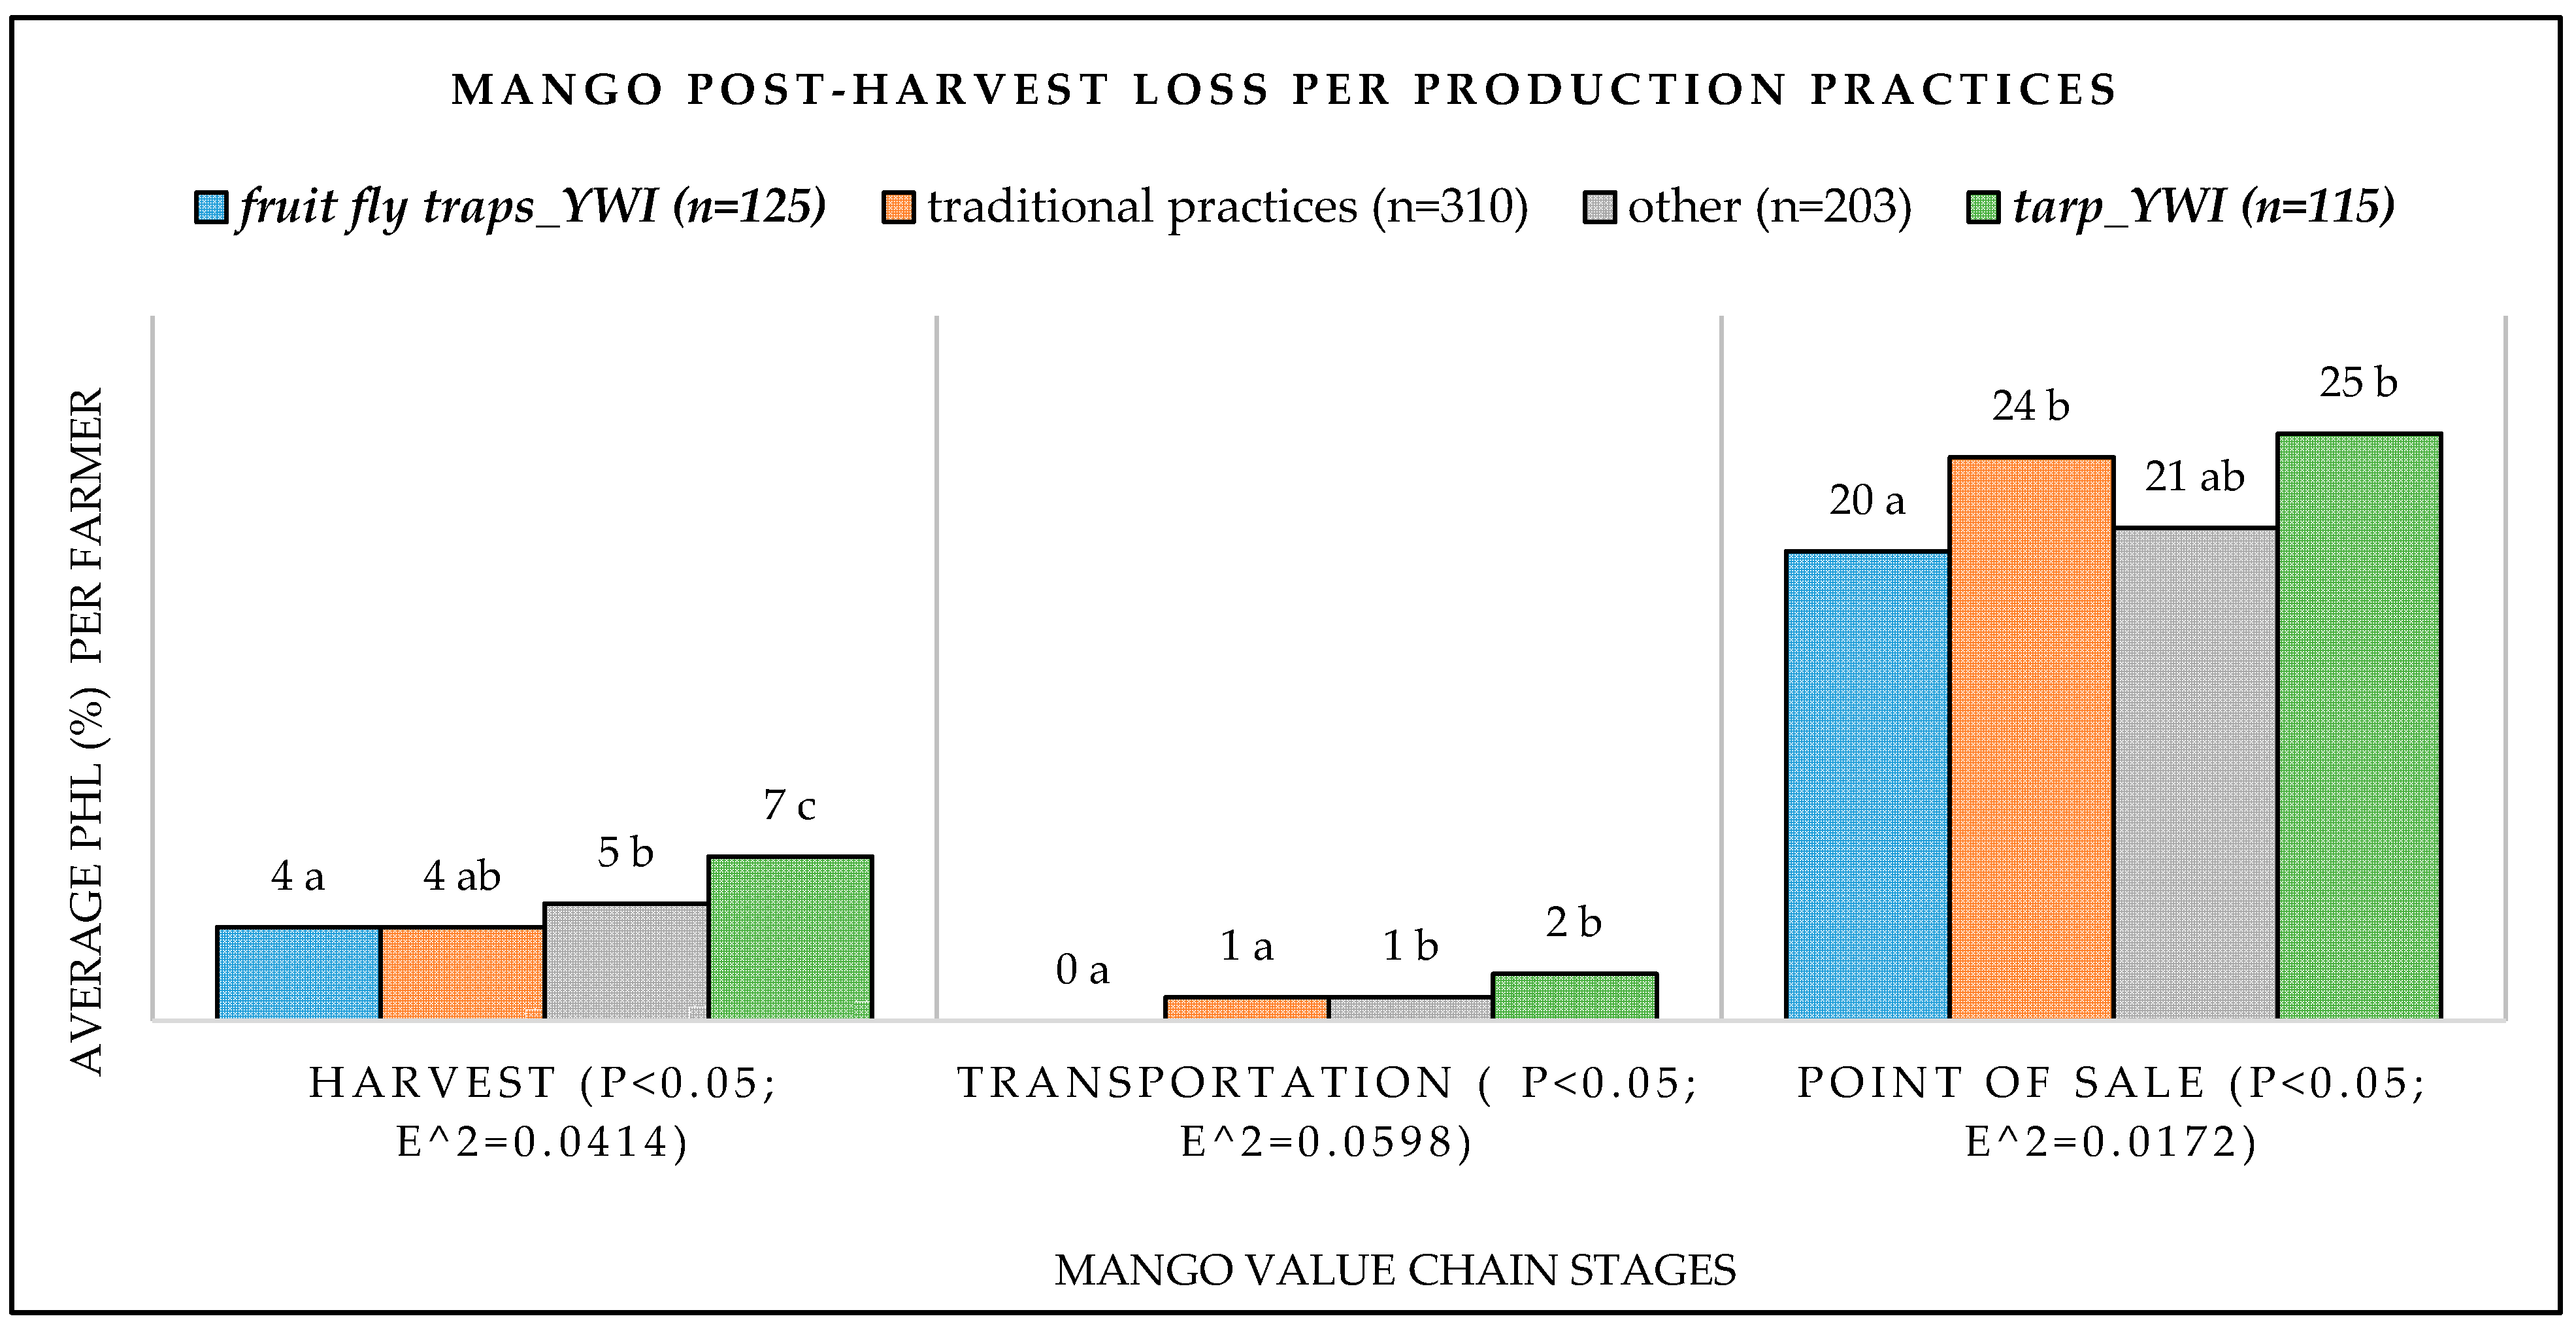
3.4. Fruit Fly Traps and Ground Tarps
4. Discussion
5. Conclusions
Author Contributions
Funding
Data Availability Statement
Acknowledgments
Conflicts of Interest
References
- FAO. The State of Food and Agriculture 2019. Moving Forward on Food Loss and Waste Reduction; FAO: Rome, Italy, 2019. [Google Scholar]
- Alexandratos, N.; Bruinsma, J. World Agriculture Towards 2030/2050: The 2012 Revision; FAO: Rome, Italy, 2012. [Google Scholar]
- De Boer, J.; Aiking, H. On the merits of plant-based proteins for global food security: Marrying macro and micro perspectives. Ecol. Econ. 2011, 70, 1259–1265. [Google Scholar] [CrossRef]
- Joosten, F.; Dijkxhoorn, Y.; Sertse, Y.; Ruben, R. How does the Fruit and Vegetable Sector Contribute to Food and Nutrition Security? LEI Wageningen UR: The Hague, The Netherlands, 2015. [Google Scholar]
- Wu, W.; Yu, Q.; You, L.; Chen, K.; Tang, H.; Liu, J. Global cropping intensity gaps: Increasing food production without cropland expansion. Land Use Policy 2018, 76, 515–525. [Google Scholar] [CrossRef]
- Pugh, T.A.M.; Müller, C.; Elliott, J.; Deryng, D.; Folberth, C.; Olin, S.; Schmid, E.; Arneth, A. Climate analogues suggest limited potential for intensification of production on current croplands under climate change. Nat. Commun. 2016, 7, 1–8. [Google Scholar] [CrossRef] [Green Version]
- Molotoks, A.; Stehfest, E.; Doelman, J.; Albanito, F.; Fitton, N.; Dawson, T.P.; Smith, P. Global projections of future cropland expansion to 2050 and direct impacts on biodiversity and carbon storage. Glob. Chang. Biol. 2018, 24, 5895–5908. [Google Scholar] [CrossRef] [PubMed] [Green Version]
- Bradford, K.J.; Dahal, P.; Van Asbrouck, J.; Kunusoth, K.; Bello, P.; Thompson, J.; Wu, F. The dry chain: Reducing postharvest losses and improving food safety in humid climates. Trends Food Sci. Technol. 2018, 71, 84–93. [Google Scholar] [CrossRef]
- Grolleaud, M. Post-harvest Losses: Discovering the Full Story; Post-Harvest System and Food Losses; FAO: Rome, Italy, 1997; Chapter 2; Available online: http://www.fao.org/3/ac301e/AC301e03.htm (accessed on 4 August 2020).
- Sheahan, M.; Barrett, C.B. Food loss and waste in Sub-Saharan Africa: A critical review. Food Policy 2017, 70, 1–12. [Google Scholar] [CrossRef] [PubMed]
- Xie, H.; Perez, N.; Anderson, W.; Ringler, C.; You, L. Can Sub-Saharan Africa feed itself? The role of irrigation development in the region’s drylands for food security. Water Int. 2018, 43, 796–814. [Google Scholar] [CrossRef]
- Williams, S.B.; Murdock, L.L.; Baributsa, D. Sorghum seed storage in Purdue Improved Crop Storage (PICS) bags and improvised containers. J. Stored Prod. Res. 2017, 72, 138–142. [Google Scholar] [CrossRef]
- Baributsa, D.; Ignacio, M.C. Developments in the use of hermetic bags for grain storage. In Advances in Postharvest Management of Cereals and Grains; Burleigh Dodds Science Publishing: London, UK, 2020; pp. 171–198. [Google Scholar]
- Flanagan, K.; Robertson, K.; Hanson, C. Reducing Food Loss Setting a Global Action Agenda; World Resources Institute (WRI): Washington, DC, USA, 2019. [Google Scholar]
- Stathers, T.; Holcroft, D.; Kitinoja, L.; Mvumi, B.M.; English, A.; Omotilewa, O.; Kocher, M.; Ault, J.; Torero, M. A scoping review of interventions for crop postharvest loss reduction in sub-Saharan Africa and South Asia. Nat. Sustain. 2020, 3, 821–835. [Google Scholar] [CrossRef]
- APHLIS. APHLIS+. 2021. Available online: https://www.aphlis.net/en (accessed on 4 May 2021).
- FAO. Food Loss and Waste Database|FAO|Food and Agriculture Organization of the United Nations. 2021. Available online: http://www.fao.org/platform-food-loss-waste/flw-data/en/ (accessed on 4 May 2021).
- Engineering for Change. Landscape Analysis of Post-harvest Technologies for Mango Production in East Africa; Engineering for Change: New York, NY, USA, 2020. [Google Scholar]
- FSD. Kenya Opportunities for Financing the Mango Value Chain: A Case Study of Lower Eastern Kenya; FSD Kenya: Nairobi, Kenya, 2015; Volume 52. [Google Scholar]
- Kuhn, M.; Johnson, K. Applied Predictive Modeling; Springer: New York, NY, USA, 2013; ISBN 9781461468493. [Google Scholar]
- Cheema, J.R. Some general guidelines for choosing missing data handling methods in educational research. J. Mod. Appl. Stat. Methods 2014, 13, 53–75. [Google Scholar] [CrossRef]
- Affognon, H.; Mutungi, C.; Sanginga, P.; Borgemeister, C. Unpacking postharvest losses in sub-Saharan Africa: A Meta-Analysis. World Dev. 2015, 66, 49–68. [Google Scholar] [CrossRef] [Green Version]
- Schwertman, N.C.; Owens, M.A.; Adnan, R. A simple more general boxplot method for identifying outliers. Comput. Stat. Data Anal. 2004, 47, 165–174. [Google Scholar] [CrossRef]
- Ramsey, F.; Schafer, D. The Statistical Sleuth: A Course in Methods of Data Analysis, 3rd ed.; Cengage Learning: Boston, MA, USA, 2012; ISBN 9781133490678. [Google Scholar]
- Hecke, T. Van Power study of anova versus Kruskal-Wallis test. J. Stat. Manag. Syst. 2012, 15, 241–247. [Google Scholar]
- Tomczak, M.; Tomczak, E. The need to report effect size estimates revisited. An overview of some recommended measures of effect size. Trends Sport Sci. 2014, 1, 19–25. [Google Scholar]
- Rea, L.M.; Parker, R.A. Designing and Conducting Survey Research: A Comprehensive Guide, 4th ed.; Jossey-Bass: Hoboken, NJ, USA, 2014; ISBN 9781118767030. [Google Scholar]
- Anonymous. Yieldwise: Kenya Mango Quarterly Report-Q1 (Jan-Mar 2018); Technoserve: Nairobi, Kenya, 2018. [Google Scholar]
- Ran, Y.; Annebäck, J.; Widmark, E.; Osborne, M. Boosting Technology Uptake: Some Ideas for Improving Small-Scale Mango Farming in Kenya; Stockholm Environment Institute: Stockholm, Sweden, 2018. [Google Scholar]
- Bally, I.S.E.; Kulkarni, V.J.; Johnson, P.R. Mango production in Australia. Acta Hortic. 2000, 509, 79–85. [Google Scholar] [CrossRef]
- Baloch, M.K.; Bibi, F. Effect of harvesting and storage conditions on the post harvest quality and shelf life of mango (Mangifera indica L.) fruit. S. Afr. J. Bot. 2012, 83, 109–116. [Google Scholar] [CrossRef] [Green Version]
- Singh, V.; Kumar, A.; Kumar, R.; Malik, A.; Kumar, R.; Kumar, A. Adoption of post-harvest management practices by Mango growers of Haryana. Studies 2020, 10, 158–161. [Google Scholar]
- Ambuko, J.L. Tackling Postharvest Losses in Mango among Resource- Poor Farmers in Kenya. Chron. Hortic. 2020, 60, 28–29. [Google Scholar]
- Ntsoane, M.L.; Zude-Sasse, M.; Mahajan, P.; Sivakumar, D. Quality assesment and postharvest technology of mango: A review of its current status and future perspectives. Sci. Hortic. 2019, 249, 77–85. [Google Scholar] [CrossRef]
- Verrinder, N. End of Project Evaluation for the Scale-Up Phase of the YieldWise Initiative (Mango, Kenya) Final Evaluation Report; Genesis Analytics: Johannesburg, South Africa, 2018. [Google Scholar]
- Chonhenchob, V.; Singh, S.P. Testing and Comparison of Various Packages for Mango Distribution. J. Test. Eval. 2004, 32, 69–72. [Google Scholar] [CrossRef]
- Kitinoja, L.; Saran, S.; Roy, S.K.; Kader, A.A. Postharvest technology for developing countries: Challenges and opportunities in research, outreach and advocacy. J. Sci. Food Agric. 2011, 91, 597–603. [Google Scholar] [CrossRef] [PubMed]
- Sonka, S.T. Measuring to Manage. Reduction and of Food Loss Waste. A Cooperation between the Pontifical Academy of Science and the Rockefeller Foundation. In Proceedings of the Pontifical Academy of Science, Casina Pio IV, Vatican City, 11–12 November 2019; p. 240, ISBN 9788877611154. [Google Scholar]
- Mujuka, E.; Mburu, J.; Ogutu, A.; Ambuko, J. Returns to investment in postharvest loss reduction technologies among mango farmers in Embu County, Kenya. Food Energy Secur. 2020, 9, 1–9. [Google Scholar] [CrossRef]
- Carter, M.R.; Laajaj, R.; Yang, D. Susidies and the Persistence of Technology Adoption: Field Experimental Evidence from Mozambique; National Bureau of Economic Research: Cambridge, UK, 2014. [Google Scholar]
- Omotilewa, O.J.; Ricker-Gilbert, J.; Ainembabazi, J.H. Subsidies for Agricultural Technology Adoption: Evidence from a Randomized Experiment with Improved Grain Storage Bags in Uganda. Am. J. Agric. Econ. 2019, 101, 753–772. [Google Scholar] [CrossRef] [PubMed] [Green Version]


| (a) Sections | (b) Factors | (c) Subsets of Factors | (d) Subset Descriptors | (e) # Observations (Respondent Farmers) |
|---|---|---|---|---|
| A. Geography and socio-demographics | 1. county C | Embu | eastern | 159 |
| Garissa | north eastern | 6 | ||
| Kilifi | coast | 1 | ||
| Kirinyaga | central | 1 | ||
| Lamu | coast | 12 | ||
| Machakos | eastern | 49 | ||
| Makueni | eastern | 88 | ||
| Meru | eastern | 86 | ||
| Muranga | central | 12 | ||
| Tana river | coast | 332 | ||
| Tharaka nithi | eastern | 7 | ||
| 2. treatment control C | control | non beneficiary | 282 | |
| treatment | yieldwise beneficiary | 471 | ||
| 3. farm ownership C | no | no | 135 | |
| yes | yes | 618 | ||
| B. Labor costs | 4. labor costs C | no | no | 468 |
| yes | yes | 285 | ||
| C. Harvesting | 5. who harvested mango C | both | farmer and buyer | 133 |
| buyer only | buyer | 411 | ||
| self-family | farmer | 181 | ||
| other ** | other | 28 | ||
| 6. inform when to harvest C | days after blooming | days after blooming | 5 | |
| fruit color | fruit color | 165 | ||
| fruit size or shape | fruit size or shape | 49 | ||
| test for maturity | test for maturity | 13 | ||
| other ** | other | 521 | ||
| 7. frequency of harvest C | daily | daily | 53 | |
| fortnightly | fortnightly | 231 | ||
| monthly | monthly | 52 | ||
| weekly | weekly | 308 | ||
| other ** | other | 109 | ||
| 8. methods of harvest C, T | handpicking | traditional practices | 276 | |
| harvesting tools PHT | harvesting tools YWI | 48 | ||
| poles | traditional practices | 67 | ||
| shaking trees or branches | traditional practices | 11 | ||
| other ** | other | 350 | ||
| D. Sales | 9. how farmer identified buyer C | brokers | brokers | 407 |
| farmer-based organization (FBO) | fbo | 12 | ||
| own effort neighbor family or friend | own effort | 253 | ||
| other ** | other | 81 | ||
| E. Grading and storage | 10. harvested mango graded C | no | no | 346 |
| yes | yes | 407 | ||
| 11. market destination C | export | export | 106 | |
| local market | local market | 362 | ||
| processing | processing | 41 | ||
| supermarket | supermarket | 5 | ||
| other ** | other | 239 | ||
| 12. storage after harvesting C, T | cold store PHT | cold store YWI | 18 | |
| did not store | traditional practices | 386 | ||
| shade | traditional practices | 212 | ||
| store shed PHT | traditional practices | 88 | ||
| other ** | other | 49 | ||
| 13. package for sale C, T | in crates cartons PHT | plastic crates YWI | 320 | |
| in sacks PHT | traditional practices | 119 | ||
| other ** | other | 314 | ||
| 14. mango price N | Ksh per mango | Ksh per mango | 753 | |
| F. Training | 15. receive production training C | no | no | 534 |
| yes | yes | 219 | ||
| G. Credit access | 16. have bank account C | no | no | 374 |
| yes | yes | 379 | ||
| 17. have mobile money account C | no | no | 95 | |
| yes | yes | 658 | ||
| 18. receive remittances C | no | no | 467 | |
| yes | yes | 286 | ||
| 19. taken loan for farm C | no | no | 695 | |
| yes | yes | 58 | ||
| H. Production and phl practices | 20. production PHL practices C, T | fruit fly traps PRHT | fruit fly traps YWI | 125 |
| none | traditional practices | 218 | ||
| scouting fruit fly | traditional practices | 91 | ||
| tarp PHT | tarp YWI | 115 | ||
| other ** | other | 204 | ||
| I. Farm demographics | 21. total trees N | # of trees | # of trees | 753 |
| (a) Factors | (b) Subset Descriptors | (c) Subsets | (d) Description |
|---|---|---|---|
| methods of harvest | harvesting tools YWI | harvesting tools YWI | Tools that reduce/eliminate the need for harvesting by hand and catch mangos in a soft fabric sack, thereby preventing bruising that may occur due to hard grips or when mangos fall on hard surfaces |
| traditional practices | shaking trees or branches | Harvesting practice consisting of the farmer shaking the mango tree or branches, causing it to detach from the tree and fall on the ground | |
| traditional practices | handpicking | Not specified in the data | |
| traditional practices | poles | Not specified in the data | |
| storage after harvesting | cold store YWI | cold store YWI | Cold stores consist of charcoal evaporative coolers, brick evaporative coolers, insulated air-conditioned containers powered by photovoltaic cells or by the electrical grid |
| traditional practices | did not store | Not specified in the data | |
| traditional practices | shade | Trees shade | |
| traditional practices | store shed | Shed built to store mango | |
| package for sale | plastic crates YWI | in crates YWI | Plastic rectangular containers that protect/preserve quality by reducing impact damage during transport, and each crate can hold up to 50 mangos |
| traditional practices | in sacks | Not specified in the data | |
| production phl practices | fruit fly traps YWI | fruit fly traps YWI | A container with chemicals like bactrolure or metarhizium anisopliae ICIPE 69 that attract fruit flies and eventually kills them, either directly by chemical exposure or through secondary transmission from other fruit flies |
| tarp YWI | tarp YWI | Large plastic covers/surfaces mainly used to prevent bruising of mango during harvest by reducing the impact of mango. Mangos harvested by hand are thrown down on the tarp which acts as a cushion to reduce the mechanical impact force on the fruits. Tarps are also used after harvest to protect mangos from weather effects, including rain, moisture, or direct sunlight | |
| traditional practices | none | Not specified in the data | |
| traditional practices | scouting fruit fly | Not specified in the data |
| (A) Mango Value Chain Stages | (b) Types of Mango PHL (Dependent Variables) | (c) Description |
|---|---|---|
| Harvest | PHL during harvest | Mango fruit (quantity) discarded by the farmer as a result of bruises or injuries caused to the fruit during harvesting activities |
| PHL during harvest other ways | Not specified in the data (unclear) | |
| Transportation to the point of sale or aggregation site | PHL during transportation | Mango fruit (quantity) discarded by the farmer as a result of unspecified quality issues during transportation |
| Point of sale (off-takers, wholesaler or brokers) | PHL due to mangos being rejected by buyers | Mango fruit (quantity) discarded by the buyer as a result of unspecified quality issues |
| PHL due to mangos being overripe | Mango fruit (quantity) discarded by the farmer as a result of the fruit being too overripe for sale | |
| PHL due to mangos physical damage | Mango fruit (quantity) discarded by the farmer as a result of bruises or injuries caused to the fruit after harvest | |
| PHL due to mangos being rotten | Mango fruit (quantity) discarded by the farmer as a result of the fruit being rotten | |
| PHL due to low-quality mangos being fed to livestock | Mango fruit (quantity) discarded by the farmer and fed to livestock as a result of the fruit being unfit for human consumption | |
| PHL other ways | Not specified in the data (unclear) |
| (a) Factors | (b) Subsets of Factors | (c) Observations (Respondent Farmers n) | (d) Average PHL (%) Per Farmer Per Value Chain Stage | |||
|---|---|---|---|---|---|---|
| Harvest | Transportation | Point of Sale | Entire Value Chain | |||
| 1. county C | central | 13 | 4 | 1 | 20 | 25 |
| coast | 345 | 6 | 2 | 25 | 32 | |
| eastern | 389 | 4 | 1 | 20 | 25 | |
| north eastern | 6 | 3 | 0 | 15 | 18 | |
| 2. treatment control C | non beneficiary | 282 | 4 | 1 | 25 | 31 |
| yieldwise beneficiary | 471 | 5 | 1 | 21 | 27 | |
| 3. farm ownership C | no | 135 | 5 | 1 | 22 | 28 |
| yes | 618 | 5 | 1 | 23 | 28 | |
| 4. labor costs C | no | 468 | 5 | 1 | 25 | 30 |
| yes | 285 | 5 | 1 | 19 | 25 | |
| 5. who harvested mango C | buyer | 411 | 4 | 0 | 22 | 27 |
| farmer | 181 | 6 | 2 | 25 | 33 | |
| farmer and buyer | 133 | 5 | 1 | 21 | 27 | |
| other | 28 | 4 | 1 | 21 | 27 | |
| 6. inform when to harvest C | days after blooming | 5 | 6 | 2 | 5 | 14 |
| fruit color | 165 | 5 | 1 | 24 | 30 | |
| fruit size or shape | 49 | 8 | 2 | 34 | 43 | |
| test for maturity | 13 | 3 | 2 | 24 | 29 | |
| other | 521 | 5 | 1 | 21 | 27 | |
| 7. frequency of harvest C | daily | 53 | 6 | 1 | 25 | 31 |
| fortnightly | 231 | 5 | 1 | 23 | 29 | |
| monthly | 52 | 4 | 1 | 29 | 34 | |
| weekly | 308 | 5 | 1 | 20 | 26 | |
| other | 109 | 4 | 1 | 24 | 28 | |
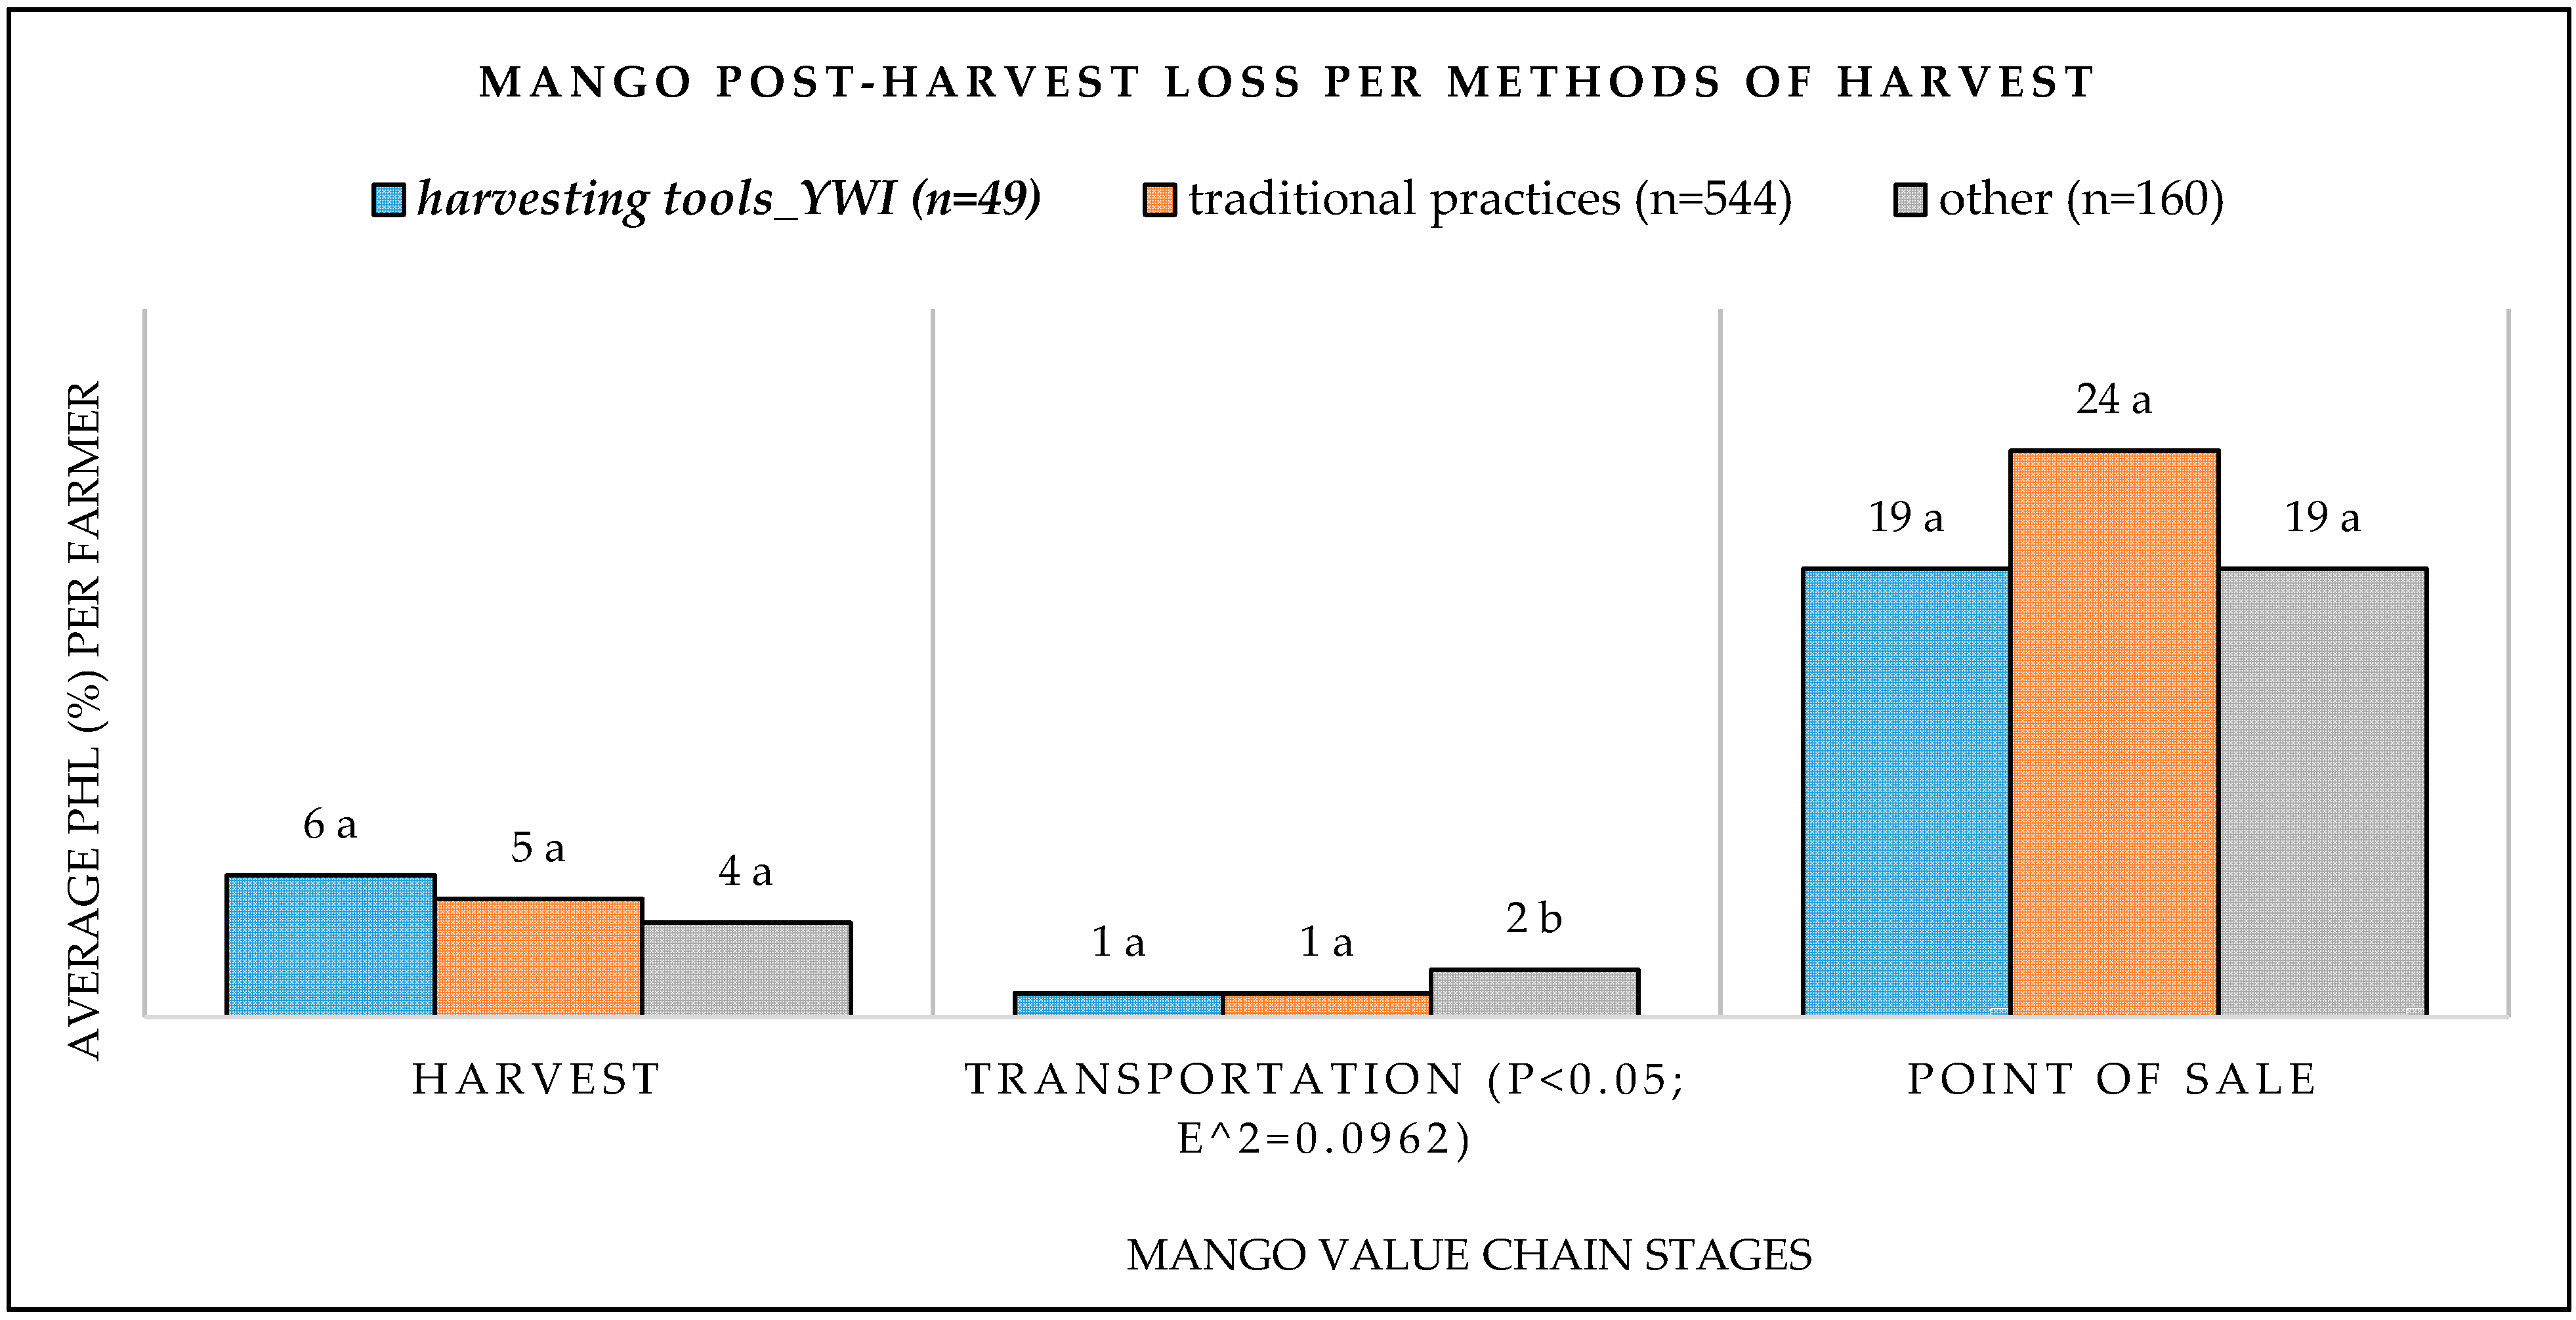
| 8. methods of harvest C, T | harvesting tools YWI | 49 | 6 | 1 | 19 | 25 |
| traditional practices | 544 | 5 | 1 | 24 | 30 | |
| other | 160 | 4 | 2 | 19 | 25 | |
| 9. how farmer identified buyer C | brokers | 407 | 5 | 1 | 23 | 29 |
| farmer based organization | 12 | 2 | 0 | 9 | 12 | |
| own effort | 253 | 4 | 2 | 20 | 26 | |
| other | 81 | 4 | 1 | 29 | 33 | |
| 10. harvested mango graded C | no | 346 | 4 | 1 | 25 | 30 |
| yes | 407 | 6 | 1 | 20 | 27 | |
| 11. market destination C | export | 106 | 3 | 0 | 15 | 19 |
| local market | 362 | 5 | 1 | 23 | 29 | |
| processing | 41 | 7 | 2 | 26 | 34 | |
| supermarket | 5 | 6 | 0 | 20 | 25 | |
| other | 239 | 5 | 2 | 24 | 31 | |
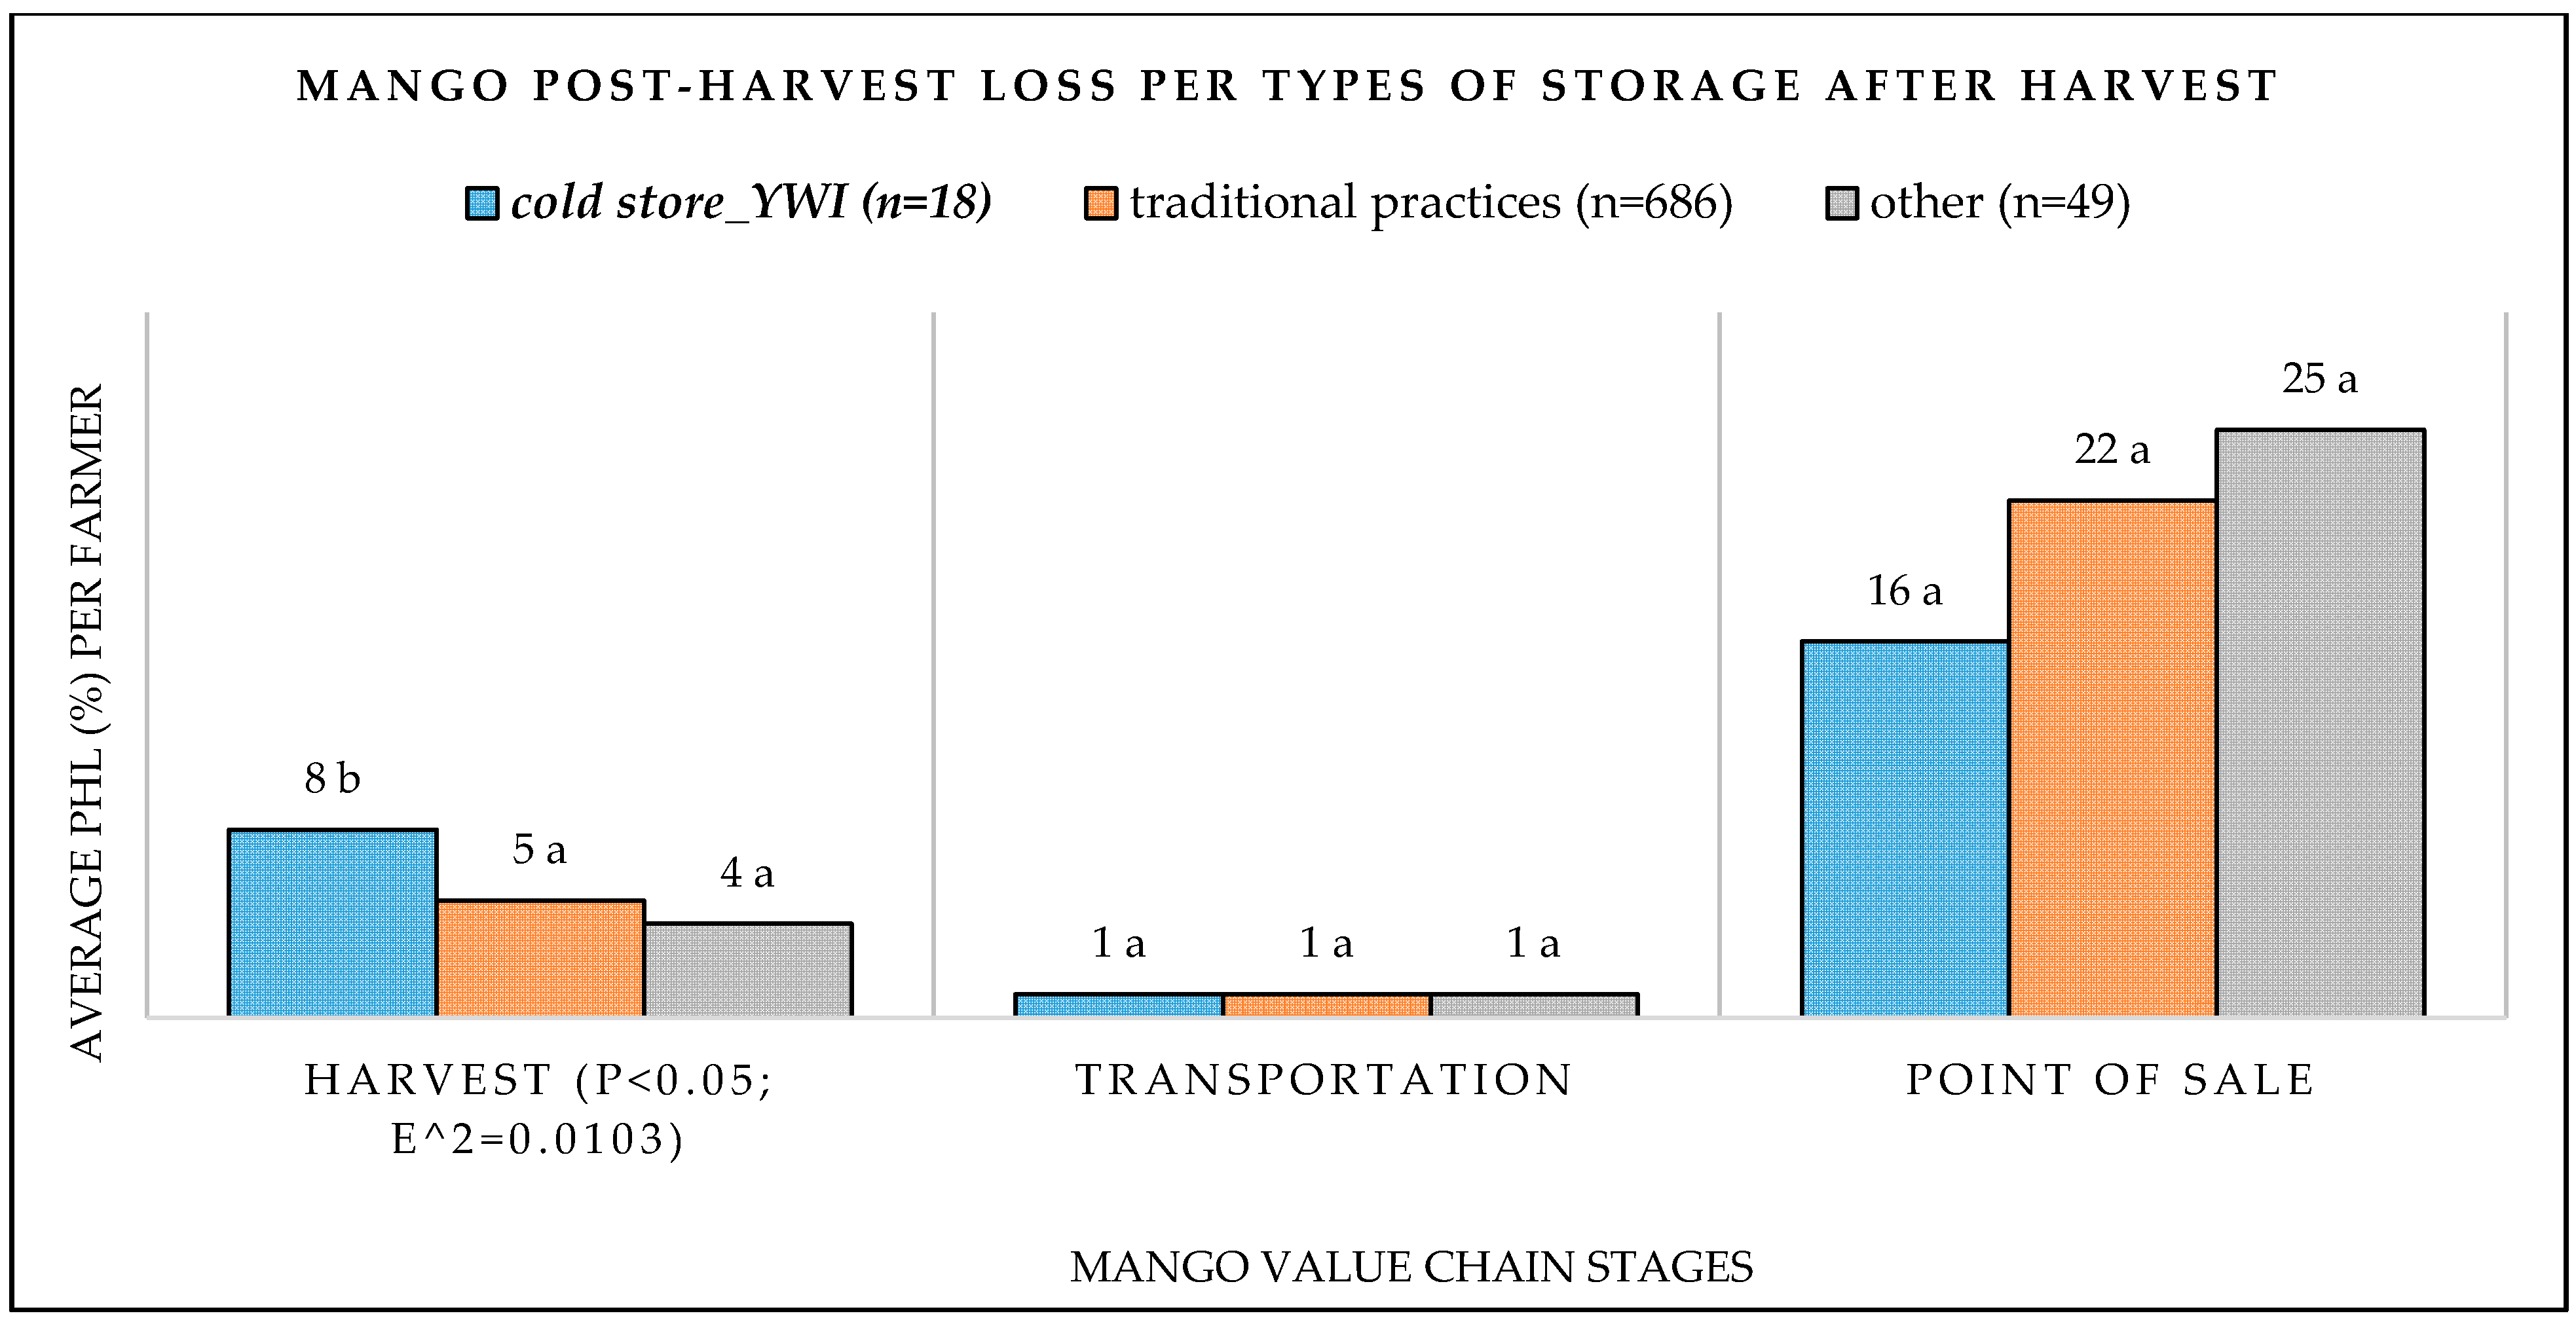
| 12. storage after harvesting C, T | cold store YWI | 18 | 8 | 1 | 16 | 25 |
| traditional practices | 686 | 5 | 1 | 22 | 28 | |
| other | 49 | 4 | 1 | 25 | 29 | |
| 13. package for sale C, T | plastic crates YWI | 320 | 5 | 1 | 18 | 24 |
| traditional practices | 119 | 6 | 2 | 26 | 34 | |
| other | 314 | 5 | 1 | 25 | 31 | |
| 14. mango price N | Ksh per mango | 753 | n/a | n/a | n/a | n/a |
| 15. receive production training C | no | 534 | 5 | 1 | 25 | 31 |
| yes | 219 | 5 | 1 | 15 | 21 | |
| 16. have bank account C | no | 374 | 5 | 1 | 24 | 31 |
| yes | 379 | 5 | 1 | 21 | 26 | |
| 17. have mobile money account C | no | 95 | 6 | 2 | 24 | 32 |
| yes | 658 | 5 | 1 | 22 | 28 | |
| 18. receive remittances C | no | 467 | 5 | 1 | 22 | 28 |
| yes | 286 | 5 | 1 | 23 | 29 | |
| 19. taken loan for farm C | no | 695 | 5 | 1 | 23 | 29 |
| yes | 58 | 3 | 1 | 21 | 25 | |
| 20. production phl practices C, T | fruit fly traps YWI | 125 | 4 | 0 | 20 | 25 |
| tarp YWI | 115 | 7 | 2 | 25 | 33 | |
| traditional practices | 310 | 4 | 1 | 24 | 29 | |
| other | 203 | 5 | 1 | 21 | 27 | |
| 21. total trees N | # of trees | 753 | n/a | n/a | n/a | n/a |
Publisher’s Note: MDPI stays neutral with regard to jurisdictional claims in published maps and institutional affiliations. |
© 2021 by the authors. Licensee MDPI, Basel, Switzerland. This article is an open access article distributed under the terms and conditions of the Creative Commons Attribution (CC BY) license (https://creativecommons.org/licenses/by/4.0/).
Share and Cite
Chikez, H.; Maier, D.; Sonka, S. Mango Postharvest Technologies: An Observational Study of the Yieldwise Initiative in Kenya. Agriculture 2021, 11, 623. https://doi.org/10.3390/agriculture11070623
Chikez H, Maier D, Sonka S. Mango Postharvest Technologies: An Observational Study of the Yieldwise Initiative in Kenya. Agriculture. 2021; 11(7):623. https://doi.org/10.3390/agriculture11070623
Chicago/Turabian StyleChikez, Hory, Dirk Maier, and Steve Sonka. 2021. "Mango Postharvest Technologies: An Observational Study of the Yieldwise Initiative in Kenya" Agriculture 11, no. 7: 623. https://doi.org/10.3390/agriculture11070623