
Nitrogen Dynamics in Tropical Soils Treated with Liquid and Granular Urea Fertilizers


Abstract
:1. Introduction
2. Materials and Methods
Statistical Analysis
3. Results
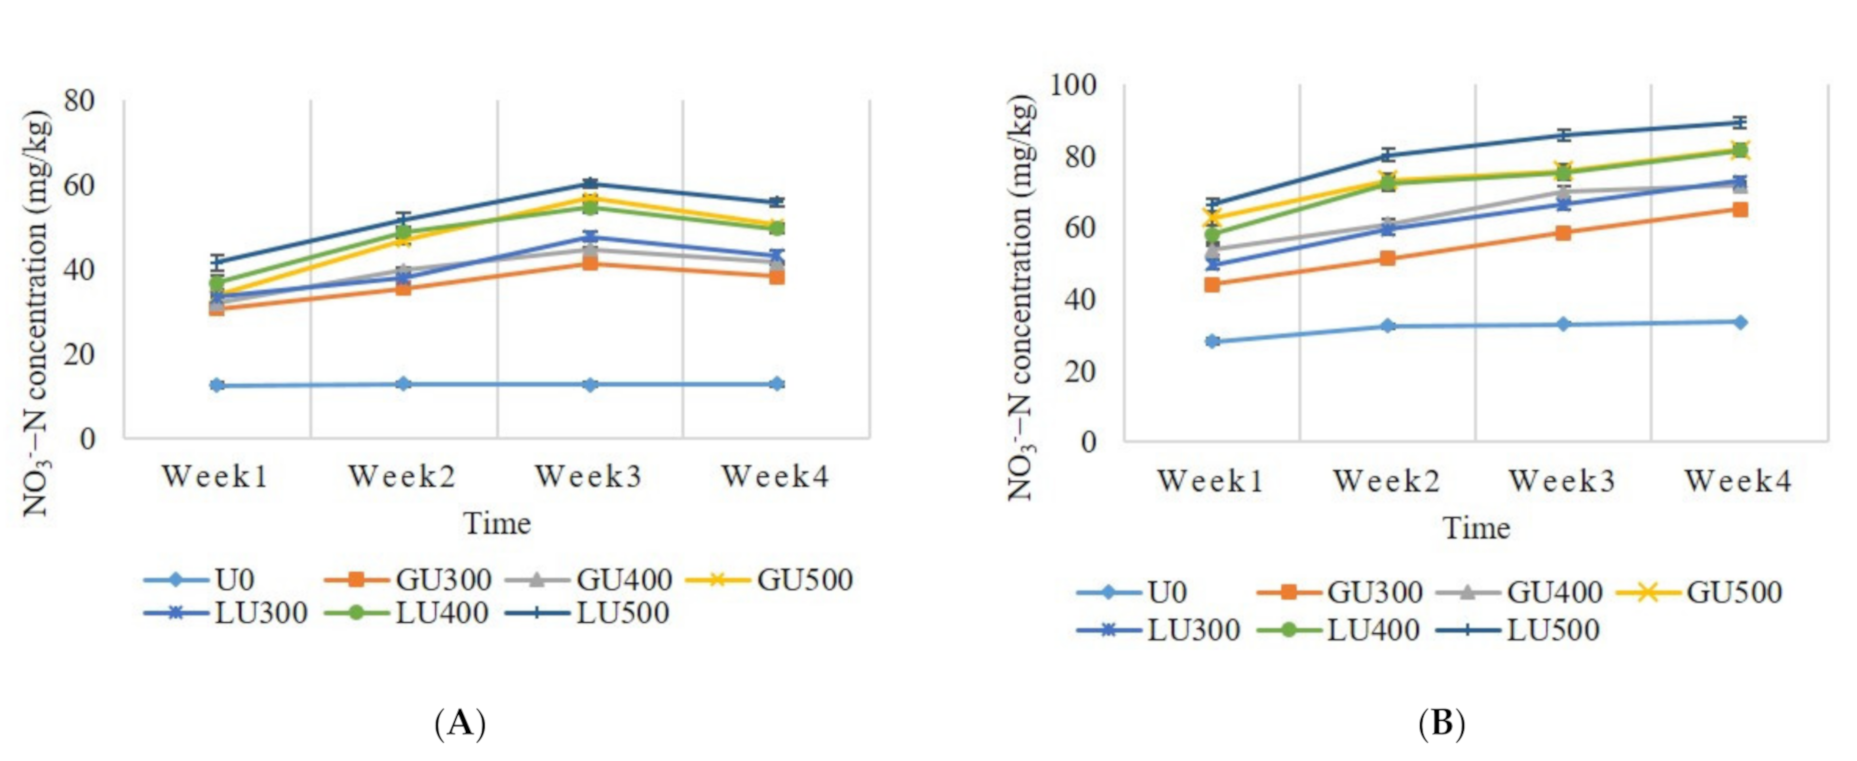
3.1. NH4+-N and NO3−-N Concentrations
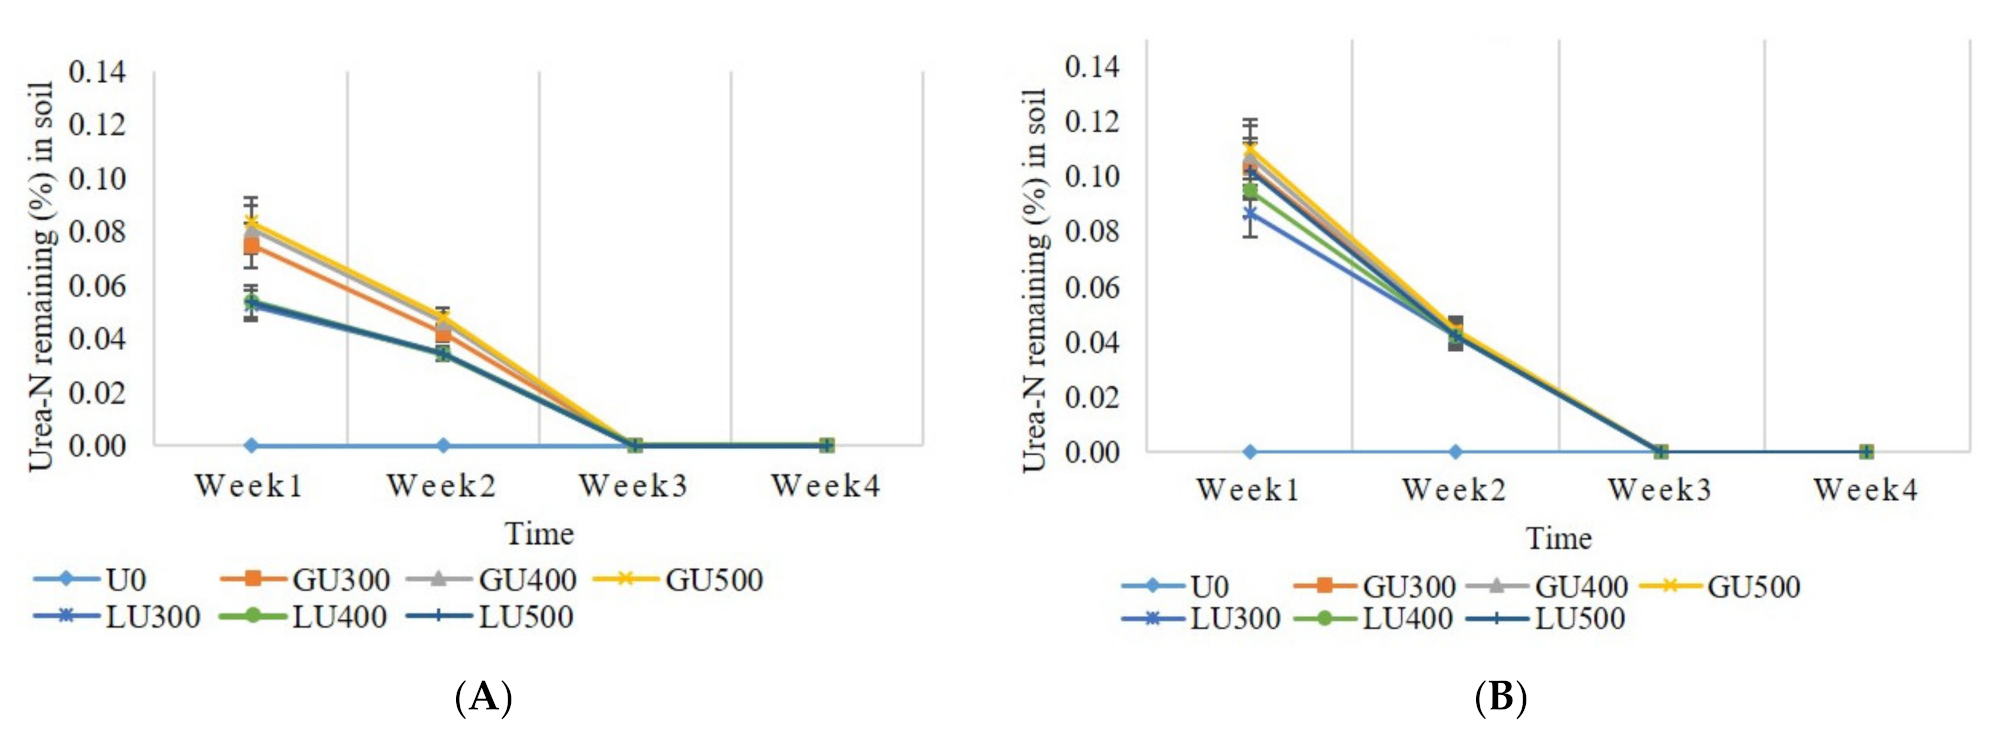
3.2. Urea-N Remaining (%) in the Soil
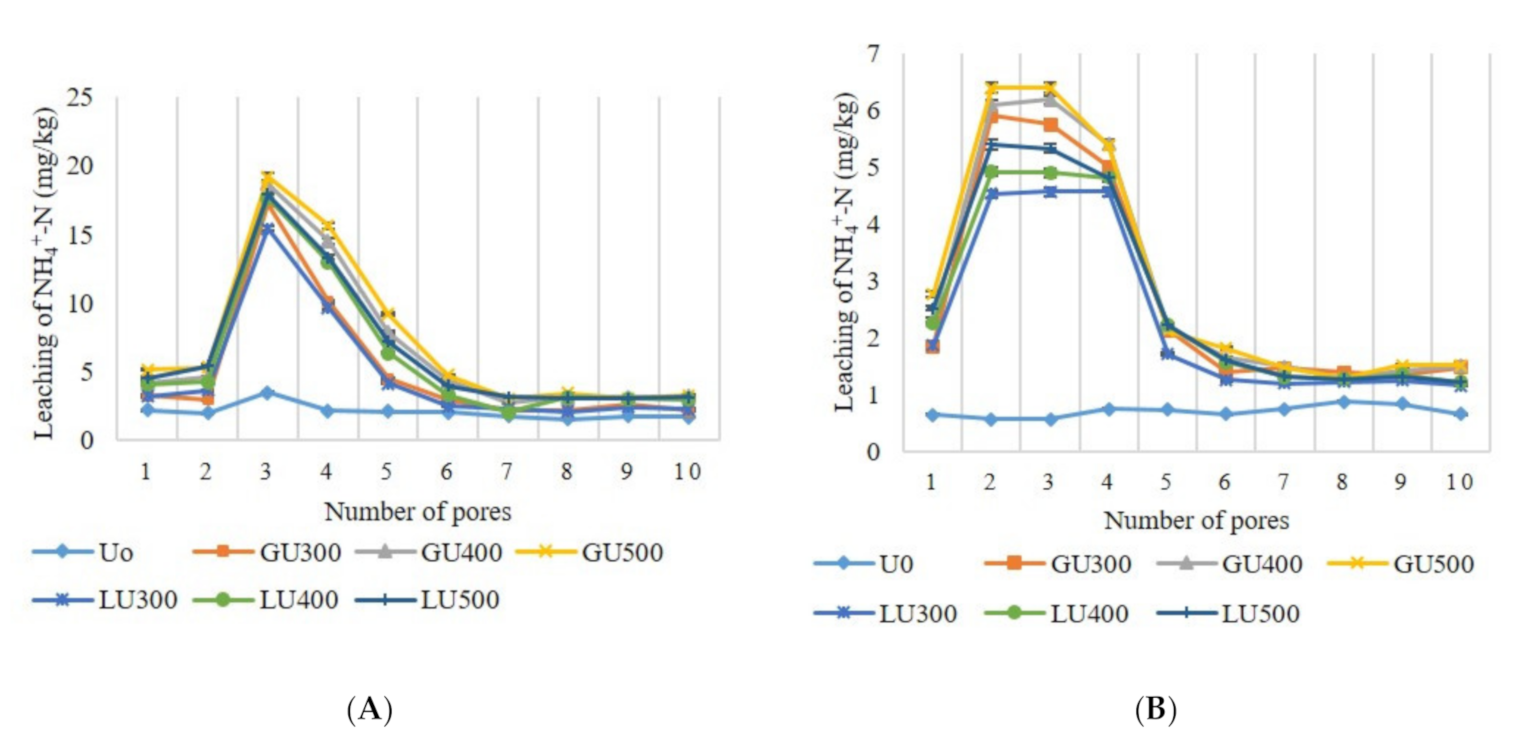
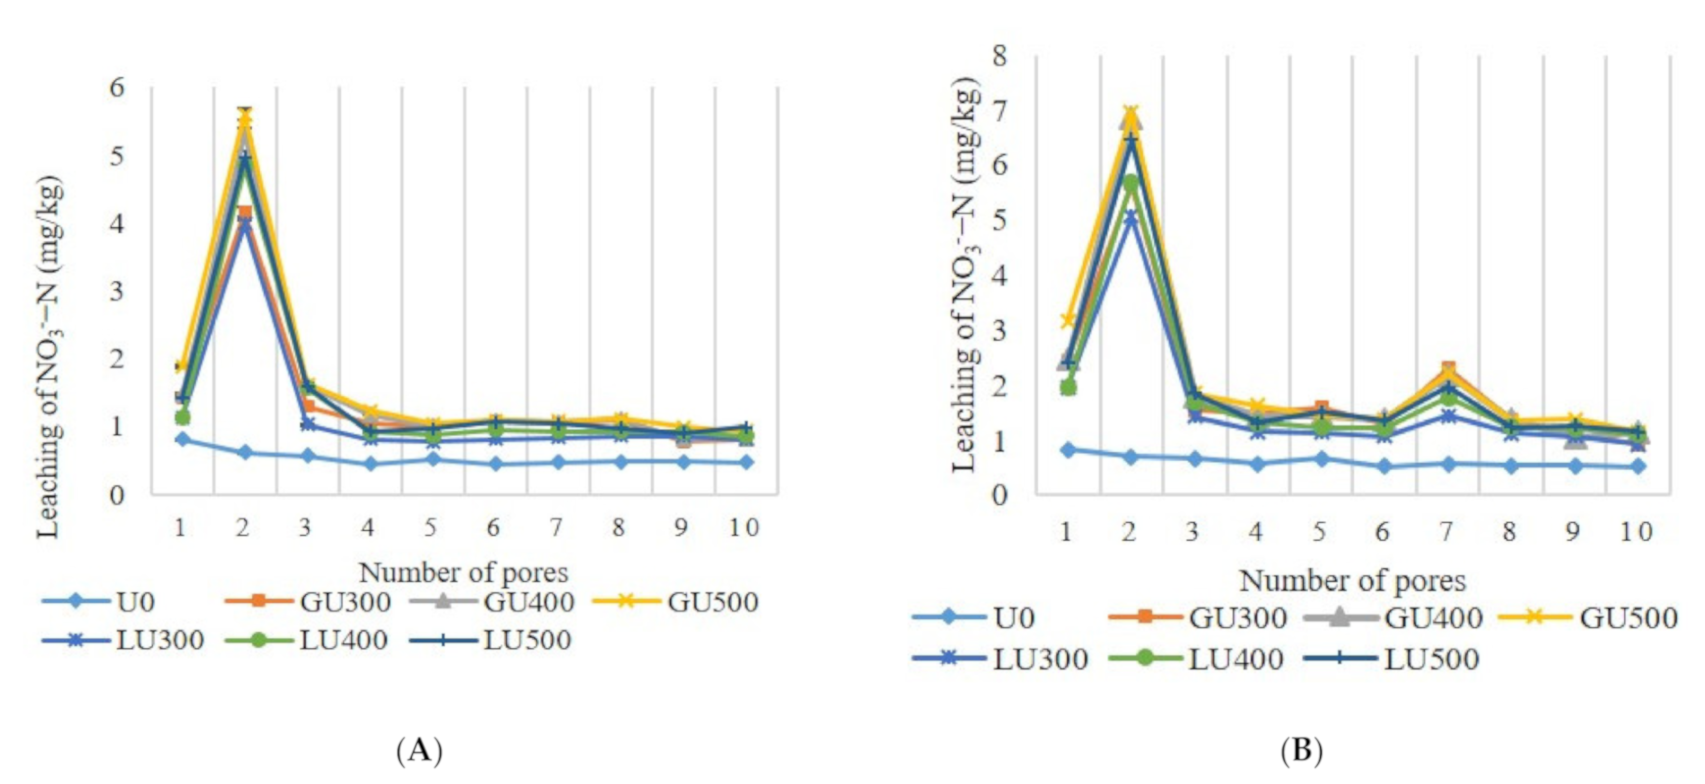
3.3. Leaching Loss of N (NH4+-N and NO3−-N) from Applied Urea
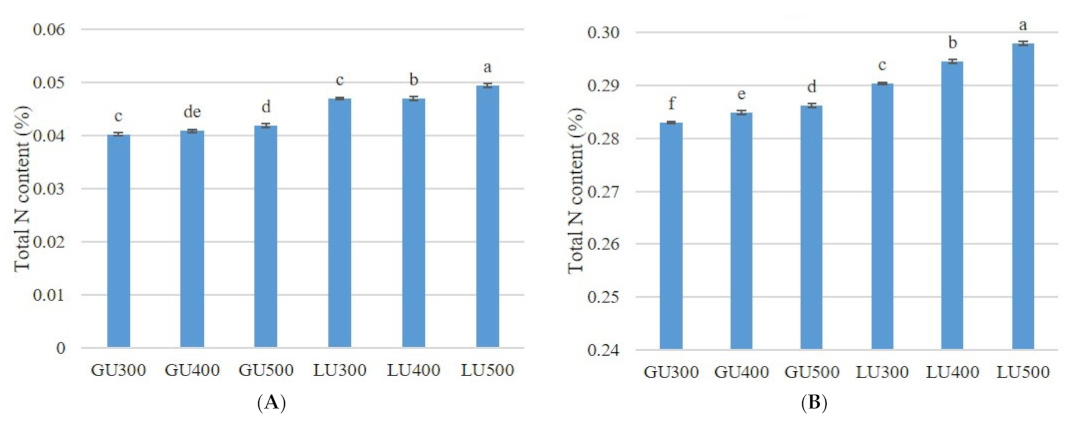
3.4. Total Remaining N (%) in the Soils
4. Discussion
5. Conclusions
Author Contributions
Funding
Institutional Review Board Statement
Informed Consent Statement
Data Availability Statement
Acknowledgments
Conflicts of Interest
References
- Cropnuts Nitrogen—Nutrient Management|Mosaic Crop Nutrition. Available online: https://www.cropnutrition.com/nutrient-management/nitrogen (accessed on 17 May 2020).
- Erisman, J.W.; Sutton, M.A.; Galloway, J.; Klimont, Z.; Winiwarter, W. How a century of ammonia synthesis changed the world. Nat. Geosci. 2008, 1, 636–639. [Google Scholar] [CrossRef]
- Leghari, S.J.; Wahocho, N.A.; Laghari, G.M.; HafeezLaghari, A.; MustafaBhabhan, G.; HussainTalpur, K.; Bhutto, T.A.; Wahocho, S.A.; Lashari, A.A. Role of Nitrogen for Plant Growth and Development: A review. Adv. Environ. Biol. 2016, 10, 209–218. [Google Scholar]
- Kira, O.; Shaviv, A.; Dubowski, Y. Science of the Total Environment Direct tracing of NH3 and N2O emissions associated with urea fertilization approaches, using static incubation cells. Sci. Total Environ. 2019, 661, 75–85. [Google Scholar] [CrossRef] [PubMed]
- Sutton, M.A.; Oenema, O.; Erisman, J.W.; Leip, A.; van Grinsven, H.; Winiwarter, W. Too much of a good thing? Nature 2011, 472, 156–161. [Google Scholar] [CrossRef] [Green Version]
- Heffer, P.; Prud’homme, M. Short-Term Fertilizer Outlook 2016–2017; International Fertilizer Industry Association: Paris, France, 2016. [Google Scholar]
- Almaz, M.G.; Halim, R.A.; Martini, M.Y.; Samsuri, A.W. Integrated application of poultry manure and chemical fertiliser on soil chemical properties and nutrient uptake of maize and soybean. Malays. J. Soil Sci. 2017, 21, 13–28. [Google Scholar]
- Rochette, P.; Angers, D.A.; Chantigny, M.H.; Macdonald, J.D.; Bertrand, N. Reducing ammonia volatilization in a no-till soil by incorporating urea and pig slurry in shallow bands. Nutr. Cycl. Agroecosyst. 2009, 71–80. [Google Scholar] [CrossRef]
- Puga, A.P.; Grutzmacher, P.; Cerri, C.E.P.; Ribeirinho, V.S.; de Andrade, C.A. Biochar-based nitrogen fertilizers: Greenhouse gas emissions, use efficiency, and maize yield in tropical soils. Sci. Total Environ. 2020, 704, 135375. [Google Scholar] [CrossRef]
- Lichiheb, N.; Myles, L.T.; Personne, E.; Heuer, M.; Buban, M.; Nelson, A.J.; Koloutsou-Vakakis, S.; Rood, M.J.; Joo, E.; Miller, J.; et al. Implementation of the effect of urease inhibitor on ammonia emissions following urea-based fertilizer application at a Zea mays field in central Illinois: A study with SURFATM-NH 3 model. Agric. For. Meteorol. 2019, 269–270, 78–87. [Google Scholar] [CrossRef]
- Motasim, A.M.; Samsuri, A.W.; Shairah, A.S.A.; Adibah, A.M. Gaseous Nitrogen Losses from Tropical Soils with Liquid or Granular Urea Fertilizer Application. Sustainability 2021, 13, 3128. [Google Scholar] [CrossRef]
- Wesley, T.L.; Lamond, R.E.; Martin, V.L.; Duncan, S.R. Effects of late-season nitrogen fertilizer on irrigated soybean yield and composition. J. Prod. Agric. 1998, 11, 331–336. [Google Scholar] [CrossRef]
- Walsh, O.S.; Christiaens, R.J.; Pandey, A. Applying Liquid Nitrogen in spring wheat. Fluid J. 2014, 22–1, 4–8. [Google Scholar]
- Walsh, O.S.; Christiaens, R.J. Relative Efficacy of Liquid Nitrogen Fertilizers in Dryland Spring Wheat. Int. J. Agron. 2016, 2016. [Google Scholar] [CrossRef] [Green Version]
- McLaughlin, M.J.; McBeath, T.M.; Smernik, R.; Stacey, S.P.; Ajiboye, B.; Guppy, C. The chemical nature of P accumulation in agricultural soils-implications for fertiliser management and design: An Australian perspective. Plant Soil 2011, 349, 69–87. [Google Scholar] [CrossRef]
- Singh, J.; Mahal, J.S.; Manes, G.S.; Singh, M. Development and evaluation of nitrogen (liquid Urea) applicator for straw mulched no-till wheat residue simultaneously. Agric. Eng. Intern. CIGR J. 2013, 15, 30–38. [Google Scholar]
- Da Silva, M.J.; Magalhães, H.C.J.; Graziano, F.P.S. Liquid fertilizer application to ratoon cane using a soil punching method. Soil Tillage Res. 2017, 165, 279–285. [Google Scholar] [CrossRef]
- Zhao, M.; Tian, Y.; Ma, Y.; Zhang, M.; Yao, Y.; Xiong, Z.; Yin, B.; Zhu, Z. Mitigating gaseous nitrogen emissions intensity from a Chinese rice cropping system through an improved management practice aimed to close the yield gap. Agric. Ecosyst. Environ. 2015, 203, 36–45. [Google Scholar] [CrossRef]
- LECO. LECO Corporation, USA. Available online: https://www.leco.com/about-us/corporate/approved-methods (accessed on 30 November 2018).
- Chapman, H.D. Cation-exchange capacity. Methods Soil Anal. Part 2 Chem. Microbiol. Prop. 1965, 9, 891–901. [Google Scholar]
- Teh, C.B.S.; Talib, J. Soil and Plant Analyses Vol. I Soil Physics Analyses; Department of Land Management, Faculty of Agriculture, Universiti Putra Malaysia: Serdang, Malaysia, 2006; Volume 1, ISBN 983-3455-64-6. [Google Scholar]
- Tan, K.H. Determination of soil water. In Soil Sampling, Preparation, and Analysis, 2nd ed.; CRC Press: Boca Raton, FL, USA, 2005; Volume 1, ISBN 9780849334993. [Google Scholar]
- Min, L.W. Reconnaissance Soil Survey of Raub-Temerloh-Jerantut Region Northwest Pahang; Soil Science Division, Research Branch, Division of Agriculture, Ministry of Agriculture and Co-Operatives: Kuala Lumpur, Malaysia, 1967; Volume 2. [Google Scholar]
- Keeney, D.R.; Nelson, D.W. Nitrogen—Inorganic Forms. Methods Soil Anal. Part 2. Chem. Microbiol. Prop. 1982, 5, 643–698. [Google Scholar]
- Douglas, L.A.; Bremner, J.M. Extraction and colorimetric determination of urea in soils. Soil Sci. Soc. Am. J. 1970, 34, 859–862. [Google Scholar] [CrossRef]
- Zadeh, F.S. Sorption-Desorption, Degradation and Leaching of Napramide in Selected Malaysian Soils; University Putra Malaysia: Serdang, Malaysia, 2010. [Google Scholar]
- SAS Institute Inc. SAS® 9.4 Statements Reference; SAS Institute Inc.: Cary, NC, USA, 2013; p. 476. [Google Scholar]
- Mariano, E.; de Sant, A.F.C.R.; Bortoletto-Santos, R.; Bendassolli, J.A.; Trivelin, P.C.O. Ammonia losses following surface application of enhanced-efficiency nitrogen fertilizers and urea. Atmos. Environ. 2019, 203, 242–251. [Google Scholar] [CrossRef]
- Abera, G.; Wolde-Meskel, E.; Beyene, S.; Bakken, L.R. Nitrogen mineralization dynamics under different moisture regimes in tropical soils. Int. J. Soil Sci. 2012, 7, 132. [Google Scholar] [CrossRef] [Green Version]
- Cardenas, L.M.; Scholefield, D.; Clark, I.M.; Hirsch, P.R. Potential mineralization and nitrification in volcanic grassland soils in Chile. Soil Sci. Plant Nutr. 2013. [Google Scholar] [CrossRef] [Green Version]
- Bundy, L.G. Managing Urea-Containing Fertilizers. In Proceedings of the Fertilizer Dealer Meeting, Madison, WI, USA, 27 November–6 December 2001; pp. 1–6. [Google Scholar]
- Rochette, P.; Angers, D.A.; Chantigny, M.H.; Gasser, M.O.; MacDonald, J.D.; Pelster, D.E.; Bertrand, N. NH3 volatilization, soil NH4+concentration and soil pH following subsurface banding of urea at increasing rates. Can. J. Soil Sci. 2013, 93, 261–268. [Google Scholar] [CrossRef] [Green Version]
- Rochette, P.; Angers, D.A.; Chantigny, M.H.; Macdonald, J.D.; Bissonnette, N.; Bertrand, N. Ammonia volatilization following surface application of urea to tilled and no-till soils: A laboratory comparison. Soil Tillage Res. J. 2009, 103, 310–315. [Google Scholar] [CrossRef]
- Junejo, N.; Khanif, M.Y.; Hanfi, M.M.; Dharejo, K.A.; Wan, Z.W.Y. Reduced loss of NH3 by coating urea with biodegradable polymers, palm stearin and selected micronutrients. Afr. J. Biotechnol. 2011, 10, 10618–10625. [Google Scholar] [CrossRef]
- Mukhopadhyay, S.; Masto, R.E.; Tripathi, R.C.; Srivastava, N.K. Application of Soil Quality Indicators for the Phytorestoration of Mine Spoil Dumps; Elsevier Inc.: Amsterdam, The Netherlands, 2019; ISBN 9780128139134. [Google Scholar]
- Zuki, M.M.B.M. Nitrogen (N) Transformation of NBPT Treated Urea on Growth and Yield of Maize (Zea mays var. Thai Super Sweet). Master’s Thesis, Universiti Putra Malaysia, Serdang, Malaysia, 2020. [Google Scholar]
- Gioacchini, P.; Nastri, A.; Marzadori, C.; Giovannini, C.; Antisari, L.V.; Gessa, C. Influence of urease and nitrification inhibitors on N losses from soils fertilized with urea. Biol. Fertil. Soils 2002, 36, 129–135. [Google Scholar] [CrossRef]
- Omar, L.; Ahmed, O.H.; Muhamad, N.; Majid, A. Improving Ammonium and Nitrate Release from Urea Using Clinoptilolite Zeolite and Compost Produced from Agricultural Wastes. Sci. World J. 2015, 2015, 12. [Google Scholar] [CrossRef] [PubMed]
- Ma, Z.; Yue, Y.; Feng, M.; Li, Y.; Ma, X.; Zhao, X.; Wang, S. Mitigation of ammonia volatilization and nitrate leaching via loss control urea triggered H-bond forces. Sci. Rep. 2019, 9, 1–9. [Google Scholar] [CrossRef] [Green Version]
- Tripolskaja, L.; Verbylienė, I. The effect of different forms of nitrogen fertilizers on nitrogen leaching. Zemdirbyste 2014, 101, 243–248. [Google Scholar] [CrossRef] [Green Version]
- Pedersen, A.; Stoumann, L.; Thorup-kristensen, K. A model analysis on nitrate leaching under different soil and climate conditions and use of catch crops. In Proceedings of the N Management in Agrosystems in Relation to the Water Framework Directive, Maastricht, The Netherlands, 24–26 October 2005; p. 1. [Google Scholar]
- Ulén, B.; Aronsson, H. Nitrogen and phosphorus leaching under the potential biennial oilseed plant Lepidium campestre L. in a field trial. Acta Agric. Scand. Sect. B Soil Plant Sci. 2018, 68, 555–561. [Google Scholar] [CrossRef]


| Soil Properties | Bungor Soil | Selangor Soil |
|---|---|---|
| Texture analysis | 28.44% clay, 2.28% silt and 69.28% sand | 68.11% clay, 29.85% silt and 2.04% sand |
| USDA soil texture class | Sandy clay loam * | Clay |
| Moisture content at field capacity (%) | 23.74 | 27.89 |
| pH | 4.93 | 6.03 |
| Total C (%) | 1.41 | 3.46 |
| Total N (%) | 0.07 | 0.27 |
| NH4+-N (mg/kg) | 16.31 | 10.07 |
| NO3−-N (mg/kg) | 11.41 | 27.11 |
| CEC (cmol+/kg) | 5.78 | 16.48 |
| Urea Application (mg/kg) | Bungor Soil Series | Selangor Soil Series | ||
|---|---|---|---|---|
| NH4+-N (mg/kg) | NO3−-N (mg/kg) | NH4+-N (mg/kg) | NO3−-N (mg/kg) | |
| U0 | 20.46 * ± 0.29 f | 5.25 ± 0.03 f | 7.04 ± 0.10 f | 6.15 ± 0.06 g |
| GU300 | 49.93 ± 0.69 d | 13.68 ± 0.11 d | 27.69 ± 0.39 c | 19.91 ± 0.21 d |
| GU400 | 66.34 ± 0.93 b | 15.43 ± 0.14 b | 29.47 ± 0.43 b | 21.32 ± 0.22 b |
| GU500 | 71.71 ± 1.20 a | 16.55 ± 0.14 a | 30.63 ± 0.44 a | 22.76 ± 0.24 a |
| LU300 | 47.51 ± 0.66 e | 11.88 ± 0.11 e | 23.29 ± 0.35 e | 16.56 ± 0.18 f |
| LU400 | 59.79 ± 0.83 c | 13.91 ± 0.12 d | 25.80 ± 0. 37 d | 18.63 ± 0.19 e |
| LU500 | 64.58 ± 0.93 b | 14.82 ± 0.12 c | 26.98 ± 0.38 c | 20.74 ± 0.22 c |
| LSD0.05 | 2.3262 | 0.323 | 1.0792 | 0.5748 |
Publisher’s Note: MDPI stays neutral with regard to jurisdictional claims in published maps and institutional affiliations. |
© 2021 by the authors. Licensee MDPI, Basel, Switzerland. This article is an open access article distributed under the terms and conditions of the Creative Commons Attribution (CC BY) license (https://creativecommons.org/licenses/by/4.0/).
Share and Cite
Motasim, A.M.; Samsuri, A.W.; Abdul Sukor, A.S.; Adibah, A.M. Nitrogen Dynamics in Tropical Soils Treated with Liquid and Granular Urea Fertilizers. Agriculture 2021, 11, 546. https://doi.org/10.3390/agriculture11060546
Motasim AM, Samsuri AW, Abdul Sukor AS, Adibah AM. Nitrogen Dynamics in Tropical Soils Treated with Liquid and Granular Urea Fertilizers. Agriculture. 2021; 11(6):546. https://doi.org/10.3390/agriculture11060546
Chicago/Turabian StyleMotasim, Ahmmed Md, Abd Wahid Samsuri, Arina Shairah Abdul Sukor, and Amin Mohd Adibah. 2021. "Nitrogen Dynamics in Tropical Soils Treated with Liquid and Granular Urea Fertilizers" Agriculture 11, no. 6: 546. https://doi.org/10.3390/agriculture11060546