Article

The Effect of Herbage Availability, Pregnancy Stage and Rank on the Rate of Liveweight Loss during Fasting in Ewes

by
Jimmy Semakula
1,2,*,
Rene Anne Corner-Thomas
1,
Stephen Todd Morris
1,
Hugh Thomas Blair
1 and
Paul Richard Kenyon
1
1
School of Agriculture and Environment, Massey University, Private Bag 11222, Palmerston North 4410, New Zealand
2
National Agricultural Research Organization, Entebbe P.O. Box 295, Uganda
*
Author to whom correspondence should be addressed.
Agriculture 2021, 11(6), 543; https://doi.org/10.3390/agriculture11060543
Submission received: 20 May 2021 / Revised: 8 June 2021 / Accepted: 10 June 2021 / Published: 12 June 2021
(This article belongs to the Section Farm Animal Production)

Abstract

:
Sheep liveweight and liveweight change are vital tools both for commercial and research farm management. However, they can be unreliable when collection procedures are not standardized or when there are varying time delays between sheep removal from grazing and weighing. This study had two stages with different objectives: (1) A liveweight loss study to determine the effect of herbage availability (Low and High) on the rate of liveweight loss of ewes at different pregnancy stages (approximately 100 days of pregnancy: P100 and 130 days: P130) and ranks (single and twin); (2) A follow-up liveweight loss study to develop and validate correction equations for delayed liveweights by applying them to data sets collected under commercial conditions. Results from each stage showed that the rate of liveweight loss varied by herbage availability and stage of pregnancy (p < 0.05) but not pregnancy-rank (p > 0.05). Further, the rate of liveweight loss differed by farm (p < 0.05). Applying liveweight correction equations increased the accuracy of without delay liveweight estimates in P100 ewes by 56% and 45% for single-bearing and twin-bearing ewes, respectively, when offered the Low-level diet. In ewes offered the High-level diet, accuracies of without delay liveweight estimates were increased by 53% and 67% for single-bearing and twin-bearing ewes, respectively. Among P130 ewes, accuracy was increased by 43% and 37% for single-bearing and twin-bearing ewes, respectively, when offered the Low herbage level and by 60% and 50% for single-bearing and twin-bearing ewes, respectively, when offered the High herbage level. In conclusion, a short-term delay of up to 8 hours prior to weighing, which is commonly associated with practical handling operations, significantly reduced the liveweight recorded for individual sheep. Using delayed liveweights on commercial farms and in research can have consequences for management practices and research results; thus, liveweight data should be collected without delay. However, when this is not feasible, delayed ewe liveweights should be corrected and, in the absence of locally devised correction equations, the ones generated in the current study could be applied on farms with similar management conditions and herbage type.

1. Introduction

Liveweight (LW) is a widely approved indicator of the energy standing of sheep at a given time, while changes in liveweight indicates whether the animal possesses a positive energy balance (liveweight gain) or a negative energy balance (liveweight loss) [1,2,3]. Liveweight quantifies total body mass and includes organ, muscle, bone, fat, body fluids and gut-fill [2]. Liveweight is rather stable over shorter time periods (i.e., a few days), but changes over a long period of time in response to physiological and environmental conditions [2,4]. Liveweight measurements can be influenced by a number of variables such as nutrition, health, wool length and wetness, stress, genotype and physiological state [5,6]. Further, the rumen contents (feed and fluid) can account for between 10% and 23% of total liveweight in ruminants [7,8]. Liveweight variations due to gut-fill in ruminants are influenced by factors affecting feed intake such as time of day relative to sunrise, size and age of the animal, ambient temperature, grazing behavior and time period since last meal [2,4,7,9,10,11].
In the southern hemisphere, countries such as New Zealand practices extensive commercial sheep production with flock size averages greater than 2500 sheep [12]. The availability of commercial automated weighing systems, such as electronic scales and radio frequency identification (RFID), has made it possible to habitually record, store and utilize liveweight data of different animals over time [5]. These weighing systems are able to record up to 400 weights per hour uninterrupted (livestock.tru-test.com, accessed on 10 December 2020) and requires six to seven hours to weigh an average flock. Additionally, routine sheep gathering and handling can increase the period of time when sheep have no access to feed and drinking water during the weighing procedure. Therefore, any delays in an individual animal’s weighing can result in substantial liveweight loss due to a reduction in gut-fill and body fluids [2,10,13]. Varying extents of weight loss have previously been reported within groups of pregnant ewes waiting to be weighed. Burnham et al. [10] reported losses of 1.78 kg (2.7% of initial liveweight) and 1.69 kg (2.6% of initial liveweight) in single-bearing and twin-bearing ewes at approximately 130 days of pregnancy after six hours and 3.4 kg (5.3% of initial liveweight) and 2.9 kg (4.5% of initial liveweight) after 12 h.
Herbage availability influences gut-fill and can affect the rate of liveweight loss of a fasting ewe [14]. Moreover, the physiological state of an ewe can affect intake, gut-fill and the rate of passage of fibrous food [8,15,16,17]. These quantities of liveweight loss can, over time, distort the accuracy of comparison of liveweights and changes in liveweight, particularly with smaller changes. Approaches aimed to minimize variability in liveweight include standardizing weighing procedures, taking multiple liveweight measurements of an individual in a day, fasting for fixed time periods prior to weighing, standardizing the feeding prior to weighing and weighing at a specific time of day [2,4]. However, such methodologies intended to minimize variation can be time consuming and, thus, are not practical for extensive commercial sheep farm use.
Liveweight presents a measure of an animal’s productivity and provides the grounds for decision making concerning its management (i.e., growth rate for a given period of time and estimation of conceptus-free liveweight). Imprecise liveweights can result in misguided conclusions where individual animal growth performance or a comparison of liveweights and changes in liveweight will be required. To the author’s knowledge, no studies have examined the interaction of herbage availability and physiological state (pregnancy-rank) on liveweight loss of fasting ewes. Recently it has been reported that the rate of liveweight loss is influenced by herbage type [13] and availability [14] in nonpregnant ewe lambs. It was hypothesized that, for a given herbage type offered, a change in its availability would likely interact with its pregnancy stage (days of pregnancy) and rank (single, twin-bearing) to alter the rate of liveweight loss when the sheep were fasted. The aim of this study was to, firstly, investigate the effects of herbage availability prior to fasting in two different reproductive stages on the rate of liveweight loss in ewes during an eight hour period. Secondly, to devise and validate ewe liveweight correcting equations. These generated equations can be integrated into modern weighing systems to provide more precise liveweight data measurement.

2. Materials and Methods

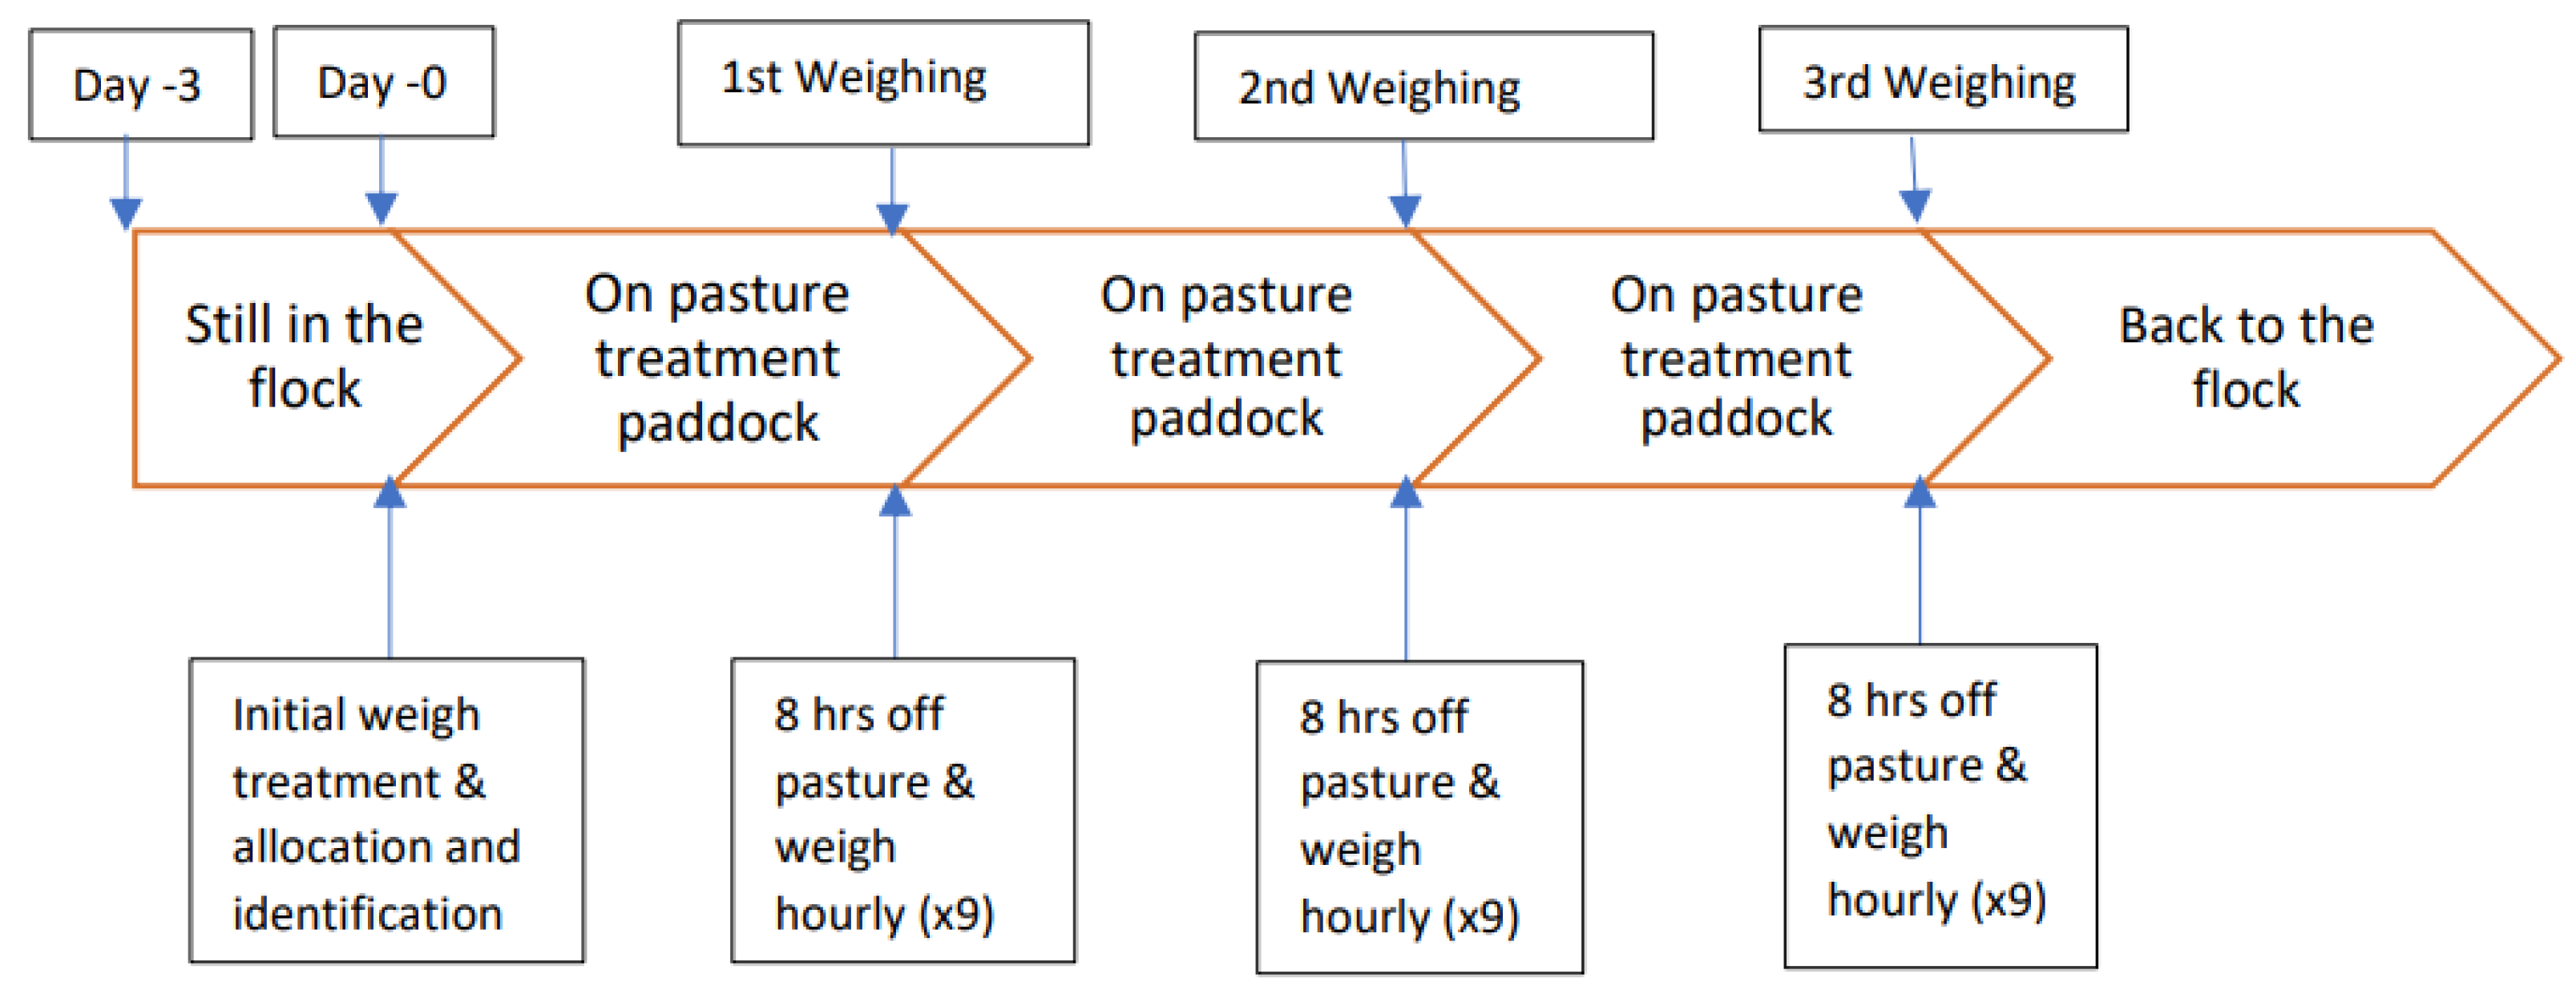
2.1. Overall Study Design

This study was executed in two stages. Stage one (calibration stage) profiled the ewe liveweight and liveweight loss on two feeding herbage availability levels (Low and High) at two pregnancy stages (100 and 130 days of pregnancy) and ranks (single-bearing and twin-bearing). Stage two (validation stage) evaluated liveweight loss correction equations developed from stage one on different ewes. The methodology utilized in this two-stage study was similar to the methodology utilized in Semakula et al. [14] on ewe lambs.

2.2. Calibration Study

2.2.1. Location

The liveweight loss profiles and correcting equations for pregnant ewes and ewes that were 130 days pregnant were conducted at Massey University’s Keeble farm, which is 5 km southeast of Palmerston North (40°24′ S and 175°36′ E), New Zealand. The study of ewes that were 100 days pregnant was conducted at Riverside farm, which is located 11 km north to north-west of Masterton (40°50′ S, 175°37′ E).

2.2.2. Study Animals, Experimental Design and Feed Management

Studies of pregnant mixed-aged Romney ewes (3–5 years) were conducted at approximately 100 days from the midpoint of a 17 day breeding period (P100) and 130 days from the midpoint of breeding period (P130). The P100 ewe study was conducted between 1 July 2020 and 14 July 2020 at the Riverside farm. The P130 ewe study was conducted between 8 August 2019 and 22 August 2019 at the Keeble farm. Ewes were assigned on day one to one of the two pre-grazing Ryegrass-based herbage availability levels (Low target range of: 900–1100 kg DM/ha, High: ≥1400 kg DM/ha). A description of the herbage is given by Semakula et al. [13]. A summary of the treatment combinations, sample size and weighing days is given in Table 1. The areas for each herbage availability level in the P100 group were Low (3.9 hectares) and High (4.0 hectares). The areas for each herbage availability level in the P130 group were Low (3.9 hectares) and High (3.1 hectares). Weather data for the study sites are given in Supplementary Materials (Figure S1).

2.2.3. Liveweight Measurement

Ewes liveweight measurements were recorded using Tru-TestTM MP600 load bars and XR5000 weigh head (Tru-Test Group, Auckland, New Zealand), as described in [13,14]. A summary of the calibration study conditions, weighing days and number of records is given in Table 1.
At day six after the allocation to different herbage availability levels, P100 ewes were weighed immediately after arriving at the weighing facility from their paddock (within five to ten minutes of removal from herbage) and then hourly for the following eight hours in their respective herbage availability levels in the same sequence. After eight hours, they were returned to their pasture paddocks (regaining their initial liveweights). This procedure occurred on two more occasions (at day 14 and day 16) while the ewes were grazing at their respective herbage availability levels (Figure 1).
At day seven and after the allocation to different herbage availability levels, P130 ewes were weighed immediately after arriving at the weighing facility from their paddock (within five to seven minutes of removal from herbage) and then they were weighed hourly for the following eight hours in their respective herbage availability levels in the same sequence. Ewes were kept in a roofed shelter during the fasting period. After eight hours, they were returned to their pasture paddocks. This procedure occurred on two more occasions (at day 12 and day 15) while the ewes were grazing at their respective herbage availability levels. Datasets of 2700 records (Liveweights including weight recorded immediately upon arrival at the weight facility) were generated from liveweights of the P100 ewes and 2700 records from the P130 ewes (Table 1).

2.2.4. Herbage Sampling, Mass and Quality

In order to determine the grazing herbage dry matter (DM) mass and ensure that the herbage availability levels were maintained within the desired ranges over the study period, rising plate meter heights were recorded at least two days before the weighing of the ewes and on the day of weighing. Levels were estimated using a rising herbage plate meter (plate diameter of 355 mm; Jenquip, Fielding, New Zealand) calculated from 200 readings (R) per herbage availability level/paddock. Sward heights were calculated using plate meter readings based on the equation below:
Sward   height   ( cm ) = ( R 2 R 1 200 )
where R2 denotes the final meter reading and R1 denotes the rising plate meter reading before the first measurement of the plate. Sward height data collected within each paddock were converted to herbage mass according to an equation developed by Hodgson et al. [18] and as described in Semakula et al. [14].
Representative herbage grab samples were collected on the day of weight measurement (1 sample each day for each of the two herbage availability levels) at random for nutritional quality analysis across each herbage availability level and pooled by day of collection to determine what the ewes were consuming. A total of 6 samples for P100 study and 6 samples for P130 study were collected. Samples were collected between 9 a.m. and 12 p.m. for each sampling time. Samples were divided into two and either freeze-dried and stored for further chemical analysis or used for dry matter determination (percentage dry matter and the ratio of live/green to dead matter) using the procedures described in Semakula et al. [14].

2.2.5. Statistical Analyses

All analyses were conducted using the R program version 3.4.4 [19]. The steps and analytic framework utilized in the current study were similar to Semakula et al. [13] and Semakula et al. [14] in ewe lambs. During the analysis, residuals were examined for outliers based on Cook’s distances [20] for normality using Q–Q plots and heteroscedasticity using residual vs. fitted plots. Additional tests carried out were, Shapiro–Wilk test [21,22] for normality and the Breush–Pagan test for heteroscedasticity [23]. Extreme outliers were excluded from the final analysis based on their influence (outliers with Cook’s distances >4/sample size were considered influential points) in the final model [24]. The final model residuals met the assumption of normality, linearity and homoscedasticity. There was, however, temporal autocorrelation in the residuals based on visual inspection of the autocorrelation plots.
Herbage availability (H), stage of pregnancy (PD) and pregnancy-rank (PR) were fitted as fixed variables. Fasting time (T: first and second order polynomial) was fixed as covariate, while an individual sheep effect was fitted as a random effect. Up to four-way interactions (H × PD × PR × T/T2) were fitted. Initially the maximum likelihood method (ML) was used to build each of the models. The nonsignificant model effects were eliminated through backward selection. The model with the least Bayesian Information criterion (BIC) and Akaike’s information criterion (AIC) values (minimal model) was retained. Final (minimal) models were generated using the restricted maximum likelihood (REML) method. All significant model effects were reported at appropriate levels of significancy and non-significant ones were reported with exact F-values and p-values. Liveweight loss equations that did not differ (p < 0.05) were pooled into one equation (combined).
Herbage mass was estimated using a general linear model fitted based on the generalized least squares procedure (GLS) in the nlme package. Herbage availability (H) and sample day (D) were fitted as fixed, while individual ID animal was considered as a random effect. A nesting structure for herbage availability nested within the sample day was also investigated. The model with nesting structure having had the least AIC and BIC values was selected as minimal and best fitting for further analysis. Model effect means were compared based on Sidak’s adjustment method [25] and by using the R program extensions emmeans and multcomp packages [26,27,28].
Prior to analysis, data were partitioned into two sets while maintaining the class balance for different herbage availability levels, pregnancy stage and rank as follows: 70% of the measurements were used to train the model (training set) and the remaining 30% were used to cross-validate the model (test set). All model parameters were calculated using a 1000-fold bootstrapping technique. Finally, the fitted regression model was then used to predict liveweight loss using the test dataset. The adjusted R2 was calculated to assess the model goodness of fit.

2.3. Validation Study

2.3.1. Location

The study was approved by Massey University ethics committee (protocol number: MUAEC 19/53). The validation studies were conducted at Massey University’s Keeble farm, Tuapaka farm and Riverside farm. The locations of both Keeble farm and Riverside farm were used in the calibration stage, while the Tuapaka farm was located 15 km north east of Palmerston North city (40°20′ S, 175°43′ E). Weather data for the study locations are presented in the Supplementary Materials (Figures S2 and S3).

2.3.2. Study Animals, Experimental Design and Feed Management

The liveweight loss equations generated at calibration were used to develop the without delay liveweight correcting equations for the respective herbage availability levels, pregnancy stages and ranks. The validation was conducted using pregnant (n = 100) mixed-aged ewes (3–5 years). All ewes had individual electronic tags none.

P100

Two validation studies were conducted using mixed-aged ewes at 100 days of pregnancy that were not previously used in study one (calibration) (Table 1). In the first study, ewes were studied from 7 July 2020 to 14 July 2020 at Keeble farm (n = 100) and in the second study from 23 July 2020 to 29 July 2020 at Tuapaka farm (n = 100). During each study a hundred ewes (n = 100) were initially individually weighed and then allocated (day one) to one of two herbage availability levels (Low target range of 900–1100 kg DM/ha, High: ≥1400 kg DM/ha) with 50 ewes (25 = single and 25 = twin-bearing) in each group such that the overall group liveweight mean did not differ. The herbage availability areas were 3.7 hectares and 2.0 hectares for Low and High herbage levels, respectively, at Tuapaka farm and 3.9 hectares and 3.0 hectares for Low and High herbage levels, respectively, at Riverside farm. The ewes had access to herbage and water ad lib up to the time they were picked from the paddock for the initial weighing.

P130

Three validation studies were conducted using mixed-aged ewes at 130 days of pregnancy that were not previously used in study one (Table 1). The first study was conducted from 24 July 2020 to 31 July 2020 on Riverside farm (n = 100), the second study from 1 August 2020 to 10 August 2020 at Keeble farm (n = 100) and the third study from 14 August 2020 to 24 August 2020 on the Tuapaka farm (n = 100). During each study a hundred ewes (n = 100) were initially individually weighed and then allocated (day one) to one of two herbage availability levels (Low target range of 900–1100 kg DM/ha, High: ≥1400 kg DM/ha) with 50 ewes (25 = single and 25 = twin-bearing) in each group. The herbage availability areas were 2.1 hectares and 2.7 hectares at Keeble farm, 2.0 hectares and 3.7 hectares at Tuapaka farm and 3.9 hectares and 3.0 hectares at Riverside farm for Low and High herbage levels, respectively.
All ewes had been bred over a 17 day period and half were carrying single and the other half (n = 50) twin pregnancies. The ewes were placed on their respective herbage availability/paddocks (only one paddock per herbage availability level) for three days (days −3 to day 0) prior to start of the study.

2.3.3. Liveweight Measurement

Ewes were weighed in stage one during six hours of fasting. The six hour fasting period was considered a more practical period of delay that may occur during the routine handling and weighing of a flock of sheep [2]. A summary of the validation study conditions, weighing days and number of records is given in Table 1. Ewes at approximately 100 days (P100) of pregnancy were weighed on two occasions that were two days apart on Keeble farm and Tuapaka farm. At approximately day 130 (P130) of pregnancy, ewes were weighed on two occasions that were two days apart on Keeble farm, five days apart for Tuapaka farm and two days apart for Riverside farm. After each day’s weighing, the ewes were returned to their paddocks.

2.3.4. Herbage Sampling, Mass and Quality

Herbage mass determination and target range monitoring over the study period were conducted as in calibration with sward height measurements recorded twice (on each day ewes were weighed) using a rising herbage plate meter. Representative herbage grab samples were also collected and analyzed for quality parameters as per stage one. A total of 4 samples for P100 and 4 samples for P130 ewes were collected.

2.3.5. Statistical Analysis

Two datasets from two farms (Keeble farm and Tuapaka farm), each containing 1400 liveweights (100 ewes, 2 replicates and 7 weights taken in 6 h including the “without delay”) from P100 ewes and three datasets from three farms (Keeble, Tuapaka and Riverside) and each containing 1400 liveweights from another 100 ewes at 130 days of pregnancy, were collected during the validation stage. Without delay liveweight was defined as weight taken immediately upon arrival at the weighing facility from paddock. Data from the calibration stage, from Riverside farm for P100 (n = 1800), using up to 6 h of fasting and from Keeble farm for P130 (n = 1800) were pooled with the two P100 and three P130 validation datasets. A mixed effects model with a first order correlation structure was fitted to the resulting dataset. Study stage (K; calibration, validation), Herbage availability (H), pregnancy-rank (R), stage of pregnancy (S) and farm (F) were treated as fixed variables; fasting time (first (T) and second order fasting time polynomial (T2)) were treated as covariate; and an individual ewe effect was fitted as a random effect. Initially a mixed effects model was fitted and included all main effects and up to five-way interactions (K × H × R × S × T and K × H × R × S × T2) nested within the farm (because the data were not balanced). Later, a separate model was fitted for each of the stages of pregnancy to include the fixed effect of farm. Each of the two models was fitted with up to five-way interactions (K × H × F × R × T; K × H × F × R × T2). Minimal models were selected using the least AIC and BIC.
Following the linear mixed effects model analysis in the calibration stage, eight separate correction equations were generated during stage one and represented each herbage availability offered (Low and High) and days of pregnancy (P100, P130) (Table S3). In order to predict the ewe liveweight immediately after leaving the paddock (without delay liveweight), correction equations were developed for each of the eleven liveweight loss equations. The without delay liveweight (cW0) was computed as described in Semakula et al. [14]. The formula for calculating the corrected liveweight (cW0) is supplied as follows:
cW0 = dWt + Wlt
where dWt denotes ewe liveweight measurement at time (t) and Wlt denotes weight loss after time (t) without access to feed and water (t = 0, …, 6 h) and computed using the separate liveweight loss equations created in stage one.
Liveweight correction equations were deployed to predict the without delay liveweight on validation datasets collected from the farms. These correction equations were applied on corresponding (i.e., collected under similar conditions: Separate) and combined data (i.e., calibration equations were not different for different herbage availability levels: Combined) or on a non-matching (Mistaken) dataset and the without delay liveweight predictions compared to the delayed weights (where no prediction equations were used: None). Several model evaluation metrics were computed to assess the quality of the liveweight correcting equations as in Semakula et al. [14]. Furthermore, each validation was conducted using 1000-fold cross validation (bootstrap) with three repeats to estimate the descriptive statistics on accuracy and error metrics (mean, standard deviation and inter-quartile range).

3. Results

3.1. Calibration Stage

3.1.1. Herbage Mass and Proportion of Live/Green Matter

Taken together, the recorded herbage masses were within the target ranges for all herbage availability levels, stages of pregnancy and pregnancy-ranks (Table S1). Average herbage mass also varied between herbage availability levels (F1, 21 = 128.5, p = 0.0004). Herbage availability did not vary between stages of pregnancy (P100 vs. P130) (F1,21 = 1.41, p = 0.248). Furthermore, herbage levels were within the target ranges with the High level having consistently greater (p = 0.01) masses than the Low level, irrespective of stage of pregnancy.
Overall, the proportion of herbage that was considered live (green) and thus edible increased with herbage availability (p = 0.03) and was comparable for all herbage levels in pregnant ewes (Table S1).

3.1.2. Herbage Chemical Composition

All chemical composition parameters varied (p < 0.05) with herbage availability except (p > 0.05) for CP (F1,11 = 0.23, p = 0.602) (Table S2). Dry matter was greater for the Low level than High level (p < 0.05). Further, herbage chemical composition did not differ among stages of pregnancy (p > 0.05). There was no interaction (F1,11 = 1.01, p = 0.373) between herbage availability and time/stage of pregnancy when the samples were collected.

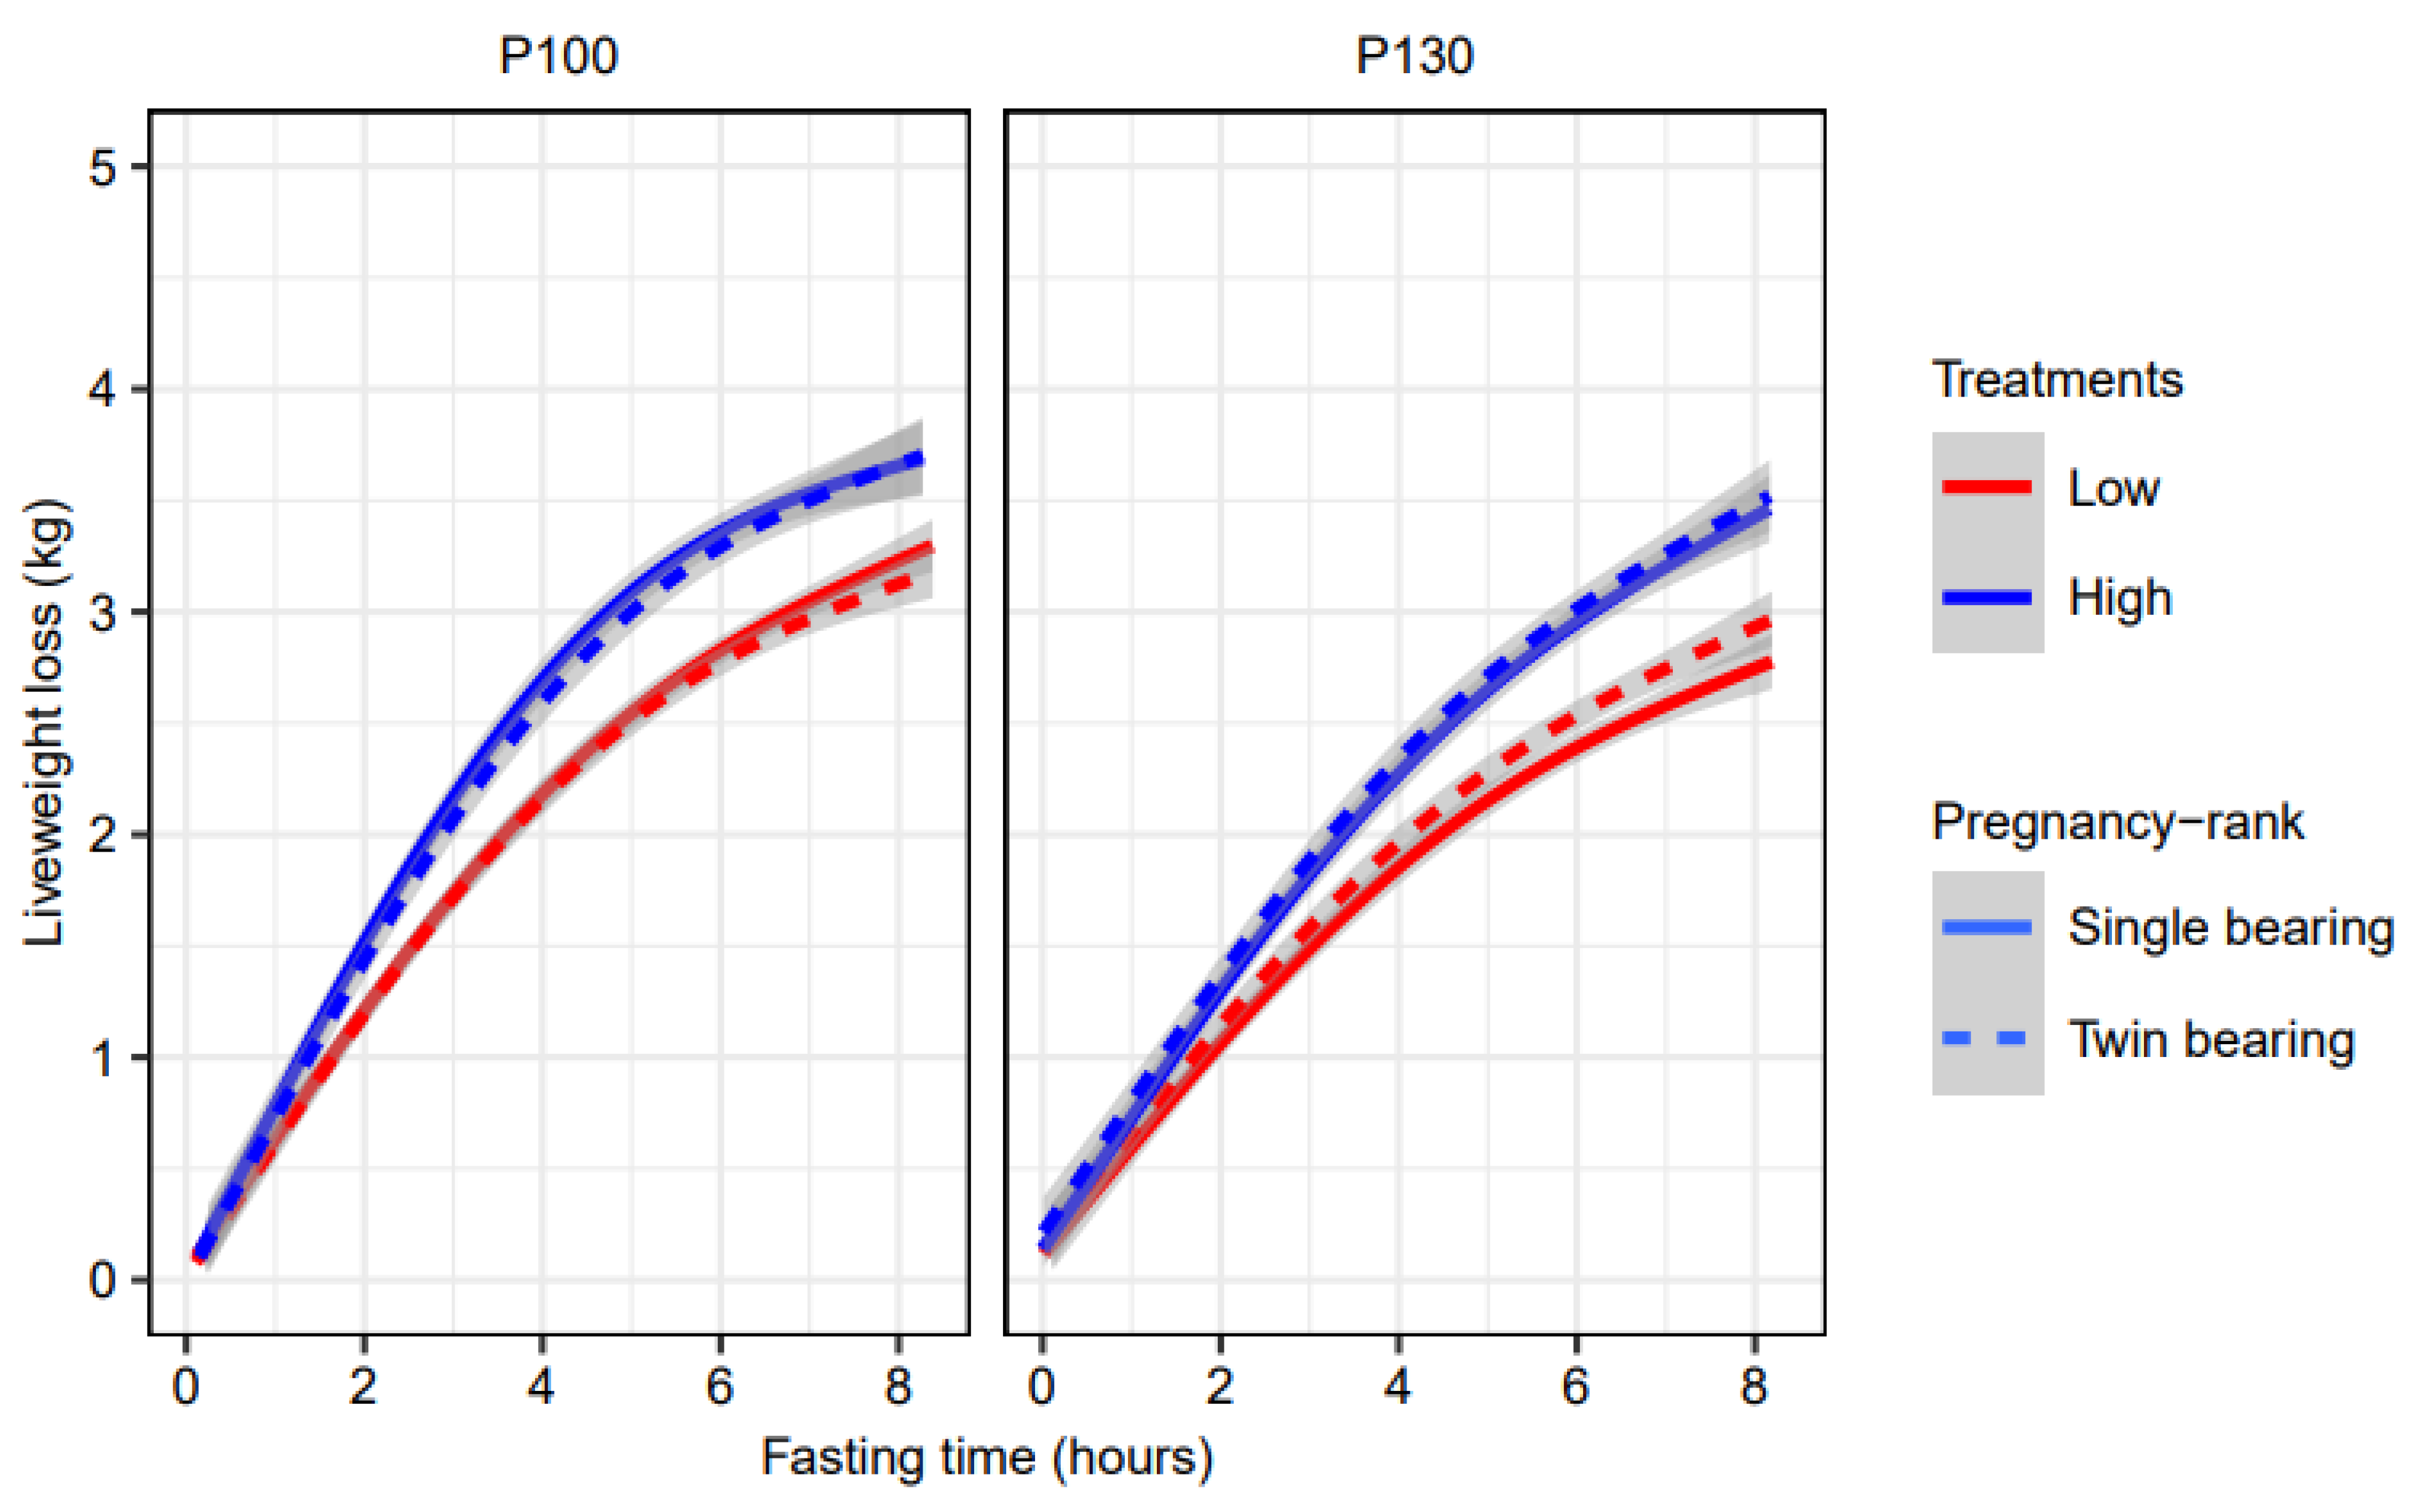
3.1.3. Effect of Herbage Availability and Physiological State on the Overall and Rate of Liveweight Loss

Overall, liveweight loss varied over fasting time (6 h or 8 h) (p < 0.01) but not pregnancy-rank of an ewe (p > 0.05). The ewes lost liveweight over the fasting period in all studies (Figure 2, Table S3). The overall liveweight losses over the eight hour fasting period for single-bearing ewes at P100 were 3.3 kg (5.1% of the initial liveweight) and 5.0 kg (7.2%) for the Low and High levels, respectively. Twin-bearing ewes lost, 3.1 kg (4.5%) and 4.8 kg (6.5%) for Low and High. At 130 days of pregnancy, single-bearing ewes lost 2.8 kg (4.0%) and 3.5 kg (4.8%) for Low and High, respectively. Twin-bearing ewes at P130 lost 2.9 kg (4.0%) and 3.5 kg (4.6%) for the Low and High herbage levels, respectively. Additionally, the variability in liveweight loss data was comparable (CV ± 2SD) across herbage levels, pregnancy stage and ranks (CV = 20−31%).
The current study utilized 2400 (2 herbage levels × stages of pregnancy × 25 ewes per group × 8 fasting hours × 3 replications) liveweight points. The liveweight loss regression equations differed by herbage availability and stage of pregnancy, resulting in different rates of loss and the loss was nonlinear (p < 0.001) over the eight hour fasting period (Figure 2, Table S3). The rate of ewe liveweight loss was greater at P100 than P130 (p < 0.01). Both herbage availability and stage of pregnancy significantly (p < 0.01) interacted to influence the rate of ewe liveweight loss. Pregnancy-rank did not affect (p > 0.05) the rate of ewe liveweight loss and, thus, individual liveweight loss regression equations for single-bearing and twin-bearing ewes were pooled to generate the combined or consolidated equations.

3.2. Validation Stage

3.2.1. Herbage Availability and Proportion of Live/Green Matter

The recorded average herbage masses were within the target ranges for all herbage availability levels and across studies (Table S4). Overall, average herbage mass differed by availability level for all ewe studies (p < 0.01). Average herbage mass differed by farm and availability level (p < 0.01). Herbage mass was greater and more varied in the High than the Low herbage mass level regardless of the stage of pregnancy and farm. There was a significant herbage availability × farm interaction (F1,16 = 10.12, p = 0.006) in the P100 study but not (F2,18 = 3.23, p = 0.53) in the P130 study. Average herbage mass offered to ewes also did not differ by stage of pregnancy (p > 0.05). Furthermore, average herbage masses offered in the High level irrespective of the stage of pregnancy varied greatly (1716 to 2226 kg DM/ha) for Keeble farm and Tuapaka farm (1712–2170) than compared to Riverside farm (1442 to 1631 kg DM/ha) (p < 0.05). However, the masses offered under the Low herbage level were comparable for all three farms (p > 0.05). Within each farm, the highest herbage variabilities were observed in the High herbage level.
Overall, the proportion of herbage that was considered live (green) increased with herbage availability (p < 0.05). Farm and farm × herbage availability did not (p > 0.05) affect the proportion of live matter.

3.2.2. Herbage Chemical Composition

All herbage chemical composition parameters varied (p < 0.05) with herbage availability and farm, with the exception (p > 0.05) of CP and ME (Table S5). There was also a significant herbage availability × farm interaction (p < 0.05) for all herbage chemical composition parameters, with the exception of CP and ME. Stage of pregnancy, thus, did not affect the chemical composition of herbage except for DM. The DM% of herbage increased with decreasing herbage level across farms (p < 0.05). There was variability in the rest of the herbage quality parameters with no predictable pattern across herbage availability and farm.

3.2.3. Six Hour Variability in Liveweight Loss at Calibration and Validation

The regression equations derived after six hours of fasting during the calibration and validation stages are presented in Tables S6 and S7. All main effects on overall liveweight loss were not significant (p > 0.05) except for time effects (first and second order fasting time polynomial), which were significant (p < 0.001). Furthermore, among interactions, only herbage availability × fasting time, stage of pregnancy × (first and second order fasting time polynomial), Study stage × fasting time and farm × fasting time were significant (p < 0.05). The rate of liveweight loss differed (p < 0.05) between herbage levels and farm but (p > 0.05) not the stage of pregnancy or pregnancy-rank.
At P100, on both Keeble farm and Tuapaka farm, the rate of liveweight loss was greater for the High herbage level than the Low group regardless of pregnancy-rank (Table S6). Within pregnancy-rank, the rate of liveweight loss was comparable (p > 0.05), except for the Low herbage level on Tuapaka farm where the rate of liveweight loss was greater for twin-bearing than single-bearing ewes.
At P130, on the Keeble farm, the rate of liveweight loss was comparable (p > 0.05) for all herbage levels across pregnancy-ranks (Table S7). On both Keeble farm and Riverside farm, ewes offered the Low herbage level had comparable liveweight loss rate trends (p > 0.05). However, in ewes offered the High herbage level, the rate of liveweight loss was greater (p < 0.05) at the Riverside farm than Keeble farm. The magnitude and rate of liveweight loss was comparable (p > 0.05) for Low and High herbage levels at both Keeble farm and Tuapaka farm except (p > 0.05) for the twin-bearing ewes offered the High herbage level.
Results showed high variability in liveweight loss data. The greatest and most variable variability was observed (CV = 0.33−0.59) during the validation and least (CV = 0.33−37) observed during the calibration stage. However, the greatest and most variable portion of variance explained by each model was observed (R2 = 0.47−0.78) during the validation stage and the least observed (R2 = 0.67−0.77) for the calibration stage (Tables S3, S6 and S7). The liveweight loss rate within six hours of fasting was comparable (p > 0.05) for all herbage availability levels across stages of calibration except for the High level.

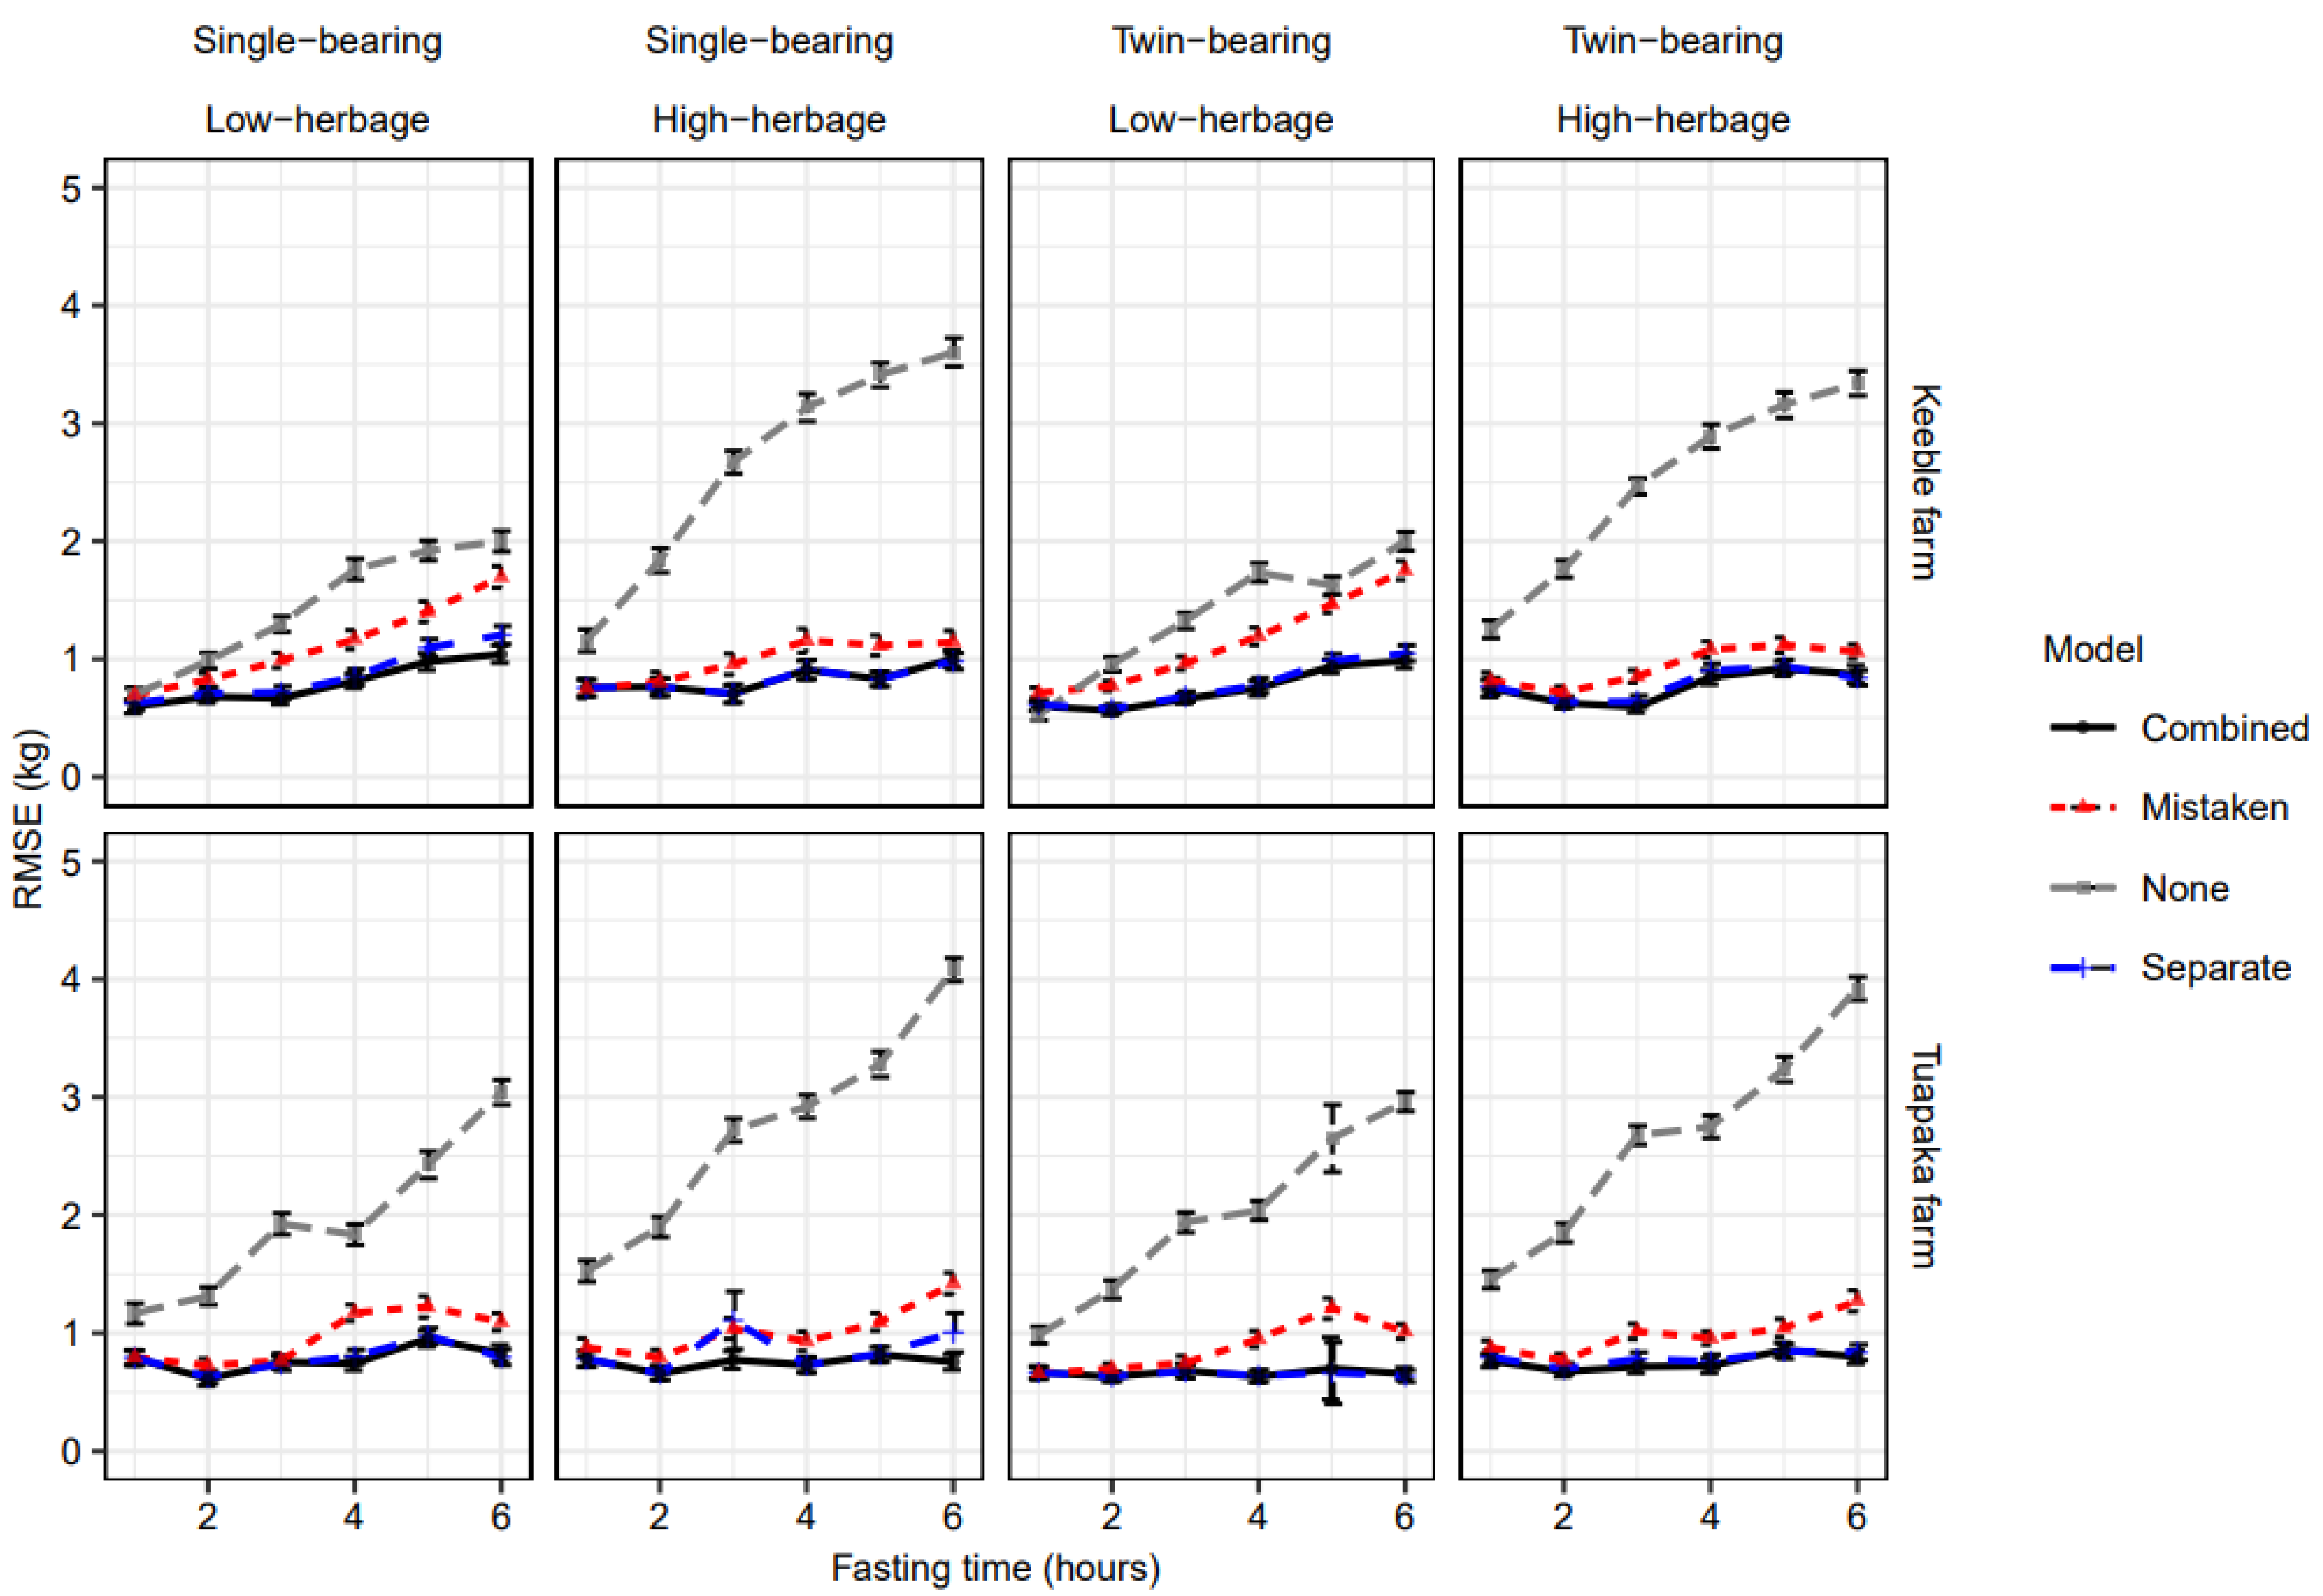
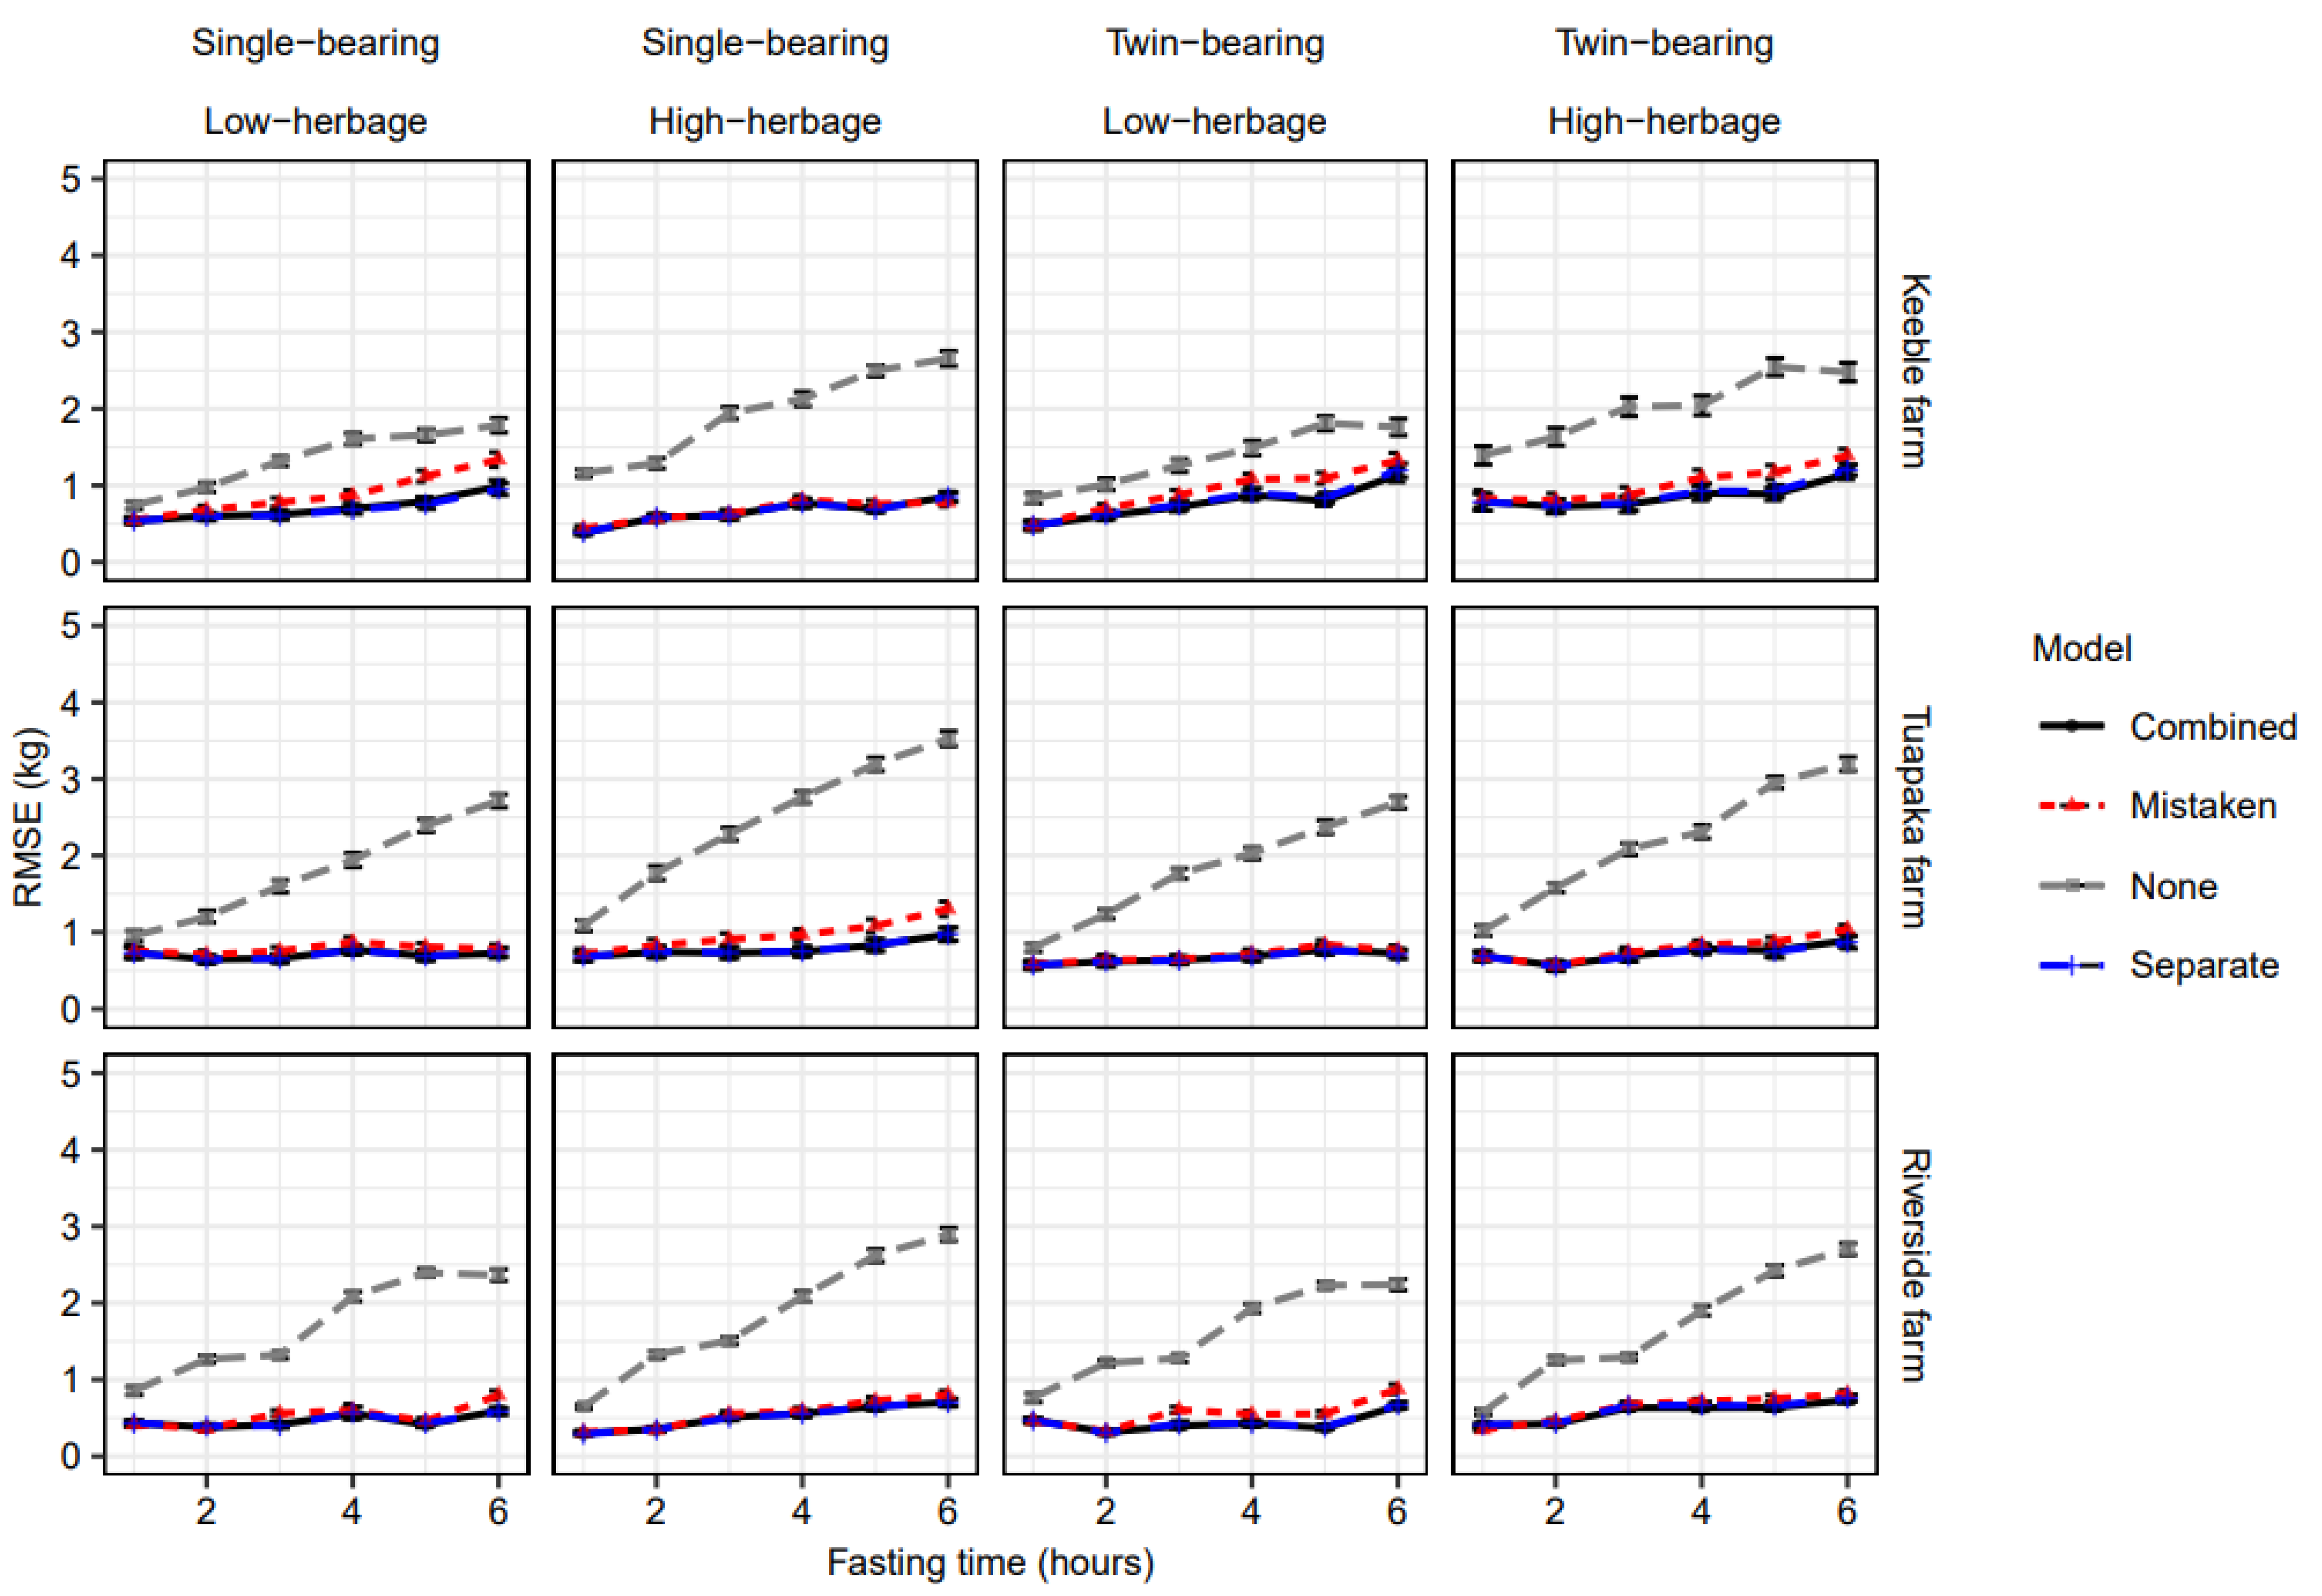
3.2.4. Using Correction Equations Can Improve without Delay Ewe Liveweight Estimation

P100

The validated results showed that the ewe liveweight correction equations for all feeding levels by feeding level, pregnancy-rank and model developed in stage one predicted liveweight with accuracy (Table S8, Figure 3), as shown by their low RPE and high R2 and RPIQ values when compared to not using any correction methods.
At Keeble farm, compared to using the delayed liveweights in single-bearing ewes offered the Low herbage level, the herbage level specific equations used to predict without delay liveweight reduced error by 37% (0.64 kg), the combined equation by 32% (0.56 kg) while using the mistaken equation (not meant for that herbage level) reduced error by 13% (0.23 kg). Within the twin-bearing ewes, error was reduced by 39.1% (0.61 kg), 41.0% (0.64 kg) and 7.7% (0.12 kg) for the specific equation, combined and mistaken equations, respectively. The liveweight estimation error was reduced more significantly among those ewes offered the High level (p < 0.01). Single-bearing ewes offered the High level, the specific equations used to predict without delay liveweight reduced error by 63% (1.87 kg), the combined equation by 63% (1.86 kg), while using the mistaken equation reduced error by 55% (1.63 kg). Within the twin-bearing, error was reduced by 61.0% (1.68 kg), 63.0% (1.74 kg) and 56% (1.54 kg) for the specific equation, combined and mistaken equations, respectively.
At Tuapaka farm, single-bearing ewes offered the Low herbage level, the specific equations used to predict without delay liveweight reduced error by 56% (1.25 kg), the combined equation by 56% (1.25 kg), while using mistaken equation reduced error by 47% (1.05 kg) compared to using the delayed liveweights. Within the twin-bearing, error was reduced by 45% (1.12 kg), 44.0% (1.11 kg) and 40% (0.99 kg) for the specific, combined and mistaken equations, respectively. The estimation error reduction proportions were comparable for ewes offered both herbage levels (p > 0.05). For single-bearing ewes offered the High herbage level, the specific equations used to predict without delay liveweight reduced error by 53% (1.77 kg) and the combined equation by 54% (1.78 kg), while using mistaken equation reduced error by 56% (1.52 kg). Within the twin-bearing, error was reduced by 67% (1.94 kg), 68% (1.97 kg) and 58% (1.70 kg) for the specific, combined and mistaken equations, respectively.

P130

The validated results showed that the ewe liveweight correction equations for all feeding levels by feeding level, pregnancy-rank and model developed predicted liveweight with substantial accuracy (Table S9, Figure 4) as shown by their low RPE and high R2 and RPIQ values than compared to not using any correction method. The reduction in the proportion of the liveweight prediction error for ewes offered the Low or High herbage level was greatest at Riverside farm regardless of pregnancy-rank (p < 0.05). Although the proportion of the liveweight prediction was comparable (p > 0.05) among ewes offered the Low herbage level, Tuapaka farm had greater error for ewes offered the High level than Keeble farm (p < 0.05).
At Keeble farm, compared to using the delayed liveweights in single-bearing ewes offered the Low level, the herbage-specific equations used to predict without delay liveweight reduced error by 43.3% (0.68 kg) and the combined equation by 42.0% (0.66 kg), while using mistaken equation reduced error by 27.4% (0.43 kg). Within the twin-bearing, error was reduced by 36.7% (0.61 kg), 38.6% (0.64 kg) and 26.5% (0.44 kg) for the specific equation, combined and mistaken equations, respectively. The estimation error was reduced more significantly among those ewes offered the High level (p < 0.01). Among single-bearing ewes offered the High level, the specific equations used to predict without delay liveweight reduced error by 60.3% (1.26 kg) and the combined equation by 59.8% (1.25 kg), while using mistaken equation reduced error by 62.7% (1.31 kg). Within the twin-bearing, error was reduced by 50.2% (1.14 kg), 50.7% (1.15 kg) and 52.4% (1.19 kg) for the specific equation, combined and mistaken equations, respectively.
At Tuapaka farm, single-bearing ewes offered the Low level, the specific equations used to predict without delay liveweight reduced error by 56.0% (1.17 kg) and the combined equation by 56.0% (1.17 kg), while using mistaken equation reduced error by 53.6% (1.12 kg) compared to using the delayed liveweights. Within the twin-bearing, error was reduced by 58.5% (1.24 kg), 58.5% (1.24 kg) and 57.5% (1.22 kg) for the specific, combined, and mistaken equations, respectively. The magnitude of the decrease in the liveweight prediction error was comparable for ewes offered both the Low and High herbage levels (p > 0.05). In single-bearing ewes offered the High level, the specific equations used to predict without delay liveweight reduced error by 61.6% (1.72 kg) and the combined equation by 61.6% (1.72 kg), while using mistaken equation reduced error by 54.8% (1.53 kg). Within the twin-bearing, error was reduced by 60.9% (1.54 kg), 60.5% (1.53 kg) and 58.9% (1.49 kg) for the specific, combined and mistaken equations, respectively.
Among single-bearing ewes offered the Low level at Riverside farm, the specific equations used to predict without delay liveweight reduced error by 65.8% (1.25 kg) and the combined equation by 65.8% (1.25 kg), while using mistaken equation reduced error by 61.1% (1.16 kg) compared to using the delayed liveweights. Within the twin-bearing, error was reduced by 68.2% (1.22 kg), 68.7% (1.23 kg) and 60.3% (1.08 kg) for the specific, combined and mistaken equations, respectively. The accuracy in predicting the without delay liveweights were comparable for ewes offered both herbage levels (p < 0.01). In single-bearing ewes offered the High level, the specific equations used to predict without delay liveweight reduced error by 69.0% (1.45 kg) and the combined equation by 68.6% (1.44 kg), while using mistaken equation reduced error by 69.0% (1.33 kg). Within the twin-bearing, error was reduced by 62.7% (1.21 kg), 64.2% (1.24 kg) and 68.9% (1.33 kg) for the specific, combined and mistaken equations, respectively.

4. Discussion

4.1. Calibration Stage

The findings indicated that, overall, the ewes lost liveweight (P100: 3.1−5.0 kg (4.9–6.9% of initial ewe liveweight); P130: 2.8−3.5 kg (3.8–4.7% of initial ewe liveweight)) between each weighing throughout the fasting period. The extent of this weight change is likely to influence the reliability of liveweight measures which may have implications for management decisions on-farm and for research unless it can be accounted for. The current study indicates that the rate of liveweight loss was affected by both feeding herbage availability and stage of pregnancy suggesting that different equations may be required to correct for liveweight loss across herbage availability levels and physiological state during a fasting event. Similarly, in ewe lambs, the rate of liveweight loss was found to be influenced by herbage availability [14].
The variation in ewe liveweight loss by herbage availability was likely due to differences in gut-fill volume resulting from differences in feed composition and, notably, dry matter (DM%) content of the herbage. The amount of DM% contained in the herbage was consistently lowest (highest moisture content) in the High level and highest in the Low level. Therefore, it appears that the ewes may have been consuming more water from the High herbage level than the Low herbage. The low dry matter (15.7–19.6%) at 100 days in pregnancy and (15.9–18.8%) at 130 days in pregnancy in both High and Low herbage levels, respectively, meant the pregnant ewes were likely to have consumed differing amounts of water in their herbage intake. Ewes need to consume approximately 3.0% of their liveweight [29,30]. This suggests that in the current study a 66.4 kg ewe offered any of the herbage levels would have consumed an average of approximately 1.99 (0.03 × 66.4) kg DM/ha. At P100, offered the Low2 herbage level (19.6% DM), the same ewe would have consumed 8.2 (1.99 × 4.1) L of water. Similarly, offered the High level (15.7% DM), the same ewe would have consumed 10.7 (1.99 × 5.4) L of water. This extra water in herbage would be excreted faster through urine than herbage via feces. The findings, therefore, suggest that the greater the DM% content of herbage, the lower the rate of ewe liveweight loss and vice versa. Further, the greater proportions of CP and ME but with correspondingly lower fiber (DM, NDF and ADF) in the High diet may have been responsible for their associated higher rate of ewe liveweight loss than Low diet. Dry matter and fiber increase with herbage density [31]. Higher levels of fiber increase water holding capacity of the gut and thus the rumen clearance [8]. Therefore, it is not surprising that Low herbage had greater DM% and fiber and, thus, the lower rate of ewe liveweight loss.
The results indicated that the rate of liveweight loss was influenced by the stage of the pregnancy but not pregnancy-rank. These results support the liveweight losses (4.0 to 7.2%) reported by Burnham et al. [10] in two-tooth and mature pregnant ewes, respectively. The results from our study further indicated that ewe liveweight loss at day 100 was greater that at day 130. This finding is corroborated by Burnham et al. [10], who reported greater ewe liveweight loss at day 70 of pregnancy than at day 130 (9.8 vs. 7.5%). The greater liveweight loss at day 100 may be due to a relatively smaller uterus volume compared to day 130, resulting in less constraint on the rumen volume. Thus, the clearance of a larger rumen volume at day 100 have a greater effect on overall liveweight loss. A negative relationship has been reported between rumen volume and uterus volume in pregnant ewes between day 72 and day 144 of gestation [32]. The authors reported a rumen volume decrease of 3.6 L and uterus volume increase of 2.8 L at days 72 and 144, respectively. The results, therefore, suggest that the rate of liveweight loss appears to decrease with advancing pregnancy. The finding that pregnancy-rank did not affect the rate of ewe liveweight loss, contrasts Burnham et al. [10] who reported a greater proportional liveweight loss in single-bearing than twin-bearing ewes at day 130 of pregnancy. This discrepancy warrants further investigation. It appears pregnancy stage is likely more relevant in ewe liveweight loss than having single or twin fetuses. This might be attributed to the greater energy needs that come with changes during pregnancy stages (days in pregnancy) compared to number of fetuses carried, especially, in the early stages of pregnancy. Furthermore, the observed differences in liveweight loss due to stages of pregnancy were not unexpected. The gestation period of a sheep is 147 days. The last trimester of gestation is the period of rapid conceptus growth (which includes fetus(es), fluid and placenta). Therefore, rapid changes in total weights are observed especially when one considers, in these breed types, the conceptus mass at term can be 16 to 18 kg in total weight [33]. Equations such as those by Gomptez [34] show just how exponential the fetal weight gain in this period is. Feeding guidelines clearly state that this is the period of rapid increase in feed demand to meet the required nutritional increases. Thus, it is important for farmers to be able to determine if feeding levels are meeting the expected feeding requirements which will allow the total weight of the ewe to increase with expected gains of the conceptus mass (i.e., so that she does not have to significantly draw on her own body reserves to meet this increased demand).
The current study utilized mixed-aged ewes of 3–5 years. An ewe reaches maturity at 3 years after which age effect becomes minimal [35,36]. Therefore, differences in age in the current study of ewes were not expected to affect the liveweight loss rate. There was in-flock and between-flock liveweight loss variation in the ewes used. The in-flock variations were comparable across farms. The in-flock variations were accounted for as random variability while the between-flock variations were captured under farm effect in the linear mixed effects model. Further, some individual animals remained highly mobile during weighing. TruTest weighing scales have an algorithm that can quickly stabilize weight measurements even in highly mobile animals. Therefore, it is unlikely that the scale accuracy was affected, hence impacting the findings. The findings indicated farms differences which could have affected the findings as stated in the discussion section.

4.2. Validation Stage

The significant polynomial regression between liveweight loss and time off feed and the subsequent linear association between delayed and “Without delay liveweight” supports the concept of the relationship between weight loss and “Without delay liveweight”. This is premised on the hypothesis that the amount of weight lost per unit time varies depending on herbage availability. It was observed that the weight prediction equations became more curvilinear than linear when herbage DM% decreased or as herbage availability was increased. Similar observations were made in a study with ewe lambs [14].
A comparison of liveweight loss trends using calibration and validation datasets demonstrated significant differences in overall liveweight loss between farms. The results also demonstrated significant liveweight loss rates between herbage levels and farms. Furthermore, the results indicated high CV% associated with this liveweight loss, which was highest at the Keeble farm and lowest at the Riverside farm. These findings point to potential differences that may have existed between sites [2]. Notably, the herbage target ranges varied in herbage levels and dry matter content (Tables S1, S2, S4 and S5), which might explain the differential weight losses on different farms. Additionally, at both Keeble farm and Tuapaka farm, liveweights were recorded manually by the operator (operator manually open and shut the weighing crate as well as pressed the record button) whereas at the Riverside farm, weights were automatically recorded (such systems also automatically open, record weight and shut the weighing crate once weighing is completed). Comparison weighing was conducted using two 20 kg loads at the start of each weighing event and, therefore, differences cannot be due to a starting calibration error. However, an automated weighing system regularly readjusts the scale to zero, thereby reducing the error introduced due to shifts in the position of the crate, while this does not occur in manual systems.
Preferably, weighing without any delay (immediately off pasture) should provide liveweight measurements with the least errors. However, if this is not attainable, the validating process has established that correction equations can be used to supply corrected liveweights (cW0) that are more precise estimates of the without delay liveweight(aW0) than a delayed liveweight (dWt). This highlights an important step towards achieving improved liveweight measurement in sheep production.
The accuracy of the correction equations was significantly impacted by herbage availability, physiological state of an ewe, stage of the pregnancy-rank, the period of delay in recording the weight and farm. This supports our previous findings [14] in which we found significant effects of herbage availability and season on the rate of liveweight loss of ewe lambs. Furthermore, the results are in partial agreement with Wishart et al. [2], who reported a significant impact of grazing location on the precision of mature ewe liveweight correction equations but not the time of delay. As expected, the authors showed that the precision of the correction equations was affected by the factors associated with fluctuations in gut-fill [2,4].
The correction equations had comparable stability overtime when predicting without delay liveweight from the delayed liveweights. The accuracy of ewe liveweight correcting equations was greater for High level than Low herbage level. This contrasts with our previous findings [14], where we reported more equation stability when predicting without delay liveweight in ewe lambs offered the Low diet than the Medium or High herbage level. The lower quantity (kg DM/ha) of grazing herbage for the Low level could have restricted the gut-fill, thereby eliciting a response to reduce ruminal emptying. In addition, ewes offered the High level had access to more variable herbage ranges (1500−2100 kg DM/ha) than those offered the Low level (900–1100 kg DM/ha for pregnant ewes), which might explain their greater associated error rates. However, it has previously been reported that intakes do not increase above the herbage level of ≈1400 kg DM/ha [37] and, thus, this potential explanation may not hold.
In the validation study, we switched the correction equations by applying them to mismatching ewe liveweights and/or applied them on consolidated datasets regardless of study farm. The results suggest that applying an equation from a different herbage level, stage of pregnancy or pregnancy-rank to predict the without delay liveweight from delayed liveweight would be a better option than using the delayed weights themselves. Furthermore, applying the correction equations on consolidated rather than farm-specific datasets yielded mixed results, with greater, comparable or lesser liveweight accuracies. The validations were conducted using a range of herbage availability levels and liveweights which should cover most situations in an extensive sheep rearing system grazing a ryegrass-based diet. The use of simple and multiple linear regression equations based on time stamps to predict liveweight loss and to predict without delay liveweight in ewe lambs has been previously reported by Semakula et al. [14]. We predicted the without delay liveweight based on herbage availability, season and time off herbage with the supplied data on the levels of accuracy the equations have compared to not using the equation. The current study supports the hypothesis that the quantity of herbage offered [14], physiological state of an ewe [10], as well as environmental factors (such as farm and grazing location) [2,7,8] impact liveweight variation. These factors may interact, which causes the differences between ewes from different farming/grazing locations, physiological state and feeding levels.
The results of the present study demonstrated that it is possible to obtain substantially accurate estimates of without delay liveweight of ewes at different pregnancy stages, ranks and those offered varying levels of ryegrass-based pasture prior to fasting. It is important to correct for liveweight losses associated with handling and delayed weighing of sheep. The developed equations utilized recorded time by the weight systems to adjust for weight. If incorporated into modern weighing systems, using these equations would require manual entry of the time when ewes are removed off pasture. Providing a supplement or water during the period off pasture would likely alter the reported ewe liveweight loss patterns and would probably maintain the “true” liveweights. This might be recommended for smaller flock sizes. However, in extensive sheep production systems with an average of 2500 ewes, supplementing ewes at the weighing facility at each time of weighing would have serious practical and economic implications.

5. Conclusions

The present study has shown that ewes lose a significant amount of liveweight when feed and drinking water are restricted. The study demonstrated that the rate of ewe liveweight loss follows a predictable trajectory over a period of time and is dependent on herbage availability offered, pregnancy-rank and stage of pregnancy. Furthermore, the study demonstrated that these liveweight losses can be substantially accounted for by using sets of correcting equations. These equations could be incorporated into weighing systems to easily and quickly supply farmers with accurate without delay ewe liveweight measurements. Future studies should explore how to control the unexplained source of variation and to observe if differing herbages require different equations. Furthermore, the extent to which the liveweight correcting equations can be generalized to ewes from other physiological states and breeds is warranted.

Supplementary Materials

The following are available online at https://www.mdpi.com/article/10.3390/agriculture11060543/s1, Figure S1: Average daily precipitation (stripped bars) and temperature (solid line: maximum, dashed: minimum) during the calibration stage over the study time for the ewes at approximately 100 days from the midpoint of a 17-day breeding period (a) and 130 days (b), Figure S2: Average precipitation (stripped bars) and temperature (solid line: maximum, dashed: minimum) during the validation period of ewes at approximately 100 days of pregnancy from the midpoint of a 17-day breeding period at Keeble farm (a) and Tuapaka farm (b), Figure S3: Average precipitation (stripped bars) and temperature (solid line: maximum, dashed: minimum) during the validation period of ewes at approximately 130 days of pregnancy from the midpoint of a 17-day breeding period at Keeble farm (a), Tuapaka farm (b) and Riverside farm (c), Table S1: Estimated least squares mean herbage mass (kg DM/ha) and proportion of live/green matter (%) of Low and High herbage levels offered to ewes by stage of pregnancy (P100, P130) and weighing day (days on which weighing was conducted: 7, 12, 14) during the calibration study, Table S2: Herbage quality parameters (means with their standard errors in parenthesis) for grab samples of the Low and High herbage levels offered to ewes (Least square means) by stage of pregnancy (P100 and P130), during calibration, Table S3: Mean initial and final delayed weight and prediction parameters with standard errors in parentheses, coef-ficient of variation (CV) and adjusted R2 for ewe liveweight loss (kg) based on herbage availability level s (Low, High) offered to ewes at two stage of pregnancy (P100, P130) and pregnancy ranks (S: single-bearing, T: twin-bearing) during eight hours of fasting at calibration stage. Adjusted R2 is the goodness-of-fit of the model, Table S4: Estimated herbage mass (least squares means) and proportion of live and dead matter of Low and High herbage levels (kg DM/ha) offered to ewe by stage of pregnancy and day of ewe weighing at different farms (Keeble, Tuapaka, Riverside) during the validation of liveweight correction models, Table S5: Herbage quality parameters for hand-plucked samples of the Low and High herbage levels by farm (Keeble, Tuapaka and Riverside), and stage of pregnancy (P100, P130) offered to ewes pre-fasting during validation, Table S6. Mean initial (without delay) and final weight and prediction parameters with standard errors in parentheses, of P100 ewe liveweight loss (kg) during a six-hour fasting periods, by herbage availability level (Low, High), farm (Keeble, Riverside) and pregnancy-rank (single, twin-bearing), Table S7. Mean initial (without delay) and final weight and prediction parameters with standard errors in parentheses, of P130 ewe liveweight loss (kg) during a six-hour fasting periods, by herbage availability (Low, High), farm (Keeble, Riverside) and pregnancy-rank (PR: single, twin-bearing), Table S8. Measures of goodness of fit and accuracy (Bias, RMSE, RPE, RPD, RPIQ, r2, CCC) of liveweight (without delay) prediction models (None: no model applied, separate: a separate/specific model applied, combined: pooled model where results were not significantly different and mistaken: model not developed for that availability level was applied) of ewes offered the Low, and High levels by pregnancy-rank (PR: single, twin-bearing) at 100 days of preg-nancy (from the midpoint of a 17-day breeding period) and during six hours of fasting tested on independent datasets (validation dataset) from Keeble farm and Riverside farm collected in 2020, Table S9. Measures of goodness of fit and accuracy (Bias, RMSE, RPE, RPD, RPIQ, r2, CCC) of liveweight (without delay) prediction models (None: no model applied, separate: a separate/specific model applied, combined: pooled model where results were not significantly different and mistaken: model not developed for that availability level was applied) of ewes offered the Low, and High herbage levels by pregnancy-rank (PR: single, twin-bearing) at 130 days of pregnancy and during six hours of fasting tested on independent datasets (validation dataset) from Keeble farm, Tuapaka farm and Riverside farm collected in 2020.

Author Contributions

Conceptualization, J.S., R.A.C.-T., S.T.M., H.T.B. and P.R.K.; data collection, R.A.C.-T., S.T.M., H.T.B. and P.R.K.; data curation, R.A.C.-T.; software, formal analysis, results interpretation, validation and preparation of the manuscript: J.S.; supervision, writing—review and editing, R.A.C.-T., S.T.M., H.T.B. and P.R.K. All authors have read and agreed to the published version of the manuscript.

Funding

The study was supported by Massey University and the International Sheep Research Centre.

Institutional Review Board Statement

The study had the approval of the Massey University ethics committee (protocol number: MUAEC 18/98, MUAEC 19/53).

Informed Consent Statement

Not applicable.

Data Availability Statement

The data presented in this study are available upon request from the corresponding author.

Acknowledgments

We wish to thank Dean Burnham, Geoff Purchas and Catriona Jenkinson for their technical assistance.

Conflicts of Interest

The authors declare no conflict of interest.

References

  1. Brown, D.J.; Ball, A.J.; Huisman, A.E. The influence of ewe weight at mating on lamb performance and reproduction of the ewe. Proc. Assoc. Adv. Anim. Breed. Genet. 2005, 16, 306–309. [Google Scholar] [CrossRef]
  2. Wishart, H.; Morgan-Davies, C.; Stott, A.; Wilson, R.; Waterhouse, T. Liveweight loss associated with handling and weighing of grazing sheep. Small Rumin. Res. 2017, 153, 163–170. [Google Scholar] [CrossRef]
  3. Young, B.A.; Corbett, J.L. Maintenance energy requirement of grazing sheep in relation to herbage availability. I. Calorimetric estimates. Aust. J. Agric. Res. 1972, 23, 57–76. [Google Scholar] [CrossRef]
  4. Coates, D.B.; Penning, P. Field and laboratory methods for grassland and animal production research. In Measuring Animal Performance; ’t Mannetje, L., Jones, R.M., Eds.; CABI Publishing: Wallingford, UK, 2000; pp. 353–402. [Google Scholar]
  5. Brown, D.J.; Savage, D.B.; Hinch, G.N.; Hatcher, S. Monitoring liveweight in sheep is a valuable management strategy: A review of available technologies. Anim. Prod. Sci. 2015, 55, 427–436. [Google Scholar] [CrossRef]
  6. Kenyon, P.R.; Maloney, S.K.; Blache, D. Review of sheep body condition score in relation to production characteristics. N. Z. J. Agric. Res. 2014, 57, 38–64. [Google Scholar] [CrossRef]
  7. Hughes, J.G. Short-term variation in animal live weight and reduction of its effect on weighing. Anim. Breed. Abstr. 1976, 44, 11. [Google Scholar]
  8. Moyo, M.; Nsahlai, I. Rate of Passsage of Digesta in Ruminants; Are Goats Different? In Goat Science; Kukovics, S., Ed.; Intech Open: London, UK, 2018; pp. 39–74. [Google Scholar] [CrossRef] [Green Version]
  9. Hogan, J.P.; Petherick, J.C.; Phillips, C.J. The physiological and metabolic impacts on sheep and cattle of feed and water depri-vation before and during transport. Nutr. Res. Rev. 2007, 20, 17–28. [Google Scholar] [CrossRef] [Green Version]
  10. Burnham, D.L.; Morel, P.C.H.; Kenyon, P.R.; Morris, S.T.; Stafford, K.J. The effect of fasting on live weight in hogget wethers and pregnant mature ewes: Brief Communication. Proc. N. Z. Soc. Anim. Prod. 2009, 69, 112–114. [Google Scholar]
  11. Gregorini, P. Diurnal grazing pattern: Its physiological basis and strategic management. Anim. Prod. Sci. 2012, 52, 416–430. [Google Scholar] [CrossRef]
  12. Cranston, L.; Ridler, A.; Cranston, L.M.; Ridler, A.; Grer, A.; Kenyon, P. Pasture measurement. In Livestock Production in New Zealand; Stafford, K., Ed.; Massey University Press: Auckland, New Zealand, 2017; pp. 88–96. [Google Scholar]
  13. Semakula, J.; Corner-Thomas, R.A.; Morris, S.T.; Blair, H.T.; Kenyon, P.R. The effect of herbage type prior to fasting on the rate of live-weight loss during fasting in ewe lambs. N Z J. Anim. Sci. Prod. 2019, 79, 131–134. [Google Scholar]
  14. Semakula, J.; Corner-Thomas, R.A.; Morris, S.T.; Blair, H.T.; Kenyon, P.R. The Effect of Herbage Availability and Season of Year on the Rate of Liveweight Loss during Weighing of Fasting Ewe Lambs. Agriculture 2021, 11, 150. [Google Scholar] [CrossRef]
  15. Gunter, S.A.; Judkins, M.B.; Krysl, L.J.; Broesder, J.T.; Barton, R.K.; Rueda, B.R.; Hallford, D.M.; Holcombe, D.W. Digesta kinetics, ruminal fermentation characteristics and serum metabolites of pregnant and lactating ewes fed chopped alfalfa hay. J. Anim. Sci. 1990, 68, 3821–3831. [Google Scholar] [CrossRef]
  16. Forbes, J.M. Voluntary Food Intake of Pregnant Ewes. J. Anim. Sci. 1970, 31, 1222–1227. [Google Scholar] [CrossRef]
  17. Kaske, M.; Groth, A. Changes in factors affecting the rate of digesta passage during pregnancy and lactation in sheep fed on hay. Reprod. Nutr. Dev. 1997, 37, 573–588. [Google Scholar] [CrossRef] [PubMed] [Green Version]
  18. Hodgson, J.; Matthews, P.N.P.; Matthews, C.; Lucas, R.J. Pasture measurement. In New Zealand Pasture and Crop Science; White, J., Hodgson, J., Eds.; Oxford University Press: Auckland, New Zealand, 1999; pp. 56–65. [Google Scholar]
  19. R Core Team. R: A Language and Environment for Statistical Computing. R version 3.4.4. R Foundation for Statistical Computing. Vienna, Austria. 2016. Available online: https://cran.r-project.org/ (accessed on 15 March 2018).
  20. Dhakal, C.P. Multiple Regression Model Fitted for Rice Production Forecasting in Nepal: A Case of Time Series Data. Nepal. J. Stat. 2018, 2, 89–98. [Google Scholar] [CrossRef] [Green Version]
  21. Peat, J.; Barton, B. Medical Statistics: A Guide to Data Analysis and Critical Appraisal; John Wiley & Sons: Chichester, UK, 2008. [Google Scholar]
  22. Shapiro, S.S.; Wilk, M.B. An analysis of variance test for normality (complete samples). Biometrika 1965, 52, 591–611. [Google Scholar] [CrossRef]
  23. Breusch, T.S.; Pagan, A.R. A Simple Test for Heteroscedasticity and Random Coefficient Variation. Econometrica 1979, 47, 1287–1294. [Google Scholar] [CrossRef]
  24. Cook, R.D. Detection of Influential Observation in Linear Regression. Technometrics 1977, 19, 15–18. [Google Scholar]
  25. Alberts, B.; Abdi, H. Bonferroni and Šidák Corrections for Multiple Comparisons. In Encyclopedia of Measurement and Statistics; Salkind, N., Ed.; Sage: Thousand Oaks, CA, USA, 2007; Volume 27, pp. 103–107. [Google Scholar]
  26. Russell, L. Emmeans: Estimated Marginal Means, aka Least-Squares Means. R Package Version 154. 2017. Available online: https://github.com/rvlenth/emmeans (accessed on 6 December 2019).
  27. Searle, S.R.; Speed, F.M.; Milliken, G.A. Population marginal means in the linear model: An alternative to least squares means. Am. Stat. 1980, 34, 216–221. [Google Scholar]
  28. Hothorn, T.; Bretz, F.; Westfall, P.; Heiberger, R.M.; Schuetzenmeister, A.; Scheibe, S.; Hothorn, M.T. Package ‘Multcomp’, Version 1.4-17. Simultaneous Inference in General Parametric Models. Available online: http://cran.stat.sfu.ca/web/packages/multcomp/multcomp.pdf (accessed on 1 May 2021).
  29. McDonald, P. Animal Nutrition: Pearson Education; Illustrated, Ed.; Prentice Hall: Hoboken, NJ, USA, 2002. [Google Scholar]
  30. Lloyd, L.E.; McDonald, B.E.; Crampton, E.W. Fundamentals of Nutrition, 2nd ed.; WH Freeman and Company: San Francisco, CA, USA, 1978; p. 466. [Google Scholar]
  31. Toupet, R.; Gibbons, A.T.; Goodacre, S.L.; Bell, M.J. Effect of herbage density, height, and age on nutrient and invertebrate generalist predator abundance in permanent and temporary pastures. Land 2020, 9, 164. [Google Scholar] [CrossRef]
  32. Forbes, J.M. The effect of pregnancy and fatness on the volume of rumen contents in the ewe. J. Agric. Sci. 1969, 72, 119–121. [Google Scholar] [CrossRef]
  33. Kenyon, P.R.; Stafford, K.J.; Jenkinson, C.M.C.; Morris, S.T.; West, D.M. The body composition and metabolic status of twin- and triplet-bearing ewes and their fetuses in late pregnancy. Livest. Sci. 2007, 107, 103–112. [Google Scholar] [CrossRef]
  34. Freer, M.; Dive, H.; Nolan, J.V. Nutrient Requirements of Domesticated Ruminants; CSIRO Publishing: Collingwood, Australia, 2007; p. 265. [Google Scholar]
  35. Cake, M.A.; Gardner, G.E.; Boyce, M.D.; Loader, D.; Pethick, D.W. Forelimb bone growth and mineral maturation as potential indices of skeletal maturity in sheep. Aust J. Agric. Res. 2006, 57, 699–706. [Google Scholar] [CrossRef]
  36. Semakula, J.; Corner-Thomas, R.A.; Morris, S.T.; Blair, H.T.; Kenyon, P.R. The Effect of Age, Stage of the Annual Production Cycle and Pregnancy-Rank on the Relationship between Liveweight and Body Condition Score in Extensively Managed Romney Ewes. Animals 2020, 10, 784. [Google Scholar] [CrossRef] [PubMed]
  37. Morris, S.; Kenyon, P. The effect of litter size and sward height on ewe and lamb performance. N. Z. J. Agric. Res. 2004, 47, 275–286. [Google Scholar] [CrossRef]
Figure 1. A timeline of the calibration study.
Agriculture 11 00543 g001
Figure 2. Change in liveweight (with 95% CI, grey shade) of the ewes offered the High herbage level at 100 days (P100) of pregnancy from the midpoint of a 17-day breeding period and 130 (P130) days. Herbage availability (Low target range herbage availability: 900–1100 kg DM/ha; High ≥ 1400 kg DM/ha).
Agriculture 11 00543 g002
Figure 3. Change in root mean square error (RMSE) with the associated standard deviation for the prediction of without delay liveweight of P100 ewes over fasting time when different correction equations/models (Separate, combined, mistaken and none) for each target herbage (Low and High) and pregnancy-rank (Single and Twin) generated in stage one were applied on the data collected in the winter season of 2020 by the farms (Tuapaka, Riverside). Availability level (Low herbage target range: 900–1100 kg DM/ha, High: ≥1400). Correction equations: treatment combination; specific or separate: herbage, stage of pregnancy and pregnancy-rank specific; combined: consolidated equations with similar effects; mistaken: any of the availability level specific equations incorrectly applied to a different treatment combination).
Agriculture 11 00543 g003
Figure 4. Change in root mean square error (RMSE) with the associated standard deviation for the prediction of without delay liveweight of P130 ewes over fasting time when different correction equations/models (Separate, combined, mistaken and none) for each target herbage (Low and High) and pregnancy-rank (single and twin) generated in stage one were applied on data collected in the winter season of 2020 by each farm (Keeble, Tuapaka and Riverside). Availability level (Low herbage target range: 900–1100 kg DM/ha, High: ≥1400). Correction equations: treatment combination; specific or separate: herbage, stage of pregnancy and pregnancy-rank; specific or combined: consolidated equations with similar effect; mistaken: any of the availability level specific equations wrongly applied to a different treatment combination.
Agriculture 11 00543 g004
Table 1. Sample size, weighing day (D) (pregnancy day in parenthesis) and liveweight records of ewes by study stage, stage of pregnancy, pregnancy-rank, farm and herbage availability.
Scheme 1Stage of PregnancyPregnancy-RankFarmHerbage AvailabilityEwe/Paddock (N)Weighing Day 1Weighing Day 2Weighing Day 2Records
CalibrationP100SingleRiversideLow25D7 (107)D10 (110)D16 (116)675
High25D7 (107)D10 (110)D16 (116)675
Twin Low25D7 (107)D10 (110)D16 (116)675
High25D7 (107)D10 (110)D16 (116)675
P130SingleKeebleLow25D7 (127)D12 (132)D15 (135)675
High25D7 (127)D12 (132)D15 (135)675
Twin Low25D7 (127)D12 (132)D15 (135)675
High25D7 (127)D12 (132)D15 (135)675
ValidationP100SingleTuapakaLow25D3 (102)D5 (107) 450
High25D3 (102)D5 (107) 450
Twin Low25D3 (102)D5 (107) 450
High25D3 (102)D5 (107) 450
SingleKeebleLow25D3 (98)D5 (100) 450
High25D3 (98)D5 (100) 450
Twin Low25D3 (98)D5 (100) 450
High25D3 (98)D5 (100) 450
P130SingleKeebleLow25D3 (127)D5 (132) 450
High25D3 (127)D5 (132) 450
Twin Low25D3 (127)D5 (132) 450
High25D3 (127)D8 (132) 450
SingleTuapakaLow25D3 (127)D8 (132) 450
High25D3 (127)D8 (132) 450
Twin Low25D3 (127)D8 (132) 450
High25D3 (127)D8 (132) 450
SingleRiversideLow25D6 (129)D8(131) 450
High25D6 (129)D8 (131) 450
Twin Low25D6 (129)D8 (131) 450
High25D6 (129)D8 (131) 450
Stages of study (Stage 1: calibration phase for profiling ewe liveweight loss based on eight hours of fasting as well as the development of the correction equations. Stage 2: validation phase for the evaluation of liveweight correction equations when applied on other data collected from different ewes based on six hours of fasting). Stage of pregnancy (P100: 100 days of pregnancy from the midpoint of a 17 day breeding period, P130: 130 days). Herbage availability (Low target range herbage availability: 900–1100 kg DM/ha, High: ≥1400 kg DM/ha). Pregnancy-rank (Single: single-bearing, Twin: twin-bearing). Weighing (values outside parentheses denote the day of trial/study, i.e., from day of animal allocation to the herbage levels, while those in the parentheses indicate the average number of days of pregnancy from the midpoint of a 17 day breeding period). Ewes were weighed within 10 min after their removal from the pasture and water on Keeble farm and Tuapaka farm and within 15 min for the Riverside farm. Ewes were weighed in their respective herbage availability levels immediately after arriving at the weighing facility from their paddock and then weighed hourly in the same herbage availability level sequence for the following eight (calibration) or six (validation) hours.
Publisher’s Note: MDPI stays neutral with regard to jurisdictional claims in published maps and institutional affiliations.

