Article

3D Point Cloud on Semantic Information for Wheat Reconstruction

1
College of Information Engineering, Sichuan Agricultural University, Ya’an 625000, China
2
Sichuan Key Laboratory of Agricultural Information Engineering, Ya’an 625000, China
*
Author to whom correspondence should be addressed.
These authors contributed equally to this work.
Agriculture 2021, 11(5), 450; https://doi.org/10.3390/agriculture11050450
Submission received: 24 March 2021 / Revised: 26 April 2021 / Accepted: 27 April 2021 / Published: 16 May 2021
(This article belongs to the Special Issue Image Analysis Techniques in Agriculture)

Abstract

:
Phenotypic analysis has always played an important role in breeding research. At present, wheat phenotypic analysis research mostly relies on high-precision instruments, which make the cost higher. Thanks to the development of 3D reconstruction technology, the reconstructed wheat 3D model can also be used for phenotypic analysis. In this paper, a method is proposed to reconstruct wheat 3D model based on semantic information. The method can generate the corresponding 3D point cloud model of wheat according to the semantic description. First, an object detection algorithm is used to detect the characteristics of some wheat phenotypes during the growth process. Second, the growth environment information and some phenotypic features of wheat are combined into semantic information. Third, text-to-image algorithm is used to generate the 2D image of wheat. Finally, the wheat in the 2D image is transformed into an abstract 3D point cloud and obtained a higher precision point cloud model using a deep learning algorithm. Extensive experiments indicate that the method reconstructs 3D models and has a heuristic effect on phenotypic analysis and breeding research by deep learning.

Graphical Abstract

1. Introduction

Wheat, as a type of cereal crop, is widely planted throughout the world. Its caryopsis is one of the staple foods of human beings. According to the statistics, wheat provides more than a 20% proportion of the world’s protein and heat for the human body [1]. A study has indicated that the required crop yield is expected to be doubled by 2050 in order to meet the demands of the rapid population growth [2]. As the climate changes, the breeding of high-yield and drought-resistant wheat varieties has been widely concerned and recognized.
Screening wheat seeds with high-yield and anti-disease genes is one of the solutions to increase yield. At present, phenotypic analysis is one of the curcial methods to screen fine varieties in breeding laboratory. Usually, the phenotypic data need to be measured manually by researchers with instruments, which makes the research process longer and the efficiency low. Fortunately, the rapid development of deep learning has enabled computer vision to be combined with breeding research. The wheat 3D point cloud model reconstructed by deep learning algorithms can be used to measure phenotypic data. The algorithm model of deep learning can also effectively replace some trivial and miscellaneous tasks that need to be completed manually. The 3D wheat model reconstructed by the algorithm can be used to calculate plant height, leaf area, leaf thickness, and other information. Moreover, the point cloud model can be used for segmentation tasks. It is easy to distinguish the stems and leaves of wheat and to measure various data separately by using the point cloud model. In this paper, as shown in Figure 1, our work is mainly divided into three parts.
Object-Detection: we used object detection algorithm to detect and judge whether the wheat leaves are unfolded. JC Zadoks et al. [3] proposed the decimal code for the growth stages of cereals. We drew lessons from the method proposed by P Sadeghi-Tehran et al. [4] to judge the growth stage of wheat. The unfoldment of different leaves represents that wheat enters different growth stages. With the help of the detection model, we can automatically judge which growth stage the wheat is in and record the time from sowing to the growth stage. Compared with the traditional machine learning and image processing methods [4], our method does not need to perform complex preprocessing on the image, the detection speed of our method is increased by about 30%, and the detection accuracy is higher. The object detection algorithm is used to collect wheat phenotype information, and the information is made into text descriptions of the wheat.
Text-to-Image: it is very difficult to transform semantic information into point cloud directly, so we used 2D images as the intermediate medium. We used Attentional Generative Adversarial Networks (AttnGAN) [5] to transform the growth environment and phenotypic information collected during wheat growth from the text domain to image domain. In the process of wheat growth, we used the temperature and humidity sensor to record the temperature and humidity information of the wheat growth environment in real time and reserved the information. Then, we combined the information with the probability and time of leaf unfolded detected in the first stage to a complete text description, which is used to train the AttnGAN. In the end, the AttnGAN model outputs images according to the text description. After testing, the inception score (IS) [6] of the generated images reached 4.41 and the R-precision [5] reached 64.78%.
Three-Dimensional Point Cloud: in this part, we used images that were generated in the second part to reconstruct the 3D model of wheat. It is really hard to reconstruct the 3D point cloud from the generated images. Therefore, the method we used is to complete the task in two stages. In the first stage, we reconstructed the wheat from a 2D image into a rough point cloud. Although the point cloud generated in the first stage is somewhat ambiguous, it still meets the shape characteristics of wheat. In the second stage, the point cloud, which is generated in the first stage, is used as the input. Then, an unsupervised learning method is used to generate more accurate point cloud. Moreover, the point cloud generated in this stage is closer to the shape of real wheat.
This paper is organized into five sections, including the present one. Section 2 introduces the development and important contributions of the fields covered in this paper. Section 3 describes how to collect datasets and to preprocess the collected data. At the same time, the theoretical derivation of the model used in this paper is illustrated in detail. In Section 4, the training process and the experimental results are displayed and discussed, and we list a series of comparative experiments that we performed. The feasibility and effectiveness of the experiment are discussed in this section. The last section summarizes the contribution of this paper, and future research directions are proposed. The contribution of our method is threefold:
  • A wheat dataset is proposed, which contains wheat data annotation for object detection, text-to-image, and 3D point cloud; it can be used by other researchers.
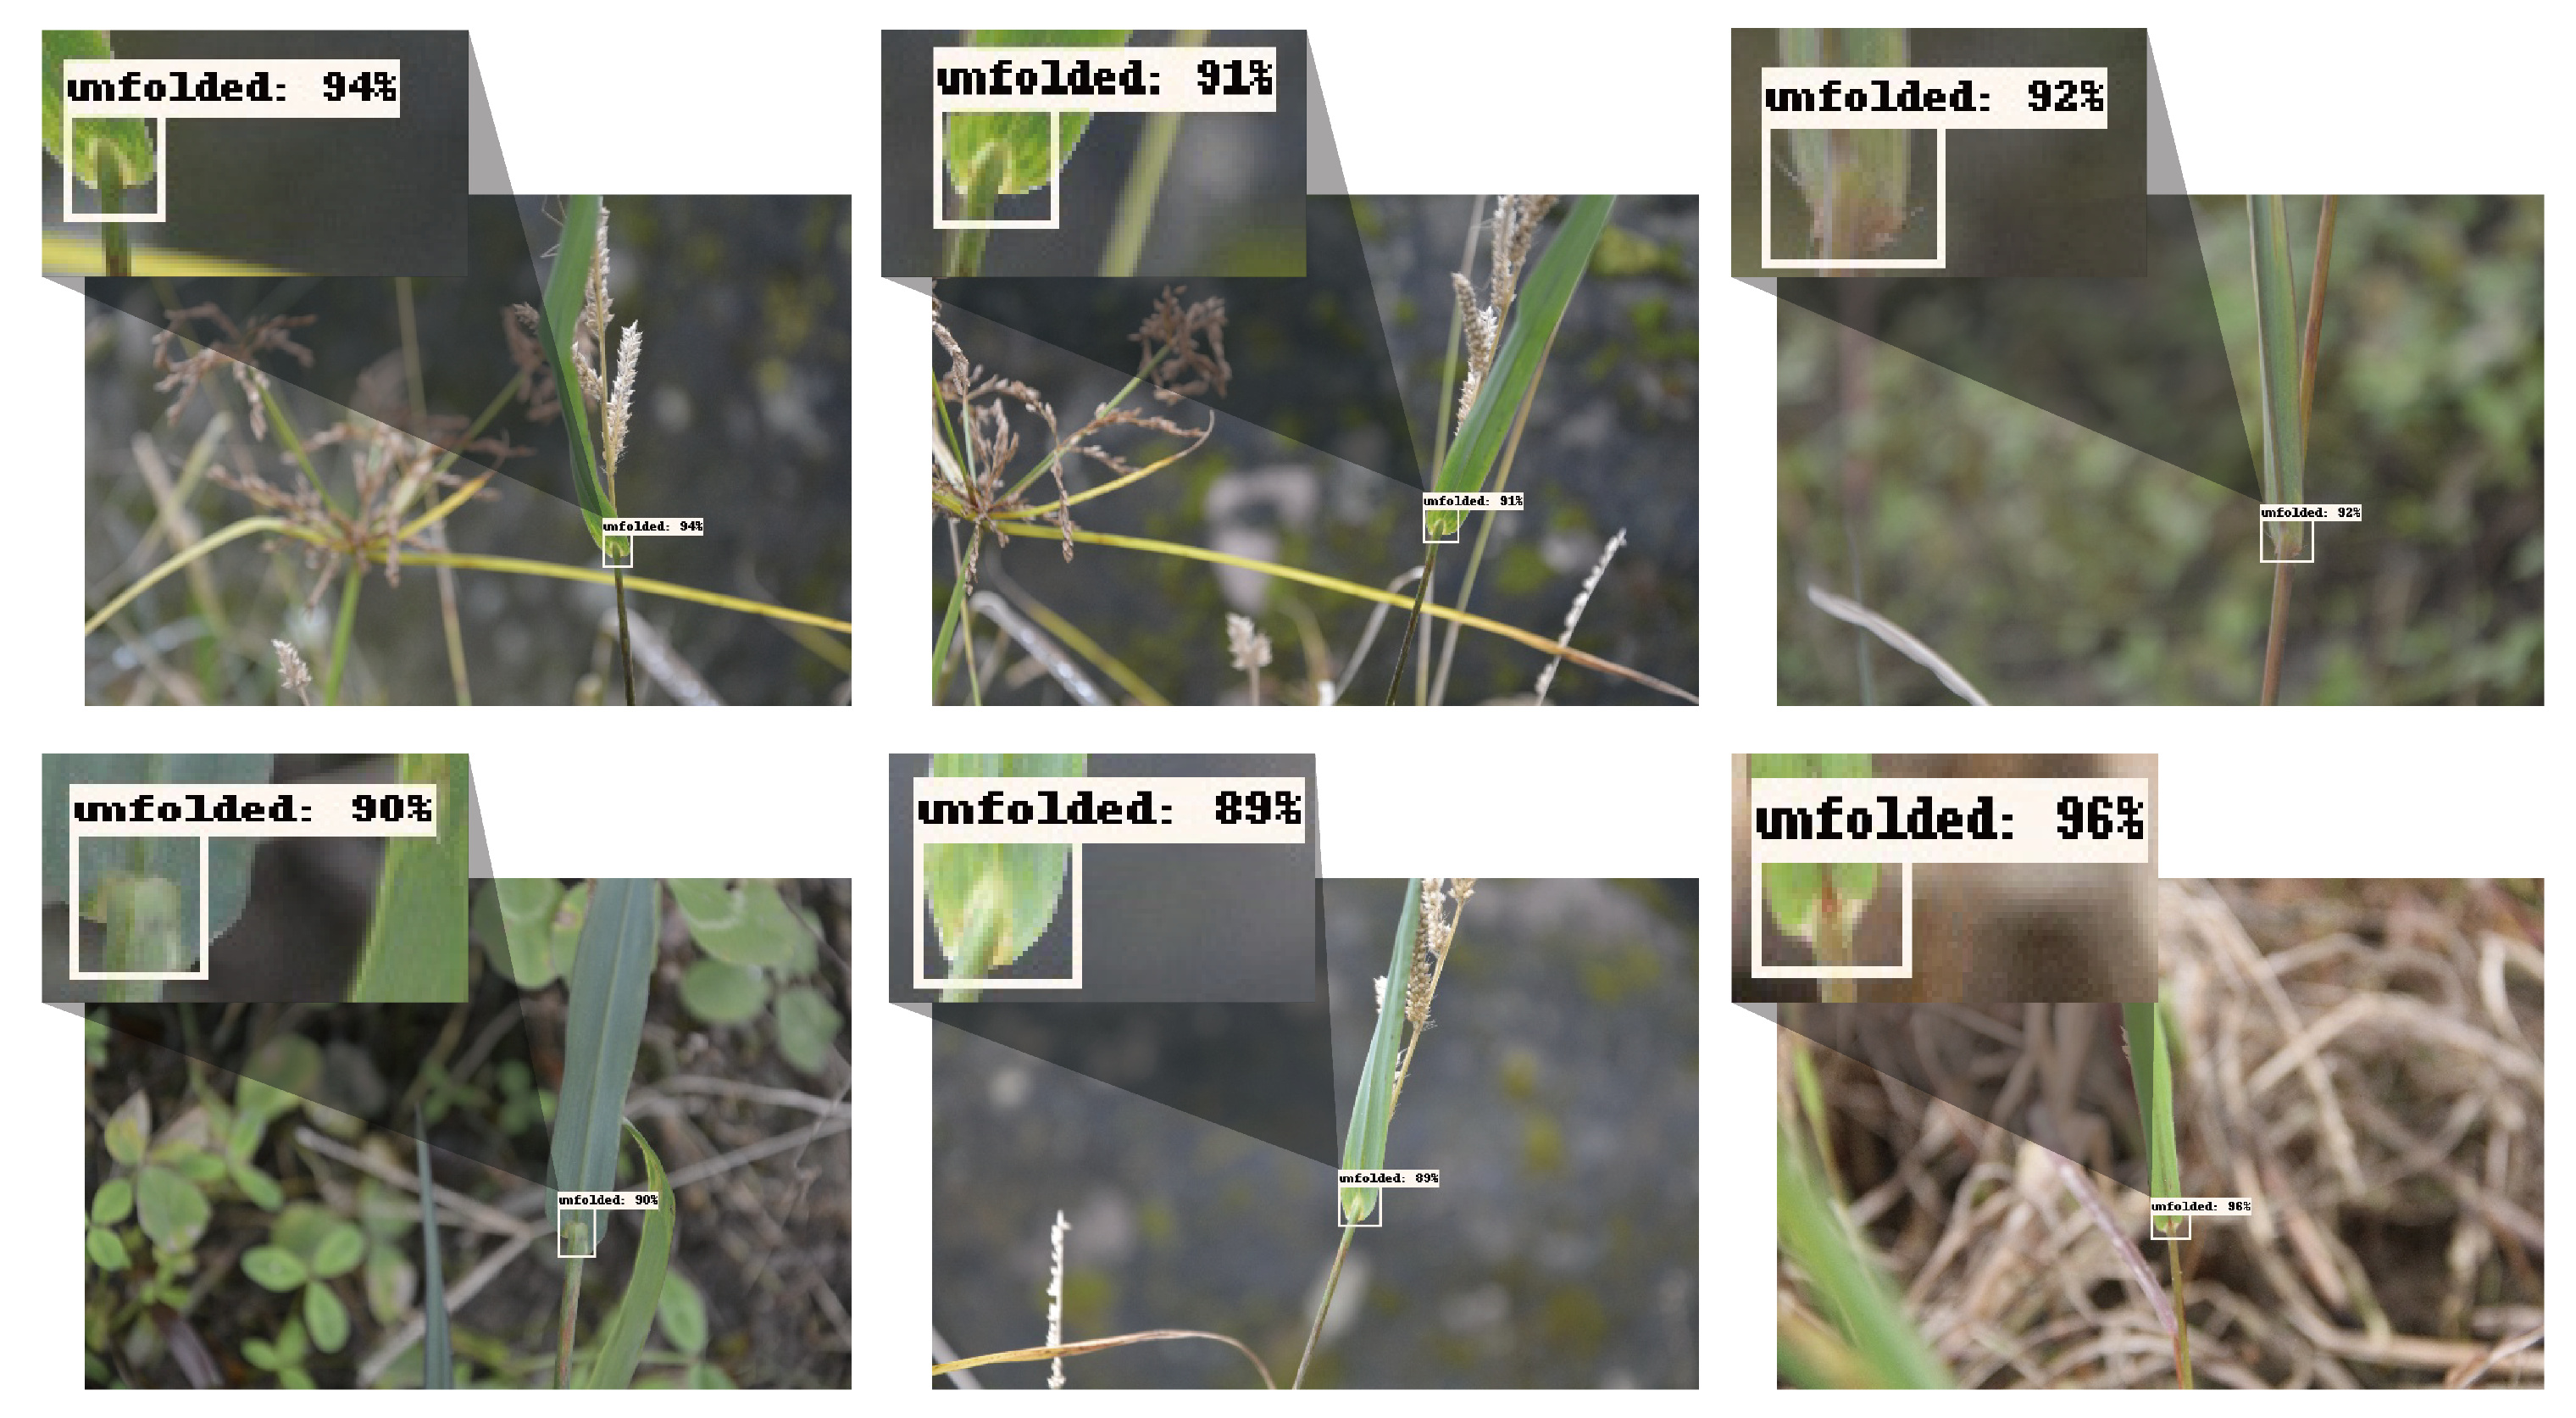
  • The method of object detection is used to automatically detect when wheat enters each growth stage.
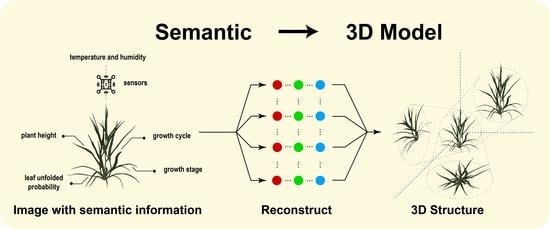
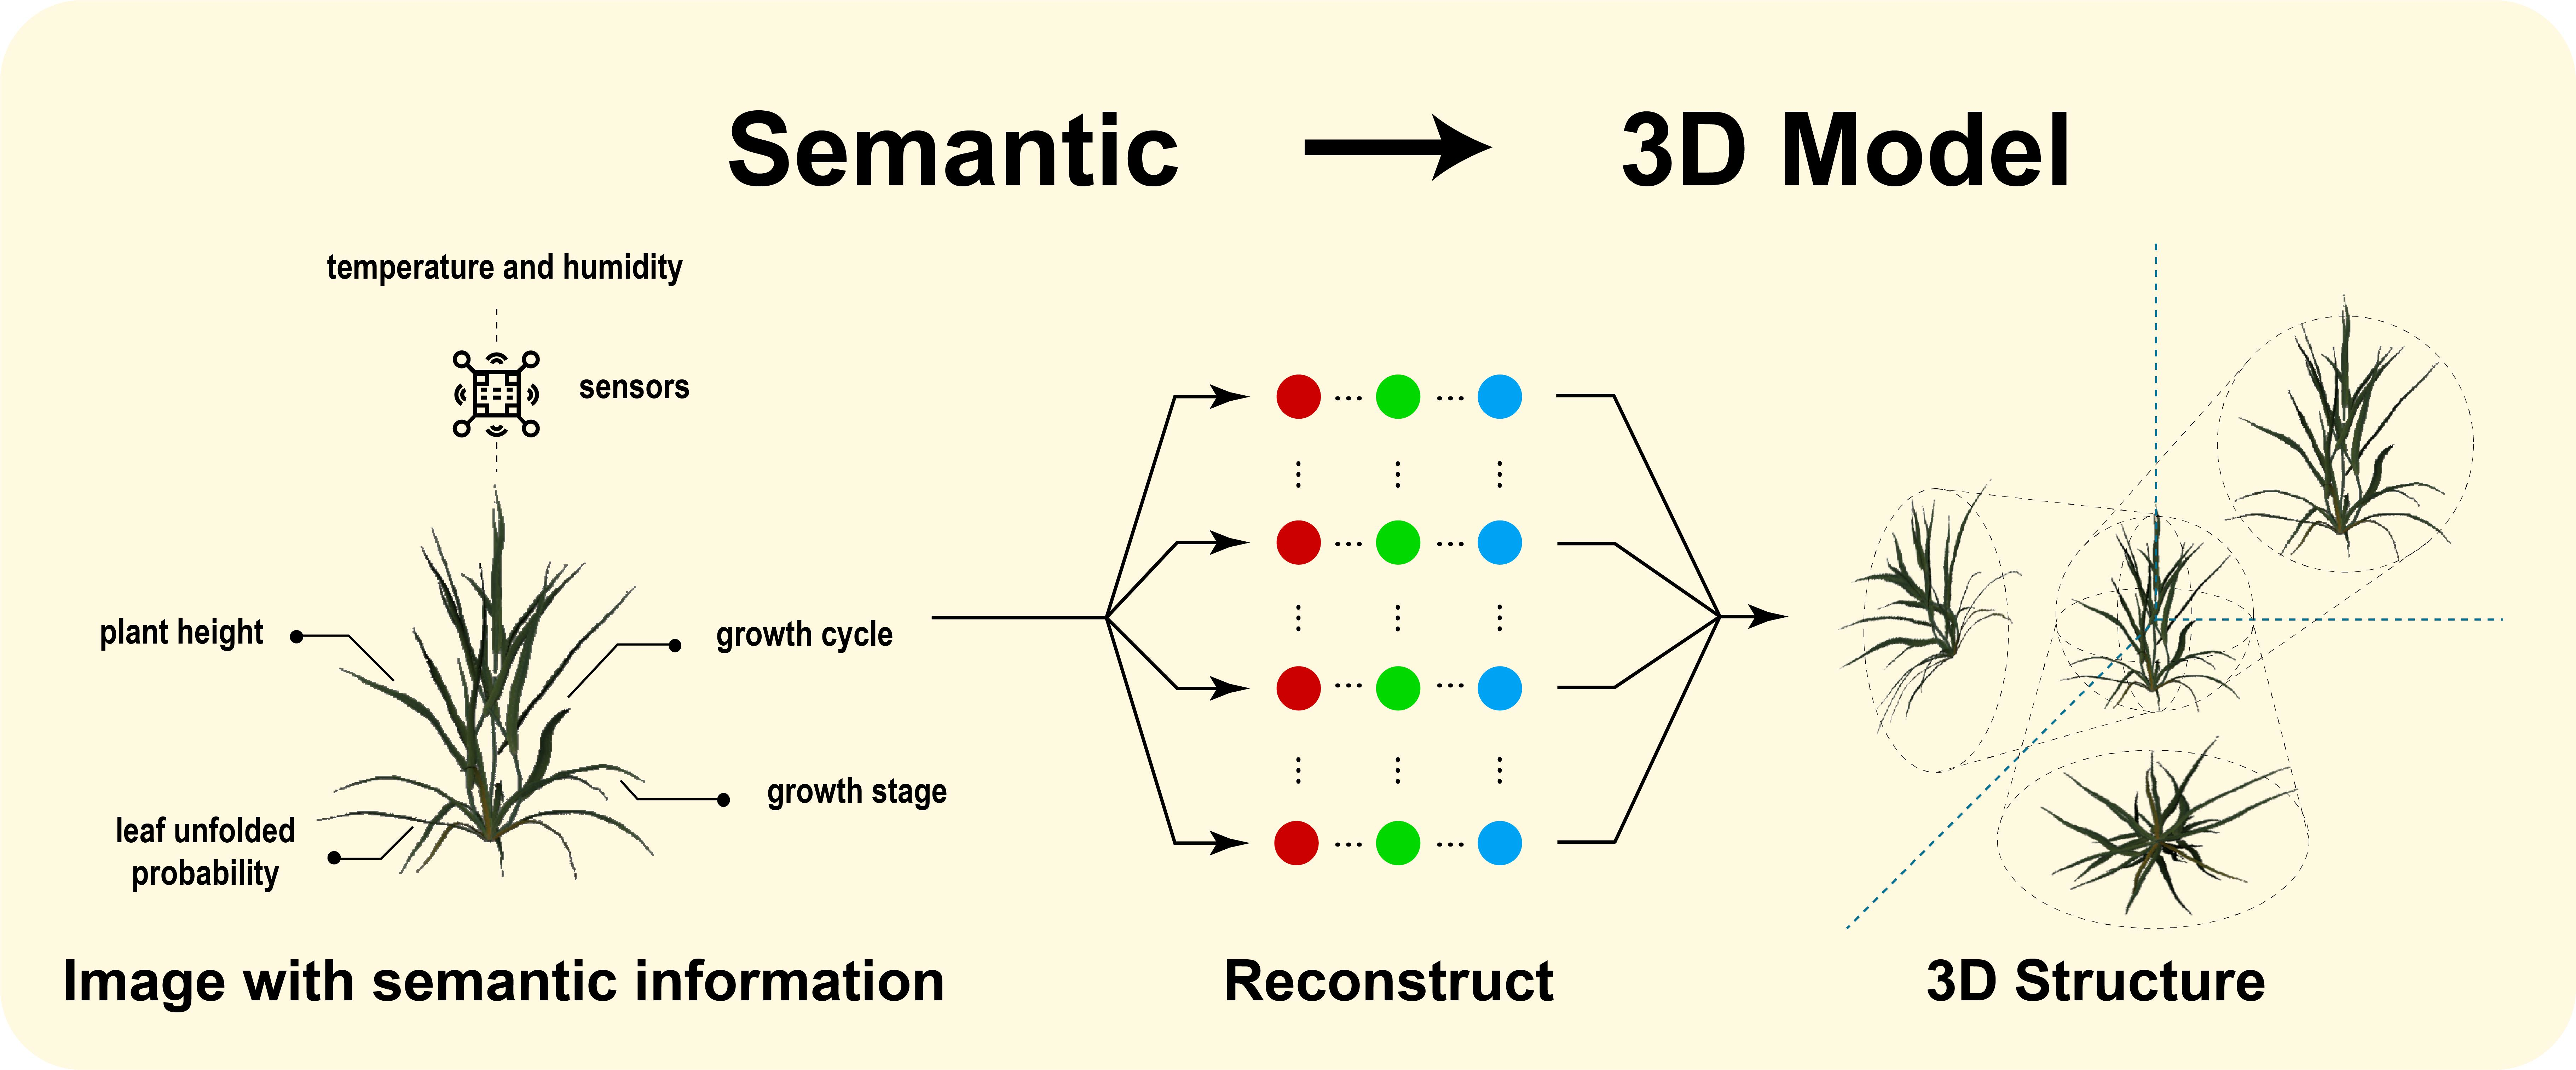
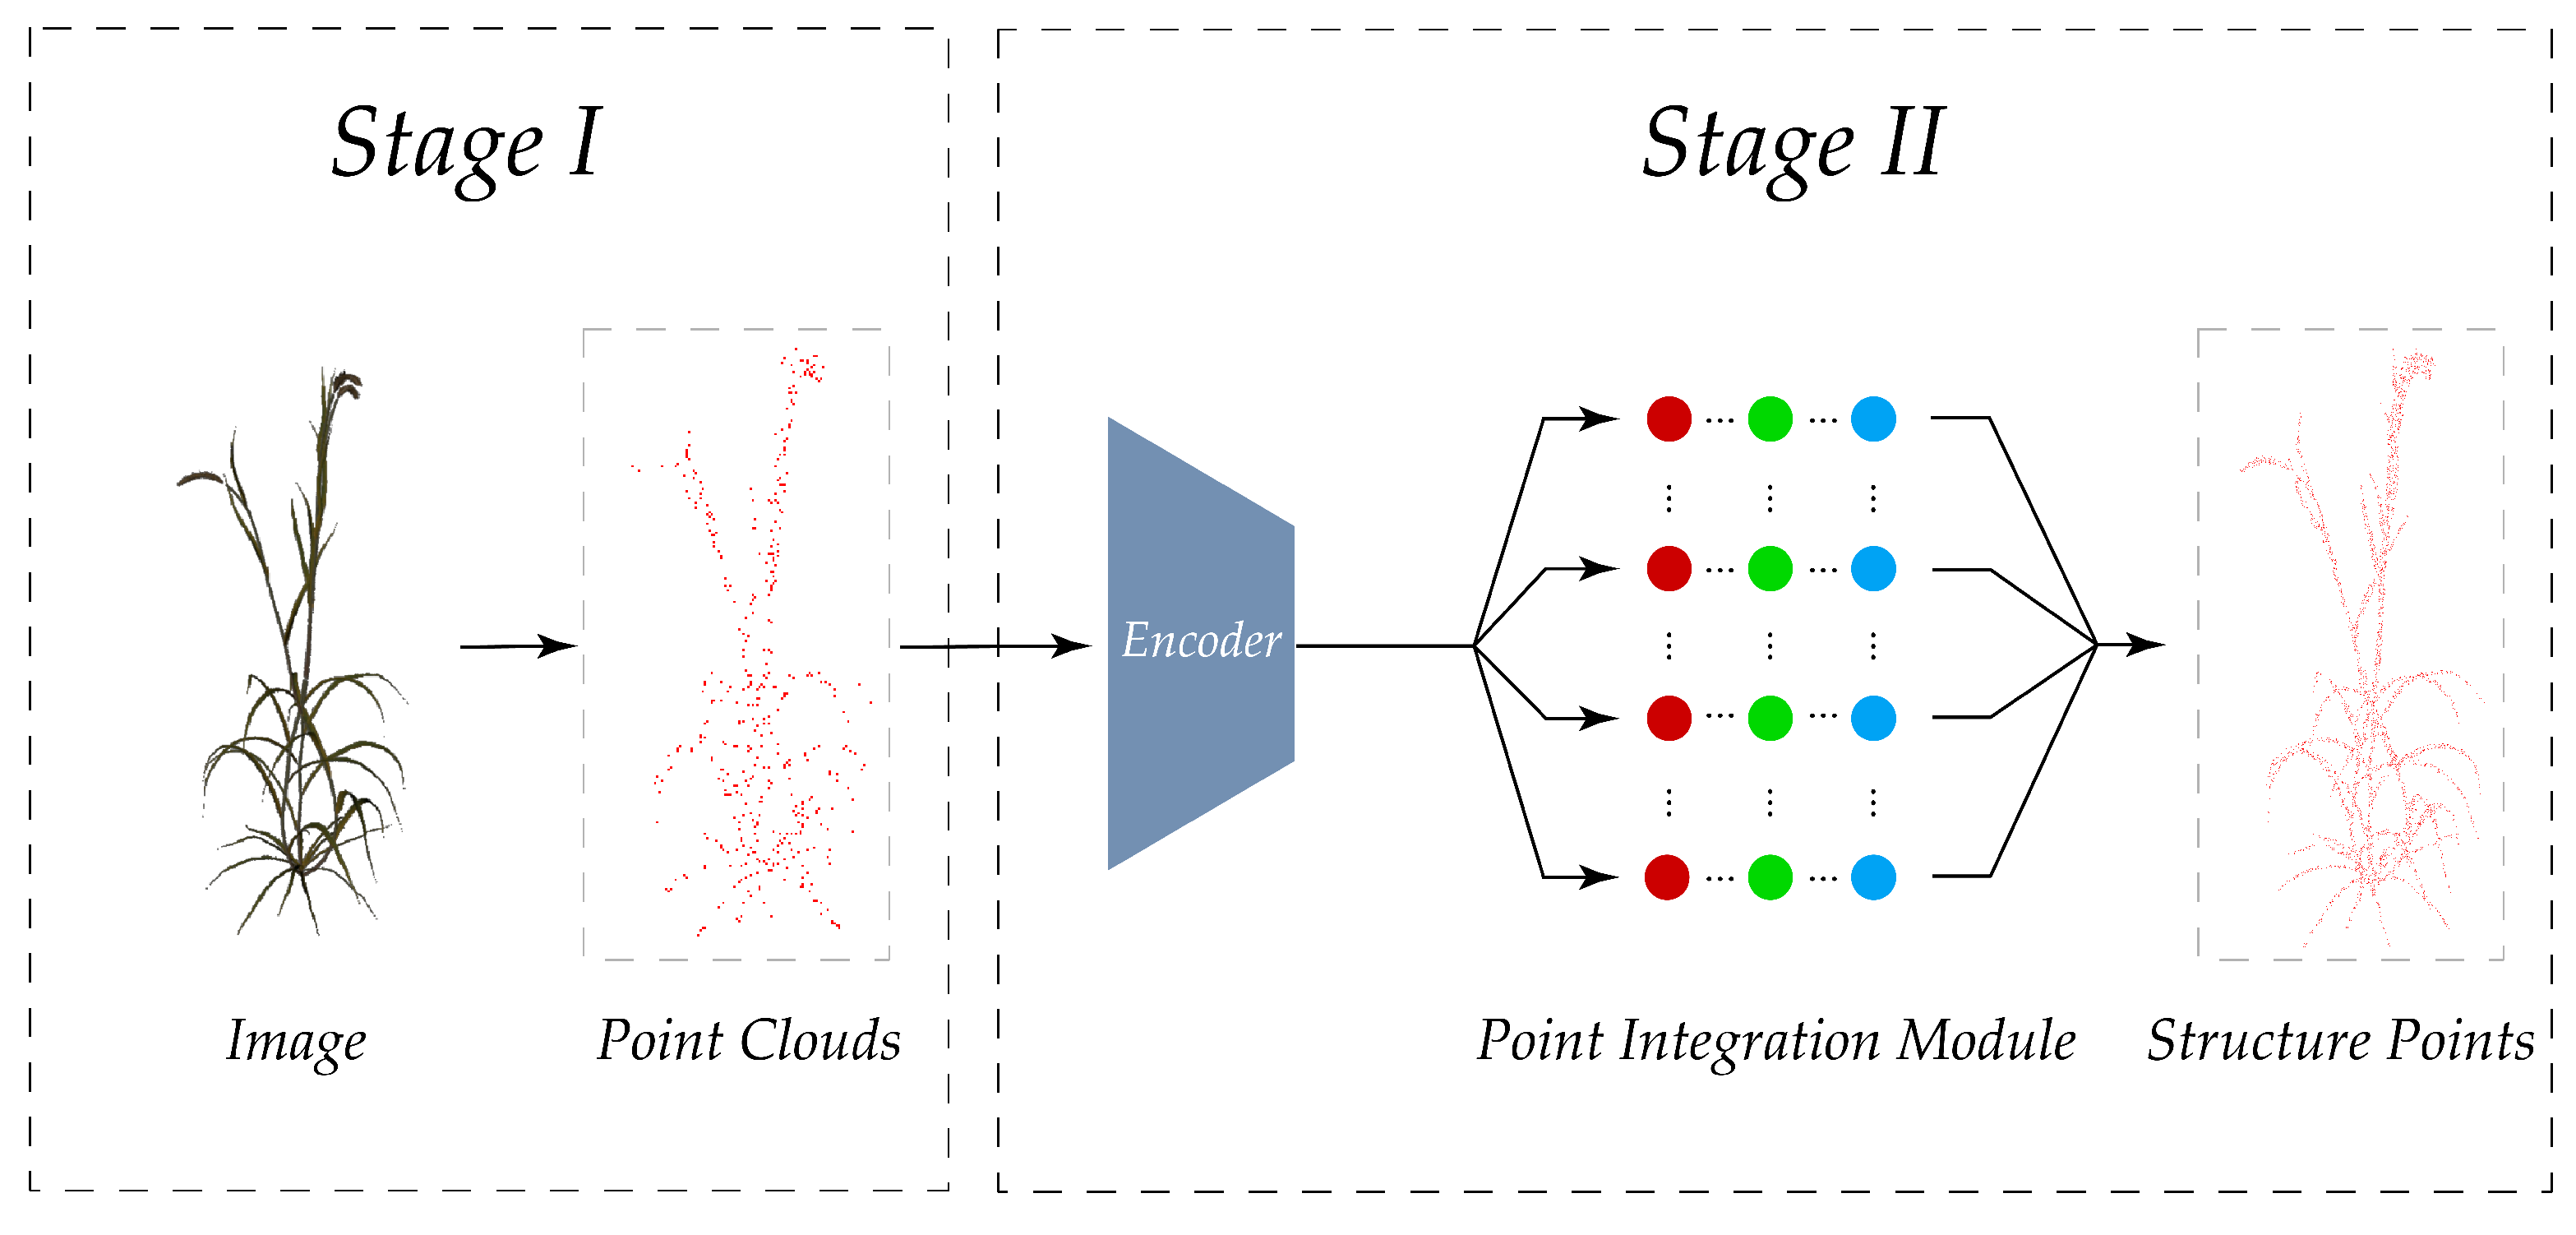
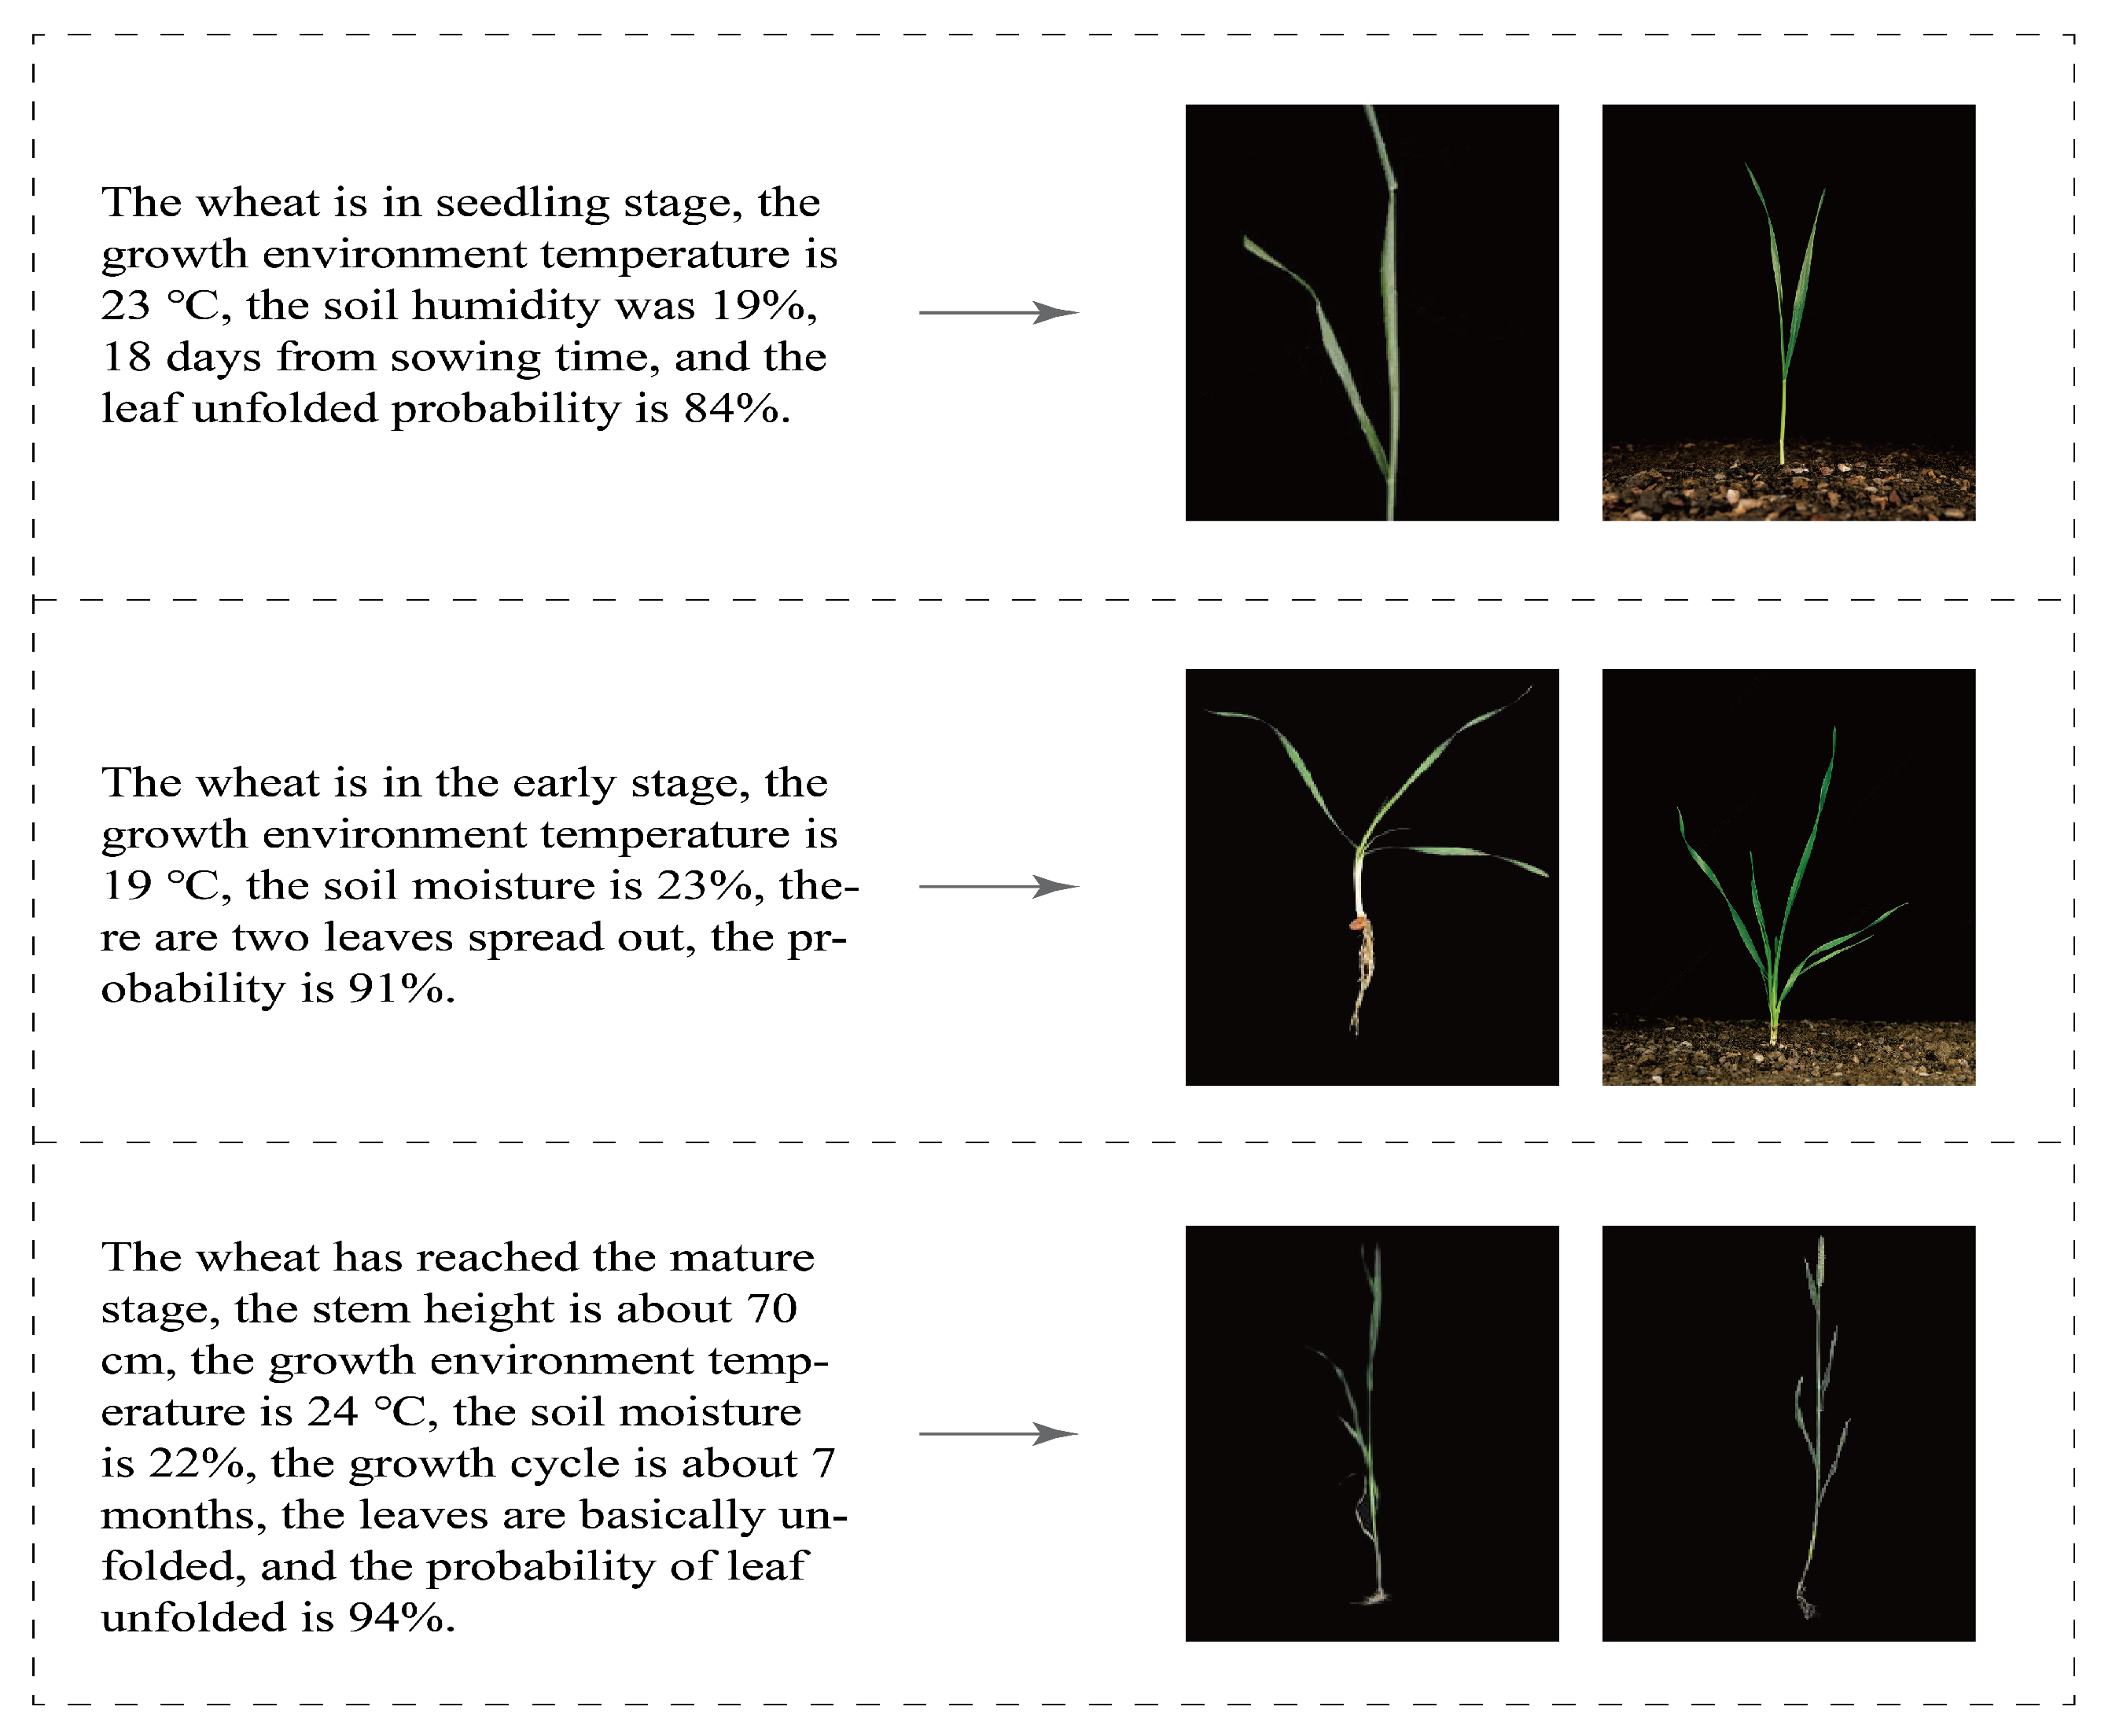
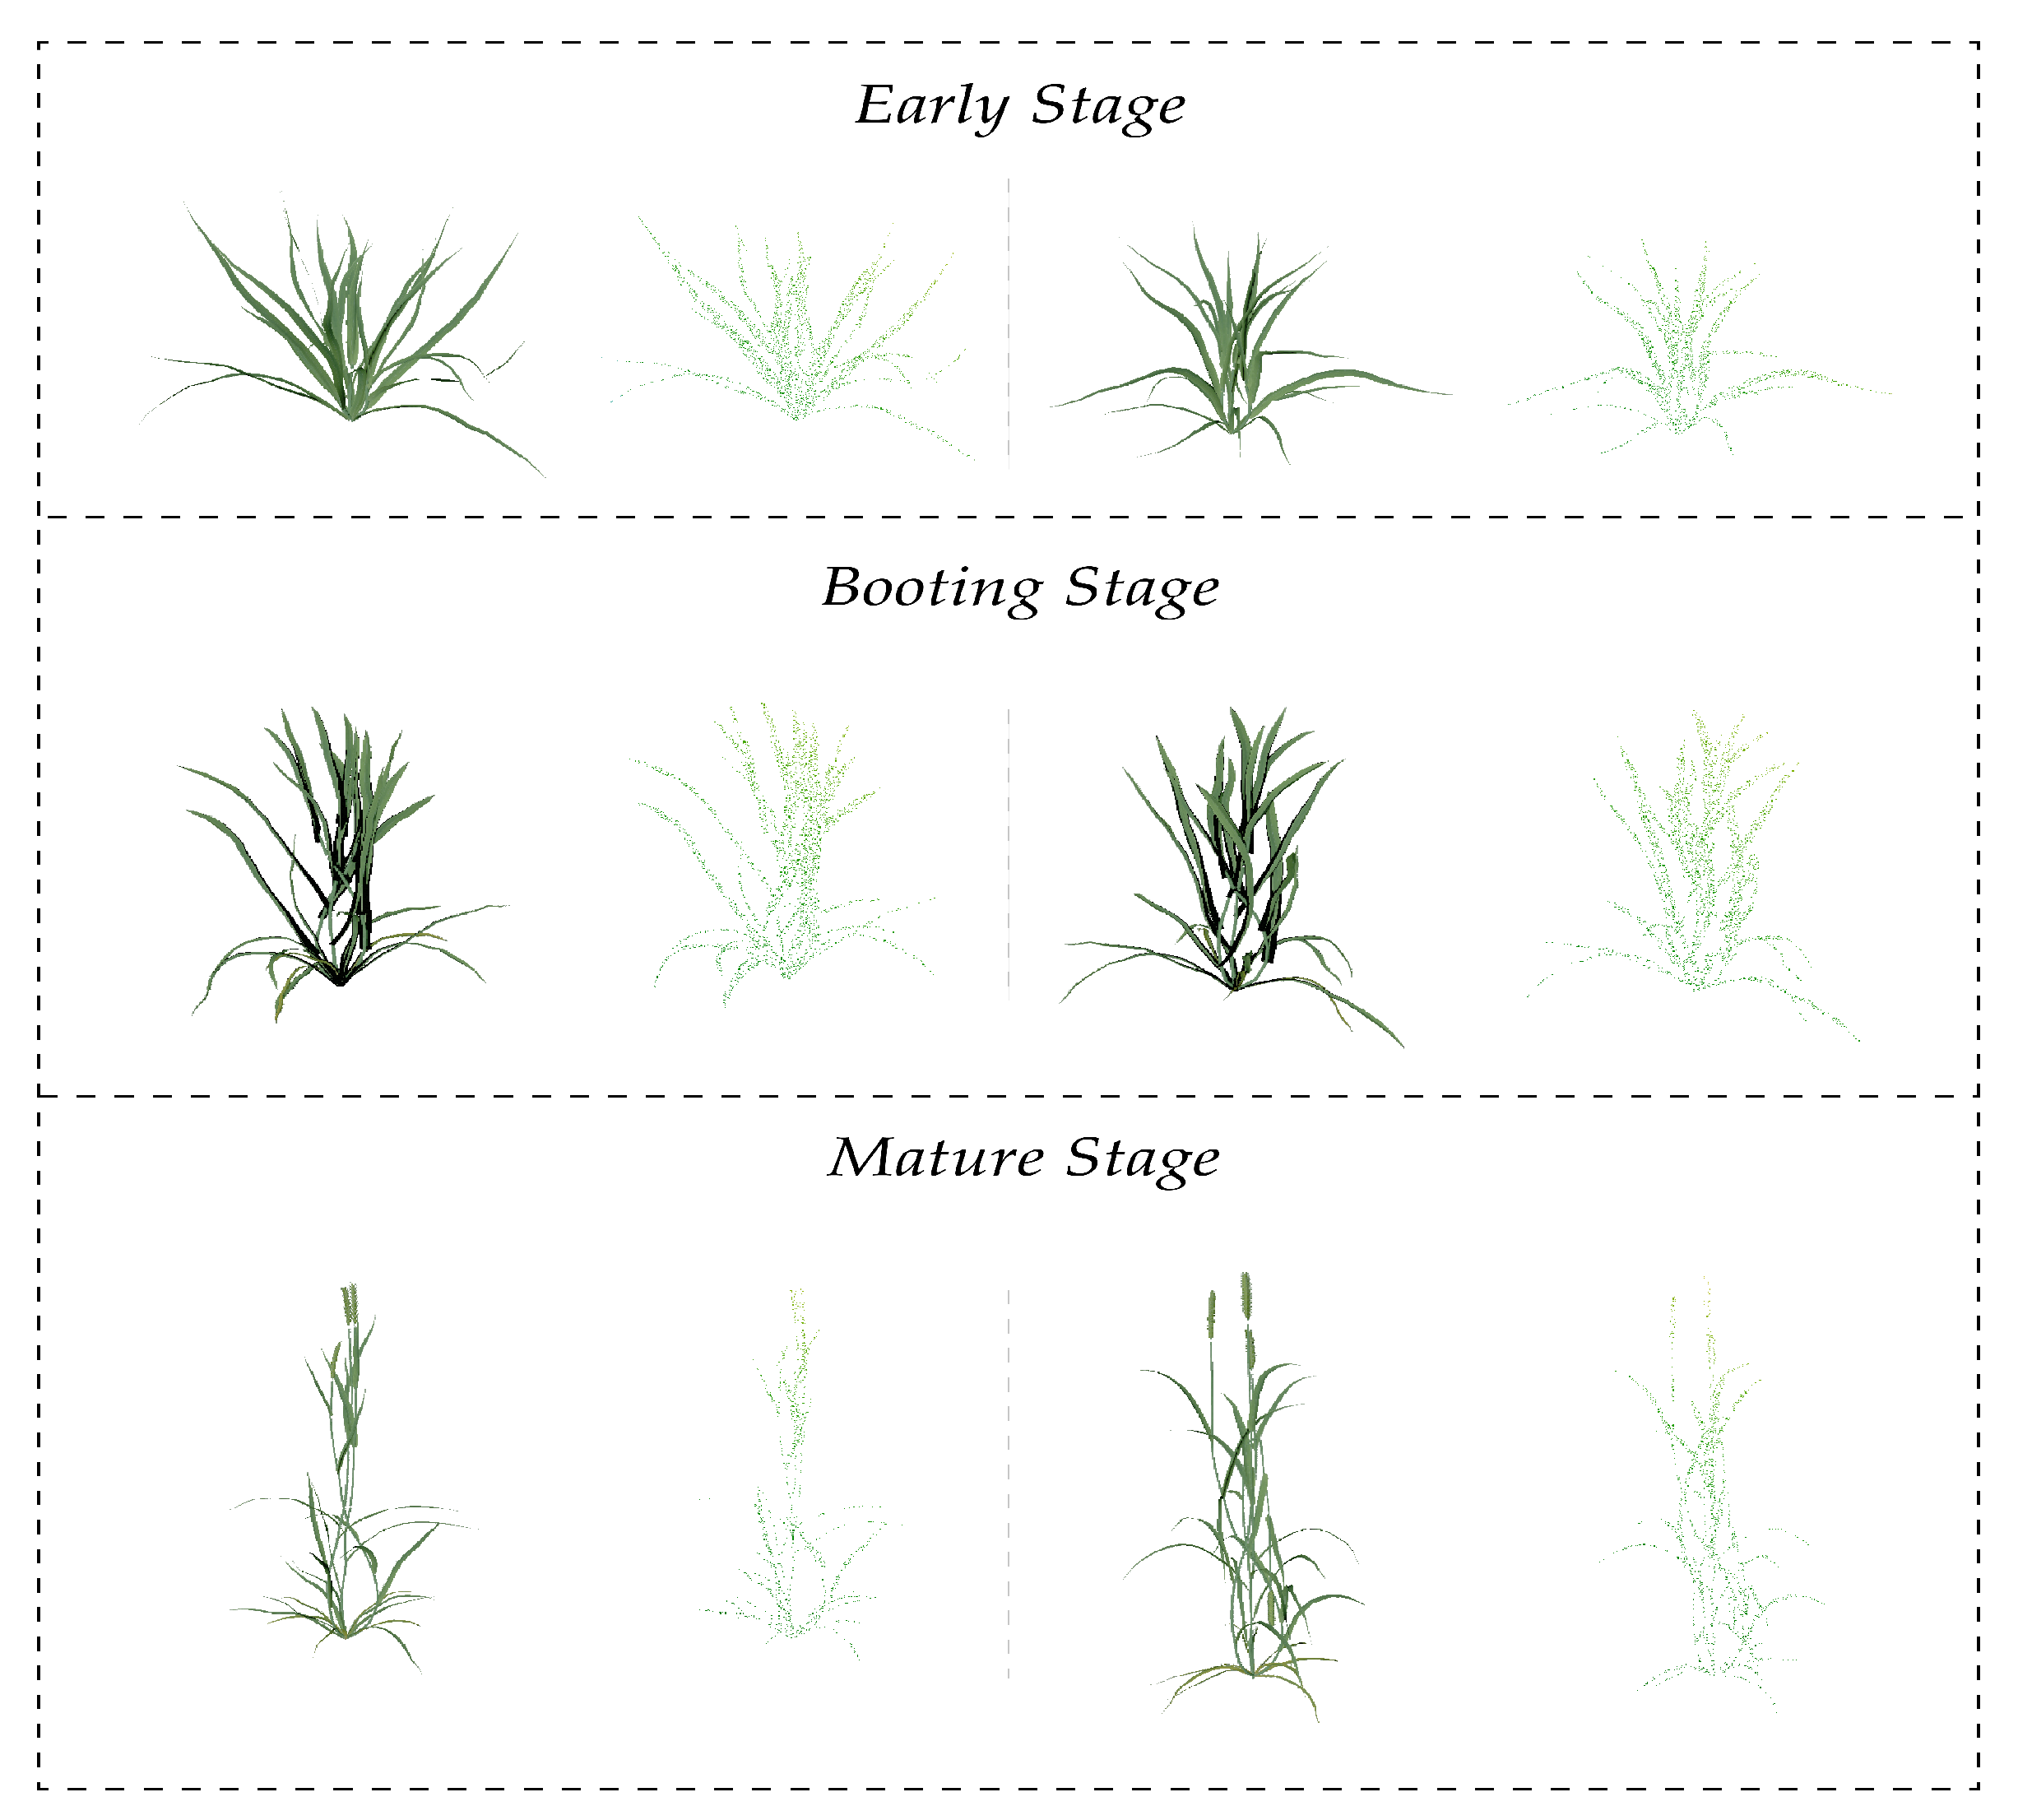
  • We proposed a method to reconstruct a 3D point cloud model of wheat by text description; the method is based on multi-task cooperation.

2. Related Work

Reconstructing 3D point cloud of wheat is not an easy task, it is particularly difficult to implement end-to-end generation. Therefore, it is a better choice to use mult- task cooperation. The final solution is to combine the three algorithms of object detection, text-to-image, and 3D point cloud reconstruction to achieve this purpose.
  • Deep Learning in Wheat Breeding
With increasing population pressure and the subsequent demand for agricultural products, countries in the world will face the problem of insufficient crop production. Plant researchers have been trying to propose strategies for increasing the production of wheat. Nimai Senapati et al. [7] pointed out the importance of drought tolerance during reproductive development to increase wheat yield under climate change. Lin Ma et al. [8] isolated TaGS5 homoeologues in wheat and mapped them on chromosomes 3A, 3B, and 3D, and temporal and spatial expression analysis showed that TaGS5-3A was preferentially expressed in young spikes and developing grains. Muhammad Adeel Hassan et al. [9] evaluated the vegetation indices (Vls) of crops at different growth stages using multi-spectral images of unmanned aerial vehicle (UAV).Some researchers used the analysis of wheat phenotypes to judge the advantages and disadvantages of wheat varieties so as to select good varieties to increase yield. At present, some researchers have used the method of deep learning to assist wheat research. Aleksandra Wolanin et al. [10] estimated the yield of wheat with explainable deep learning. Xu Wang et al. [11] used high-throughput phenotyping with deep learning to understand the genetic structure of flowering time in wheat. Liheng Zhong et al. [12] completed the mapping of winter wheat with the method of deep learning. The above work has made great contribution to wheat breeding, but these methods generally require a large amount of manual operation and measurement of related instruments. In contrast, our work focuses on the automatic reconstruction of the 3D point cloud model of each growth stage of wheat.
  • Object Detection Algorithms
Thus far, object detection is one of the most mature areas of deep learning, and it has been applied in many industries. The growth stage of wheat is usually judged by the unfolding of leaves, and the object detection algorithm can effectively detect whether the leaf is fully unfolded. Recently, object detection algorithms can be divided into two categories: the first is two-stage algorithms, the most representative of which is the Region-Convolutional Neural Networks (R-CNN) series, including fast R-CNN [13], faster R-CNN [14], Region-Fully Convolutional Neural Networks (R-FCN) [15], and Libra R-CNN [16]. These methods rely on CNN to generate Region Proposal and then classify and regress on region proposal. The characteristic of this type of method is that the accuracy is generally higher but the speed is slower than the one-stage method. For one-stage algorithms, the most representative models are You Only Look Once (YOLO) series [17,18,19,20], Single Shot MultiBox Detector (SSD) [21], and RetinaNet [22], which can directly predict the bounding box and class probability from the input image. Due to the need to monitor the growth of wheat in real time, the one-stage method is better. Early YOLO models such as YOLOv1 and YOLOv2 only support the detection task of low-resolution images, and the detection effect for small objects cannot satisfy the actual needs. YOLOv4 has good performance in both detection accuracy and speed, so we chose YOLOv4 as the detection model and CSPDarknet53 [23] as the backbone and used the attention mechanism to improve the performance of the model on our own dataset.
  • Text-to-Image Algorithms
Recently, great progress has been achieved in image generation with the emergence of Generative Adversarial Networks (GANs) [24]. Many fields such as image restoration, style transfer, video generation, music generation, text-to-image, etc. have made many interesting applications with the help of GANs. Because we need to reconstruct 3D point cloud of wheat from 2D images, the algorithm of text-to-image is completely consistent with our application scenario. Compared with traditional generative models, GANs have two major characteristics. (1) GANs do not need to rely on any prior distribution. It only needs to sample from a distribution (usually a Gaussian distribution) for training. (2) The GAN models generate real-like samples in a very simple way; they only need to be forwarded through the generator. Generating high-resolution images from text descriptions is a challenging task. Initially, the models can only translate text to image pixels [25]. Stacked Generative Adversarial Networks (StackGAN) used a two-stage GAN to translate text information into a 256 × 256 real image for the first time [26]. Based on stackGAN, stackGAN-v2 is composed of multiple generators and discriminators and arranged in a tree shape, generating multi-scale images of the same scene from different branches of the tree [27]. AttnGAN allows for attention-driven, multi-stage refinement for fine-grained text-to-image generation. This model pays more attention to the details of related vocabulary in semantic description, and the generated image quality is better, which is why we chose AttnGAN.
  • Reconstruction of Wheat 3D Model
Three-dimensional images are a special form of information expression. Its characteristic is to express the data of three dimensions in the space. Its forms of expression include depth map, geometric model, and point cloud model. Point cloud data are the most common and basic 3D model. Recently, deep learning on point clouds has thrived. Currently, there are many methods based on multiple views, such as Multi-view convolutional neural networks (MVCNN) [28] and Multi-view harmonized bilinear network (MHBN) [29]. Some methods such as DensePoint [30] and ConvPoint [31,32] are based on 3D discrete convolution; these methods define convolutional kernels on regular grids, where the weights for neighboring points are related to offsets with respect to the center point. some researchers have tried to reconstruct the 3D model of wheat. WeiFang et al. [33] proposed high-throughput volumetric reconstruction for a 3D wheat plant architecture. Research centers such as the Donald Danforth Plant Science Center and the Commonwealth Science and Industrial Research Organization (CSIRO) proposed a solution for 3D model reconstruction of plants based on 2D imaging [34]. Michael P. Pound et al. [35] proposed to use single-view images to optimize the model based on image information, curvature constraints, and the position of neighboring surfaces and to reconstruct a three-dimensional model of the plant. All of these works have achieved good results. However, the above works require the use of high-precision instruments or manual measurement of certain plant parameters to better reconstruct the three-dimensional model of the plant. Workload and cost are relatively high. In this paper, we use [36] to build the wheat 3D structure points. Specifically, this method takes a 3D point cloud as input and encodes it as a set of local features. The local features are then passed through a novel point integration module to produce a set of 3D structure points.

3. Materials and Methods

This section is divided into two parts. The first part mainly introduces data acquisition and preprocessing. The second part introduces the details of the algorithm we used.

3.1. Materials

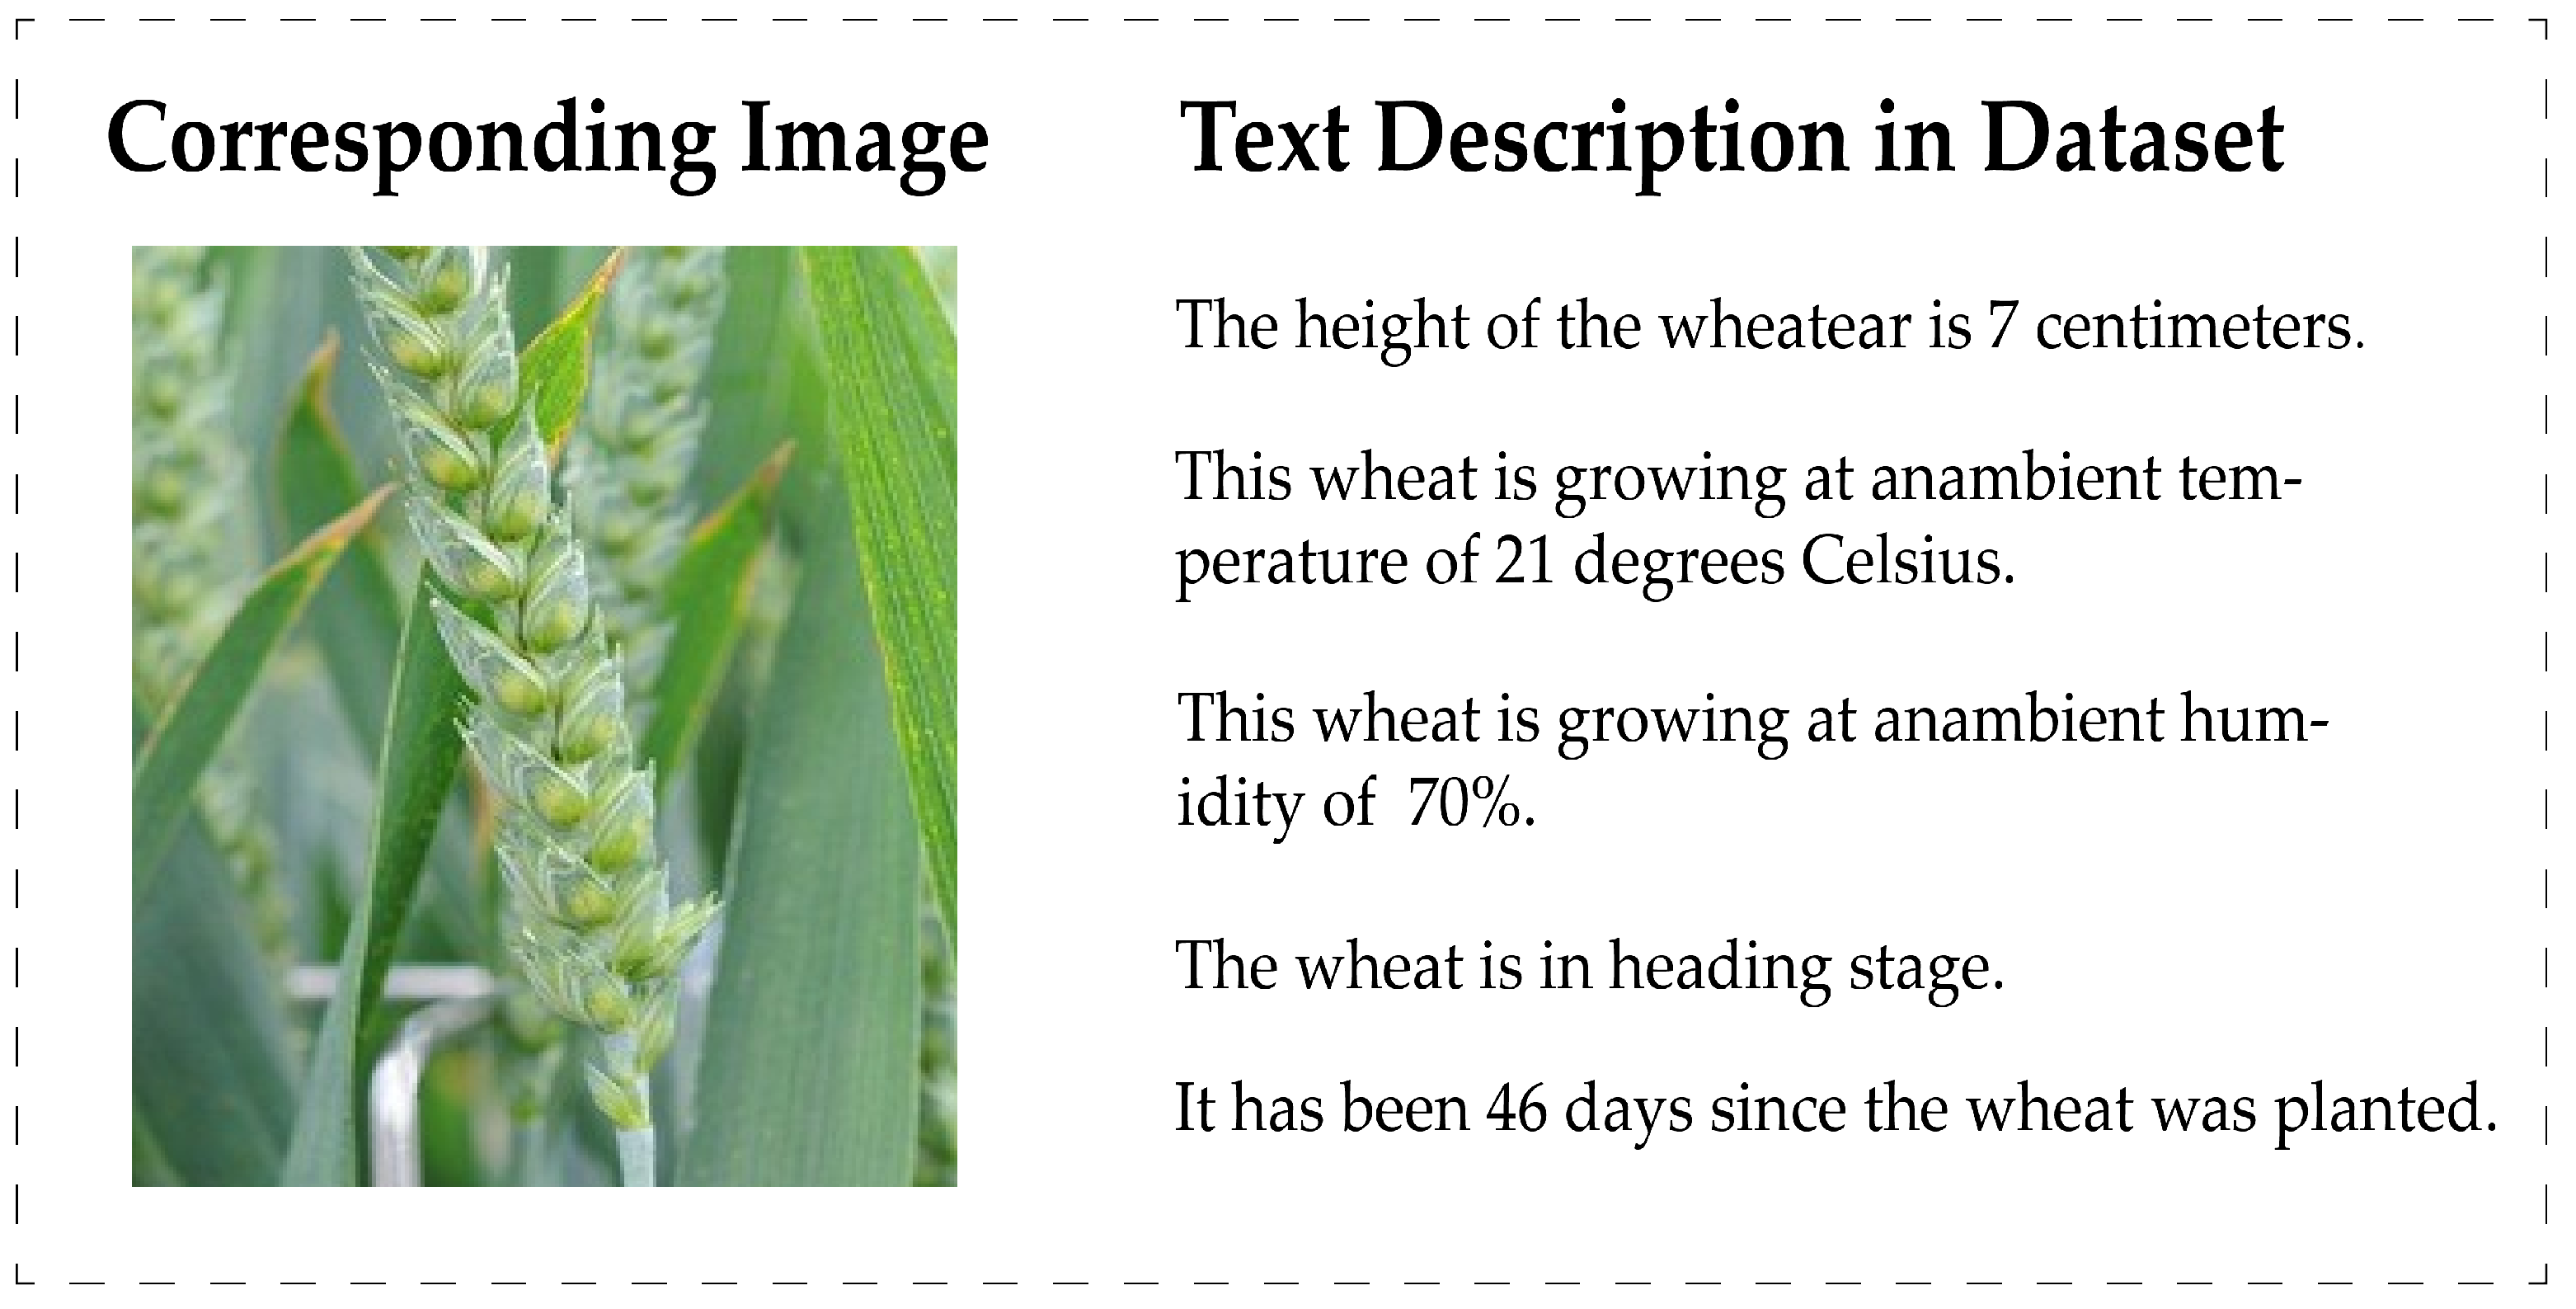
3.1.1. RGB Image and Semantic Information

In order to collect the data continuously, we developed a set of equipment with a Raspberry Pi. The device is equipped with a camera (Premier Farnell., London, UK), which has a prime lens and the image pixels up to 3280 × 2464. In the process of wheat growth, the phenomenon of occlusion between leaves is common. Therefore, only collecting a single-view image cannot meet the data requirement of the detection task. In fact, a rotatable turntable can solve this problem well; we simply put the wheat culture dish on it and let the turntable rotate slowly. It is easy to collect multi-view images in this way. The whole collecting process was completed in the breeding laboratory, and the advantage is that the whole process was not affected by environmental factors. Finally, we collected 2000 images of the wheat growing process. The dataset contains images of the growing process of 50 wheat plants, and at least 30 images were collected for each wheat plant. These images were used for the training of the object-detection task and text-to-image task, respectively.
DHT11 [37] is a temperature and humidity sensor with calibrated digital signal output. We used it to collect the temperature and soil humidity of the wheat-growing environment. Then, all information such as temperature, soil humidity, wheat plant height, and leaf unfolded probability were combined into semantic information, which was used for training of the text-to-image task. Finally, we made 2000 textual annotations. The semantic information and the corresponding image example are shown in Figure 2.

3.1.2. Data Preprocessing

Since the input nodes of the deep learning network are fixed but the pixel size of the collected images is different, the images need to be resized first. We resized the original image to 1024 × 1024 pixels and then entered it into YOLOv4 for training. The growth environment of wheat is changeable: different weather conditions will lead to different light intensities, and different wind speeds will change the posture of wheat. Therefore, in order to improve the robustness of the model, we flipped the original image a few angles and gamma transformed the image. In addition, considering the hardware noise of the imaging sensor, such as the electronic circuit noise caused by low illumination or high temperature in the camera sensor, it is necessary to add gaussian noise and salt and pepper noise to make the model obtain a better fitting effect in an uncertain environment. After data augmentation, our dataset was expanded to 5000 images. In addition, the dataset also contains labels for object detection training, point cloud markers of wheat model, and text description of the image.

3.2. Methods

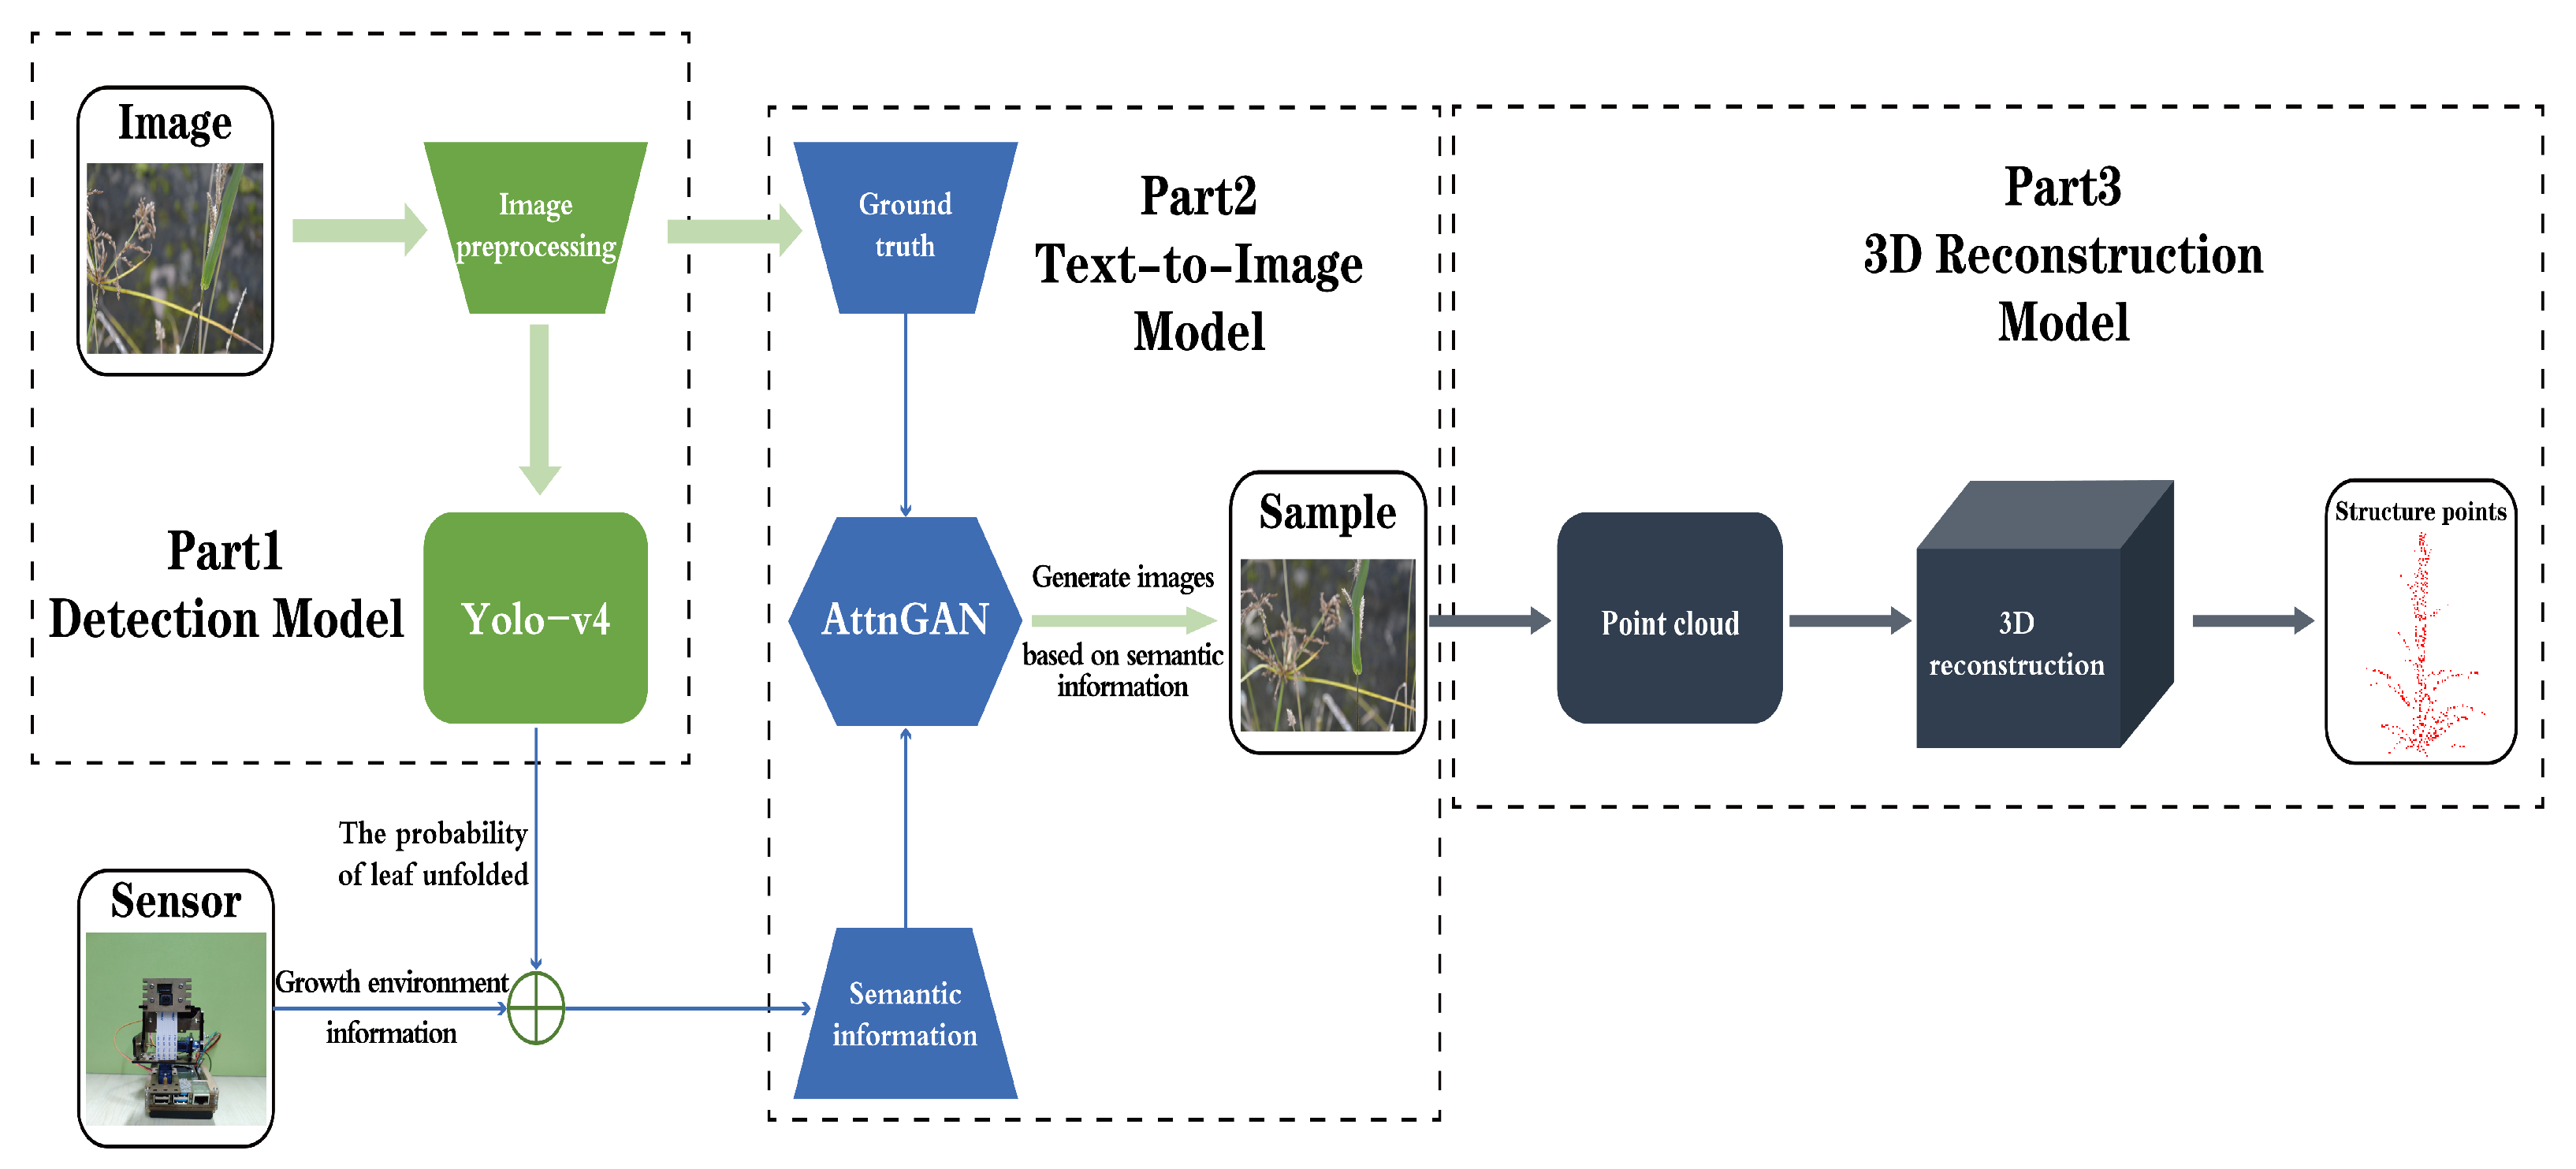
3.2.1. Detection Model

Object detection is the first part of the whole work, which is mainly used to detect whether the blade is unfolded. The structure of YOLOv4 [20] can be divided into three parts: backbone feature extraction network, enhanced feature extraction network, and Yolo-Head. Moreover, the anchor used in YOLOv4 is the same as YOLOv3. In the backbone network, YOLOv4 adopts Cross Stage Partial Network (CSPDarknet53). The main idea is multiple stacking of residual networks, which uses a large residual edge span connection structure to extract edge information better. It is worth noting that the last three effective layers obtained by CSPDarknet53 are all used as input for feature fusion to improve the network performance. YOLOv4’s neck is divided into Spatial Pyramid Pooling (SPP) [38] and Feature Pyramid Networks (FPN) [39]. The most prominent feature of SPP is that it can easily achieve multi-scale training. SPP can extract features from images of different sizes; it can also output features of any size by adjusting the size and stride of the kernel. FPN adopts a jump connection structure, and a multi-dimensional fusion feature layer is finally obtained by convolution, sampling, and splicing. It combines multiple effective feature layers through continuous convolution and sampling. The bottom-up and top-down network designs enable fine-grained feature information to be directly integrated with the final feature layer. This short-circuit concept makes fine-grained localized information available on the top floor.
In the priors-anchor part, YOLOv4 does not directly predict the width, height, and center point coordinates of the bounding box; it predicts the offset. Compared with direct location prediction, it is easier to predict the offset and to avoid the problem that the bounding box may appear at any position of the image. The offset formula is defined as follows:
b x = σ t x + C x b y = σ t y + C y b w = p w e t w , b h = p h e t h σ t 0 = Pr ( object ) × IOU ( b , object ) ,
where b x , b y is the center coordinates of the prediction box. b w , b y represent the length and width of the prediction box. t 0 is the confidence score. C x , C y is the upper-left coordinates of the grid cell in the feature map, and p w and p h are the width and height of the default bounding box mapped to the feature map. In the process of training, the correct bounding box is obtained by fitting four parameters t x , t y , t w , and t h . The loss function of YOLOv4 is divided into three parts: confidence loss, classification loss, and bounding box regression loss. Compared with YOLOv3, YOLOv4 changes only in bounding box regression loss, YOLOv3 uses Mean Squared Error (MSE) loss in bounding box regression, while YOLOv4 uses Complete-Intersection over Union (CIoU) [40] loss. CIoU is defined as follows:
ξ CloU = 1 I o U + ρ 2 b , b g t c 2 + α v , where a = v ( 1 I O U ) + v , v = 4 π 2 arctan w g t h g t arctan w h 2 ,
where α is the weight factor and measures the similarity of the aspect ratio and ρ 2 b , b g t c 2 is the Distance-Intersection over Union (DIoU) [40]. CIoU combines the advantages of various loss functions well and fully considers the relationship of various prediction indicators. IoU is used to express the co-selection rate between the bounding box and ground truth. DIoU is used to make the bounding box regress better. α is used to measure the aspect ratio of the bounding box, which reflects the offset between the bounding and ground truth. The information detected by the model is used to train Attentional Generative Adversarial Networks (AttnGAN) [5].

3.2.2. Text-to-Image Model

Compared with other GAN models, AttnGAN has two special characteristics: (1) an attentional generative network; (2) Deep attentional multimodal similarity model (DAMSM) [5]. Most recently proposed text-to-image synthesis methods are based on GANs. These methods usually encode the whole text description into a global sentence vector as the condition for GAN-based image generation [41]. It leads to a lack of important fine-grained information at the word level and prevents the generation of high-quality images. AttnGAN not only encodes the natural language description into a global sentence vector but also encodes each word in the sentence into a word vector. In the first stage, the network utilizes the global sentence vector to generate a low-resolution image. In the next stage, it uses the image vector in each subregion to query word vectors by using an attention layer to form a word-context vector. The final objective function of the AttnGAN is defined as follows:
ξ = ξ G + λ ξ D A M S M , where ξ G = i = 0 m 1 ξ G i ,
where ξ G is the GAN loss that jointly approximates conditional and unconditional distributions and λ is a hyperparameter to balance the two terms. ξ D A M S M is a word-level fine-grained image-text matching loss computed by the DAMSM. Additionally, the loss for G i is defined as follows:
ξ G i = 1 2 E x ^ i P G i log D i x ^ i uncondtional - loss 1 2 E x ^ i P G i log D i x ^ i , e ¯ condtional - loss ,
where x ^ i is from the model distribution P G i . The function is divided into two parts: the unconditional-loss determines whether the image is fake or real, and the conditional-loss determines whether the image and the semantic information match. At each stage of the AttnGAN, the generator G i has a corresponding discriminator D i , each discriminator D i is trained to classify the input into the class of real or fake, and the loss for D i is defined as follows:
ξ D i = 1 2 E x i Pdata i log D i x i 1 2 E x ^ i P G i log 1 D i x ^ i unconditional - loss + 1 2 E x i Pdata i log D i x i , e ¯ 1 2 E x ^ i P G i log 1 D i x ^ i , e ¯ condtional loss ,
where x i is from the true image distribution p d a t a , x ^ i is from the model distribution P G i , both of them are at the ith scale, and e ¯ is a global sentence vector.
The second part of the objective function is the loss function of the Deep attentional multimodal similarity model (DAMSM) [5] model. DAMSM learns two neural networks, which map words of the sentence and subregions of the image to a common semantic space and calculate the fine-grained loss of image generation. The neural networks learned by DAMSM are Long Short-Term Memory (LSTM) [42] and Convolutional Neural Network (CNN); the specific structure of these two networks will not be introduced in this paper. The LSTM network is used to extract semantic vectors from text descriptions; the CNN network is built upon the Inception-v3 [43] model pretrained on ImageNet [44]. We extracted global features from the last average pool layer of Inception-v3 and added a perceptron layer to convert image features into a common semantic space for text features. DAMSM uses image-text matching score to evaluate the result. The 2D image generated by the model is an important medium for reconstructing 3D point cloud.

3.2.3. Three-Dimensional Point Cloud Model

Our ultimate goal is to reconstruct the 3D point cloud model of wheat using text description, the generated 2D image is only a medium in the middle. In this stage, 3D point clouds need to be reconstructed from a single 2D image. Because 2D images are generated from models, it is impossible to use a depth camera and other devices to collect point cloud data, so we reconstructed the point cloud in two stages. In the first stage, we used a model that can generate point cloud from a single image [45]. Due to the lack of depth information, the shape of the point cloud reconstructed in the first stage is a little ambiguous. In the second stage, the method we used is an end-to-end framework [36], which can learn intrinsic structure points from point clouds. The framework consists of two parts: PointNet++ and Point integration model. The whole structure is shown in Figure 3.
The input to PointNet++ is a point cloud, and the point cloud first enters an encoder. The encoder extract sample points Q = q 1 , q 2 , , q l q i R 3 with the features F = f 1 , f 2 , , f l f i R 3 ; l is the number of sample points; and c indicates the dimension of the feature representation. Additionally, the input to the point integration model is the points Q with the local contextual features F, which were obtained by the PointNet++ [46]. Shared Multi-Layer Perceptron (MLP) is a shared multi-layer perceptron block followed by softmax. It is used as an activation function to generate the probability maps P = p 1 , p 2 , , p m . The p j i in the probability map p i indicates the probability of the point q i being the structure point S i . Therefore, the output points S can be defined as follows:
S i = j = 1 l q j p j i , where j = 1 l p i j = 1 .
For unsupervised training of the network, the reconstruction loss is defined based on the Chamfer distance (CD) [45]. In fact, the loss is the CD between the structure S and the input points X, the loss is computed as follows:
L r e c ( S , X ) = s i S min x j X s i x j 2 2 + x j X min s i S s i x j 2 2 .

4. Experiments

4.1. Experimental Results

The operating system of the experiment is Ubuntu16.04, the deep learning framework used in all experiments is PyTorch1.2, and all experimental results are obtained on NVIDIA GeForce RTX 2080 super GPU with a video memory of 8 GB. In this section, we use four subsections to show the experimental effects of the three models and discuss the experimental results in detail.
Training a good detector is the basis of our work. In our own dataset, the highest mean Average Precision (mAP) [47] of YOLOv4 is 0.917. After many experiments, we found that some tricks can improve the accuracy of the model on our own dataset. Finally, we set the image size to 512 and epoch = 200 and used mutli-scale training. In this case, we trained the model with the highest mAP value. The experimental results showed that the attention mechanism such as Convolutional Block Attention Module (CBAM) [48], Squeeze-and-Excitation Networks (SENet) [49], and multi-scale training have a great influence on the experimental results. We also used other tricks to assist in training the model. Figure 4 shows the training details of the comparative experiments, and Table 1 shows all of the results of the comparative experiments.
According to the above experimental results, we can draw the following conclusions:
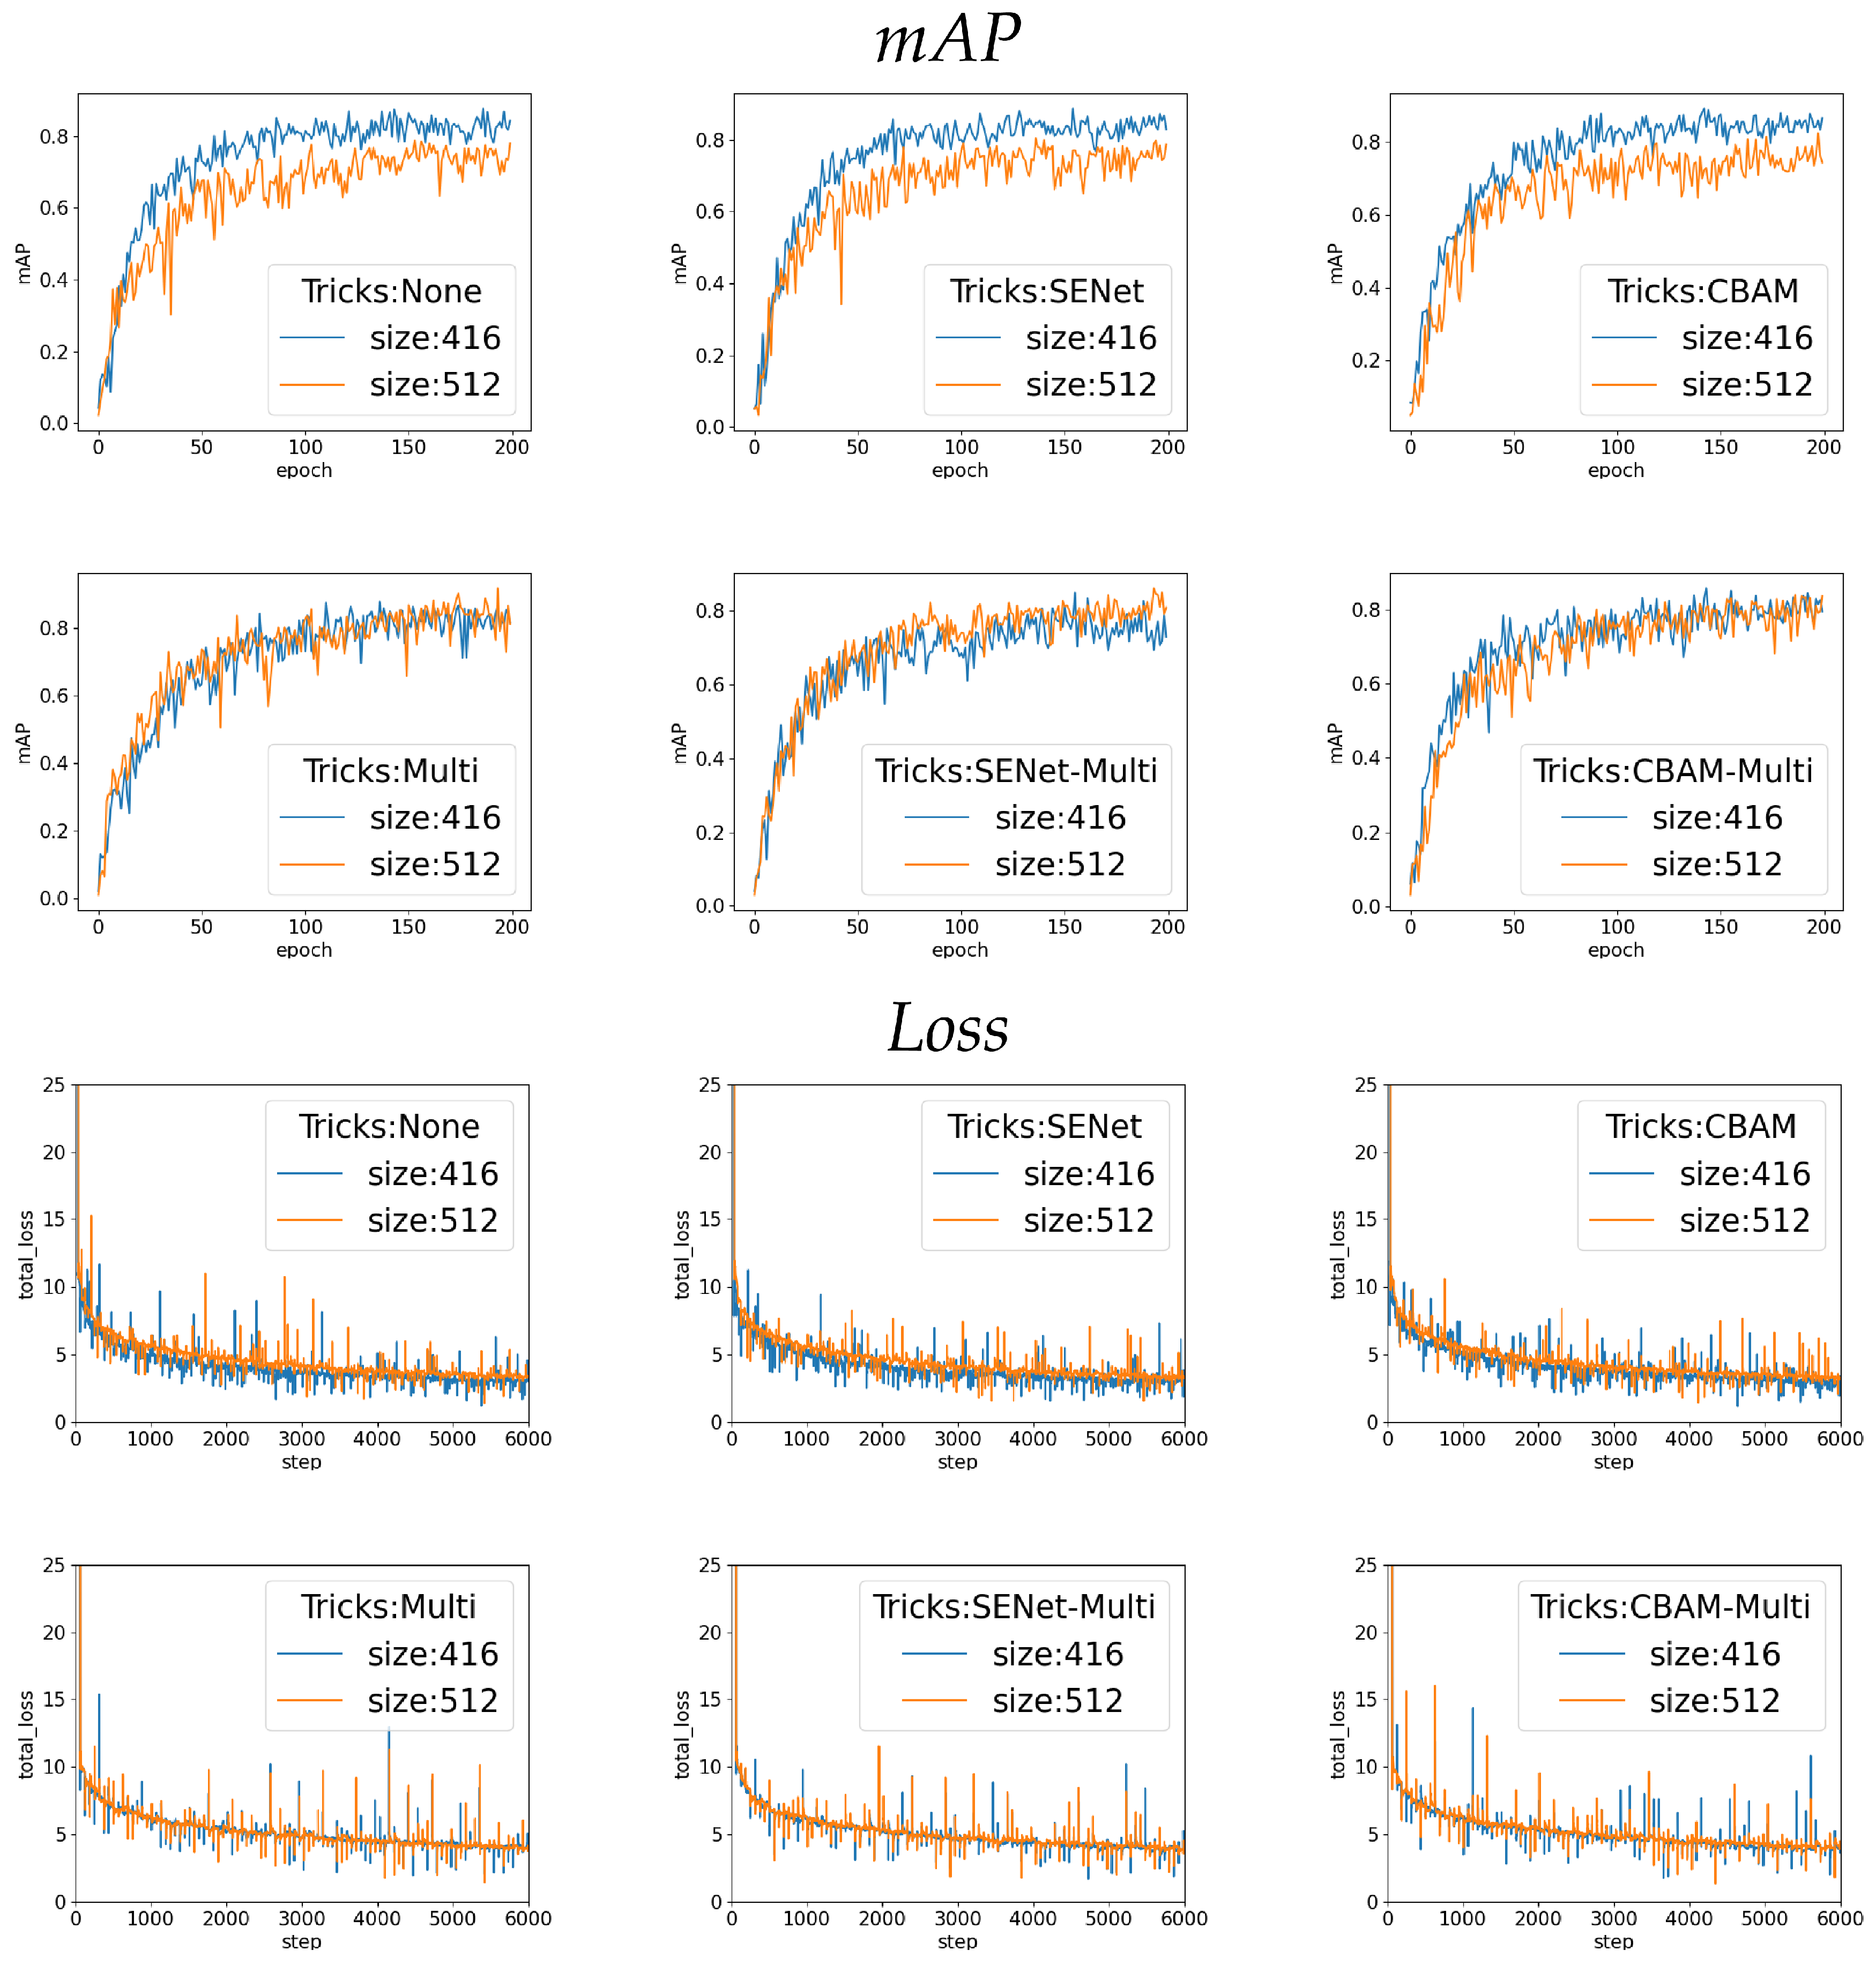
  • The attention mechanism and multi-scale training are helpful to improve mAP value; when the image size is 416, the mAP value using SENet or CBAM is 0.015 higher than using multi-scale training. However, when the image size is 512, the mAP value using multi-scale training is 0.1 higher than using SENet or CBAM.
  • When the attention mechanism is used together with multi-scale training, the improvement in experimental results is not obvious; especially when the image size is 416, the map value was even reduced. This shows that the combination of multi-scale training and an attention mechanism requires a larger image size to provide more information.
  • When using CBAM, the mAP value is 0.01 higher than using SENet in all experiments. Additionally, it can be seen from the training process that the loss decreases more smoothly when using CBAM. The reason is that CBAM has one more spatial attention than SENet.
To verify the robustness of our model, we collected some wheat images from the field and tested them with our models. The results are shown in Figure 5 and show that our model can detect whether wheat leaves are unfolded in different environments.
After the phenotypic information of wheat is detected, the semantic information is used to generate the corresponding 2D image. The quality of the 2D image directly determines the quality of the final 3D point cloud. The evaluation index of GAN models is usually inception score, which gives the score from the two aspects of image clarity and diversity. The higher the value is, the better the training model is. However, the disadvantage is that it cannot reflect whether the image is well conditioned on the given text description, so we added another evaluation index R-precision, which is a complementary evaluation metric for the text-to-image synthesis task. More details about R-precision are presented in [5]. In the training stage, we first used the pretrained DAMSM to train the image and test encoders. Then, the text vector, which is made by a text encoder, and the vector sampled from gaussian distribution were used to train the generator. The parameter λ in Equation (3) and DAMSM have great influences on the experimental results. Table 2 shows the experimental results of different λ values and whether DAMSM is used.
When λ = 5 and using DAMSM, we obtained the best model. We also tested our model by using a series of text descriptions. Figure 6 shows the results.
Comparing the generated images with the real images, we find that the images generated by our model pay attention to the details of semantic information, and the generated image basically conforms to the text description. The quality of the generated image can fully meet the requirements of the next stage of 3D reconstruction.
The last part of the work is to reconstruct the 3D point cloud of wheat from the generated image. The task is so difficult that it needs two stages to complete. Although the point cloud obtained at the first stage has the shape of the real object, it is still quite different from the real object. Therefore, the point cloud is used as input to the model was introduced in Section 3.2.3. To generate point cloud models with more details, we set the number of structure points to 1024. To evaluate the robustness of the model to input point clouds with different densities, we used the point-wise average Eucliden distance to measure the stability of the structure points. Table 3 shows the results of the experiment.
The growth stage of wheat can be divided into 11 stages, such as germination, emergence, tillering, etc. The morphological and physiological characteristics of each stage are different. Here, we can roughly divide them into three growth stages: early growth stage, middle booting stage, and mature stage. Figure 7 shows the structure points of each stage.
As can be seen from Figure 7, the morphology of wheat has different characteristics at different growth stages. The generated point cloud model is very similar to the shape of real wheat, and the key features also conform to the text description. This is because the reconstructing is completed in two stages, and the feature information of the previous stage is retained. The results also show that it is feasible to divide the task into two stages. The 3D point cloud model can calculate the phenotypic parameters of wheat leaves through the coordinates of the points and can construct realistic a virtual model of leaf surfaces. The realistic virtual model is important for several applications in plant sciences, such as modelling agrichemical spray droplet movement and spreading on the surface.

4.2. Discussion

From the above experimental results, we can see that our method is feasible and effective. The quality of the generated image is largely determined by the text description, so the detailed and accurate text description is particularly important. Using an object detection algorithm to detect the unfolded probability of wheat leaves, we can judge the growth stages of wheat. From the text-to-image experiment, it is obvious that the detection results play an important role in image generation. The image of the training object detection model is continuously collected in the process of wheat growth, including the images of each growth stage of wheat. According to the experimental results, YOLOv4 can detect the unfolded probability of wheat leaves and then the growth stage of wheat can be judged correctly. In the actual research process, this method was able to replace part of the manual work. In the process of wheat growth, environmental factors and the transition of growth stages are very subtle changes. After using DAMSM, the generated image depends more on the description of each word. It is more conducive to generate images with different details. The values of inception score and R-precision in Table 2 can reflect that the model we used can generate high-quality images and that the matching degree between images and text descriptions is high, which makes 3D reconstruction using semantic information feasible. We used a single image to generate the final point cloud model in two stages, and the training process is unsupervised. It can be seen from the generated point cloud and various evaluation indexes that our model can reconstruct a reliable wheat 3D point cloud model. DM Kempthorne et al. [50] used the 3D scan data to reconstruct the 3D model of the wheat leaf. Compared with their method, our method does not need to use an expensive instrument such as the 3D scanner and our method greatly reduces the calculation time. Jonathon A. Gibbs et al. [51] conducted research on using voxels to build three-dimensional models of plants, and the 3D model reconstructed by this method was composed of many small cubes. The shape of wheat is usually not a regular geometry. Compared to using point cloud to reconstruct 3D structure, the models built by voxels have lower accuracy and the calculation of phenotypic parameters is also affected. Taking these factors into consideration, our method has better performance in practicability and accuracy. It is more suitable for daily breeding research.

5. Conclusions

In this paper, we propose a method to reconstruct wheat 3D point cloud model using semantic information and verify the feasibility of this method through experiments. A dataset that contains images of wheat, the text description matching the image, and point cloud data corresponding to the image is proposed. It is helpful to other researchers. Currently, we achieved the effect of generating 3D point cloud based on semantic information. Each point of the 3D point cloud model has a certain coordinate, and the coordinates of the point can be used to estimate leaf area, to calculate plant height, and to measure leaf thickness and other phenotypic data. In addition, the point cloud model can be used for classification and segmentation tasks. It is easy to distinguish which growth stage the wheat is in by using the point cloud model. If a point cloud model is used for segmentation task, the points of different colors in the entire 3D point cloud model represent different parts of the wheat and various phenotypic data of different parts can be calculated separately. In actual application, only a data acquisition device and a computer with well-deployed algorithms are required. All calculation processes are completed automatically. Breeding researchers only need to perform some simple auxiliary work and to use the data for further ecophysiological research. Gramineae plants have a host of similar characteristics, and our method may be used as a heuristic algorithm for other Gramineae plants. We currently still use the multi-task method to reconstruct the point cloud, and end-to-end training has not yet been implemented. In the future, we will continue to explore effective methods to achieve end-to-end training of the whole structure.

Author Contributions

Conceptualization, Y.Y. and J.Z.; methodology, Y.Y.; software, K.W.; validation, Y.Y., X.Z. and K.W.; formal analysis, J.L.; investigation, M.W.; resources, M.W.; data curation, J.L.; writing—original draft preparation, Y.Y.; writing—review and editing, Y.Y. and J.S.; visualization, K.W. and S.P.; supervision, M.W.; project administration, Y.Y.; funding acquisition, M.W. All authors have read and agreed to the published version of the manuscript.

Funding

This research was supported by the Sichuan Agricultural University (Grant No. X2017036). and China National Innovation Training Program (Grant No. 202010626008).

Data Availability Statement

The data are available online at https://drive.google.com/drive/folders/1ko6rlE1LThkNG_fcm5C12LcBaUWwdsPc?usp=sharing (accessed on 25 April 2021). As we are still conducting more research on the dataset, we will upload our dataset to the same link later.

Acknowledgments

Thanks to Liang Zhang for his theoretical support in wheat breeding and to Yongliang Ding for drawing the chart. Thanks to Chali Xie for providing the hardware to collect the data.

Conflicts of Interest

The authors declare no conflict of interest.

References

  1. Shiferaw, B.; Prasanna, B.M.; Hellin, J.; Bänziger, M. Crops that feed the world 6. Past successes and future challenges to the role played by maize in global food security. Food Secur. 2011, 3, 307. [Google Scholar] [CrossRef] [Green Version]
  2. Tilman, D.; Balzer, C.; Hill, J.; Befort, B.L. Global food demand and the sustainable intensification of agriculture. Proc. Natl. Acad. Sci. USA 2011, 108, 20260–20264. [Google Scholar] [CrossRef] [PubMed] [Green Version]
  3. Zadoks, J.C.; Chang, T.T.; Konzak, C.F. A decimal code for the growth stages of cereals. Weed Res. 1974, 14, 415–421. [Google Scholar] [CrossRef]
  4. Sadeghi-Tehran, P.; Sabermanesh, K.; Virlet, N.; Hawkesford, M.J. Automated method to determine two critical growth stages of wheat: Heading and flowering. Front. Plant Sci. 2017, 8, 252. [Google Scholar] [CrossRef] [PubMed] [Green Version]
  5. Xu, T.; Zhang, P.; Huang, Q.; Zhang, H.; Gan, Z.; Huang, X.; He, X. Attngan: Fine-grained text to image generation with attentional generative adversarial networks. In Proceedings of the IEEE Conference on Computer Vision and Pattern Recognition, Salt Lake City, UT, USA, 18–23 June 2018; pp. 1316–1324. [Google Scholar]
  6. Barratt, S.; Sharma, R. A note on the inception score. arXiv 2018, arXiv:1801.01973. [Google Scholar]
  7. Senapati, N.; Stratonovitch, P.; Paul, M.J.; Semenov, M.A. Drought tolerance during reproductive development is important for increasing wheat yield potential under climate change in Europe. J. Exp. Bot. 2019, 70, 2549–2560. [Google Scholar] [CrossRef] [Green Version]
  8. Ma, L.; Li, T.; Hao, C.; Wang, Y.; Chen, X.; Zhang, X. Ta GS 5-3A, a grain size gene selected during wheat improvement for larger kernel and yield. Plant Biotechnol. J. 2016, 14, 1269–1280. [Google Scholar] [CrossRef]
  9. Hassan, M.A.; Yang, M.; Rasheed, A.; Yang, G.; Reynolds, M.; Xia, X.; Xiao, Y.; He, Z. A rapid monitoring of NDVI across the wheat growth cycle for grain yield prediction using a multi-spectral UAV platform. Plant Sci. 2019, 282, 95–103. [Google Scholar] [CrossRef]
  10. Wolanin, A.; Mateo-García, G.; Camps-Valls, G.; Gómez-Chova, L.; Meroni, M.; Duveiller, G.; Liangzhi, Y.; Guanter, L. Estimating and understanding crop yields with explainable deep learning in the Indian Wheat Belt. Environ. Res. Lett. 2020, 15, 024019. [Google Scholar] [CrossRef]
  11. Wang, X.; Xuan, H.; Evers, B.; Shrestha, S.; Pless, R.; Poland, J. High-throughput phenotyping with deep learning gives insight into the genetic architecture of flowering time in wheat. GigaScience 2019, 8, giz120. [Google Scholar]
  12. Zhong, L.; Hu, L.; Zhou, H.; Tao, X. Deep learning based winter wheat mapping using statistical data as ground references in Kansas and northern Texas, US. Remote Sens. Environ. 2019, 233, 111411. [Google Scholar] [CrossRef]
  13. Girshick, R. Fast r-cnn. In Proceedings of the IEEE International Conference on Computer Vision, Santiago, Chile, 7–13 December 2015; pp. 1440–1448. [Google Scholar]
  14. Ren, S.; He, K.; Girshick, R.; Sun, J. Faster r-cnn: Towards real-time object detection with region proposal networks. Adv. Neural Inf. Process. Syst. 2015, 2015, 91–99. [Google Scholar] [CrossRef] [PubMed] [Green Version]
  15. Dai, J.; Li, Y.; He, K.; Sun, J. R-fcn: Object detection via region-based fully convolutional networks. Adv. Neural Inf. Process. Syst. 2016, 2016, 379–387. [Google Scholar]
  16. Pang, J.; Chen, K.; Shi, J.; Feng, H.; Ouyang, W.; Lin, D. Libra r-cnn: Towards balanced learning for object detection. In Proceedings of the IEEE Conference on Computer Vision and Pattern Recognition, Long Beach, CA, USA, 15–20 June 2019; pp. 821–830. [Google Scholar]
  17. Redmon, J.; Divvala, S.; Girshick, R.; Farhadi, A. You only look once: Unified, real-time object detection. In Proceedings of the IEEE Conference On Computer Vision and Pattern Recognition, Las Vegas, NV, USA, 27–30 June 2016; pp. 779–788. [Google Scholar]
  18. Redmon, J.; Farhadi, A. YOLO9000: Better, faster, stronger. In Proceedings of the IEEE Conference on Computer Vision and Pattern Recognition, Honolulu, HI, USA, 21–26 July 2017; pp. 7263–7271. [Google Scholar]
  19. Redmon, J.; Farhadi, A. Yolov3: An incremental improvement. arXiv 2018, arXiv:1804.02767. [Google Scholar]
  20. Bochkovskiy, A.; Wang, C.Y.; Liao, H.Y.M. YOLOv4: Optimal Speed and Accuracy of Object Detection. arXiv 2020, arXiv:2004.10934. [Google Scholar]
  21. Liu, W.; Anguelov, D.; Erhan, D.; Szegedy, C.; Reed, S.; Fu, C.Y.; Berg, A.C. Ssd: Single shot multibox detector. In Proceedings of the European Conference on Computer Vision, Amsterdam, The Netherlands, 8–16 October 2016; pp. 21–37. [Google Scholar]
  22. Lin, T.Y.; Goyal, P.; Girshick, R.; He, K.; Dollár, P. Focal loss for dense object detection. In Proceedings of the IEEE International Conference on Computer Vision, Venice, Italy, 22–29 October 2017; pp. 2980–2988. [Google Scholar]
  23. Wang, C.Y.; Mark Liao, H.Y.; Wu, Y.H.; Chen, P.Y.; Hsieh, J.W.; Yeh, I.H. CSPNet: A new backbone that can enhance learning capability of cnn. In Proceedings of the IEEE/CVF Conference on Computer Vision and Pattern Recognition Workshops, Seattle, WA, USA, 14–19 June 2020; pp. 390–391. [Google Scholar]
  24. Goodfellow, I.; Pouget-Abadie, J.; Mirza, M.; Xu, B.; Warde-Farley, D.; Ozair, S.; Courville, A.; Bengio, Y. Generative adversarial nets. Adv. Neural Inf. Process. Syst. 2014, 2014, 2672–2680. [Google Scholar]
  25. Reed, S.; Akata, Z.; Yan, X.; Logeswaran, L.; Schiele, B.; Lee, H. Generative adversarial text to image synthesis. arXiv 2016, arXiv:1605.05396. [Google Scholar]
  26. Zhang, H.; Xu, T.; Li, H.; Zhang, S.; Wang, X.; Huang, X.; Metaxas, D.N. Stackgan: Text to photo-realistic image synthesis with stacked generative adversarial networks. In Proceedings of the IEEE International Conference on Computer Vision, Venice, Italy, 22–29 October 2017; pp. 5907–5915. [Google Scholar]
  27. Zhang, H.; Xu, T.; Li, H.; Zhang, S.; Wang, X.; Huang, X.; Metaxas, D.N. Stackgan++: Realistic image synthesis with stacked generative adversarial networks. IEEE Trans. Pattern Anal. Mach. Intell. 2018, 41, 1947–1962. [Google Scholar] [CrossRef] [Green Version]
  28. Su, H.; Maji, S.; Kalogerakis, E.; Learned-Miller, E. Multi-view convolutional neural networks for 3d shape recognition. In Proceedings of the IEEE International Conference on Computer Vision, Santiago, Chile, 7–13 December 2015; pp. 945–953. [Google Scholar]
  29. Yu, T.; Meng, J.; Yuan, J. Multi-view harmonized bilinear network for 3d object recognition. In Proceedings of the IEEE Conference on Computer Vision and Pattern Recognition, Salt Lake City, UT, USA, 18–23 June 2018; pp. 186–194. [Google Scholar]
  30. Liu, Y.; Fan, B.; Meng, G.; Lu, J.; Xiang, S.; Pan, C. Densepoint: Learning densely contextual representation for efficient point cloud processing. In Proceedings of the IEEE International Conference on Computer Vision, Seoul, Korea, 27 October–2 November 2019; pp. 5239–5248. [Google Scholar]
  31. Boulch, A. ConvPoint: Continuous convolutions for point cloud processing. Comput. Graph. 2020, 88, 24–34. [Google Scholar] [CrossRef] [Green Version]
  32. Wu, W.; Qi, Z.; Fuxin, L. Pointconv: Deep convolutional networks on 3d point clouds. In Proceedings of the IEEE Conference on Computer Vision and Pattern Recognition, Long Beach, CA, USA, 15–20 June 2019; pp. 9621–9630. [Google Scholar]
  33. Fang, W.; Feng, H.; Yang, W.; Duan, L.; Chen, G.; Xiong, L.; Liu, Q. High-throughput volumetric reconstruction for 3D wheat plant architecture studies. J. Innov. Opt. Health Sci. 2016, 9, 1650037. [Google Scholar] [CrossRef]
  34. Lassale, C.; Guilbert, C.; Keogh, J.; Syrette, J.; Lange, K.; Cox, D. Estimating food intakes in Australia: Validation of the Commonwealth Scientific and Industrial Research Organisation (CSIRO) food frequency questionnaire against weighed dietary intakes. J. Hum. Nutr. Diet. 2009, 22, 559–566. [Google Scholar] [CrossRef] [PubMed]
  35. Pound, M.P.; French, A.P.; Murchie, E.H.; Pridmore, T.P. Automated recovery of three-dimensional models of plant shoots from multiple color images. Plant Physiol. 2014, 166, 1688–1698. [Google Scholar] [CrossRef] [PubMed] [Green Version]
  36. Chen, N.; Liu, L.; Cui, Z.; Chen, R.; Ceylan, D.; Tu, C.; Wang, W. Unsupervised Learning of Intrinsic Structural Representation Points. In Proceedings of the IEEE/CVF Conference on Computer Vision and Pattern Recognition, Seattle, WA, USA, 13–19 June 2020; pp. 9121–9130. [Google Scholar]
  37. Gay, W. DHT11 sensor. In Advanced Raspberry Pi; Springer: Berlin/Heidelberg, Germany, 2018; pp. 399–418. [Google Scholar]
  38. He, K.; Zhang, X.; Ren, S.; Sun, J. Spatial pyramid pooling in deep convolutional networks for visual recognition. IEEE Trans. Pattern Anal. Mach. Intell. 2015, 37, 1904–1916. [Google Scholar] [CrossRef] [Green Version]
  39. Lin, T.Y.; Dollár, P.; Girshick, R.; He, K.; Hariharan, B.; Belongie, S. Feature pyramid networks for object detection. In Proceedings of the IEEE Conference On Computer Vision and Pattern Recognition, Honolulu, HI, USA, 21–26 July 2017; pp. 2117–2125. [Google Scholar]
  40. Zheng, Z.; Wang, P.; Liu, W.; Li, J.; Ye, R.; Ren, D. Distance-IoU loss: Faster and better learning for bounding box regression. In Proceedings of the AAAI Conference on Artificial Intelligence, New York, NY, USA, 7–12 February 2020; Volume 34, pp. 12993–13000. [Google Scholar]
  41. Reed, S.E.; Akata, Z.; Mohan, S.; Tenka, S.; Schiele, B.; Lee, H. Learning what and where to draw. Adv. Neural Inf. Process. Syst. 2016, 2016, 217–225. [Google Scholar]
  42. Schuster, M.; Paliwal, K.K. Bidirectional recurrent neural networks. IEEE Trans. Signal Process. 1997, 45, 2673–2681. [Google Scholar] [CrossRef] [Green Version]
  43. Szegedy, C.; Vanhoucke, V.; Ioffe, S.; Shlens, J.; Wojna, Z. Rethinking the inception architecture for computer vision. In Proceedings of the IEEE conference on computer vision and pattern recognition, Las Vegas, NV, USA, 27–30 June 2016; pp. 2818–2826. [Google Scholar]
  44. Russakovsky, O.; Deng, J.; Su, H.; Krause, J.; Satheesh, S.; Ma, S.; Huang, Z.; Karpathy, A.; Khosla, A.; Bernstein, M.; et al. Imagenet large scale visual recognition challenge. Int. J. Comput. Vis. 2015, 115, 211–252. [Google Scholar] [CrossRef] [Green Version]
  45. Fan, H.; Su, H.; Guibas, L.J. A point set generation network for 3d object reconstruction from a single image. In Proceedings of the IEEE Conference on Computer Vision and Pattern Recognition, Honolulu, HI, USA, 21–26 July 2017; pp. 605–613. [Google Scholar]
  46. Qi, C.R.; Yi, L.; Su, H.; Guibas, L.J. Pointnet++: Deep hierarchical feature learning on point sets in a metric space. Adv. Neural Inf. Process. Syst. 2017, 2017, 5099–5108. [Google Scholar]
  47. Yue, Y.; Finley, T.; Radlinski, F.; Joachims, T. A support vector method for optimizing average precision. In Proceedings of the 30th Annual International ACM SIGIR Conference on Research and Development in Information Retrieval, Amsterdam, The Netherlands, 23–27 July 2007; pp. 271–278. [Google Scholar]
  48. Woo, S.; Park, J.; Lee, J.Y.; So Kweon, I. Cbam: Convolutional block attention module. In Proceedings of the European Conference on Computer Vision (ECCV), Munich, Germany, 8–14 September 2018; pp. 3–19. [Google Scholar]
  49. Hu, J.; Shen, L.; Sun, G. Squeeze-and-excitation networks. In Proceedings of the IEEE Conference on Computer Vision and Pattern Recognition, Salt Lake City, UT, USA, 18–23 June 2018; pp. 7132–7141. [Google Scholar]
  50. Kempthorne, D.M.; Turner, I.W.; Belward, J.A.; McCue, S.W.; Barry, M.; Young, J.; Dorr, G.J.; Hanan, J.; Zabkiewicz, J.A. Surface reconstruction of wheat leaf morphology from three-dimensional scanned data. Funct. Plant Biol. 2015, 42, 444–451. [Google Scholar] [CrossRef] [Green Version]
  51. Gibbs, J.A.; Pound, M.; French, A.P.; Wells, D.M.; Murchie, E.; Pridmore, T. Approaches to three-dimensional reconstruction of plant shoot topology and geometry. Funct. Plant Biol. 2017, 44, 62–75. [Google Scholar] [CrossRef] [Green Version]
Figure 1. The architecture of our work. Part 1 is the detection model; the model can detect whether the wheat leaves are unfolded or not, and the probability of leaf unfolded and the information of growth environment are composed of semantic information for the next stage. Part 2 uses semantic information and real images to train a generator that can transform semantic information to images. Part 3 uses the image generated in Part 2 to reconstruct the 3D point cloud model of wheat.
Agriculture 11 00450 g001
Figure 2. The left side is a captured image, and the right side is a text description of the image in the dataset.
Agriculture 11 00450 g002
Figure 3. Stage I reconstructs a sparse point cloud from a single image, and the point cloud is used as the input to generate final structure points in stage II.
Agriculture 11 00450 g003
Figure 4. Changes in mAP and loss in each group of experimental training.
Agriculture 11 00450 g004
Figure 5. The test results of wheat images collected from the field. The crease between the wheat leaf and the main stem indicates that the wheat leaf has been fully unfolded, and the crease is the target of detection. The probability in the figure is the confidence score. In the experiment, we set the threshold to 85%. When the confidence score is higher than 85%, the leaf is considered to be unfolded.
Agriculture 11 00450 g005
Figure 6. The test results of the text-to-image model: the model can generate a variety of images based on the text description.
Agriculture 11 00450 g006
Figure 7. According to the wheat images of different stages, the corresponding 3D point cloud is reconstructed by the trained model.
Agriculture 11 00450 g007
Table 1. The results of all comparative experiments.
SENetCBAMMutil-ScaleSizemAP
4160.877
5120.788
4160.887
4160.893
4160.876
4160.849
4160.859
5120.804
5120.825
5120.917
5120.841
5120.862
Bold data represents the best set of experiments.
Table 2. The inception score and R-precision in different λ values and whether to use DAMSM.
DAMSM λ Inception ScoreR-Precision
0.14.08 ± 0.0316.47 ± 4.72
0.14.25 ± 0.0416.87 ± 5.23
14.33 ± 0.0233.46 ± 4.34
14.37 ± 0.0135.72 ± 4.88
54.36 ± 0.0357.62 ± 5.33
54.39 ± 0.0258.64 ± 5.28
104.38 ± 0.0562.68 ± 4.26
104.41 ± 0.0364.78 ± 5.12
504.31 ± 0.0257.68 ± 4.56
504.35 ± 0.0558.94 ± 4.34
Bold data represents the best set of experiments.
Table 3. Results of average distance with different numbers of sampling points: the smaller the value of average distance, the more stable the model.
StageSample NumAverage Distance (%)
Early2560.487
Early5120.136
Early10240.036
Booting2560.544
Booting5120.097
Booting10240.022
Mature2560.479
Mature5120.067
Mature10240.014
Publisher’s Note: MDPI stays neutral with regard to jurisdictional claims in published maps and institutional affiliations.

