Article

Research on the Physical Characteristic Parameters of Banana Bunches for the Design and Development of Postharvesting Machinery and Equipment

1
College of Engineering, South China Agricultural University, Guangzhou 510642, China
2
Guangdong Provincial Key Laboratory of Conservation and Precision Utilization of Characteristic Agricultural Resources in Mountainous Areas, Jiaying University, Meizhou 514015, China
*
Authors to whom correspondence should be addressed.
Agriculture 2021, 11(4), 362; https://doi.org/10.3390/agriculture11040362
Submission received: 24 March 2021 / Revised: 11 April 2021 / Accepted: 14 April 2021 / Published: 16 April 2021
(This article belongs to the Section Agricultural Technology)

Abstract

:
In the operations of the banana postharvesting process, the design and development related to the dehanding machine, the cutting and crushing machine of bunch stalks, and the fiber extraction machine of bunch stalks are in the initial stages. In addition, with the development of society and urbanization, the aging populations in hilly and mountainous areas, where bananas are planted, are becoming a more and more serious problem. The basic physical characteristic parameters of banana bunches, banana hands, and bunch stalks are the basis for studying their biomechanical properties and designing and developing the corresponding mechanical equipment. We measured the diameter, thickness of rind, curvature, density, moisture content, diameter of vascular bundle, weight of bunch stalk, and axial distance and circumferential angle of Brazilian and plantain banana hands using experiments and statistical analysis. Through the combination of physical experiments and numerical statistics, we obtained the value range and changing law of the physical characteristic parameters of banana bunches.

1. Introduction

There are about 136 countries or regions growing bananas around the world; bananas are the fourth most important food crop after rice, wheat, and corn in the world [1,2]. China is one of the origins of banana cultivation, with a cultivation history of more than three thousand years [3]. The postharvesting operations for banana include field picking, field transportation, dehanding, packaging, and selling. In some developed countries like Australia, apart from the dehanding operation, other postharvesting operations have achieved mechanization at different levels [4,5]. The dehanding operation generally relies on manual work, and the high-intensity and repetitive work brings huge health risks to the workers [6]. At present, the research on key technology and the design and manufacture of mechanical banana dehanding equipment are in the embryonic stage, and there is still a lot of room for improvement in the working performance of the mechanical mechanism [7,8,9]. The banana bunch stalk is not only rich in high-quality natural plant fibers but also a valuable biomass resource. It is a great raw material for textile manufacturing [10,11], synthesis of composite materials [12,13,14,15], and preparation of return fertilizer and silage [16,17,18]. However, in the banana orchards of hilly and mountainous areas, where young and middle-aged labor is lacking and the population is aging, the banana bunch stalk, manually dehanded by farmers, is randomly discarded on the roadside, causing a great waste of biomass resources. Moreover, as time goes by, a large amount of backlogs of bunch stalks will have rotted and deteriorated, polluting the environment to a certain degree, which is not in line with the concept of sustainable development of modern agriculture [19]. The existing smashing and fiber extraction of banana stalks are mainly concentrated on the pseudostem [20,21], and there is currently no report on the bunch stalk as a research object. The design and development of crushing, cutting, and pressing machinery and fiber extraction machinery for bunch stalks are closely related to their biomechanical properties. The parameters of basic physical characteristics of banana bunch stalks are the essential basic data for studying their biomechanical properties and the evolution rules of bunch stalks.
The transformation of banana postharvesting operations from the traditional manual work mode to a mechanized work mode is an important symbol and inevitable trend of the development of modern agriculture. Especially in hilly and mountainous areas, when the current situation of increasing labor costs is being faced, speeding up research and breakthroughs in key technologies of mechanized work in banana postharvesting operations, such as the dehanding and processing operations of bunch stalks, is the effective way to solve the current development dilemma of the banana industry. The measurement of the basic physical characteristic parameters of banana bunches, banana hands, and bunch stalks is the basic work of designing and developing the corresponding mechanical equipment. In this paper, we carry out experimental measurements and statistical analysis on the diameter, thickness of rind, curvature, density, moisture content, diameter of vascular bundle, weight of banana bunch stalk, and axial distance and circumferential angle of banana hands. The measurement results of the physical characteristic parameters of banana bunches can provide the most primitive reference data for the research on the biomechanical properties of bunch stalks and the design and development of postharvesting mechanical equipment, thereby indirectly promoting the development of mechanization in banana postharvesting operations.

2. Materials and Methods

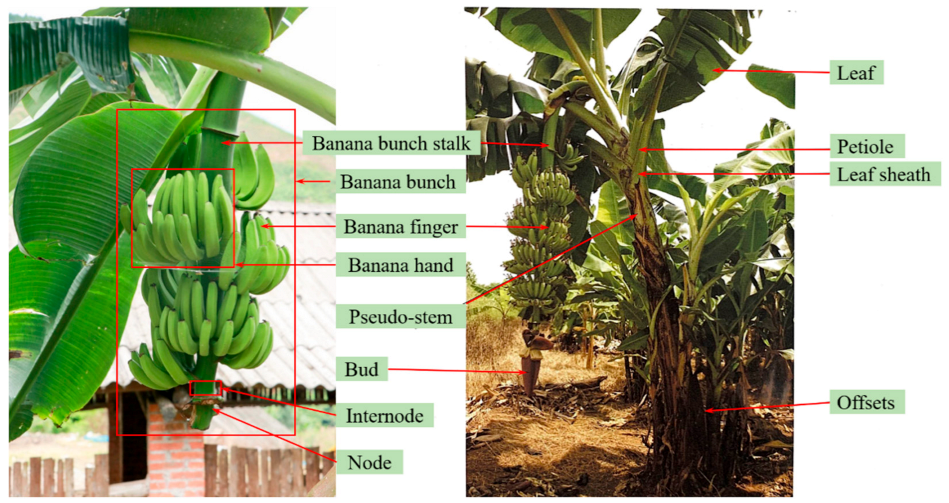
2.1. Cultivation and Morphological Characteristics of the Banana Plant

The banana plant is a large-scale perennial herbaceous fruit tree. After banana seedlings are managed in the nursery for 7 months and grow to more than 1 m in height, they can be dug out and planted in a new banana orchard [22,23]. For planting, local varieties that are suitable for planting should be chosen, having strong stress resistance, high yield and quality, and being best-sellers in the market. According to the regulations of “Banana cultivated seedlings” (NY/T 357-2007), when seedlings are used for planting, the number of plants per hectare should not exceed 2250. Planting density can be adjusted according to the characteristics of the variety, local climate, and topography [24,25]. The banana plant and its growth status after planting are shown in Figure 1. Although bananas are perennials, each banana plant can only bloom and bear fruit once in its lifetime. The best harvest period for bananas is the 12th to 13th month after planting. The mother plant, after fruiting, will gradually wither and need to be cut off, in time, and then the offsets, drawn from the underground bulb, will replace the mother plant and continue to grow, bloom, and bear fruit [26]. The height of banana plants varies with the variety and planting environment, generally ranging from 2 to 7 m.
The aboveground part of the banana plant consists of the pseudostem, leaves, bunch, and bud, as shown in Figure 2. The banana bunch is mainly composed of the bunch stalk and banana hands, and the banana hands are circumferentially and axially distributed on the bunch stalk. The bunch stalk is composed of nodes and internodes. The node is also called the crown, which is the part where the banana hand grows. The bunch stalk mainly plays the role of nutrient component transportation, energy storage, and connection between the bunch and plant body. Its length varies with the variety and the planting environment of the banana plant. In order to ensure the taste quality and economic benefits of banana fruit, only 6~9 hands are generally kept in a bunch after the blossom and fruit thinning process [27,28].

2.2. Measurement of the Physical Characteristics Parameters of Banana Crop

2.2.1. The Diameter of the Bunch Stalk

The biomechanical properties of the banana bunch stalk are directly related to its diameter. When the growth of banana plants, the varieties, and cultivation environments are different, there will also be a certain difference in the diameter of the bunch stalk. We chose the Brazilian banana and plantain banana as the experimental varieties, which are the main cultivated varieties of bananas in Guangdong Province, PR China. For the experimental samples of bunch stalks, we set three moisture content states; that is, the moisture content of the wet base was set to 93%, 91%, and 84%, respectively. We divided the bunch stalk from the first node to the seventh node into six internode positions, and the distance between Node 1 and Node 2 is named Internode Position 1; hence, the distance between Node 6 and Node 7 is named Internode Position 6. We chose a complete and straight bunch stalk, with no disease, pest, and mechanical damage and a length of 78 ± 2 cm, to prepare the samples and used a vernier caliper (DL91150-150 mm) to measure the diameter of the bunch stalk. We repeated the measurement three times for samples of the same variety, moisture content, and internode position, and the average value was chosen as the experimental result. In order to measure the diameter of the bunch stalk more accurately, we simplified its cross-section into a circle; the diameter of the bunch stalk (dbs) can, thus, be obtained as follows in Equation (1):
d bs = 1 6 i = 1 3 D 13 i + D 24 i
where D13i is the distance between the first and third quadrantal points of the cross-sectional circle during the i-th measurement (mm); D24i is the distance between the second and fourth quadrantal points of the cross-sectional circle during the i-th measurement (mm); i is the number of measurements.

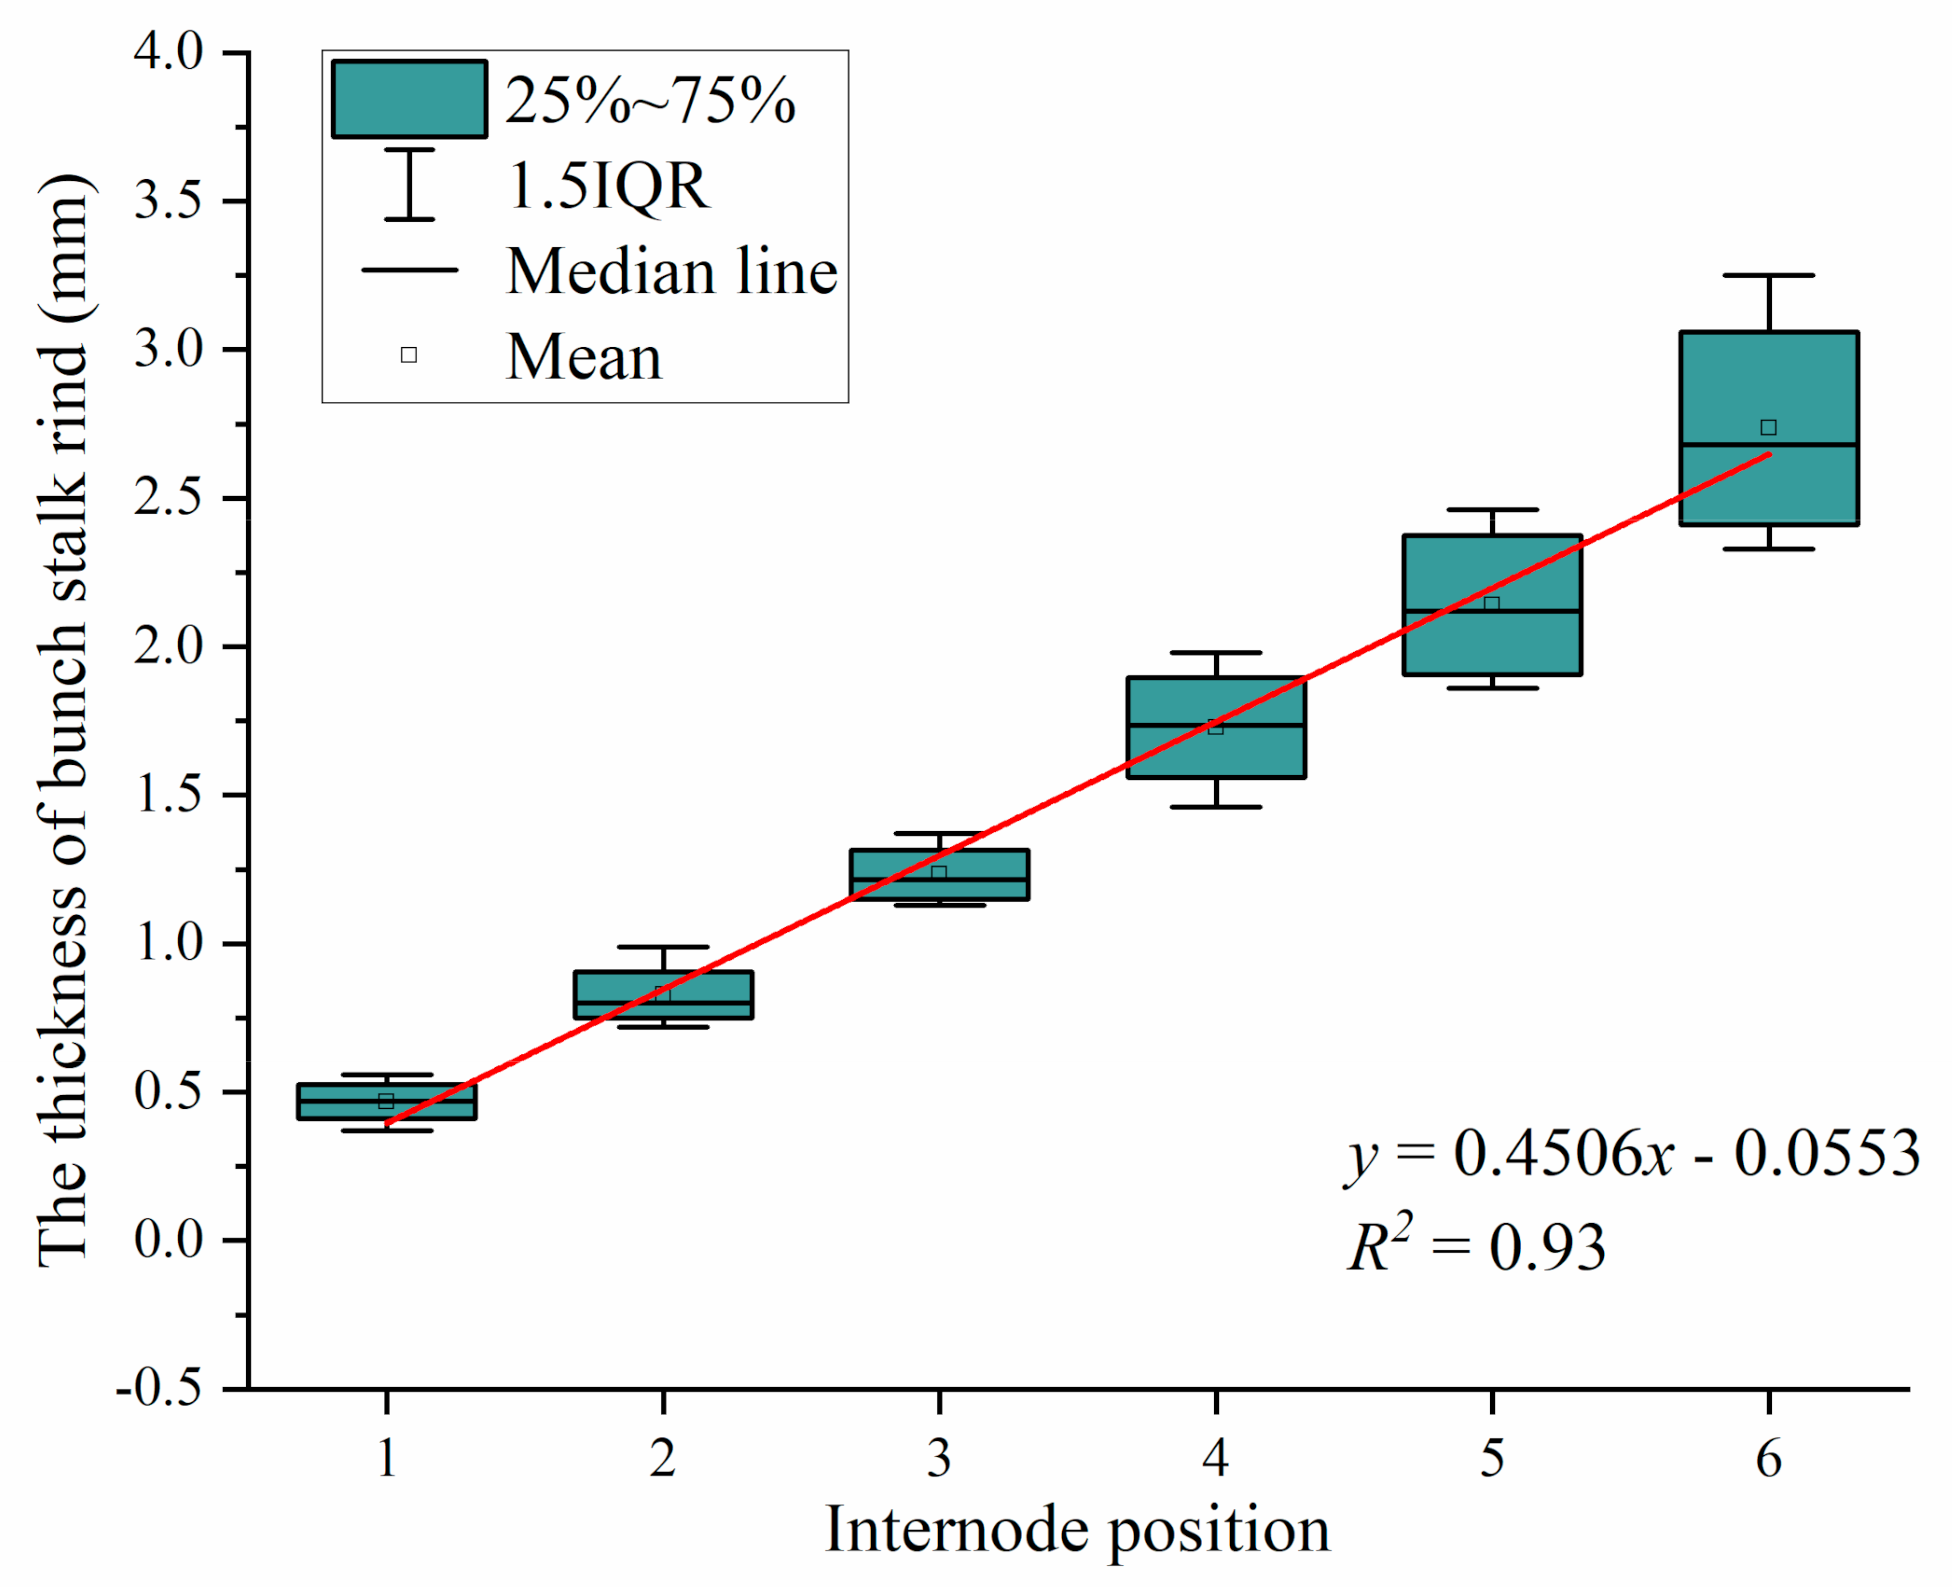
2.2.2. The Thickness of Bunch Stalk Rind

The texture of bunch stalk rind is hard and impermeable, and it has a certain strength and toughness that can protect the inner tissue of the bunch stalk, ensuring the normal transportation of nutrients to banana hands and reducing transpiration [29]. The total length of bunch stalks used for sample preparation was 75 ± 2 cm. After sectioning, 3 cm was cut in the middle of each internode position, and then the rind and inner tissue of the bunch stalk were separated. We used a vernier caliper (DL91150–150 mm) to measure the thickness of the separated rind. Samples of the same variety, moisture content, and internode position were measured repeatedly three times, and the average value of the results was taken. The measured thickness of rind (t) can be obtained as follows in Equation (2):
t = 1 12 i = 1 3 T 1 i + T 2 i + T 3 i + T 4 i
where T1i is the thickness of rind at the first quadrant point during the i-th measurement (mm); T2i is the thickness of rind at the second quadrant point during the i-th measurement (mm); T3i is the thickness of rind at the third quadrant point during the i-th measurement (mm); T4i is the thickness of rind at the fourth quadrant point during the i-th measurement (mm); i is the number of measurements.

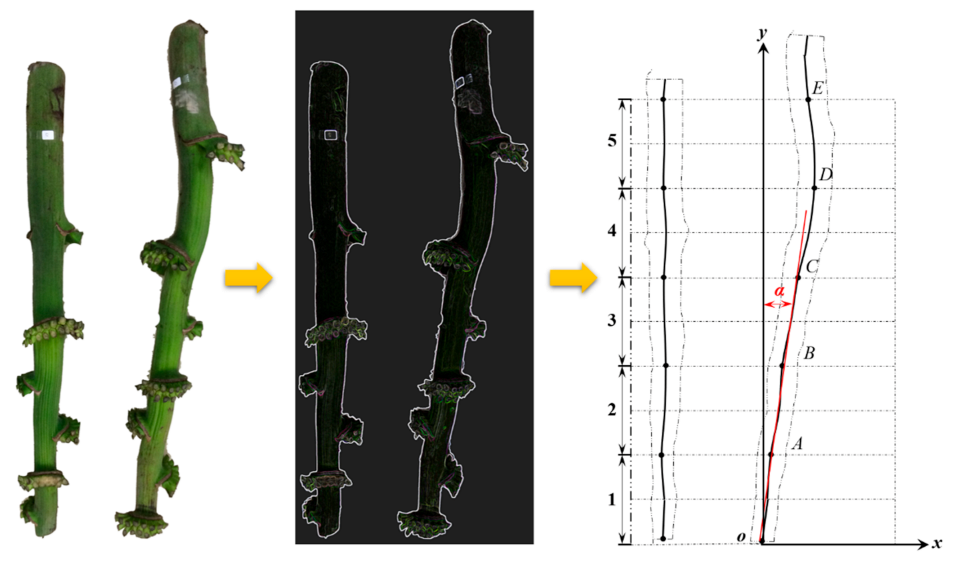
2.2.3. The Curvature of the Bunch Stalk

The curvature of the bunch stalk mainly depends on the variety of the banana plants and the cultivation environment, as well as the difference in the management of banana orchards by farmers [30]. In the experiments of measuring the curvature of bunch stalks, we divided them into 5 segments. During the measurement, we put bunch stalks on an experimental bench covered with graph paper and took pictures from the top view of the bench. A digital color camera (Canon sx610hs) with a resolution of 2048 × 1536 pixels was used. The camera exposure mode was set to auto exposure; the shooting distance was 100 cm. In Photoshop software, background removal and contour extraction of the taken pictures were carried out. We set the origin of the coordinate system at one end of the bunch stalk and set a marker every 150 mm along the positive direction of the Y-axis, which was marked as A, B, C, D, and E, respectively. We used the angle α between the line of each marker to the origin and the positive direction of the Y-axis to represent the curvature of each segment of the bunch stalk, as shown in Figure 3. Samples of the same variety and segment were measured three times, and the average value of the results was taken. The curvature of the bunch stalk (α) can be obtained as follows in Equation (3):
α = 1 3 i = 1 3 arctan x i y i
where xi is the abscissa of the marker during the i-th measurement (mm); yi is the vertical ordinate of the marker during the i-th measurement (mm); i is the number of measurements.

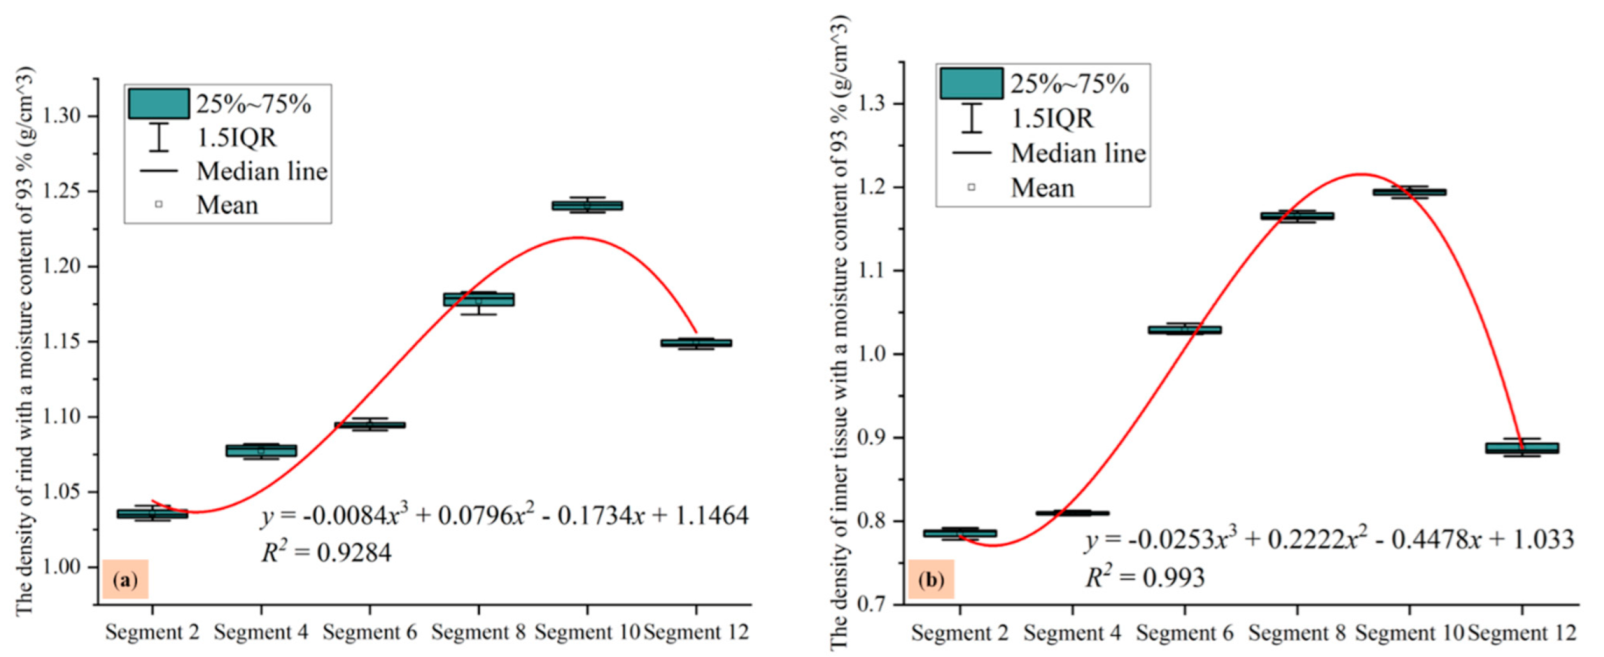
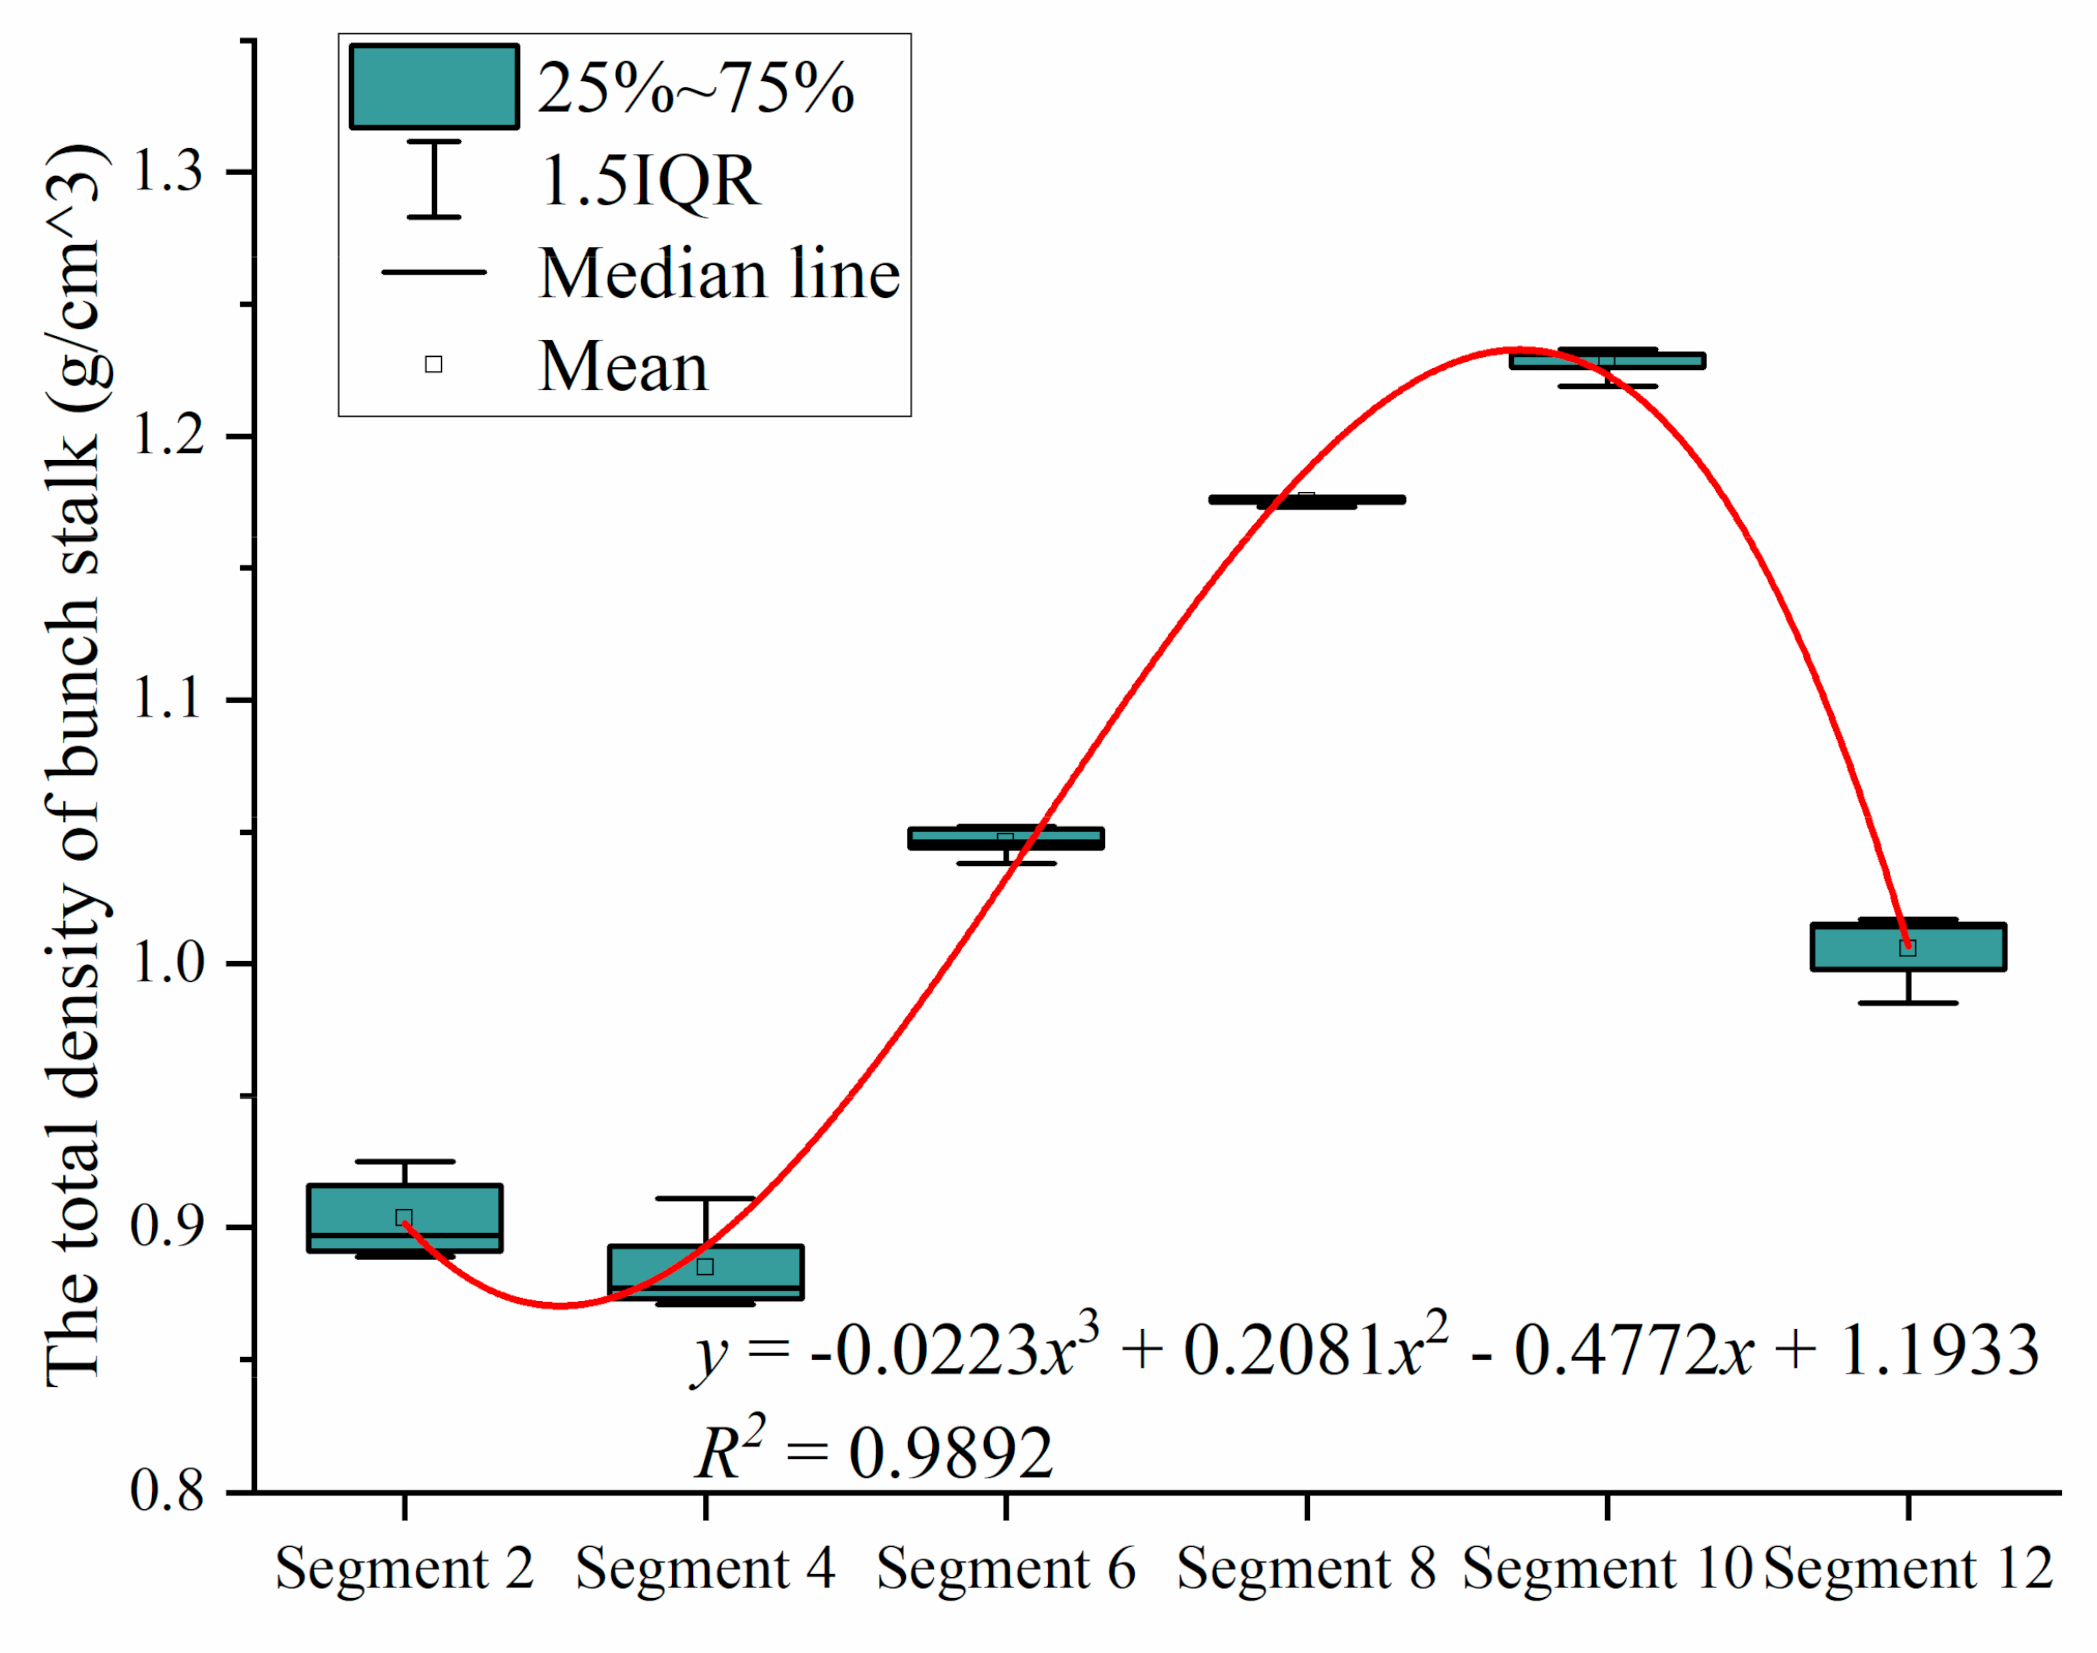
2.2.4. The Density of the Bunch Stalk

The design of cutting machinery and fiber extraction machinery of bunch stalks, the preparation of silage, and the crush of stalks in the field are all closely related to density [31,32]. We selected the bunch stalks of the Brazilian banana, with moisture contents of 93% and 84%, and divided them into 13 segments, respectively. The bunch stalk at Node 1 is named Segment 1, the bunch stalk between the first and second nodes is named Segment 2, the bunch stalk at Node 2 is named Segment 3, the bunch stalk between the second and third nodes is named Segment 4, the bunch stalk at Node 3 is named Segment 5, the bunch stalk between the third and fourth nodes is named Segment 6, the bunch stalk at Node 4 is named Segment 7, the bunch stalk between the fourth and fifth nodes is named Segment 8, the bunch stalk at Node 5 is named Segment 9, the bunch stalk between the fifth and sixth nodes is named Segment 10, the bunch stalk at Node 6 is named Segment 11, the bunch stalk between the sixth and seventh nodes is named Segment 12, and the bunch stalk at Node 7 is named Segment 13. We used the immersion testing method to measure the density of the bunch stalk. The experimental apparatus we used included a Kern ABJ 320-4NM balance, a 500 mL measuring glass, and a 100 mL measuring cylinder. The measurement for each sample was repeated three times, and the average value was taken as the final result. The density of bunch stalk (ρ) can be obtained as follows in Equation (4):
ρ = M V
where M is the mass of the bunch stalk (kg), and V is the volume of the bunch stalk (L).

2.2.5. The Moisture Content of the Bunch Stalk

The water in the plant stalk includes free water and combined water. Free water exists in the intercellular space of fiber cells and capillaries; it participates in the biochemical reactions inside the stalk and has the general properties of ordinary water. The property of free water in the stalk is unstable and is easily affected by temperature. Combined water exists in the fiber cells and is combined with starch, protein, and other substances. It is stable in property and not easy to lose and does not participate in the biochemical reactions inside the stalk [33,34,35]. The increase or decrease of moisture in the stalk mainly refers to the change of free water. The moisture content of the banana bunch stalk refers to the percentage of the total mass of free water and combined water to the mass of bunch stalk. Brazilian banana and plantain banana were chosen as the experimental varieties. We set 6 internode positions on the bunch stalk. In addition, we set three states according to storage time. State 1 is just after being picked from the banana orchards. State 2 is after being placed outdoors for 3 weeks. The average temperature in the 3 weeks was 24 °C, the relative humidity was 82% RH (Relative Humidity), and the atmospheric pressure was 1006 hPa. State 3 is after being placed outdoors for 4 weeks. The average temperature in four weeks was 25 °C, the relative humidity was 90% RH, and the atmospheric pressure was 1011 hPa.
We took a bunch stalk with a thickness of 25 mm in the middle of each internode position and put it in a balance (Kern ABJ 320-4NM) to weigh. Then, we placed it in a DHG-9030 electric thermostatic drying oven and let it dry for 6 h at a constant temperature of 105 ± 1 °C. After taking the sample out of the drying oven, we cooled it for 20 min in the air before weighing, then dried it again for two hours, and reweigh it after cooling in the air. The experimental steps were repeated until the weight of the bunch stalk no longer changed. The experimental steps were repeated 3 times for samples of the same variety, state, and internode position. The moisture content of the bunch stalk (ω) can be obtained as follows in Equation (5):
ω = 1 3 i = 1 3 M i m i M i × 100 %
where Mi is the mass of the sample measured for the i-th time before drying (kg); mi is the mass of the sample measured for the i-th time after drying (kg); i is the number of measurements.

2.2.6. The Diameter of the Vascular Bundle

The bunch stalk is rich in high-quality plant fibers, with high strength and good air permeability, so it is often used as textile raw material and to prepare reinforced composite materials [36]. The main components of the bunch stalk are pectin, lignin, and hemicellulose. The mass fraction of hemicellulose is 19.70%, the mass fraction of lignin is 22.60%, and the mass fraction of pectin is 2.83% [37,38]. The internal tissue of the bunch stalk is mainly composed of phloem, parenchyma, xylem, the vascular bundle, and the vascular bundle sheath. Among them, the vascular bundle is mainly responsible for transporting water and nutrients and supporting the banana plant. The geometric parameters of the vascular bundles in the bunch stalk are different, and the carrying capacity of the bunch stalk will be different.
In the fields of agricultural engineering and mechanical engineering, machine vision and image processing are usually used to measure the geometric parameters of crops or workpieces with irregular geometric shapes [39,40]. The operation steps of this method are successively image acquisition, preprocessing, gray processing, denoising, and calculation of pixels in the target region [41,42]. When the number of pixels in the target region is counted in MATLAB software, the area of the target region can be obtained as follows in Equation (6):
S = s × Q q
where S is the area of the filled region (mm2); s is the area of the reference frame (mm2); Q is the number of pixels in the filled region; q is the number of pixels in the reference frame.
Although the above method has the advantages of high recognition accuracy and scientific data analysis, they have higher requirements for hardware, need a long time for image recognition and analysis, and require enough sample pictures to ensure the accuracy of the final test. Therefore, we used the method of combining a zoom microscope and image processing software to measure the diameter of the vascular bundles. Brazilian banana and plantain banana were selected as the experimental varieties, and bunch stalks with moisture contents of 93%, 91%, and 84% were divided into six internode positions, respectively. We cut the bunch stalk from the middle of internode positions, set the cross-section as the datum plane and the long axis of the datum plane as the datum line, and then set sampling points at 1/4, 1/2, and 3/4 of the long axis. We cut samples of 5, 5, and 2 mm in length, width, and height along the axial and radial directions at the sampling points and gripped them to glass slides with tweezers to prepare longitudinal and transverse slice samples. After the samples were prepared, we used the Keyence VHX-900F super-depth three-dimensional microscopy system to observe the microscopic morphology of the bunch stalk and measure the diameter of the vascular bundles in the slice tissue at the same time. The steps were repeated three times for samples of the same variety, moisture content, and internode position. The diameter of vascular bundles (dvb) can be obtained as follows in Equation (7):
d vb = 1 9 i = 1 3 D 1 4 i + D 1 2 i + D 3 4 i
where D 1 4 i is the average value of the diameter of vascular bundles at the 1/4 sampling point of datum line during the i-th measurement (mm); D 1 2 i is the average value of the diameter of vascular bundles at the 1/2 sampling point of datum line during the i-th measurement (mm); D 3 4 i is the average value of the diameter of vascular bundles at the 3/4 sampling point of datum line during the i-th measurement (mm); i is the number of measurements.

2.2.7. The Weight of the Bunch

The banana bunch is composed of the bunch stalk and banana hands vertically distributed on the bunch stalk. The harvesting method of the banana bunch is different from that of other fruits and vegetables. The most significant difference is that as for the harvesting method of the banana bunch, the whole bunch needs to be picked from the banana plant; then, banana hands and the bunch stalk are separated, which is also called banana dehanding. Therefore, the banana harvesting operation is the general designation for bunch picking and banana dehanding [43]. In the process of harvesting, banana fruits are extremely vulnerable to mechanical damage. Apart from the complex terrain of banana orchards, the large weight and volume of bunches are also the main reasons for the mechanical damage of fruit in the current mechanized banana harvesting process. The weight of banana bunches varies with the variety and the cultivation environment of banana plants.
We selected Brazilian banana and plantain banana as the experimental varieties and divided the bunch stalk into 7 nodes, respectively. That is, the position of the first hand on bunch stalk is Node 1, and so on; the position of the seventh hand is Node 7. We used the TCS-11 electronic balance to weigh banana bunches, hands, and bunch stalks. The measurement of bunches of the same variety and node was repeated 3 times, and the results were averaged.

2.2.8. The Axial Distance of Banana Hands

The changing rule of the axial distance of banana hands is an important basis for the design and development of banana dehanding machines. We chose complete, straight Brazilian banana and plantain banana bunches, free of pests, diseases, and mechanical damage, with a length of 75 ± 2 cm, and set six internode positions on the bunch stalks, respectively. Then, we used a vernier caliper (DL91150-150 mm) to measure the distance between the adjacent nodes, as shown in Figure 4. The measurement of samples of the same variety and internode position was repeated three times, and the average value was taken as the final result.

2.2.9. The Circumferential Angle of Banana Hands

The changing law of the circumferential angle of banana hands is also an important basis for the design and development of banana dehanding machines. We set seven nodes on bunches with a length of 75 ± 2 cm and then cut the bunch stalks into segments. We set the upper, middle, and lower cross-sectional cutting points uniformly at the nodes of bunch stalk, with the center of the cross-section as the vertex, and the line connecting the endpoint of the node and vertex on the cross-section as the dividing line, as shown in Figure 5. The measurement for samples of the same variety and node was repeated three times, and the average value was taken as the final result. The circumferential angle of banana hands ( β ) can be obtained as follows in Equation (8):
β = 1 9 i = 1 3 β u i + β m i + β l i
where β u i is the circumferential angle in the upper (U) cross-section of the i-th measurement (°); β m i is the circumferential angle in the middle (M) cross-section of the i-th measurement (°); β l i is the circumferential angle in the lower (L) cross-section of the i-th measurement (°); i is the number of measurements.

3. Results and Discussion

3.1. Statistical Analysis of the Diameter of Bunch Stalk

According to the above experimental method, the range of the diameter of bunch stalks we measured was 30.56~52.36 mm. The relationship between the diameter of bunch stalks and the internode positions is shown in Figure 6. From the figure, we can see that the diameter of bunch stalks varies linearly with the internode positions. The regression equation obtained by regression analysis shows that there is a linear correlation between the diameter of the bunch stalk and the internode positions.
In order to obtain the comprehensive effect of variety, internode position, and moisture content on the diameter of bunch stalks, we analyzed it with SPSS software. The results are shown in Table 1.
From the table of regression coefficients of the diameter of bunch stalks, we can see that in the regression curve, the variety, internode position, and moisture content have a significant effect on the diameter of bunch stalks (p < 0.05). The multiple linear regression equation can be obtained as follows in Equation (9):
y = 1.276 X 1 + 0.143 X 2 + 3.750 X 3 + 17.090
where X1 is the variety (specifically, 1 and 2 are the Brazilian banana and plantain banana varieties, respectively); X2 is the moisture content; X3 is the internode position.
The analysis results show that it is reliable to use the variety, internode position, and moisture content to regress the diameter of bunch stalks. The results of regression analysis reflected the quantitative relationship between the diameter of bunch stalks and the variety, internode position, and moisture content. In addition, we found that the internode position has a greater effect on the diameter of bunch stalks, while the variety and moisture content have smaller effects on it. According to the relationship model between the experimental factors and the diameter of bunch stalks, the average value range we obtained of the diameter of bunch stalks is 41.12 ± 6.64 mm.

3.2. Statistical Analysis of the Thickness of Bunch Stalk Rind

According to the above experimental method, we measured the thickness of bunch stalk rind. The thickness of bunch stalk rind shows an increasing trend with an increase in moisture content. The average value of the thickness of bunch stalk rind picked from banana orchards was 1.68 mm. After three weeks of storage, the average value dropped to 1.37 mm, with standard deviations of 0.88 and 0.68 mm, respectively. The effect of variety on the thickness of rind is not significant (p > 0.05). The average value of the thickness of Brazilian banana bunch stalk rind was 1.58 mm, and the average value of the thickness of plantain banana bunch stalk rind was 1.46 mm. The standard deviations of the two varieties in thickness of rind were 0.81 and 0.78 mm, respectively. The relationship between the thickness of rind and the internode positions is shown in Figure 7. From the figure, we can see that the thickness of rind increases with the increase in internode positions, which shows a linear relationship.
We used SPSS software to analyze the overall effect of variety, moisture content, and internode position on the thickness of rind. The analysis results are shown in Table 2. The multiple linear regression equation can be obtained as follows in Equation (10):
y = 0.122 X 4 + 0.034 X 5 + 0.451 X 6 2.905
where X4 is the variety (specifically, 1 and 2 are the Brazilian banana and plantain banana varieties, respectively); X5 is the moisture content; X6 is the internode position.
The results of regression analysis show that the internode position has a significant effect on the thickness of rind, showing a linear changing trend. There are differences in the thickness of bunch stalk rind of different varieties and different moisture contents. For example, in the experimental samples, the average value of the thickness of rind of Brazilian bananas is 8.23% larger than that of plantain bananas, and the average value of the thickness of bunch stalk rind picked from banana orchards is 22.63% larger than the average value of the thickness after three weeks. According to the model of the relationship between the experimental factors and thickness of rind, we conclude that the average value of the thickness of bunch stalk rind is 1.52 ± 0.82 mm.

3.3. Statistical Analysis of the Curvature of Bunch Stalks

Through the measurement of the curvature of bunch stalk, we found that the average value of the curvature of Brazilian bananas was 6.16°, and the average value of the curvature of plantain bananas was 5.88°. The standard deviations of the curvature of the two varieties were 0.80° and 0.66°, and the corresponding coefficients of variation were 13.00% and 11.16%, respectively. The relationship between the curvature of the bunch stalk and the segment is shown in Figure 8. The curvature of the bunch stalk increases at first and then decreases with the increase of the segment. The fitting results showed that the changing trend is approximately a cubic curve.
There are differences in the curvature of bunch stalks of different varieties and segments. For example, in the experimental samples, the average value of the curvature of Brazilian bananas was 4.73% larger than that of plantain bananas. The average value of the curvature of Segment 5 on bunch stalk was about 1.01 times that of Segment 4, the average value of the curvature of Segment 4 was about 1.11 times that of Segment 3, the average value of the curvature of Segment 3 was about 1.13 times that of Segment 2, and the average value of the curvature of Segment 2 was about 1.08 times that of Segment 1. According to the relationship model between the experimental factors and the curvature of bunch stalks, we found that the minimum, maximum, and average values of the curvature of bunch stalks are 4.88°, 7.16°, and 6.02°, respectively, with a standard deviation of 0.74° and a coefficient of variation of 12.37%.

3.4. Statistical Analysis of the Density of Bunch Stalks

According to the above experimental method, we measured and calculated the density of Brazilian banana bunch stalks with two different moisture contents. The results are shown in Table 3.
There are differences in the density of rind and the inner tissue of bunch stalks. The rind is mainly composed of densely arranged phloem fibers, and the inner tissue is mainly composed of loosely arranged and moisture-rich xylem fibers, so the density of the rind is higher than that of the inner tissue. The average value of the density of rind with a moisture content of 93% was 1.153 g/cm3, and the variation range was 1.035~1.287 g/cm3. The average value of the density of inner tissue was 1.001 g/cm3, and the variation range was 0.788~1.279 g/cm3. The average value of the density of rind with a moisture content of 84% was 1.121 g/cm3, and the variation range was 1.007~1.256 g/cm3. The average value of the density of inner tissue was 0.978 g/cm3, and the variation range was 0.751~1.241 g/cm3. In general, the average value of the density of bunch stalks was 1.051 g/cm3, and the variation range was 0.873~1.281 g/cm3. In addition, by analyzing the values of the density of each segment on bunch stalks, we found that the density of nodes was higher than that of the internodes.
The density of bunch stalks of different moisture contents showed certain differences with the different segments. Figure 9 shows the relationship between the density of rind and the inner tissue of bunch stalks (without nodes) with a moisture content of 93% and the segments. Figure 10 shows the relationship between the density of rind and the inner tissue of bunch stalks (without nodes) with a moisture content of 84% and the segments. Figure 11 shows the relationship between the density of the whole bunch stalk without nodes and the segments. From the figures, we can see that the density of bunch stalks increases at first and then decreases with the increase of segments, and the fitting results show that the changing trend is approximately a cubic curve. According to the relationship model between the experimental factors and the density of bunch stalks, the minimum, maximum and average values of the densities we obtained are 0.871, 1.233, and 1.051 g/cm3, with a standard deviation of 0.128 g/cm3 and a coefficient of variation of 12.29%.

3.5. Statistical Analysis of the Moisture Content of Bunch Stalks

According to the abovementioned experimental method, we measured the moisture content of bunch stalks, and the minimum, maximum and average values of the moisture content we obtained were 71.82%, 94.13%, and 83.29%, respectively; the standard deviation was 8.86%, and the coefficient of variation was 10.64%. The reason for the difference in the moisture content of bunch stalks may be due to the variety of bananas, the storage time, and the internode positions. The relationship between the moisture content of bunch stalks and the internode positions is shown in Figure 12. We found that as the storage time of bunch stalks increased, the moisture content showed a significant downward trend. In addition, there was little difference in moisture content between different varieties.
In order to explore the relationship between the moisture content of bunch stalks and the internode positions, we performed regression fitting and correlation analysis on the experimental results. The results showed that the moisture content of bunch stalks increased with the increase of internode positions. The fitting linear regression equations can be obtained as follows in Equations (11)–(16):
y 1 = 0.17 x + 93.147   R 2 = 0.9713
where y1 is the moisture content of freshly picked Brazilian banana bunch stalks, and x is the internode position.
y 2 = 0.2126 x + 83.303   R 2 = 0.9558
where y2 is the moisture content of Brazilian banana bunch stalks after three weeks of storage, and x is the internode position.
y 3 = 0.0929 x + 71.8   R 2 = 0.9104
where y3 is the moisture content of Brazilian banana bunch stalks after four weeks of storage, and x is the internode position.
y 4 = 0.1946 x + 93.091   R 2 = 0.9335
where y4 is the moisture content of freshly picked plantain banana bunch stalks, and x is the internode position.
y 5 = 0.234 x + 83.196   R 2 = 0.975
where y5 is the moisture content of plantain banana bunch stalks after three weeks of storage, and x is the internode position.
y 6 = 0.0883 x + 71.753   R 2 = 0.9751
where y6 is the moisture content of plantain banana bunch stalks after four weeks of storage, and x is the internode position.
In order to obtain the comprehensive effect of variety, state, and internode position on the moisture content of bunch stalks, we analyzed it with SPSS software; the results are shown in Table 4. The results showed that in the regression curve, the state and internode position had significant effects (p < 0.05), while the variety had an insignificant effect (p > 0.05). The multiple linear regression equation can be obtained as follows in Equation (17):
y = 0.022 X 7 10.832 X 8 + 0.165 X 9 + 104.411
where X7 is the variety (specifically, 1 and 2 are the Brazilian banana and plantain banana varieties, respectively; X8 is the stated number of bunch stalks; X9 is the internode position.
The above analysis results show that it is reliable to use variety, state, and internode position to regress the moisture content of bunch stalks. The variety has a relatively smaller effect on the moisture content of bunch stalks, while the storage time and internode position have greater effects on the moisture content of bunch stalks. This shows that in freshly picked bunch stalks, the mass fraction of water is relatively high. The mass fraction of water increases as the distance between the bunch stalk and pseudostem decreases. As the storage time increases, the water in bunch stalks gradually evaporates, and the moisture content shows a decreasing trend. According to the relationship model between the experimental factors and the moisture content of bunch stalks, we conclude that the variation range of the value of moisture content is 74.3~92.28%.

3.6. Statistical Analysis of the Diameter of the Vascular Bundle

The macroscopic and microscopic forms of bunch stalks are shown in Figure 13. From the figure, we can see that the vascular bundles in banana hands and fingers are from the bunch stalk. The vascular bundles in bunch stalks pass through the vascular bundle switching region (VBSR), the vascular bundle expansion region (VBER), and the vascular bundle dispersion region (VBDR), in turn, and then flow into the banana hands [44]. From the microstructure diagram of bunch stalks, we can see that the elongated vascular bundles are distributed in the parenchyma, which is mainly composed of xylem, phloem, and the vascular bundle sheath. There are a large number of basic tissues around the vascular bundles. The geometric dimensions of the xylem, phloem, and vascular bundle sheath in the vascular bundles are larger than those in basic tissues, indicating that the vascular bundles play an important role in supporting the bunch stalk.
The minimum, maximum and average values of the diameter of the vascular bundle of bunch stalks we measured were 84, 138, and 111 μm, respectively, with a standard deviation of 17 μm and a coefficient of variation of 15.27%. The relationship between the diameter of the vascular bundle and the internode positions is shown in Figure 14. Moisture Content 1, Moisture Content 2, and Moisture Content 3, shown in the figure, represent the moisture contents of the bunch stalks, that is, 93%, 91%, and 84%. By analyzing the measurement results of the diameter of the vascular bundle of bunch stalks, we found that the variety and moisture content have no significant effect on the diameter of the vascular bundle. The distribution interval of the diameter of the vascular bundle is shown in Figure 15. According to the above measurement results, we conclude that the average value of the diameter of the vascular bundle is 0.11 mm, the distribution interval is 0.084~0.138 mm, and the corresponding peak value of the distribution interval is 0.096~0.127 mm.

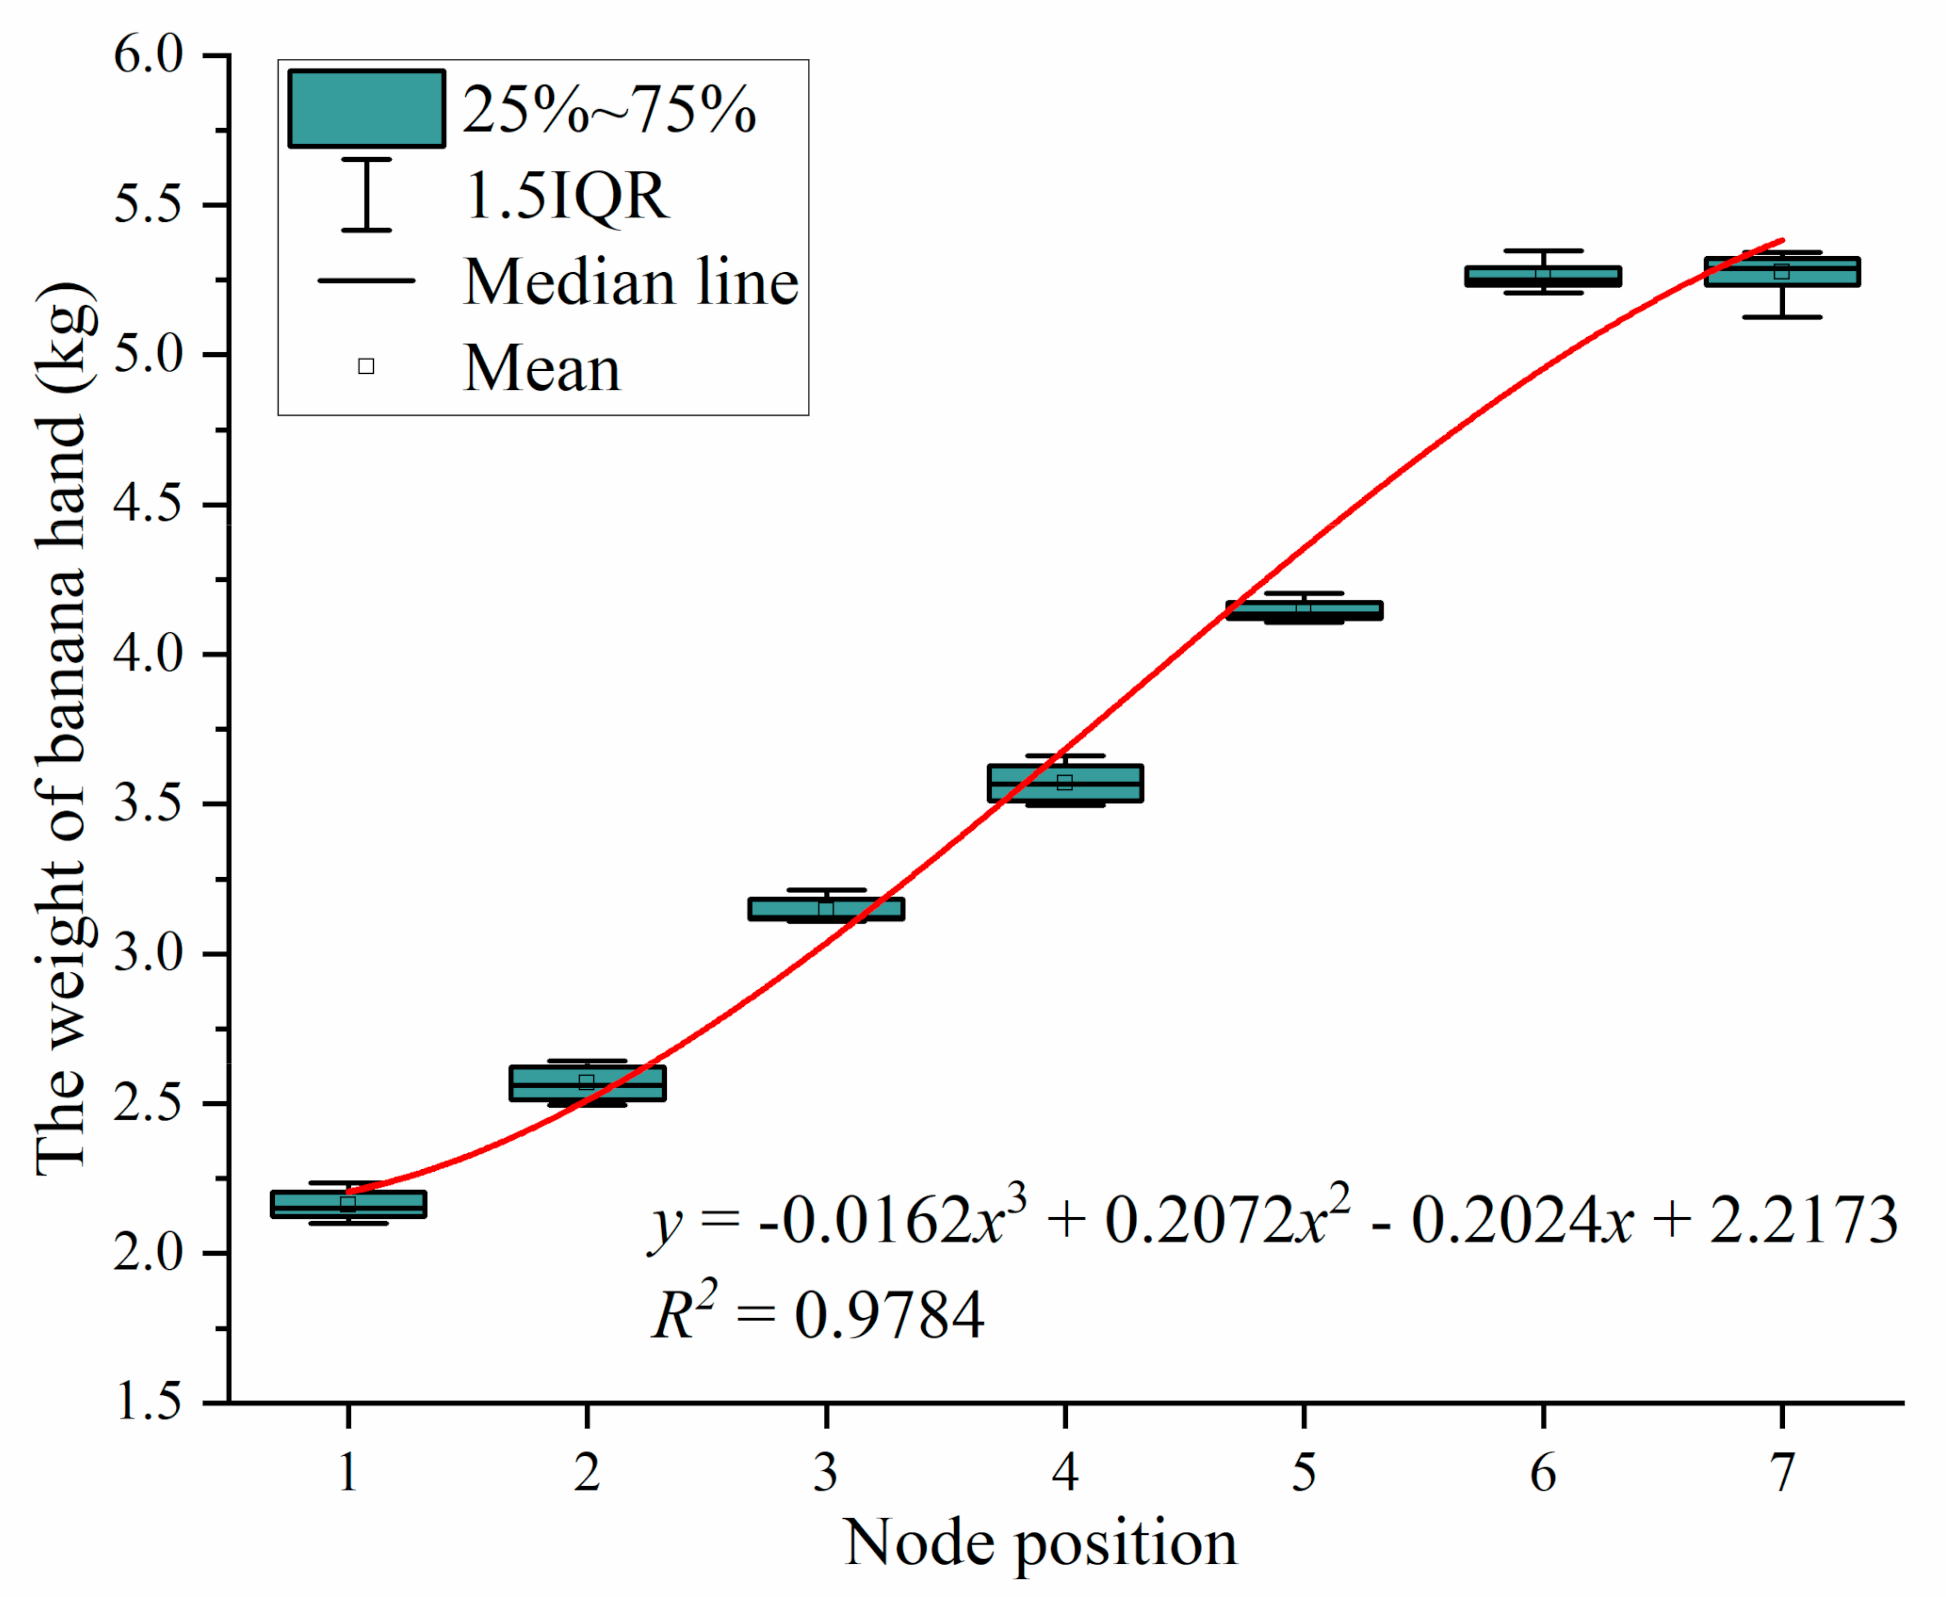
3.7. Statistical Analysis of the Weight of Bunch

The weight of bunch stalk, the weight of bunch, and the weight ratio of the bunch stalk of Brazilian banana and plantain banana are shown in Figure 16.
According to the experimental results, the minimum, maximum and average values of the weight of bunch stalks we obtained were 1.906, 2.455, and 2.088 kg, respectively, with a standard deviation of 0.155 kg and a coefficient of variation of 7.443%. The minimum, maximum, and average values of the weight of bunches were 28.023, 32.562, and 30.492 kg, respectively; the standard deviation is 1.696 kg, and the coefficient of variation is 5.563%. The minimum, maximum, and average values of the weight ratio of bunch stalks were 6.422%, 7.544%, and 6.848%, respectively. The minimum, maximum, and average values of the weight of Brazilian banana bunch stalks were 1.906, 2.418, and 2.089 kg, respectively, with a standard deviation of 0.158 kg and a coefficient of variation of 7.563%. The minimum, maximum, and average values of the weight of Brazilian banana bunches were 28.023, 32.411, and 30.362 kg, respectively, with a standard deviation of 1.835 kg and a coefficient of variation of 6.044%. The minimum, maximum, and average values of the weight ratio of Brazilian banana bunch stalks were 6.422%, 7.544%, and 6.881%, respectively. The minimum, maximum, and average values of the weight of plantain banana bunch stalks were 1.923, 2.455, and 2.087 kg, respectively, with a standard deviation of 0.153 kg and a coefficient of variation of 7.321%. The minimum, maximum, and average values of the weight of plantain banana bunches were 28.453, 32.562, and 30.623 kg, respectively; the standard deviation was 1.534 kg, and the coefficient of variation was 5.009%. The minimum, maximum, and average values of the weight ratio of plantain banana bunch stalks were 6.528%, 7.539%, and 6.814%, respectively. By comparing the experimental results, we found that the reason for the difference in the weight of bunch stalks, bunches, and hands may be due to the difference in variety and node positions. The relationship between the weight of banana hands and the node positions is shown in Figure 17. From the figure, we can see that the weight of banana hands increases with the increase in the node positions, and the fitting results showed that the changing trend is approximately a cubic curve.
In order to analyze the comprehensive effect of variety and node positions on the weight of banana hands, we used SPSS software; the analysis results are shown in Table 5. The multiple linear regression equation can be obtained as follows in Equation (18):
y = 0.024 X 10 + 0.575 X 11 + 1.396
where X10 is the variety (specifically, 1 and 2 are the Brazilian banana and the plantain banana varieties, respectively); X11 is the node position.
The above analysis results show that the effect of variety on the weight of banana hands is not significant, and node position has a significant effect on the weight of banana hands. There are differences in the weight of banana hands at different node positions. For example, the average weight of banana hands at Node Position 7 on the bunch stalk is about 1.006 times that of Node Position 6. The average weight of banana hands at Node Position 6 is about 1.277 times that of Node Position 5. The average weight of banana hands at Node Position 5 is about 1.184 times that of Node Position 4. The average weight of banana hands at Node Position 4 is about 1.112 times that of Node Position 3. The average weight of banana hands at Node Position 3 is about 1.257 times that of Node Position 2. The average weight of banana hands at Node Position 2 is about 1.180 times that of Node Position 1. According to the relationship model between the experimental factors and the weight of banana hands, the average value of the weight of banana hands we obtained is 3.730 ± 1.211 kg.

3.8. Statistical Analysis of the Axial Distance of Banana Hands

According to the above experimental method, the average range of the axial distance of banana hands we obtained is 50.48~129.99 mm. The relationship between the axial distance of banana hands and the internode positions is shown in Figure 18. From the figure, we can see that the axial distance of banana hands increases with the increase of internode positions. The fitting result shows that the changing trend is approximately expressed as a cubic curve.
In order to analyze the comprehensive effect of variety and internode position on the axial distance of banana hands, we used SPSS software. The results are shown in Table 6. The multiple linear regression equation can be obtained as follows in Equation (19):
y = 0.602 X 12 + 14.271 X 13 + 36.580
where X12 is the variety (specifically, 1 and 2 are the Brazilian banana and plantain banana varieties, respectively); X13 is the internode position.
The results of regression analysis show that the effect of variety on the axial distance of banana hands is not significant, and the internode position has a significant effect on the axial distance of banana hands. There are differences in the axial distance of banana hands at different internode positions. For example, the average value of the axial distance at Internode Position 6 is about 1.291 times that of Internode Position 5. The average value of the axial distance at Internode Position 5 is about 1.054 times that of Internode Position 4. The average value of the axial distance at Internode Position 4 is about 1.181 times that of Internode Position 3. The average value of the axial distance at Internode Position 3 is about 1.165 times that of Internode Position 2. The average value of the axial distance at Internode Position 2 is about 1.355 times that of Internode Position 1. According to the relationship model between the experimental factors and the axial distance of banana hands, the average value of the axial distance of banana hands we obtained is 87.431 ± 25.898 mm.

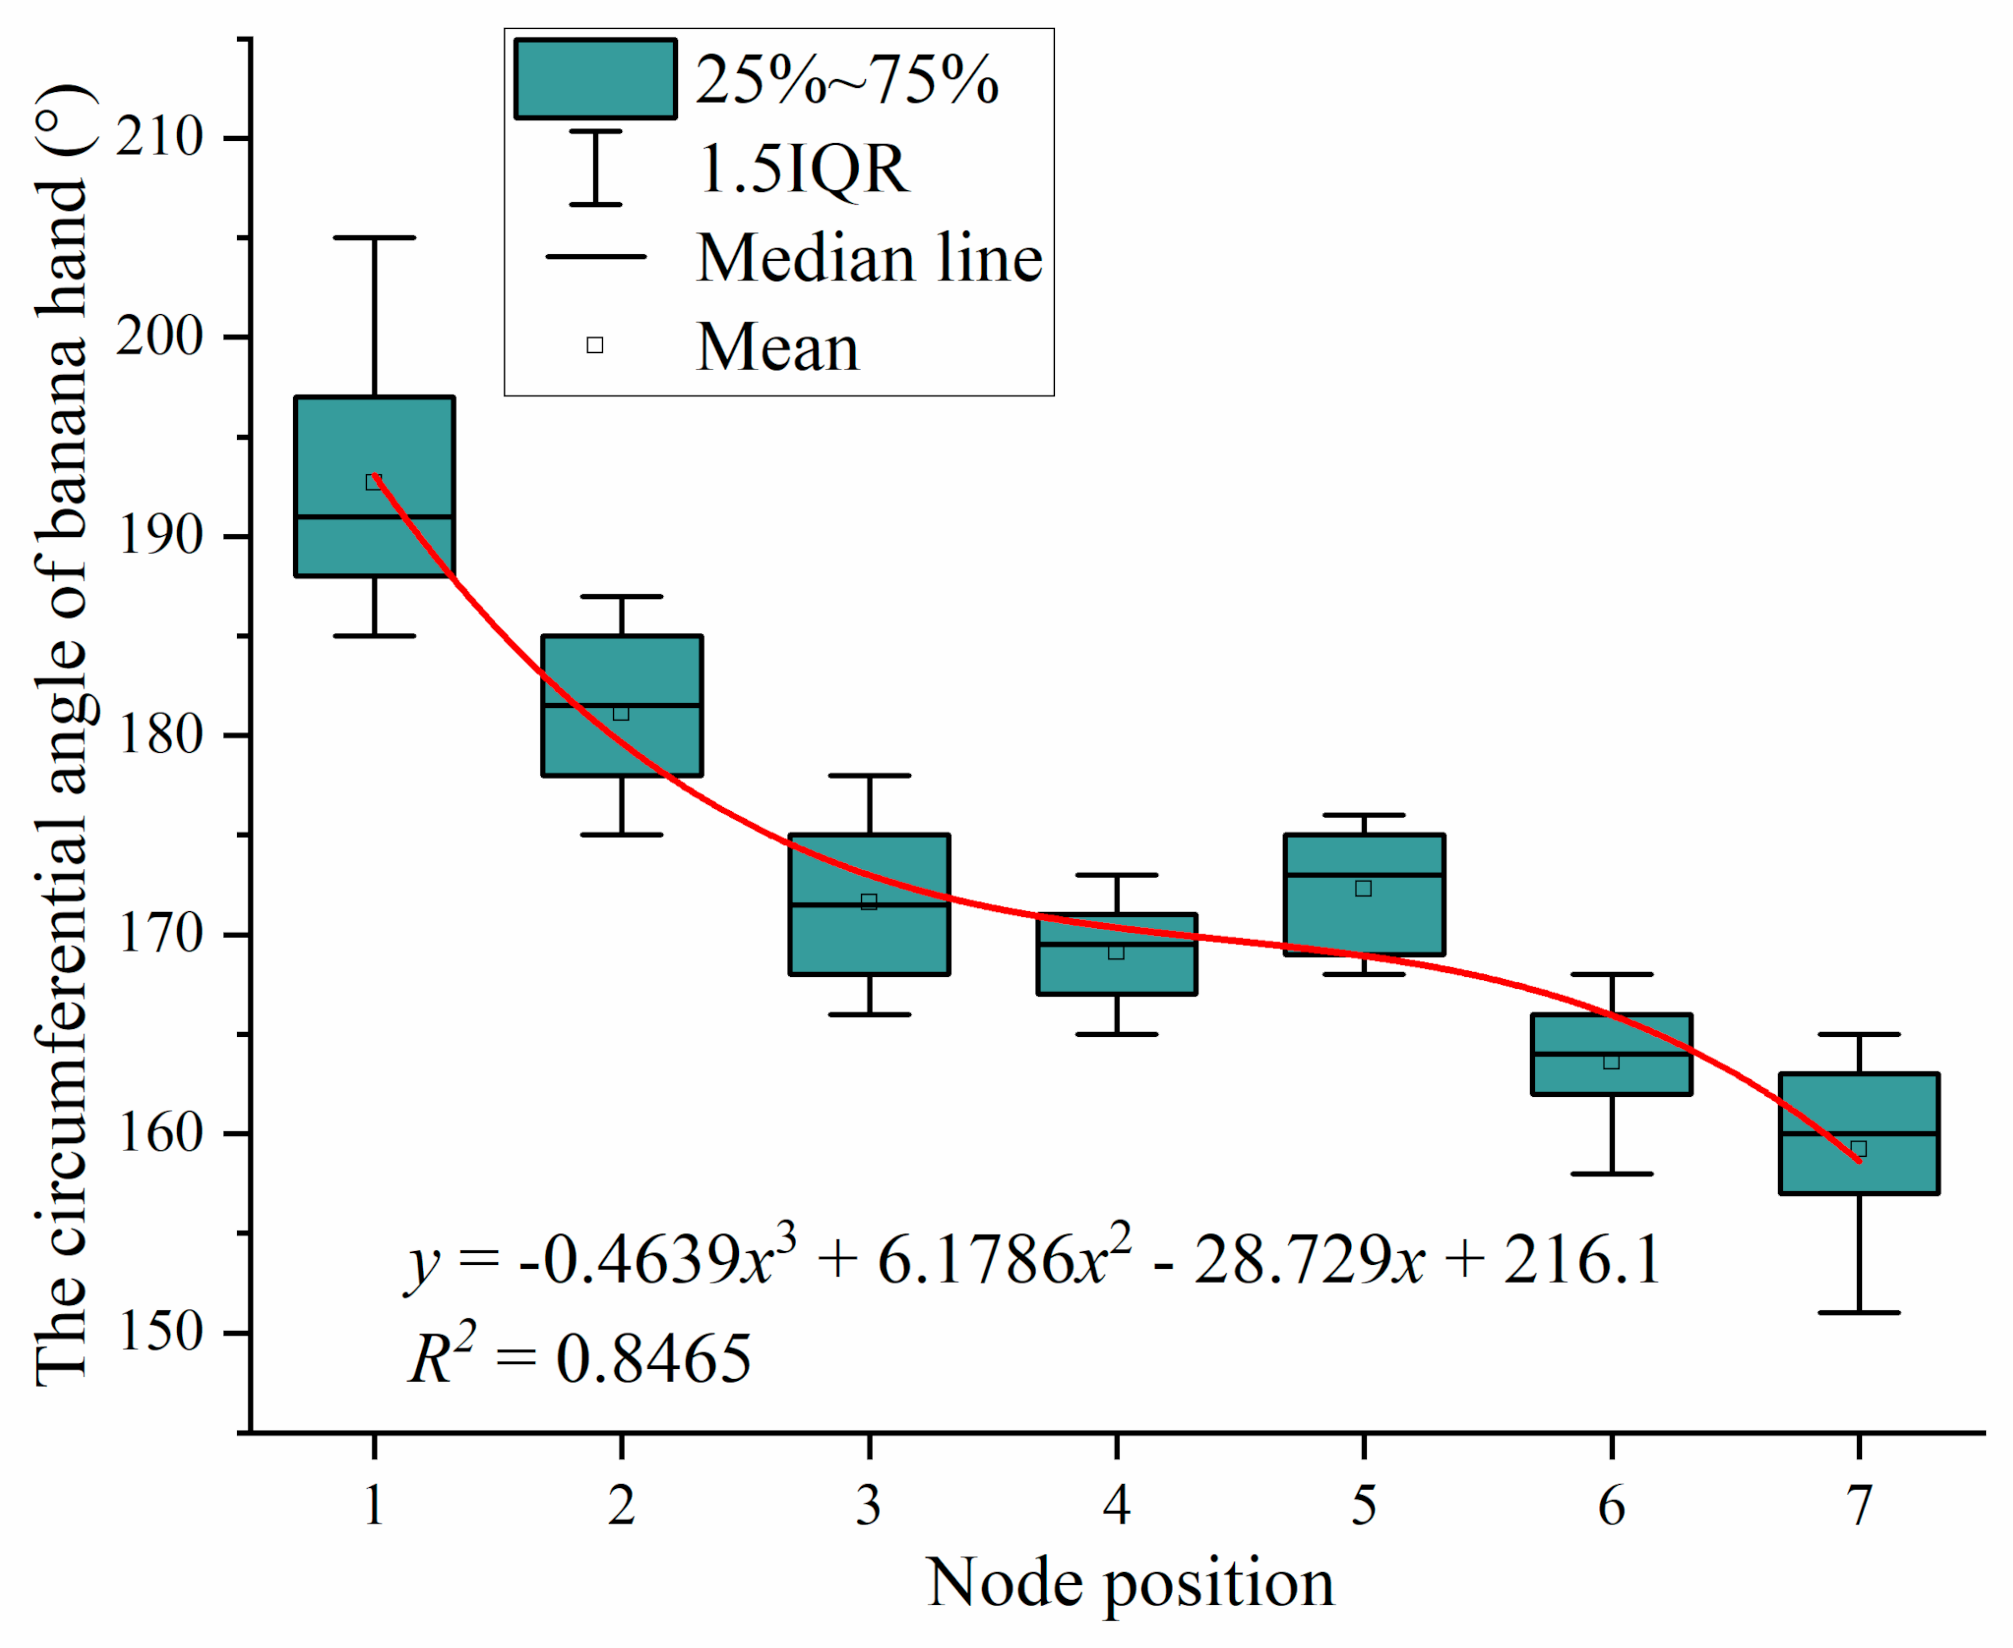
3.9. Statistical Analysis of the Circumferential Angle of Banana Hands

The average range of the circumferential angle of banana hands we obtained was 161~191° through the experimental measurements. The statistical values of the circumferential angle of banana hands are shown in Figure 19, and the relationship between the circumferential angle of the banana hand and the node position is shown in Figure 20. From the figures, we can see that the circumferential angle of banana hands decreases with the increase of node position, and the fitting results show that the changing trend is approximately a cubic curve.
In order to ascertain the comprehensive effect of variety and node position on the circumferential angle of banana hands, we used SPSS software for the analysis; the results are shown in Table 7. The multiple linear regression equation can be obtained as follows in Equation (20):
y = 2.143 X 14 3.857 X 15 + 192.571
where X14 is the variety (specifically, 1 and 2 are the Brazilian banana and plantain banana varieties, respectively); X15 is the node position.
The above analysis results show that the effect of variety on the circumferential angle of banana hands is not significant, and the node position has a significant effect on the circumferential angle of banana hands. There are differences in the circumferential angle of banana hands at different node positions. For example, the average value of the circumferential angle of banana hands at Node Position 1 is about 1.053 times that of Node Position 2. The average value of the circumferential angle of banana hands at Node Position 2 is about 1.020 times that of Node Position 3. The average value of the circumferential angle of banana hands at Node Position 3 is about 1.054 times that of Node Position 4. The average value of the circumferential angle of banana hands at Node position 4 is about 0.963 times that of Node Position 5. The average value of the circumferential angle of banana hands at Node Position 5 is about 1.042 times that of Node Position 6. The average value of the circumferential angle of banana hands at Node Position 6 is about 1.025 times that of Node Position 7. According to the relationship model between the experimental factors and the circumferential angle of banana hands, the average value of the circumferential angle of banana hands we obtained is 173.93 ± 8.91°.

4. Conclusions

We used a combination method of physical testing and numerical statistics to measure and analyze parameters such as the diameter, thickness of rind, curvature, density, moisture content, diameter of vascular bundle, weight of banana bunch stalk, and the axial distance and circumferential angle of banana hands. We found that there is a linear correlation between the diameter of bunch stalks and the internode position. The results of regression analysis of the diameter of bunch stalks show that the internode position has a greater effect on the diameter of bunch stalk, while the variety and moisture content have smaller effects on the diameter of bunch stalks. There is also a linear relationship between the thickness of bunch stalk rind and the internode position. In addition, there is a cubic curve correlation between the curvature of bunch stalks and the segment position. The average value of the curvature of bunch stalks of Brazilian banana is 4.73% larger than that of plantain banana. There is also a cubic curve correlation between the density of bunch stalks and the segment position. The moisture content of bunch stalks shows an obvious downward trend with an increase in storage time, and there is little difference in moisture content between different varieties. There is a cubic curve correlation between the weight of banana hands and the node position. There is a cubic curve correlation between the axial distance of banana hands and the internode position, and the relationship between the circumferential angle of banana hands and the node position also shows a cubic curve correlation. The parameters of basic physical characteristics of banana bunches, bunch stalks, and banana hands are the basis for the study of their biomechanical properties, as well as original data for the design and development of mechanical equipment for banana postharvesting operations.
It should be noted that because we only measured and analyzed the physical characteristic parameters of Brazilian banana and plantain banana, the two main varieties of bananas in Guangdong Province, China, the data and conclusions we obtained are not applicable to other varieties of bananas. In order to manufacture stable, reliable, and widely applicable machinery for banana dehanding, bunch stalk crushing, and fiber extraction of bunch stalk, and to promote the transformation of banana postharvesting operations from the traditional work mode to a mechanized work mode, it is also necessary to carry out measurement and research on the basic physical characteristic parameters and changing laws of banana bunches with regard to other varieties according to the actual situation.

Author Contributions

Conceptualization, J.D., J.L. and Z.Y.; methodology, J.G., H.F. and Z.Y.; software, J.G., H.F., Y.J. and T.J.; validation, T.J. and E.L.; formal analysis, J.G. and Y.J.; investigation, J.G., Y.J., T.J. and E.L.; resources, J.D. and Z.Y.; data curation, J.G. and H.F.; writing—original draft preparation, J.G.; writing—review and editing, H.F., J.L. and Z.Y.; visualization, J.G. and H.F.; supervision, J.D. and Z.Y.; project administration, J.D. and J.L.; funding acquisition, Z.Y. All authors have read and agreed to the published version of the manuscript.

Funding

This research was funded by the National Key Research and Development Program of China (2020YFD1000104), the National Natural Science Foundation of China (Grant No. 51675189), and the China Agriculture Research System (CARS-31). The authors wish to thank them for their generous financial assistance.

Institutional Review Board Statement

Not applicable.

Informed Consent Statement

Not applicable.

Data Availability Statement

The study did not report any data.

Conflicts of Interest

The authors declare no conflict of interest.

References

  1. Ke, Y.; Guo, J.; Fang, J.; Ma, C.; Zhang, H. Analysis on the development trend of world banana production and trade. World Agric. 2008, 4, 38–39. [Google Scholar]
  2. Production/Yield Quantities of Bananas in the World. Food and Agriculture Organization of the United Nations. Available online: http://www.fao.org/faostat/zh/#data/QC/visualize (accessed on 29 December 2020).
  3. Xie, J. Fruit scientific research in New China in the past 70 years: Banana. J. Fruit Sci. 2019, 36, 1429–1440. [Google Scholar]
  4. Guo, J.; Duan, J.; Li, J.; Yang, Z. Mechanized technology research and equipment application of banana post-harvesting: A review. Agronomy 2020, 10, 374. [Google Scholar] [CrossRef] [Green Version]
  5. Li, J.; Yang, Z.; Wang, L.; Wang, W. Research and application for mechanization of banana production. J. Anhui Agric. Sci. 2011, 39, 1836–1838. [Google Scholar]
  6. Merino, G.; da Silva, L.; Mattos, D.; Guimarães, B.; Merino, E. Ergonomic evaluation of the musculoskeletal risks in a banana harvesting activity through qualitative and quantitative measures, with emphasis on motion capture (Xsens) and EMG. Int. J. Ind. Ergon. 2019, 69, 80–89. [Google Scholar] [CrossRef]
  7. Guo, J.; Jin, M.; Duan, J.; Li, J.; Fu, H.; Zhao, L.; Xu, Z.; Ding, Y.; Jiang, Y.; Yang, Z. Design and experiment of banana de-handing device based on symmetrical shape deployable mechanism. Symmetry 2020, 12, 415. [Google Scholar] [CrossRef] [Green Version]
  8. Xu, Z.; Yang, Z.; Duan, J.; Jin, M.; Mo, J.; Zhao, L.; Guo, J.; Yao, H. Design and experiment of symmetrical shape deployable arc profiling mechanism based on composite multi-cam structure. Symmetry 2019, 11, 958. [Google Scholar] [CrossRef] [Green Version]
  9. Yang, Z.; Guo, J.; Jin, M.; Duan, J.; Fu, H.; Xu, Z. Design and analysis of self-adaptability in banana crown-cutting device based on constant-force mechanism. Trans. Chin. Soc. Agric. Mach. 2019, 50, 148–155. [Google Scholar]
  10. Xiong, Y.; Cui, Y. Research status of banana fiber and its prospect of development and application. J. Text. Res. 2007, 28, 122–124. [Google Scholar]
  11. Tian, Y.; Liu, J.; Sun, L.; He, Q.; Xu, Y.; Wang, L.; Han, X.; Zu, B. Research progress on banana fiber. Dyest. Color. 2019, 56, 44–46. [Google Scholar]
  12. Muralikrishna, M.V.V.; Surya Kumari, T.S.A.; Gopi, R.; Loganathan, G.B. Development of mechanical properties in banana fiber composite. Mater. Today Proc. 2020, 22, 541–545. [Google Scholar] [CrossRef]
  13. Pothan, A.L.; Thomas, S.; Oommen, Z. Dynamic mechanical analysis of banana fiber reinforced polyester composites. Compos. Sci. Technol. 2003, 63, 283–293. [Google Scholar] [CrossRef]
  14. Rao, D.N.; Mukesh, G.; Ramesh, A.; Anjaneyulu, T. Investigations on the mechanical properties of hybrid goat hair and banana fiber reinforced polymer composites. Mater. Today Proc. 2020, 27, 1703–1707. [Google Scholar]
  15. Boopalan, M.; Niranjanaa, M.; Umapathy, M.J. Study on the mechanical properties and thermal properties of jute and banana fiber reinforced epoxy hybrid composites. Compos. Part B Eng. 2013, 51, 54–57. [Google Scholar] [CrossRef]
  16. Zhang, X.; Wang, C.; Li, B.; Zhang, J. Utilization status and outlook of banana stalk and leaves residues in China. Chin. J. Trop. Agric. 2015, 10, 69–74. [Google Scholar]
  17. Wang, C. The utilisation of vanana by-product in the livestock. Feed Res. 2020, 43, 144–146. [Google Scholar]
  18. Huang, W.; Qin, H.; Lu, Y.; Li, B.; Tang, X.; Wang, C.; Yang, Y.; Ou, J. Effects of banana stem and its biochar application on soil aggregate characteristics in the Pearl River Delta. Chin. J. Eco-Agric. 2020, 28, 413–420. [Google Scholar]
  19. Luo, X.; Liao, J.; Hu, L.; Zang, Y.; Zhou, Z. Improving agricultural mechanization level to promote agricultural sustainable development. Trans. Chin. Soc. Agric. Eng. 2016, 32, 1–11. [Google Scholar]
  20. Zhang, X.; Wang, C.; Liang, D.; Li, Y. Experiment of parameter optimization of fiber roller-scraping device for banana stalk. Trans. Chin. Soc. Agric. Eng. 2016, 32, 55–62. [Google Scholar]
  21. Zhang, X.; Wang, Z.; Li, Y.; Liang, D. Design and experiment of sliding-cutting and anti-twining returning device for banana straw. Trans. Chin. Soc. Agric. Eng. 2018, 34, 26–34. [Google Scholar]
  22. Cheng, S.; Fan, X. Effects of nursey stock age on the timing of harvest, yield and fruit quality in banana. J. Fruit Sci. 2014, 31, 879–884. [Google Scholar]
  23. Robinson, J.C.; Zhuang, Y.; Wang, R. Effects of banana planting period, bud suction selection, planting density on yield and harvest period. Agron. Abroad Fruit Tree 1987, 2, 24–26. [Google Scholar]
  24. Hu, H.; Zhao, Q. Extraction optimization, stability and antioxidant activity of yellow pigment from the banana pulp of Xiangfen No.1. Food Sci. Technol. 2019, 44, 251–260. [Google Scholar]
  25. Yan, S.; Qi, C.; Wei, Y. Observation on the growth and growth period of banana test-tube seedlings after planting. Trop. Crop Res. 1997, 2, 21–24. [Google Scholar]
  26. Gao, G.; Yi, G.; Wei, Y. Banana cultivation and management technologies research. Chin. Agric. Sci. Bull. 2010, 26, 337–342. [Google Scholar]
  27. Yao, M.; Lai, C. Variety characteristics and planting prospects of red apple awn. Guangxi Trop. Agric. 2006, 5, 19. [Google Scholar]
  28. Li, E. Banana bunch thinning and strong fruit technology. China Trop. Agric. 2009, 2, 64. [Google Scholar] [CrossRef]
  29. Hu, H.; Xie, J. Color Illustration of Banana Cultivation with High Quality and High Yield; Guangdong Science Technology Press: Guangzhou, China, 2019; pp. 1–134. [Google Scholar]
  30. Li, W. Relationship between Soil Nutrients and Water Spatial and Temporal Variation and Growth and Yield of Banana. Master’s Thesis, Hainan University, Haikou, China, 2011. [Google Scholar]
  31. Li, S.; Liang, D.; Zhang, X.; Li, Y. Improved design of banana stalk fiber extraction blade. Food Mach. 2019, 35, 130–135. [Google Scholar]
  32. Mi, H.; Wei, Y.; Pan, S.; Li, Z. Research progress on resource utilization of banana stems and leaves. Guangxi Sci. 2018, 25, 279–289. [Google Scholar]
  33. Wei, S.; Duan, S.; Song, C.; Fu, Z.; Hu, R.; Shi, W.; Cheng, X.; Xiao, R.; Ling, P.; Tian, B. Moisture migration characteristics of tobacco leaves with stalks in different ways during curing. J. Northwest Univ. Nat. Sci. Ed. 2019, 47, 28–37. [Google Scholar]
  34. Gao, D.; Wang, D. Water loss of alfalfa stem affected by flattening coefficient. J. China Agric. Univ. 2016, 21, 89–95. [Google Scholar]
  35. Zhou, H. Study on Sensing Mechanism and In-Situ Detection of Plant Water Relations. Ph.D. Thesis, China Agricultural University, Beijing, China, 2018. [Google Scholar]
  36. Xu, S.; Tan, W.; Zhang, Y. Process of degumming by chemical for banana pseudo-stem fibers and characterization of degummed fibers. Trans. Chin. Soc. Agric. Eng. 2015, 31, 301–308. [Google Scholar]
  37. Wang, Q. Research on the Production of the Banana Stalk Biological Feed. Master’s Thesis, Hainan University, Haikou, China, 2013. [Google Scholar]
  38. Zheng, L.; Han, B.; Sheng, Z.; Chen, J.; Li, Y.; Zhao, L. Effect of pretreatment by steam explosion on degradation of the banana stalk component. Chin. J. Trop. Agric. 2014, 34, 84–88. [Google Scholar]
  39. Li, R. Method of shape feature extraction and recognition of packaging materials. Packag. Eng. 2020, 41, 209–213. [Google Scholar]
  40. Cheng, M.; Wang, J. Research on the in-site measurement of spur gears based on machine vision. J. Mach. Des. 2020, 37, 19–22. [Google Scholar]
  41. Ge, J. Analysis on the development trend of computer image processing technology. Comput. Prod. Circ. 2019, 5, 6. [Google Scholar]
  42. Zhang, H. Computer image processing technology and its application in agricultural engineering. Telecom World 2019, 26, 65–66. [Google Scholar]
  43. Duan, J.; Lu, H.; Wang, W.; Wang, L.; Zhao, L. Present situation and development of the fruit harvesting machinery. Guangdong Agric. Sci. 2012, 39, 189–192. [Google Scholar]
  44. Zhao, L.; Yang, H.; Xie, H.; Duan, J.; Jin, M.; Fu, H.; Guo, J.; Xu, Z.; Jiang, T.; Yang, Z. Effects of morphological and anatomical characteristics of banana crown vascular bundles on cutting mechanical properties using multiple imaging methods. Agronomy 2020, 10, 1199. [Google Scholar] [CrossRef]
Figure 1. The planting and growth of banana plants in a new banana orchard. (a) Planting of banana seedlings; (b) growing banana plants in an orchard.
Agriculture 11 00362 g001
Figure 2. Morphological characteristics of the aboveground parts of the banana plant.
Agriculture 11 00362 g002
Figure 3. Schematic diagram of measurement of the curvature of banana bunch stalk.
Agriculture 11 00362 g003
Figure 4. Schematic diagram of measuring the axial distance of banana hands.
Agriculture 11 00362 g004
Figure 5. Schematic diagram of measuring the circumferential angle of banana hands.
Agriculture 11 00362 g005
Figure 6. The relationship between the diameter of the bunch stalk and the internode positions.
Agriculture 11 00362 g006
Figure 7. The relationship between the thickness of bunch stalk rind and the internode positions.
Agriculture 11 00362 g007
Figure 8. The relationship between the curvature of the bunch stalk and the segments.
Agriculture 11 00362 g008
Figure 9. The relationship between the density of bunch stalks with a moisture content of 93% and the segments. (a) The relationship between the density of rind and the segments; (b) the relationship between the density of inner tissue and the segments.
Agriculture 11 00362 g009
Figure 10. The relationship between the density of bunch stalks with a moisture content of 84% and the segments. (a) The relationship between the density of rind and the segments; (b) the relationship between the density of inner tissue and the segments.
Agriculture 11 00362 g010
Figure 11. The relationship between the total density of bunch stalks and the segments.
Agriculture 11 00362 g011
Figure 12. The relationship between the moisture content of bunch stalks and the internode positions.
Agriculture 11 00362 g012
Figure 13. Macromorphology and microstructure of the bunch stalk.
Agriculture 11 00362 g013
Figure 14. The relationship between the diameter of the vascular bundle and the internode positions.
Agriculture 11 00362 g014
Figure 15. The relationship between the diameter of the vascular bundle and the number.
Agriculture 11 00362 g015
Figure 16. Measurement and statistical results of the weight of the banana bunch.
Agriculture 11 00362 g016
Figure 17. The relationship between the weight of banana hands and the node positions.
Agriculture 11 00362 g017
Figure 18. The relationship between the axial distance of banana hands and the internode positions.
Agriculture 11 00362 g018
Figure 19. Measurement results of the circumferential angle of banana hands.
Agriculture 11 00362 g019
Figure 20. The relationship between the circumferential angle of the banana hand and the node position.
Agriculture 11 00362 g020
Table 1. Table of regression coefficients of the diameter of bunch stalks.
ModelUnstandardized CoefficientsR2FSig. (Significance)Collinearity Statistics
BetaStandard ErrorToleranceVIF (Variance Inflation Factor)
(Constant)17.0904.4530.973385.9560.001
Variety−1.2760.3800.0021.0001.000
Moisture content0.1430.0490.0061.0001.000
Internode position3.7500.1110.0001.0001.000
Table 2. Table of regression coefficients of the thickness of bunch stalk rind.
ModelUnstandardized CoefficientsR2FSig.Collinearity Statistics
BetaStandard ErrorToleranceVIF
(Constant)−2.9050.5860.973241.1590.000
Variety−0.1220.0590.0511.0001.000
Moisture content0.0340.0070.0001.0001.000
Internode position0.4510.0170.0001.0001.000
Table 3. The density of Brazilian banana bunch stalks.
Segments93% Moisture Content84% Moisture ContentTotal Density (g/cm3)Node (Yes/No)?
Density-Rind (g/cm3)Density-Inner Tissue (g/cm3)Density-Rind (g/cm3)Density-Inner Tissue (g/cm3)
MeanSDMeanSDMeanSDMeanSDMeanSD
11.0710.450.7920.271.0450.330.7670.210.8850.05Yes
21.0350.230.7880.061.0070.150.7510.050.8910.02No
31.0840.550.9350.311.0520.410.9020.280.9460.03Yes
41.0790.510.8110.331.0460.460.7840.250.8730.03No
51.1650.361.1430.181.1310.221.1190.141.1510.07Yes
61.0960.541.0270.291.0640.380.9930.091.0460.05No
71.2430.291.2030.041.2170.151.1760.041.2250.01Yes
81.1790.441.1690.161.1430.321.1330.121.1730.03No
91.2870.571.2790.381.2560.411.2410.251.2810.08Yes
101.2430.191.1950.011.2110.061.1680.011.2260.06No
111.1990.480.9310.221.1620.270.9090.191.0060.05Yes
121.1480.530.8820.371.1180.420.8530.230.9980.07No
131.1530.250.9470.071.1210.180.9150.020.9650.01Yes
Table 4. Table of regression coefficients of the moisture content of bunch stalks.
ModelUnstandardized CoefficientsR2FSig.Collinearity Statistics
BetaStandard ErrorToleranceVIF
(Constant)104.4110.4240.9962927.3450.000
Variety−0.0220.1890.9091.0001.000
State−10.8320.1160.0001.0001.000
Internode position0.1650.0550.0051.0001.000
Table 5. Table of regression coefficients of the weight of banana hands.
ModelUnstandardized CoefficientsR2FSig.Collinearity Statistics
BetaStandard ErrorToleranceVIF
(Constant)1.3960.2290.970176.5890.000
Variety0.0240.1220.8501.0001.000
Node position0.5750.0310.0001.0001.000
Table 6. Table of regression coefficients of the axial distance of banana hands.
ModelUnstandardized CoefficientsR2FSig.Collinearity Statistics
BetaStandard ErrorToleranceVIF
(Constant)36.5805.7200.966128.9440.000
Variety0.6023.0360.8471.0001.000
Internode position14.2710.8890.0001.0001.000
Table 7. Table of regression coefficients of the circumferential angle of banana hands.
ModelUnstandardized CoefficientsR2FSig.Collinearity Statistics
BetaStandard ErrorToleranceVIF
(Constant)192.5714.0640.82425.7030.000
Variety−2.1432.1730.3451.0001.000
Node position−3.8570.5430.0001.0001.000
Publisher’s Note: MDPI stays neutral with regard to jurisdictional claims in published maps and institutional affiliations.

