
Modeling the Essential Oil and Trans-Anethole Yield of Fennel (Foeniculum vulgare Mill. var. vulgare) by Application Artificial Neural Network and Multiple Linear Regression Methods


 , ,
, ,  , and
, and 
Abstract
:1. Introduction
2. Materials and Methods
2.1. Plant Material Source and Recorded Traits
2.2. Isolation of Essential Oils and GC/MS Analysis
2.3. Data Processing and Statistical Analysis
2.3.1. Input Variables Selection
2.3.2. Multiple Linear Regression
2.3.3. Artificial Neural Network
2.4. Performance and Sensitivity Analysis
3. Results and Discussions
3.1. Selection of Input Variables
3.2. Prediction of Dependent Variables Using MLP/ANN Model
3.3. Comparing MLR and ANN Models to Predict EOY% and TAY% of Fennel Populations
3.4. Sensitivity Analysis
4. Conclusions
Author Contributions
Funding
Institutional Review Board Statement
Informed Consent Statement
Data Availability Statement
Acknowledgments
Conflicts of Interest
Abbreviations:
| ANN | Artificial neural network |
| EOY | Essential oil yield |
| FPH | Final plant height |
| HI | Harvest index |
| LFI | Length of the first internode |
| LLAI | Length of the last internode |
| LLOI | Length of the longest internode |
| LP | Length of the peduncle |
| MAE | Mean absolute error |
| MLR | Multilinear regression |
| NDF50% | Number of days to 50% flowering |
| NDF100% | Number of days to 100% flowering |
| NDG | Number of days to germination |
| NDM | Number of days to maturity |
| NI | Number of internodes |
| NS | Number of stems |
| NS/P | Number of seeds per plant |
| NS/U | Number of seeds per umbel |
| NU | Number of umbels |
| RMSE | Root mean square error |
| SD | Stem diameter |
| SWR | Stepwise regression |
| SY | Seed yield |
| SY/m2 | Seed yield per square meter |
| SY/P | Seed yield per plant |
| TAY | Trans-anethole yield |
| TSW | 1000-seed weight |
References
- Nojadeh, M.S.; Pouresmaeil, M.; Younessi-Hamzekhanlu, M.; Venditti, A. Phytochemical profile of fennel essential oils and possible applications for natural antioxidant and controlling Convolvulus arvensis L. Nat. Prod. Res. 2020, 1–5. [Google Scholar] [CrossRef]
- Yaylayan, V.A. Flavor Technology: Recent Trends and Future Perspectives. Can. Inst. Food Sci. Technol. J. 1991, 24, 2–5. [Google Scholar] [CrossRef]
- Guillén, M.D.; Manzanos, M.J. A study of several parts of the plant Foeniculum vulgate as a source of compounds with industrial interest. Food Res. Int. 1996, 29, 85–88. [Google Scholar] [CrossRef]
- He, W.; Huang, B. A review of chemistry and bioactivities of a medicinal spice: Foeniculum vulgare. J. Med. Plants Res. 2011, 5, 3595–3600. [Google Scholar]
- Younessi-Hamzekhanlu, M.; Abdipour, M.; Dejahang, A.; Sabzi-Nojadeh, M.; Amani, M. Herbals Used in Western Iran as Food and for Health Treatments. In Biodiversity, Conservation and Sustainability in Asia; Springer: Cham, Switzerland, 2021; pp. 547–599. [Google Scholar]
- Younessi-Hamzekhanlu, M.; Ozturk, M.; Altay, V.; Nojadeh, M.S.; Alakbarli, F. Ethnopharmacological study of medicinal plants from khoy city of west Azerbaijan-Iran. Indian J. Tradit. Knowl. 2020, 19, 251–267. [Google Scholar]
- Pouresmaeil, M.; Nojadeh, M.S.; Movafeghi, A.; Maggi, F. Exploring the bio-control efficacy of Artemisia fragrans essential oil on the perennial weed Convolvulus arvensis: Inhibitory effects on the photosynthetic machinery and induction of oxidative stress. Ind. Crops Prod. 2020, 155, 112785. [Google Scholar] [CrossRef]
- Aghbashd, B.N.; Pouresmaeil, M.; Dehghan, G.; Nojadeh, M.S.; Mobaiyen, H.; Maggi, F. Chemical Composition, Antibacterial and Radical Scavenging Activity of Essential Oils from Satureja macrantha C.A.Mey. At different growth stages. Foods 2020, 9, 494. [Google Scholar] [CrossRef] [Green Version]
- Aghbash, B.N.; Dehghan, G.; Movafeghi, A.; Talebpour, A.H.; Pouresmaeil, M.; Maggi, F.; Nojadeh, M.S. Chemical compositions and biological activity of essential oils from four populations of Satureja macrantha C.A.Mey. J. Essent. Oil Res. 2021, 33, 133–142. [Google Scholar] [CrossRef]
- Younessi-Hamzekhanlu, M.; Sanjari, S.; Dejahang, A.; Karkaj, E.S.; Nojadeh, M.S.; Gönenç, T.M.; Ozturk, M. Evaluation of Essential Oil From Different Artemisia fragrans Willd. Populations: Chemical Composition, Antioxidant, and Antibacterial Activity. J. Essent. Oil-Bear. Plants 2020, 23, 1218–1236. [Google Scholar] [CrossRef]
- Bahmani, K.; Darbandi, A.I.; Ramshini, H.A.; Moradi, N.; Akbari, A. Agro-morphological and phytochemical diversity of various Iranian fennel landraces. Ind. Crops Prod. 2015, 77, 282–294. [Google Scholar] [CrossRef]
- Devesh, P.; Moitra, P.K.; Shukla, R.S. Correlation and path coefficient analysis for yield, yield components and quality traits in wheat. Electron. J. Plant. Breed. 2021, 12, 388–395. [Google Scholar] [CrossRef]
- Togay, N.; Togay, Y.; Dogan, Y. Correlation and path coefficient analysis for yield and some yield components of wheat (Triticum aestivum l.). Oxid. Commun. 2017, 40, 946–951. [Google Scholar]
- Piccaglia, R.; Marotti, M. Characterization of some Italian types of wild fennel (Foeniculum vulgare mill.). J. Agric. Food Chem. 2001, 49, 239–244. [Google Scholar] [CrossRef] [PubMed]
- Coşge, B.; Ipek, A.; Gürbüz, B. Some phenotypic selection criteria to improve seed yield and essential oil percentage of sweet fennel (Foeniculum vulgare Mill. var. dulce). Tarim. Bilim. Derg. 2009, 15, 127–133. [Google Scholar] [CrossRef] [Green Version]
- Coruzzi, G.M.; Burga, A.R.; Katari, M.S.; Gutiérrez, R.A. Systems Biology: Principles and Applications in Plant Research. In Annual Plant Reviews Online; Wiley-Blackwell: London, UK, 2018; pp. 3–40. [Google Scholar]
- Gago, J.; Martínez-Núñez, L.; Landín, M.; Gallego, P.P. Artificial neural networks as an alternative to the traditional statistical methodology in plant research. J. Plant. Physiol. 2010, 167, 23–27. [Google Scholar] [CrossRef] [PubMed]
- Prasad, V.S.S.; Gupta, S.D. Applications And Potentials Of Artificial Neural Networks In Plant Tissue Culture. In Plan Tissue Culture Engineering; Springer: Dordrecht, The Netherlands, 2007; pp. 47–67. [Google Scholar]
- Gross, M.; Lewinsohn, E.; Tadmor, Y.; Bar, E.; Dudai, N.; Cohen, Y.; Friedman, J. The inheritance of volatile phenylpropenes in bitter fennel (Foeniculum vulgare Mill. var. vulgare, Apiaceae) chemotypes and their distribution within the plant. Biochem. Syst. Ecol. 2009, 37, 308–316. [Google Scholar] [CrossRef]
- Kiruthika, S.; Narayanan, S.L.; Parameshwari, C.; Arunachalam, P.; Mini, M.L. Studies on trait association and path co-efficient analysis of sesame (Sesamum sp.) for quantitative traits and oil quality parameters. Electron. J. Plant. Breed. 2020, 11, 18–24. [Google Scholar] [CrossRef] [Green Version]
- Ibhrahim, E.; Khidir, O. Genotypic correlation and path coefficient analysis of yield and some yield components in sesame (Sesamum indicum L.). Int. J. AgriScience 2012, 2, 664–670. [Google Scholar]
- Bahmani, K.; Izadi-Darbandi, A.; Noori, S.A.S.; Jafari, A.A.; Moradi, N. Determination of interrelationships among phenotypic traits of iranian fennel (foeniculum vulgare mill.) using correlation, stepwise regression and path analyses. J. Essent. Oil-Bear. Plants 2012, 15, 424–444. [Google Scholar] [CrossRef]
- Khairunniza Bejo, S.; Mustaffha, S.; Khairunniza-Bejo, S.; Ishak, W.; Ismail, W. Application of Artificial Neural Network in Predicting Crop Yield: A Review. J. Food Sci. Eng. 2014, 4, 1–9. [Google Scholar]
- Abdipour, M.; Ramazani, S.H.R.; Younessi-Hmazekhanlu, M.; Niazian, M. Modeling Oil Content of Sesame (Sesamum indicum L.) Using Artificial Neural Network and Multiple Linear Regression Approaches. JAOCS J. Am. Oil Chem. Soc. 2018, 95, 283–297. [Google Scholar] [CrossRef]
- Niazian, M.; Sadat-Noori, S.A.; Abdipour, M. Modeling the seed yield of Ajowan (Trachyspermum ammi L.) using artificial neural network and multiple linear regression models. Ind. Crops Prod. 2018, 117, 224–234. [Google Scholar] [CrossRef]
- Iquebal, M.A.; Ansari, M.S.; Sarika, S.; Dixit, S.P.; Verma, N.K.; Aggarwal, R.A.K.; Jayakumar, S.; Rai, A.; Kumar, D. Locus minimization in breed prediction using artificial neural network approach. Anim. Genet. 2014, 45, 898–902. [Google Scholar] [CrossRef]
- Khoshnevisan, B.; Rafiee, S.; Mousazadeh, H. Application of multi-layer adaptive neuro-fuzzy inference system for estimation of greenhouse strawberry yield. Meas. J. Int. Meas. Confed. 2014, 47, 903–910. [Google Scholar] [CrossRef]
- Silva, G.N.; Tomaz, R.S.; de Castro Sant’Anna, I.; Nascimento, M.; Bhering, L.L.; Cruz, C.D. Neural networks for predicting breeding values and genetic gains. Sci. Agric. 2014, 71, 494–498. [Google Scholar] [CrossRef] [Green Version]
- Goel, P.; Bapat, S.; Vyas, R.; Tambe, A.; Tambe, S.S. Genetic programming based quantitative structure-retention relationships for the prediction of Kovats retention indices. J. Chromatogr. A 2015, 1420, 98–109. [Google Scholar] [CrossRef]
- Zeng, W.; Xu, C.; Wu, J.; Huang, J. Sunflower seed yield estimation under the interaction of soil salinity and nitrogen application. Field Crops Res. 2016, 198, 1–15. [Google Scholar] [CrossRef]
- Niazian, M.; Niedbała, G. Machine learning for plant breeding and biotechnology. Agriculture 2020, 10, 436. [Google Scholar] [CrossRef]
- Mansouri, A.; Fadavi, A.; Mortazavian, S.M.M. An artificial intelligence approach for modeling volume and fresh weight of callus-A case study of cumin (Cuminum cyminum L.). J. Theor. Biol. 2016, 397, 199–205. [Google Scholar] [CrossRef]
- Niazian, M.; Sadat-Noori, S.A.; Abdipour, M. Artificial neural network and multiple regression analysis models to predict essential oil content of ajowan (Carum copticum L.). J. Appl. Res. Med. Aromat. Plants 2018, 9, 124–131. [Google Scholar] [CrossRef]
- Tanty, R.; Tanweer, S. Desmukh Application of Artificial Neural Network in Hydrology-A Review. Int. J. Eng. Res. 2015, 4, 184–188. [Google Scholar] [CrossRef]
- Emamgholizadeh, S.; Parsaeian, M.; Baradaran, M. Seed yield prediction of sesame using artificial neural network. Eur. J. Agron. 2015, 68, 89–96. [Google Scholar] [CrossRef]
- Naroui Rad, M.R.; Koohkan, S.; Fanaei, H.R.; Rad, M.R.P. Application of artificial neural networks to predict the final fruit weight and random forest to select important variables in native population of melon (Cucumis melo. Pahlavan). Sci. Hortic. 2015, 181, 108–112. [Google Scholar] [CrossRef]
- Safa, M.; Samarasinghe, S.; Nejat, M. Prediction of wheat production using artificial neural networks and investigating indirect factors affecting it: Case study in canterbury province, New Zealand. J. Agric. Sci. Technol. 2015, 17, 791–803. [Google Scholar]
- Hara, P.; Piekutowska, M.; Niedbała, G. Selection of independent variables for crop yield prediction using artificial neural network models with remote sensing data. Land 2021, 10, 609. [Google Scholar] [CrossRef]
- Niedbała, G.; Piekutowska, M.; Weres, J.; Korzeniewicz, R.; Witaszek, K.; Adamski, M.; Pilarski, K.; Czechowska-Kosacka, A.; Krysztofiak-Kaniewska, A. Application of artificial neural networks for yield modeling of winter rapeseed based on combined quantitative and qualitative data. Agronomy 2019, 9, 781. [Google Scholar] [CrossRef] [Green Version]
- White, B.W.; Rosenblatt, F. Principles of Neurodynamics: Perceptrons and the Theory of Brain Mechanisms. Am. J. Psychol. 1963, 76, 705. [Google Scholar] [CrossRef] [Green Version]
- Rahimmalek, M.; Maghsoudi, H.; Sabzalian, M.R.; Pirbalouti, A.G. Variability of essential oil content and composition of different Iranian fennel (Foeniculum vulgare Mill.) accessions in relation to some morphological and climatic factors. J. Agric. Sci. Technol. 2014, 16, 1365–1374. [Google Scholar]
- Li, C.C. The Concept of Path Coefficient and Its Impact on Population Genetics. Biometrics 1956, 12, 190. [Google Scholar] [CrossRef]
- Samarasinghe, S. Neural Networks for Nonlinear Pattern Recognition. In Neural Networks for Applied Sciences and Engineering; Auerbach: New York, NY, USA, 2006; pp. 69–112. [Google Scholar]
- Sefidan, A.Y.; Valizadeh, M.; Aharizad, S.; Sabzi, M. Path analysis of grain yield, some morphological traits and essential oil content in different fennel (Foeniculum vulgare Mill.) populations. J. Biodivers. Environ. Sci. 2014, 4, 10–15. [Google Scholar]
- Kalleli, F.; Rebey, I.B.; Razgallah, N.; Tounsi, M.S.; M’Hamdi, M. Comparative Analysis of Morphological and Chemical Variability in Different Fennel (Foeniculum Vulgare Mill.) Cultivars. Int. J. Agric. Environ. Biores. 2019, 4, 200–217. [Google Scholar]
- Baziar, M.H.; Ghorbani, A. Evaluation of lateral spreading using artificial neural networks. Soil. Dyn. Earthq. Eng. 2005, 25, 1–9. [Google Scholar] [CrossRef]
- Moradi, H.; Bahmanyar, H.; Azizpour, H.; Rezamandi, N.; Mirdehghan Ashkezari, S.M. Modeling and Optimization of Anethole Ultrasound-Assisted Extraction from Fennel Seeds using Artificial Neural Network. J. Chem. Pet. Eng. 2020, 54, 143–153. [Google Scholar]
- Stangierski, J.; Weiss, D.; Kaczmarek, A. Multiple regression models and Artificial Neural Network (ANN) as prediction tools of changes in overall quality during the storage of spreadable processed Gouda cheese. Eur. Food Res. Technol. 2019, 245, 2539–2547. [Google Scholar] [CrossRef] [Green Version]
- Moghaddam, M.; Miran, S.N.K.; Pirbalouti, A.G.; Mehdizadeh, L.; Ghaderi, Y. Variation in essential oil composition and antioxidant activity of cumin (Cuminum cyminum L.) fruits during stages of maturity. Ind. Crops Prod. 2015, 70, 163–169. [Google Scholar] [CrossRef]
- Moghaddam, M.; Omidbiagi, R.; Sefidkon, F. Changes in content and chemical composition of tagetes minuta oil at various harvest times. J. Essent. Oil Res. 2007, 19, 18–20. [Google Scholar] [CrossRef]
- Moghaddam, M.; Pirbalouti, A.G.; Mehdizadeh, L.; Pirmoradi, M.R. Changes in composition and essential oil yield of Ocimum ciliatum at different phenological stages. Eur. Food Res. Technol. 2015, 240, 199–204. [Google Scholar] [CrossRef]
- Sellami, I.H.; Maamouri, E.; Chahed, T.; Wannes, W.A.; Kchouk, M.E.; Marzouk, B. Effect of growth stage on the content and composition of the essential oil and phenolic fraction of sweet marjoram (Origanum majorana L.). Ind. Crops Prod. 2009, 30, 395–402. [Google Scholar] [CrossRef]


| No | Population | Variety | Locality | Voucher Number | Latitude (N) | Longitude (E) | Essential Oil Yield (%) | trans-Anethole Yield (%) |
|---|---|---|---|---|---|---|---|---|
| 1 | Salzland | Vulgare | Germany | Ah123 | 51°78′ | 11°77′ | 2.29 ± 0.85 | 1.46 ± 0.59 |
| 2 | Gotha | Vulgare | Germany | Ah115 | 51°07′ | 10°87′ | 2.14 ± 0.73 | 1.77 ± 0.57 |
| 3 | Gazianetp | Vulgare | Turkey | Ah114 | 37°05′ | 37°37′ | 2.67 ± 0.79 | 2.30 ± 0.68 |
| 4 | Izmir | Vulgare | Turkey | Ah113 | 38°35′ | 27°07′ | 1.63 ± 0.41 | 1.17 ± 0.32 |
| 5 | Bonab | Vulgare | Iran | Ah111 | 37°35′ | 46°03′ | 2.89 ± 1.03 | 2.24 ± 0.91 |
| 6 | Birjand | Vulgare | Iran | Ah110 | 32°84′ | 59°18′ | 0.73 ± 0.24 | 0.54 ± 0.16 |
| 7 | Tatmaj | Vulgare | Iran | Ah126 | 33°69′ | 51°62′ | 1.88 ± 0.79 | 1.50 ± 0.54 |
| 8 | Torbatejam | Vulgare | Iran | Ah127 | 35°23′ | 60°66′ | 2.90 ± 0.92 | 2.45 ± 0.76 |
| 9 | Meshkinshahr | Vulgare | Iran | Ah120 | 38°37′ | 47°69′ | 2.30 ± 0.61 | 1.70 ± 0.62 |
| 10 | Khorobiabanak | Vulgare | Iran | Ah118 | 33°89′ | 54°87′ | 0.99 ± 0.41 | 0.73 ± 0.51 |
| 11 | Moghan | Vulgare | Iran | Ah121 | 39°62′ | 47°87′ | 4.12 ± 1.32 | 2.68 ± 0.68 |
| 12 | Ziar | Vulgare | Iran | Ah129 | 32°50′ | 51°94′ | 1.66 ± 0.69 | 1.14 ± 0.42 |
| 13 | Shirvan | Vulgare | Iran | Ah124 | 37°39′ | 57°96′ | 2.42 ± 0.86 | 1.77 ± 0.68 |
| 14 | Karaj | Vulgare | Iran | Ah116 | 35°77′ | 51°06′ | 1.54 ± 0.64 | 1.07 ± 0.44 |
| 15 | Kerman | Vulgare | Iran | Ah117 | 30°30′ | 57°13′ | 0.82 ± 0.33 | 0.55 ± 0.19 |
| 16 | Khorramabad | Vulgare | Iran | Ah119 | 33°48′ | 48°44′ | 2.89 ± 0.67 | 2.10 ± 0.71 |
| 17 | Neishabour | Vulgare | Iran | Ah122 | 36°19′ | 58°83′ | 2.02 ± 0.77 | 0.33 ± 0.15 |
| 18 | Varamin | Vulgare | Iran | Ah128 | 35°34′ | 51°62′ | 3.77 ± 0.94 | 3.12 ± 0.67 |
| 19 | Hamedan | Vulgare | Iran | Ah112 | 34°81′ | 48°48′ | 2.92 ± 0.91 | 2.16 ± 0.56 |
| 20 | Tabriz | Vulgare | Iran | Ah125 | 38°07′ | 46°08′ | 2.50 ± 0.76 | 0.50 ± 0.12 |
| Characteristic | Abbreviation | Min | Max | Mean | Standard Deviation |
|---|---|---|---|---|---|
| Number of days to germination | NDG | 7 | 18 | 12.45 | 4.21 |
| Number of days to 50% flowering | NDF50% | 59 | 102 | 79.18 | 16.56 |
| Number of days to 100% flowering | NDF100% | 82 | 114 | 92.36 | 24.98 |
| Number of days to maturity | NDM | 126 | 180 | 145.68 | 36.15 |
| Initial plant height (cm) | IPH | 39.47 | 82.89 | 58.29 | 17.14 |
| Final plant height (cm) | FPH | 68.56 | 198 | 107.25 | 36.84 |
| Number of stems | NS | 1 | 4 | 2.58 | 1.25 |
| Stem diameter (cm) | SD | 2.75 | 15.85 | 8.54 | 3.62 |
| Number of internodes | NI | 6 | 14 | 9.35 | 3.48 |
| Length of the first internode (cm) | LFI | 3.11 | 9.32 | 6.13 | 2.04 |
| Length of the longest internode (cm) | LLOI | 5.48 | 19.14 | 14.59 | 5.74 |
| Length of the last internode (cm) | LLAI | 2.36 | 11.71 | 7.64 | 1.91 |
| Length of the peduncle (cm) | LP | 4.85 | 14.29 | 9.25 | 4.89 |
| Number of umbels | NU | 12 | 58 | 36.25 | 15.70 |
| Biomass (g/m2) | B/m2 | 654.25 | 1457.83 | 124.91 | 62.25 |
| Thousand seed weight (g) | TSW | 2.85 | 7.65 | 5.16 | 3.11 |
| Seed yield per plant (g) | SY/P | 12.35 | 86.54 | 32.67 | 10.29 |
| Seed yield (g/m2) | SY/m2 | 115.12 | 542.28 | 315.21 | 82.27 |
| Number of seeds per plant | NS/P | 985 | 9153 | 7859 | 2141 |
| Number of seeds per umbel | NS/U | 112 | 276 | 192.51 | 78.29 |
| Harvest index (%) | HI | 12.11 | 46.82 | 37.26 | 16.28 |
| Step | Entered Variables in Model | Partial R2 | Model R2 |
|---|---|---|---|
| 1 | SY/m2 | 0.1642 | 0.1642 |
| 2 | SY/m2, NDF 50% | 0.1415 | 0.3057 |
| 3 | SY/m2, NDF 50%, NS/P | 0.1276 | 0.4333 |
| 4 | SY/m2, NDF 50%, NS/P, NU | 0.0781 | 0.5114 |
| 5 | SY/m2, NDF 50%, NS/P, NU, FPH | 0.0742 | 0.5856 |
| Step | Entered Variables in Model | Partial R2 | Model R2 |
|---|---|---|---|
| 1 | SY/m2 | 0.123 | 0.123 |
| 2 | SY/m2, NS/U | 0.114 | 0.237 |
| 3 | SY/m2, NS/U, NDM | 0.1056 | 0.3426 |
| 4 | SY/m2, NS/U, NDM, TSW | 0.0561 | 0.3987 |
| 5 | SY/m2, NS/U, NDM, TSW, NU | 0.052 | 0.4507 |
| 6 | SY/m2, NS/U, NDM, TSW, NU, NI | 0.0441 | 0.4948 |
| ANN Method | Number of Hidden Layers | Number of Neurons in Each Hidden Layer | Transfer Function | Learning Algorithm | Number of Epochs |
|---|---|---|---|---|---|
| Multi-layer perceptron (MLP) | 1–5 | 1–20 | Sigmoid Axon | Levenberg– | 50–2000 |
| Linear Sigmoid Axon | Marquardt | ||||
| TanhAxon | Momentum | ||||
| Liner TanhAxon | Conjugate Gradient |
| Output | Network Structure | Transfer Function | Learning Algorithm | Training | Testing | Cross Validation | ||||||
|---|---|---|---|---|---|---|---|---|---|---|---|---|
| R2 a | RMSE b | MAE c | R2 a | RMSE b | MAE c | R2 a | RMSE b | MAE c | ||||
| Essential oil yield | 11-9-7-1 | Sigmoid Axon | Levenberg–Marquardt (LM) | 0.953 | 0.522 | 0.375 | 0.929 | 0.544 | 0.385 | 0.904 | 0.552 | 0.389 |
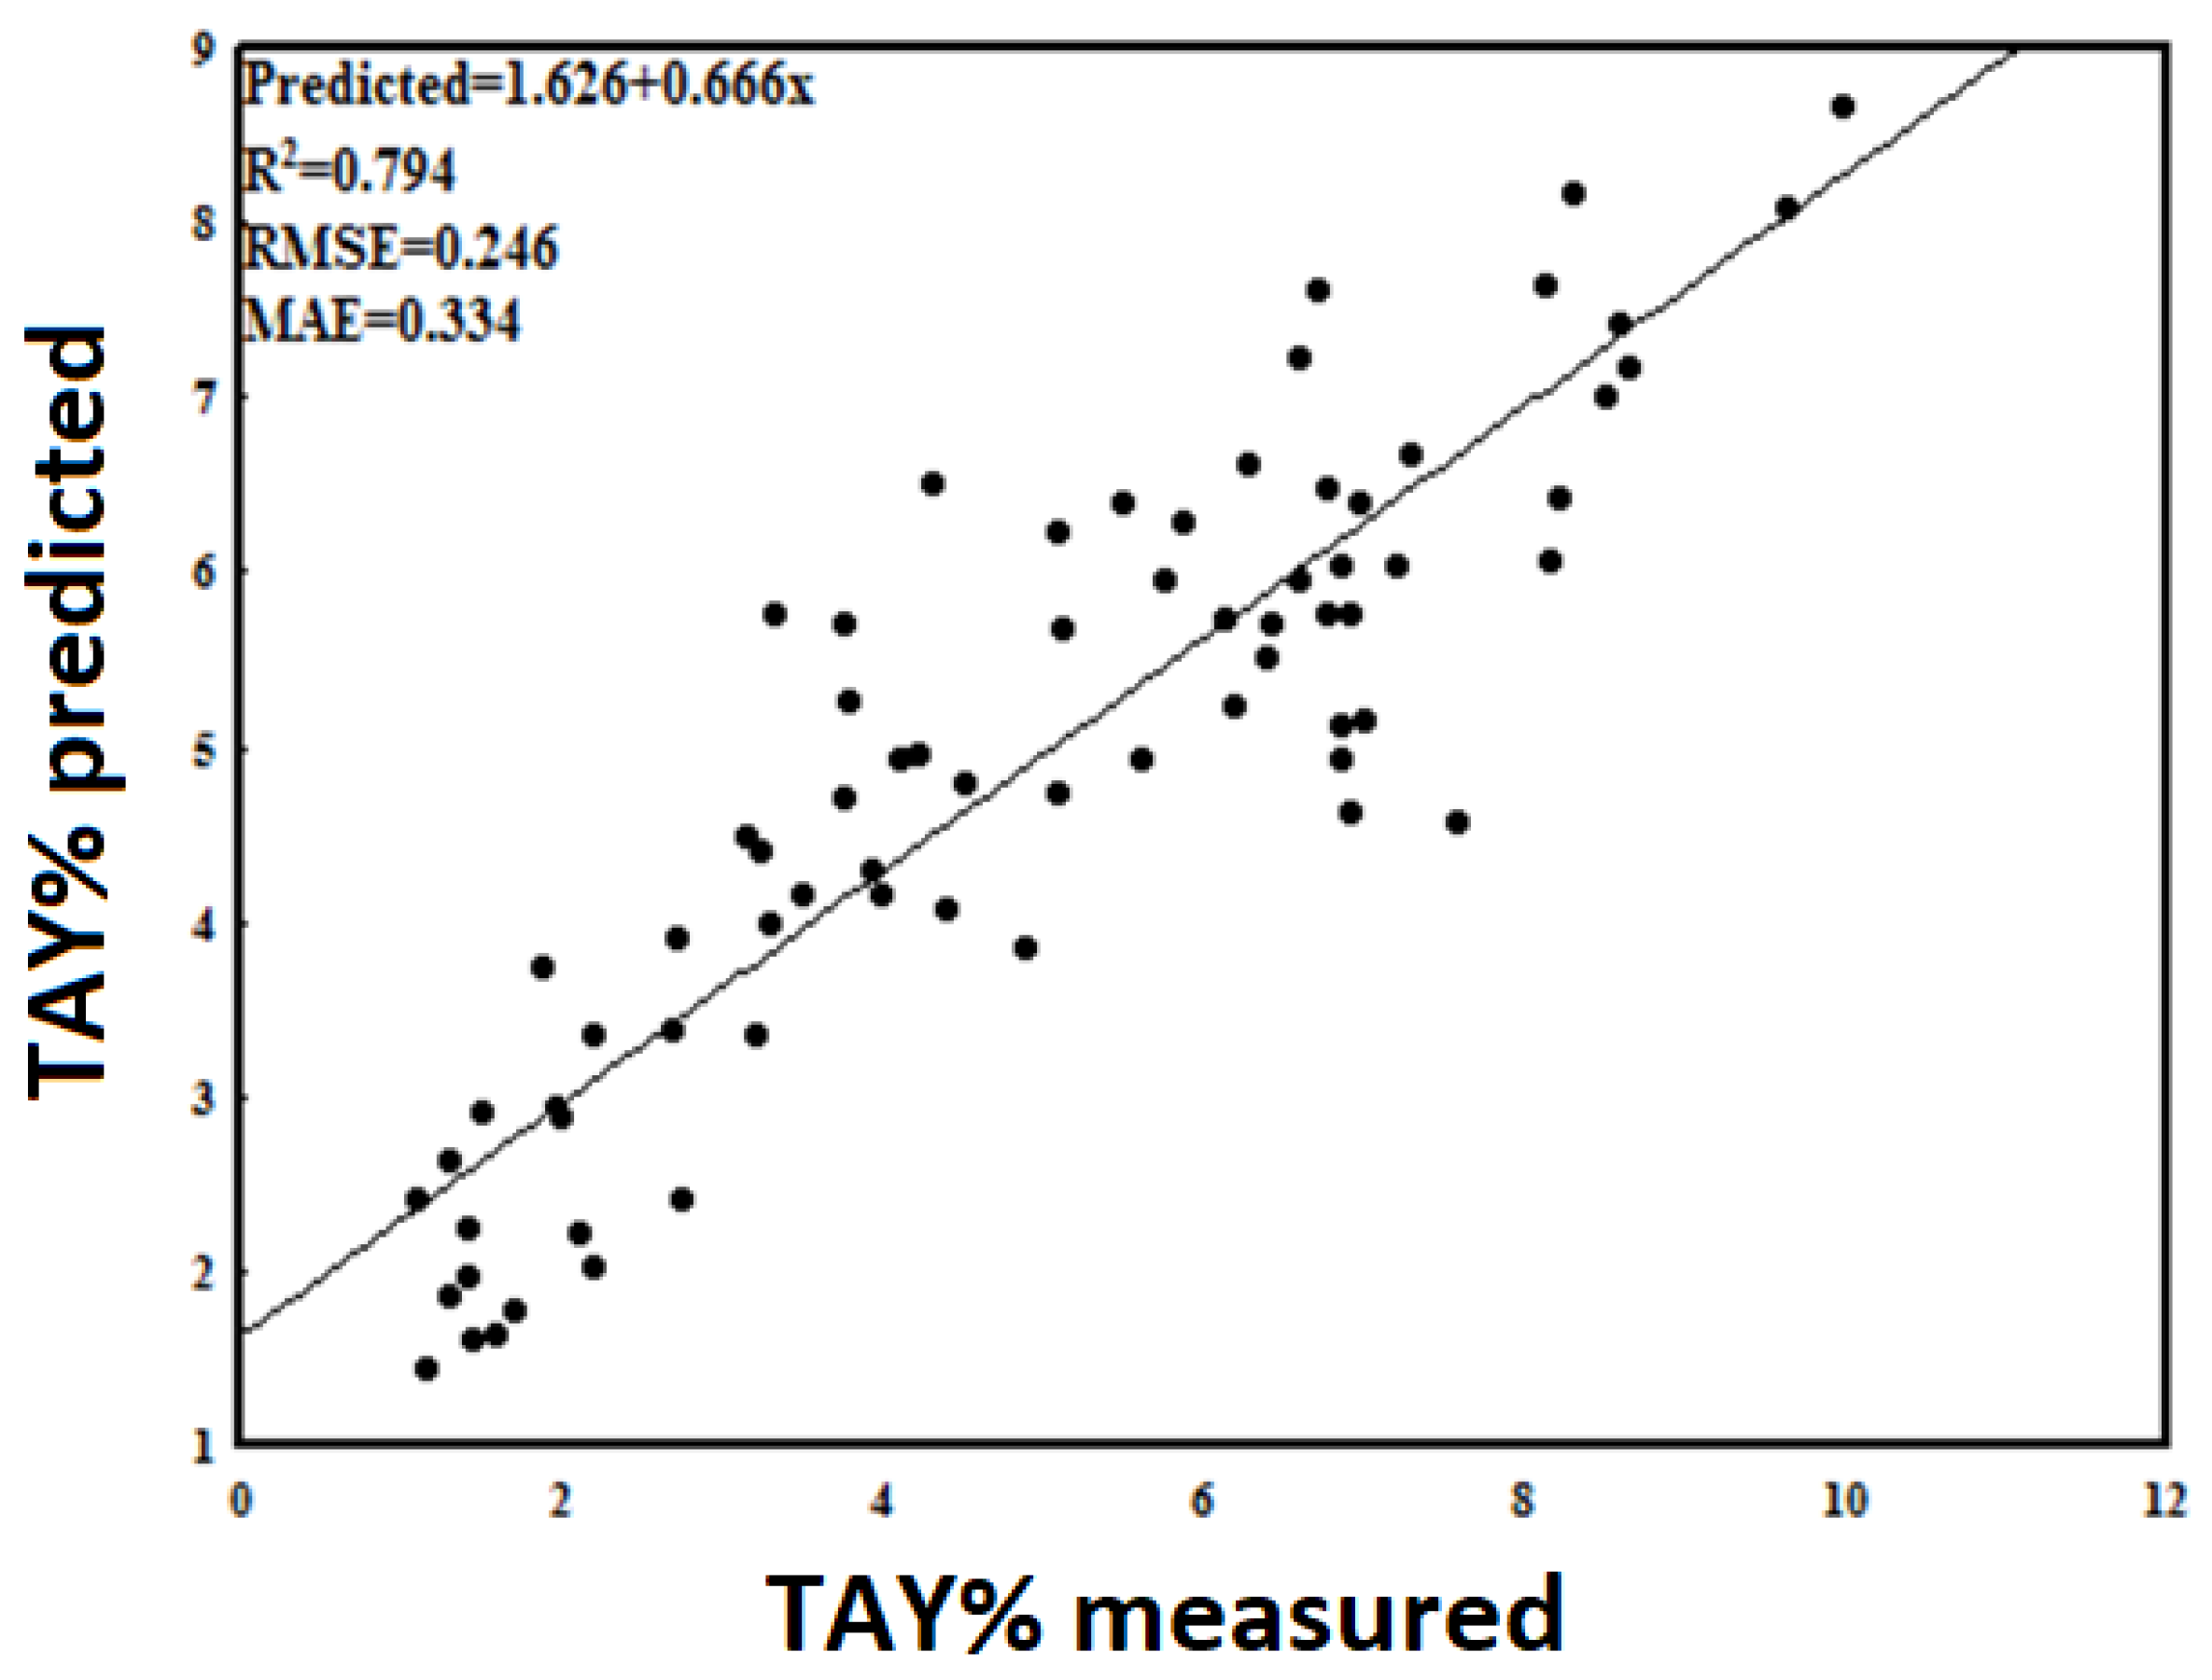
| Trans-anethole yield | 11-10-1 | TanhAxon | Momentum | 0.794 | 0.246 | 0.334 | 0.777 | 0.264 | 0.352 | 0.764 | 0.258 | 0.359 |
| Output | Method | ANN | MLR | ||||
|---|---|---|---|---|---|---|---|
| R2 a (%) | RMSE b | MAE c | R2 a (%) | RMSE b | MAE c | ||
| Essential oil yield | The best ANN (with all input) | 95.30 | 0.522 | 0.375 | 55.33 | 0.819 | 0.624 |
| ANN without SY/m2 | 75.45 | 0.608 | 0.439 | 39.12 | 0.911 | 0.659 | |
| ANN without NDF50% | 84.70 | 0.585 | 0.421 | 42.18 | 0.747 | 0.571 | |
| ANN without NS/P | 85.98 | 0.578 | 0.416 | 44.25 | 0.812 | 0.583 | |
| trans-anethole yield | The best ANN (with all input) | 79.41 | 0.246 | 0.334 | 46.72 | 0.448 | 0.452 |
| ANN without SY/m2 | 61.43 | 0.332 | 0.487 | 35.52 | 0.532 | 0.471 | |
| ANN without NS/U | 66.40 | 0.316 | 0.459 | 37.14 | 0.431 | 0.384 | |
| ANN without NDM | 68.40 | 0.308 | 0.445 | 38.76 | 0.416 | 0.335 | |
Publisher’s Note: MDPI stays neutral with regard to jurisdictional claims in published maps and institutional affiliations. |
© 2021 by the authors. Licensee MDPI, Basel, Switzerland. This article is an open access article distributed under the terms and conditions of the Creative Commons Attribution (CC BY) license (https://creativecommons.org/licenses/by/4.0/).
Share and Cite
Sabzi-Nojadeh, M.; Niedbała, G.; Younessi-Hamzekhanlu, M.; Aharizad, S.; Esmaeilpour, M.; Abdipour, M.; Kujawa, S.; Niazian, M. Modeling the Essential Oil and Trans-Anethole Yield of Fennel (Foeniculum vulgare Mill. var. vulgare) by Application Artificial Neural Network and Multiple Linear Regression Methods. Agriculture 2021, 11, 1191. https://doi.org/10.3390/agriculture11121191
Sabzi-Nojadeh M, Niedbała G, Younessi-Hamzekhanlu M, Aharizad S, Esmaeilpour M, Abdipour M, Kujawa S, Niazian M. Modeling the Essential Oil and Trans-Anethole Yield of Fennel (Foeniculum vulgare Mill. var. vulgare) by Application Artificial Neural Network and Multiple Linear Regression Methods. Agriculture. 2021; 11(12):1191. https://doi.org/10.3390/agriculture11121191
Chicago/Turabian StyleSabzi-Nojadeh, Mohsen, Gniewko Niedbała, Mehdi Younessi-Hamzekhanlu, Saeid Aharizad, Mohammad Esmaeilpour, Moslem Abdipour, Sebastian Kujawa, and Mohsen Niazian. 2021. "Modeling the Essential Oil and Trans-Anethole Yield of Fennel (Foeniculum vulgare Mill. var. vulgare) by Application Artificial Neural Network and Multiple Linear Regression Methods" Agriculture 11, no. 12: 1191. https://doi.org/10.3390/agriculture11121191