Review

A Review of Methods and Techniques for Detecting Frost on Plant Surfaces

1
Agricultural Engineering Institute, Jiangsu University, Zhenjiang 212013, China
2
College of Biology and the Environment, Nanjing Forestry University, Nanjing 210037, China
*
Author to whom correspondence should be addressed.
Agriculture 2021, 11(11), 1142; https://doi.org/10.3390/agriculture11111142
Submission received: 7 October 2021 / Revised: 9 November 2021 / Accepted: 10 November 2021 / Published: 15 November 2021
(This article belongs to the Special Issue Sensors Applied to Agricultural Products)

Abstract

:
Severe frost usually has adverse impacts on agricultural production, resulting in crop freeze injury, poor crop yield, and crop quality reduction. Timely and accurate detection of frost plays an important role in cold damage warnings, prevention, and control. Current frost detection methods mostly use physical properties such as light, electricity, and heat, or the judge and quantify using environmental factors such as temperature and wind speed. However, it is difficult to detect and accurately identify the frosting phenomenon in real time during field trials because of the complex environment, different plant types, and interference by many factors during observation. To provide an overview of the analytical tools for scientists, researchers, and product developers, a review and comparative analysis of the available literature on frost mechanisms, correlations, and characteristics are presented in this study. First, the mechanisms of the frost formation process, frost level, and the significance of detection, are introduced. Then, the methods and techniques used to measure frost on plant surfaces are synthetically classified and further compared. Moreover, the key points and difficulties are summarized and discussed. Finally, some constructive methods of frost detection are proposed to improve the frost detection process.

1. Introduction

Frost generally forms and develops under cold and wet conditions [1]. It is common in industrial refrigeration equipment [2,3,4] and occurs frequently in crop fields from autumn to winter, and sometimes even during the early spring, across temperate regions [5,6]. Frosts have been defined as either advection frost or radiation frost. Advection frosts frequently happen in cold and windy weather, which is associated with large-scale and strong, cold air with temperatures below 0 °C. Radiation frosts are caused by radiant energy loss from the atmosphere, soil, and plant ecosystems on clear, no-wind nights. Late frosts in early spring tend to be radiation frost [7,8].
Frost refers to the white ice crystals that condensate on the ground or objects when the air temperature near the earth’s surface drops below the frost point (the dew point is lower than 0 °C) under the influence of ground radiation cooling [9]. Frost is a weather phenomenon in which wet air is exposed to a cold surface at a temperature below its dew point and below the triple point of water; the water vapor in the air condenses on the cold surface and eventually forms frost [10].
Much research has been conducted to investigate the process of frost formation. Tao et al. [11] and Hayashi et al. [12] divided the process into three periods: the early stage, the crystal growth period, and the fully grown period. Frost crystals exhibit diverse characteristics at different growth periods during this process. Zhang et al. [13] found that the type of frost crystals can change from feathery to needle-like, flaky, or even irregularly shaped crystals. Different crystal shapes result in frost layers with different surface properties, such as different densities, roughness, thickness, and thermal properties [14].
People usually see frost on plant surfaces at night when it is mainly a desublimation phenomenon. The meteorological factors of frost formation are a complex process that slowly changes due to various factors such as heat radiation from ground objects or cooling caused by cold air currents, water vapor pressure, wind speed, and cloud cover [15,16]. The main factors affecting plant surface frosting also include plant body temperature, which is decreased due to heat radiation, and environmental factors such as frost-related water vapor pressure. Frost damage is a freezing injury that occurs at the same time as frost. Frost damage to crops is not only related to the frost itself, but also related to the freezing tolerance of various crops [17]. Different varieties of a plant can have different freezing tolerances at different developmental stages.
There are two different views on the effect of frost on plant leaf surfaces. In 1951, Suzuki [18] believed that frost could increase leaf temperature and thus inhibit radiation cooling, making it beneficial to protect plants from frost damage. Contrary to this, some authors believe that even if condensation or frost can temporarily increase leaf temperature, it is still very weak compared to the surrounding air. Therefore, frost will inevitably have adverse effects on plants. In nature, frost can be divided into two categories. The frost damage caused by invisible frost is called “black frost”, and the frost damage caused by the frost is called “hoar frost”. “Hoar frost” refers to the ice crystals formed when water vapor near the ground is saturated, causing humidity. “Black frost” is not only invisible frost but can also cause serious frost injury without white frost. If the temperature on the ground or plant surface has dropped to 0 °C and the air near the ground is not humid enough to form white frost crystals, black frost will appear [7].
Precisely, what harms plants is “freeze”, not “frost”, because “black frost” does not release latent heat during its formation; it is often directly transformed into freezing damage. Furthermore, freezing damage is affected by five factors: cooling rate, absolute low temperature after cooling, duration of low temperature, defrost speed, and a plant’s frost tolerance. Whether it is “black frost” or “hoar frost”, it is necessary to understand the formation principle to avoid frost damage and classify frost severities according to frost level to accurately prevent frost.
However, there are still many technical problems in the observation of frost phenomena at present. From the existing literature, some meteorologists have continued to discuss and have proposed many manual observation methods of frost phenomena [19,20]. However, these methods mainly focus on how to obtain the phenomenon characteristics more accurately and objectively in observation, and they seldom discuss how to realize the automatic observation of the phenomenon. In reality, manual observation of frost is not only inefficient, but also costly and subjective error, etc. [21,22].
Recently, technologies and methods related to frost detection continue to appear, but there has never been a relatively mature program suitable for the detection of frosting leaf surfaces. In addition, the difficulty of frost detection is also the main reason for the inefficiency of frost protection, especially in agriculture [23,24,25].
Considering these facts, we urgently need a set of frost detection methods to provide data for anti-frost operations, achieve high efficiency, and save energy. Therefore, some of the current research results with outstanding reference values and significance are summarized in this review.

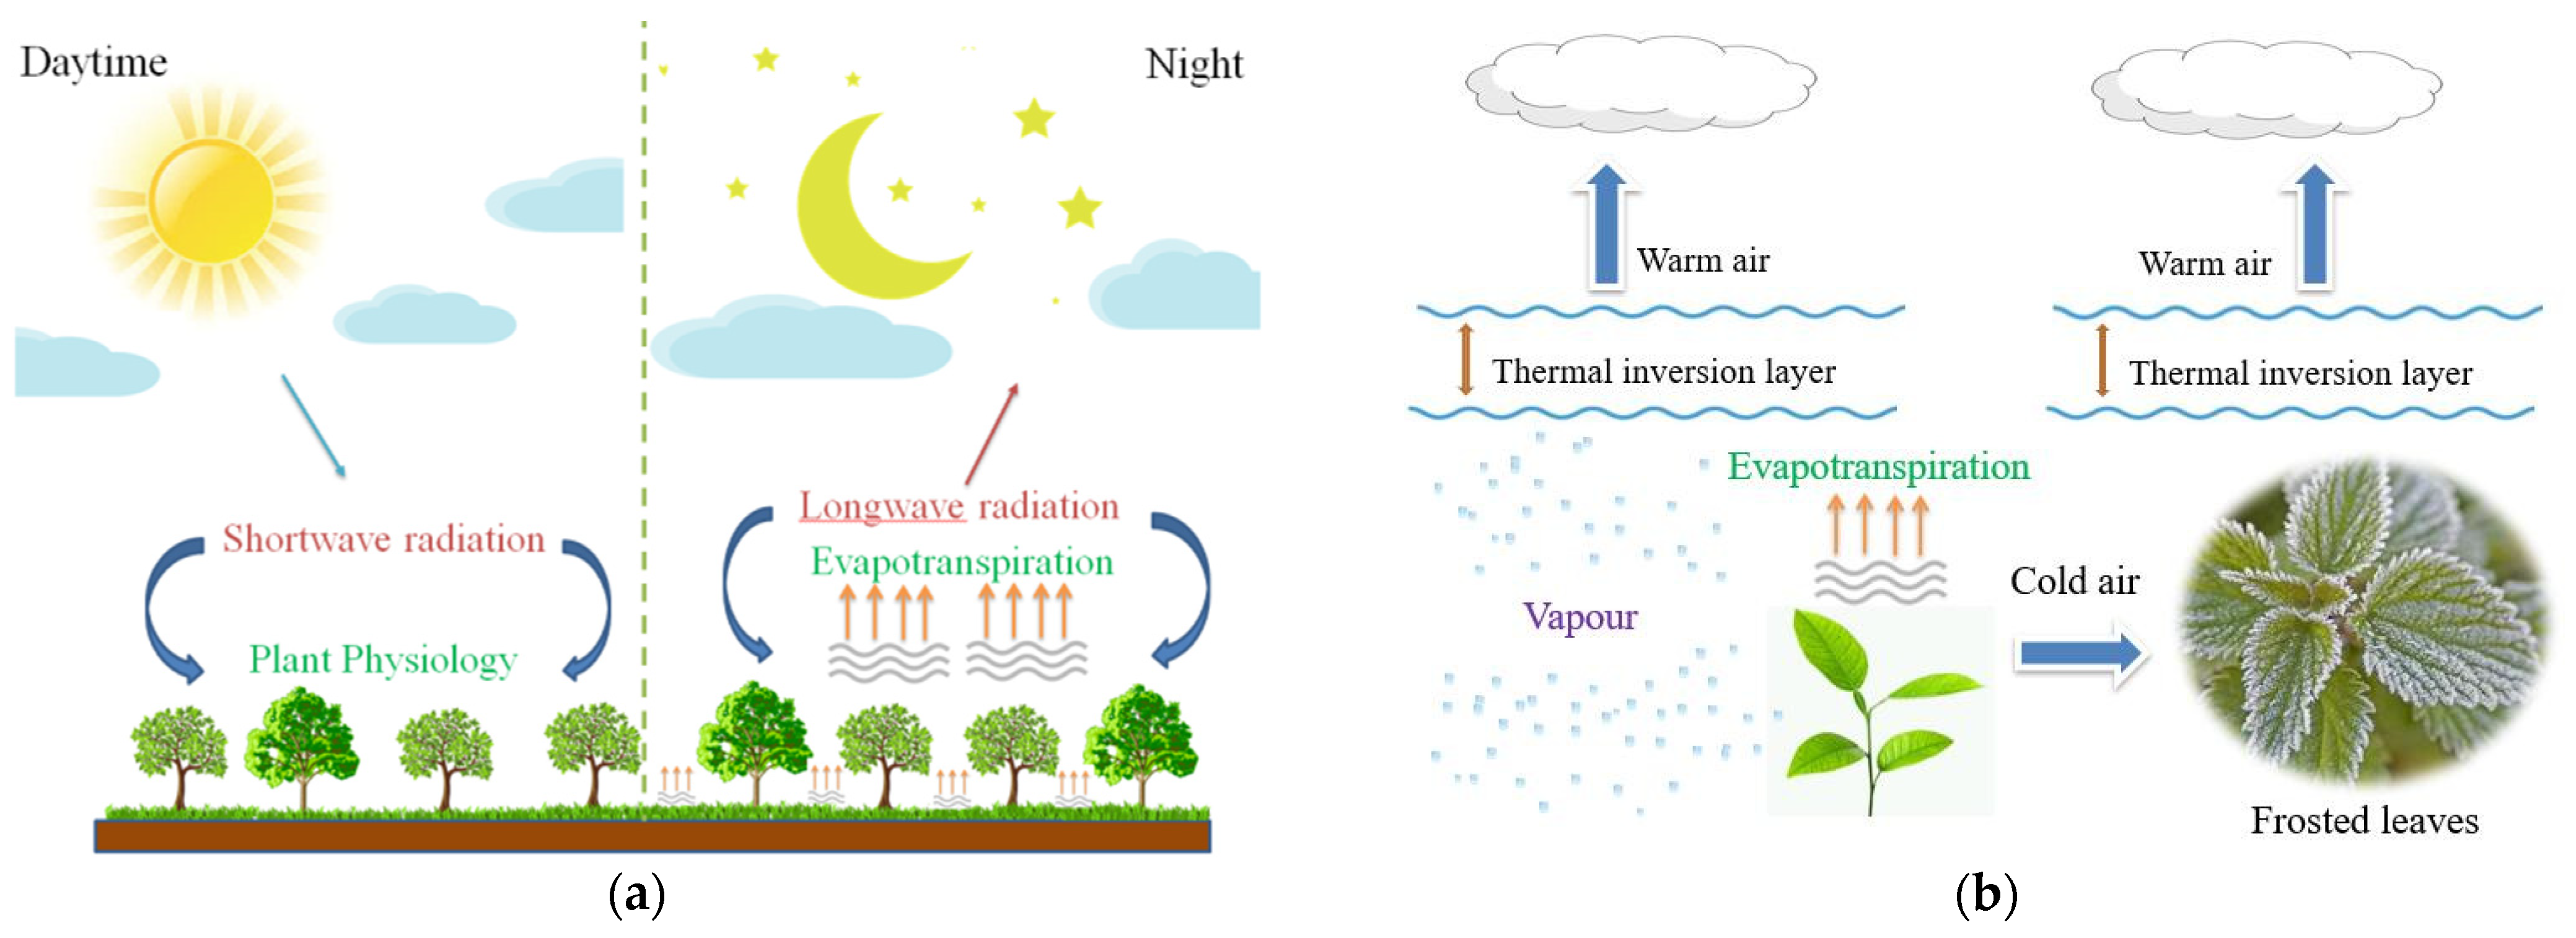
1.1. Principle of Frost Formation on Plant Surfaces

Frost, in nature, refers to the white crystals formed by condensed water vapor in the air near the ground after the temperature of the ground or ground object drops to 0 °C or slightly below 0 °C [26]. The process of frost formation is dynamic and changes with various environmental factors [27,28,29,30,31,32,33]. Especially between late autumn and early spring, frost will appear if the temperature drops below 0 °C due to radiation cooling when the night sky is cloudless and has calm winds. At the same time, the surface temperature of a plant body below 0 °C and the water between each cell in the plant body is frozen into tiny ice crystals. These ice crystals need to condensate the water of cells inside the plant, and ice crystals gradually grow. The water inside the cells permeates outwards and solidifies the plant’s protoplast colloid material due to how ice crystals interact, eventually causing crops to wither and die due to cell dehydration within a few hours [34].
The radiative cooling process between soil, plants, and the atmosphere reveals the main mechanism of frost formation. As shown in Figure 1, photosynthesis and evapotranspiration at the canopy between plants and the atmosphere are strong during the day under short-wave radiation, while long-wave radiation at night causes the temperature near the ground to drop significantly; the temperature below the canopy will be about 3 °C lower than the temperature above the canopy, which is called “temperature inversion” [35]. Due to the low temperature near the ground, the supersaturated water vapor in the air will condense into white frost crystals on some objects with poor heat transfer performance on the ground [30]. Specifically, frost will be delayed or even not occur if there are clouds in the sky at night, as they will weaken a large part of the long-wave radiation emitted from the soil and vegetation near the ground. Besides, wind speed has an effect on frost development. As air slowly passes over a cold surface when there is a breeze, the water vapor moves around and facilitates the formation of frost. However, when the wind speed is high, the contact time of the cold surface is too short due to the fast air movement. The upper and lower air easily mixes, and is not conducive to temperature reduction, thus hindering the formation of frost. Generally speaking, frost does not form easily when the wind speed reaches level three or above [7]. Therefore, frost generally forms on a clear, breezy, or windless night in the cold season.
The formation of frost is not only related to the aforementioned weather conditions but is also related to the properties of ground objects. Since frost is generally formed on the surface of a cold object, this indicates that the surface temperature of the object is related to the amount of frost created. In addition, due to the intensity of radiation caused by the temperature drop, the rate of frosting will be affected, and the more intense the radiation energy loss, the faster the surface temperature will decrease.

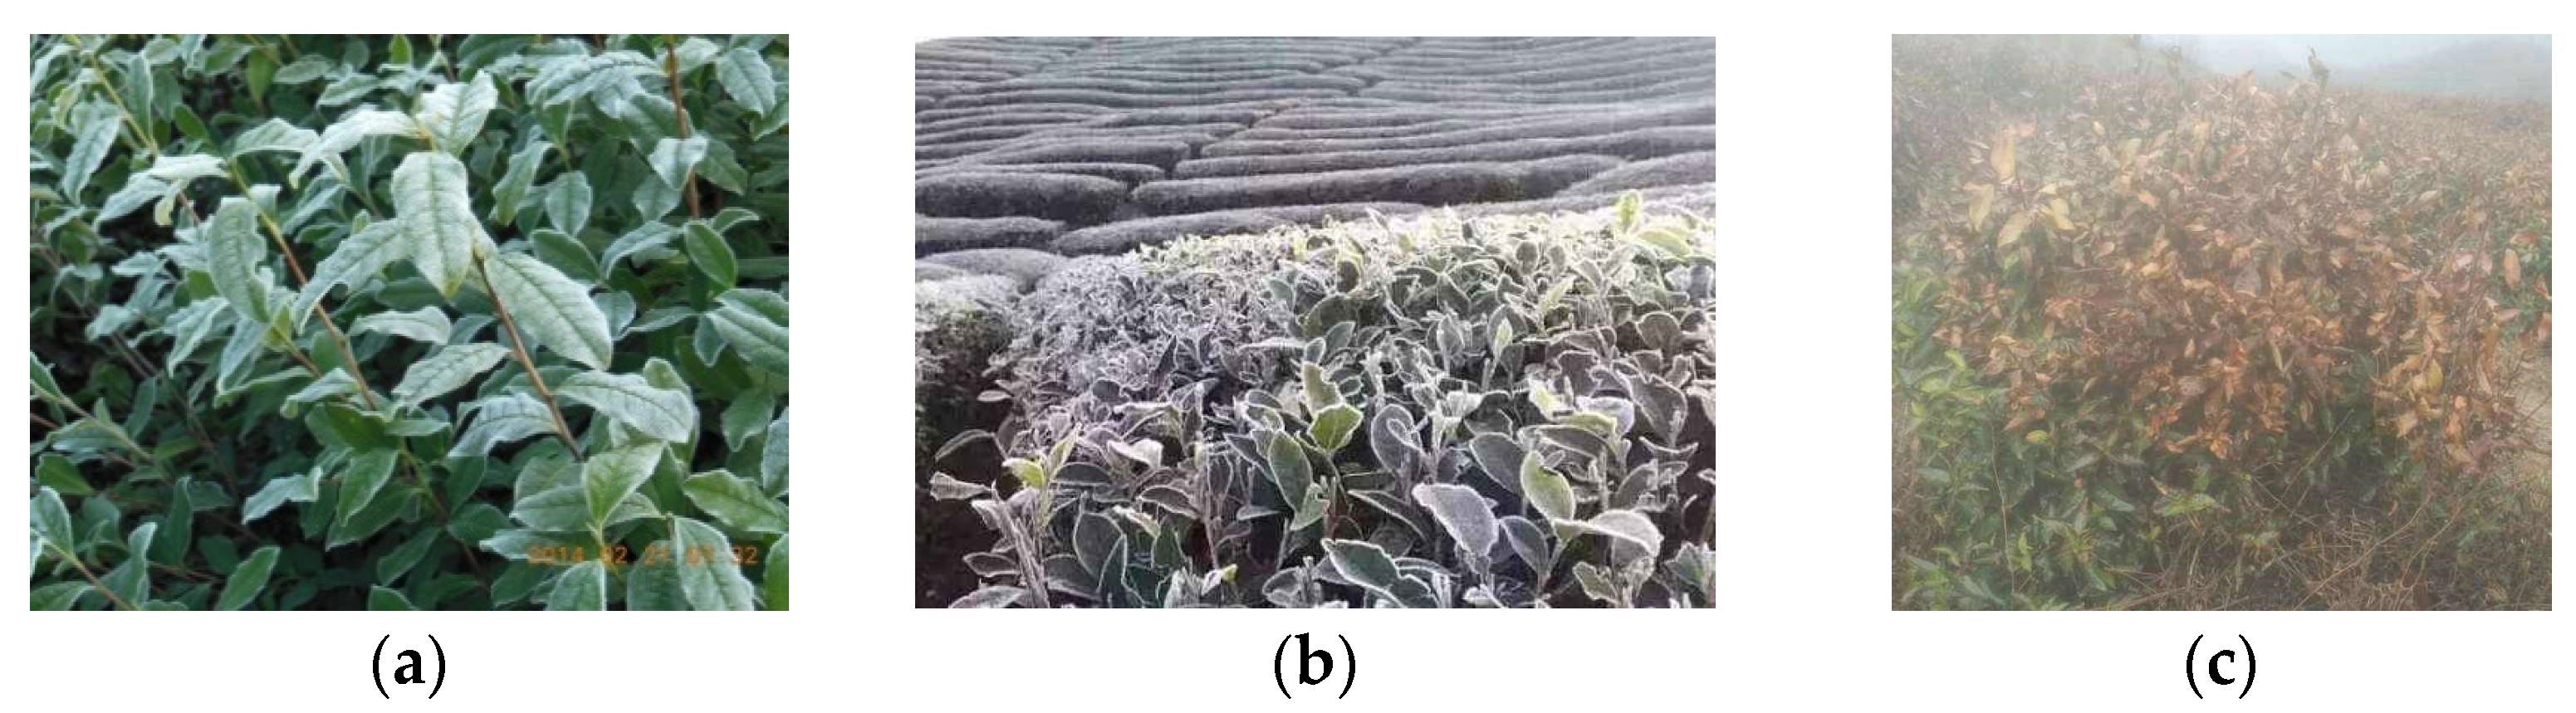
1.2. Frost Severities Classification

At present, the degrees of frost damage have different classification standards in meteorology and agriculture. In terms of the level of meteorological disasters and their early warning signals, they are generally divided into several different levels according to the damage degree, urgency, and development of the situation. These levels are indicated and marked using different colors and language, respectively. According to the meteorological standards established by the China Meteorological Administration, the frost warning signals are divided into three levels, which are represented by blue, yellow, and orange. The respective criteria and legend are shown in Table 1.
Clearly, the degree of meteorological frost damage can be accurately divided by the temperature drop range within a specific time, but the specific impact was neglected on specific crops. In the National Meteorological Industry Standard-Crop Frost Damage Grade I, crop frost damage is divided into three levels: light, medium, and heavy. These levels are determined according to factors such as temperature and its changes, the rate of crop frost damage symptoms, and yield reduction extent [36]. Take tea trees as an example; the freezing rate is less than 20% for light frost, greater than 20% and less than 50% for medium frost, and greater than 50% for heavy frost. The symptoms and degree of frost damage sustained by tea plants after a late frost attack vary with time and external conditions. Generally, the symptoms of frost damage begin to appear slightly within a few hours after melting and gradually become fully apparent within a day or two, but sometimes it may take about a week. The buds, leaves, branches, and whole tea plants show different symptoms according to the different degrees of freezing damage. The symptoms of frost damage are shown in Figure 2.

1.3. The Importance of Frost Detection

In China, frost damage in early and late spring has often occurred in recent years, which seriously restricts the stable development of the tea and fruit industry. According to incomplete statistics, the average area damaged by frost in China is 340,000 km² per year, and the loss is about three billion yuan per year [37]. Therefore, defense against plant frost damage is an arduous task in agricultural production.
To avoid frost damage that causes huge losses of many food crops, some countries have begun to adopt multiple frost prevention methods, including traditional smoke, cover, spray, and chemical fuel frost prevention. In recent years, with the improvement of frost prevention technology and equipment, wind machines and sprinklers are widely used to protect tea plants from frost-based airflow disturbances. In practice, only air temperature or wind speed is used as a control parameter to run wind machines or sprinklers for frost protection; the frost occurrence or severity is not considered. It is clear that frost should be detected for its control and protection. Therefore, it is of high importance to develop frost detection methods, techniques, and corresponding sensors for better frost protection with wind machines and sprinklers.
Compared with other frost events such as airplane wing and track frosting, etc. [38,39,40,41,42,43], frost detection based on plant surfaces has inevitably increased in specificity due to the diversity of plant types, including the surface characteristics and cold tolerance of different plants. Frosting on leaf surfaces is a time-varying dynamic quantification process with relatively dispersed distribution. Direct detection is difficult and the effect is poor. Based on the characteristics of frosted leaf surfaces and more timely detection requirements, we propose a new type of frost detection with better generality.
Regardless of environmental conditions or the specific properties of frost crystals [33,44,45,46,47,48], different methods are suitable for different detection schemes for frost detection technology on plant surfaces. In addition to the urgent research and development trend of current frost observation equipment [49,50,51,52], the research on the application technology of frost detection has important applications and practical significance to the meteorological field and industry [53,54].

1.4. Frost Observation and Monitoring

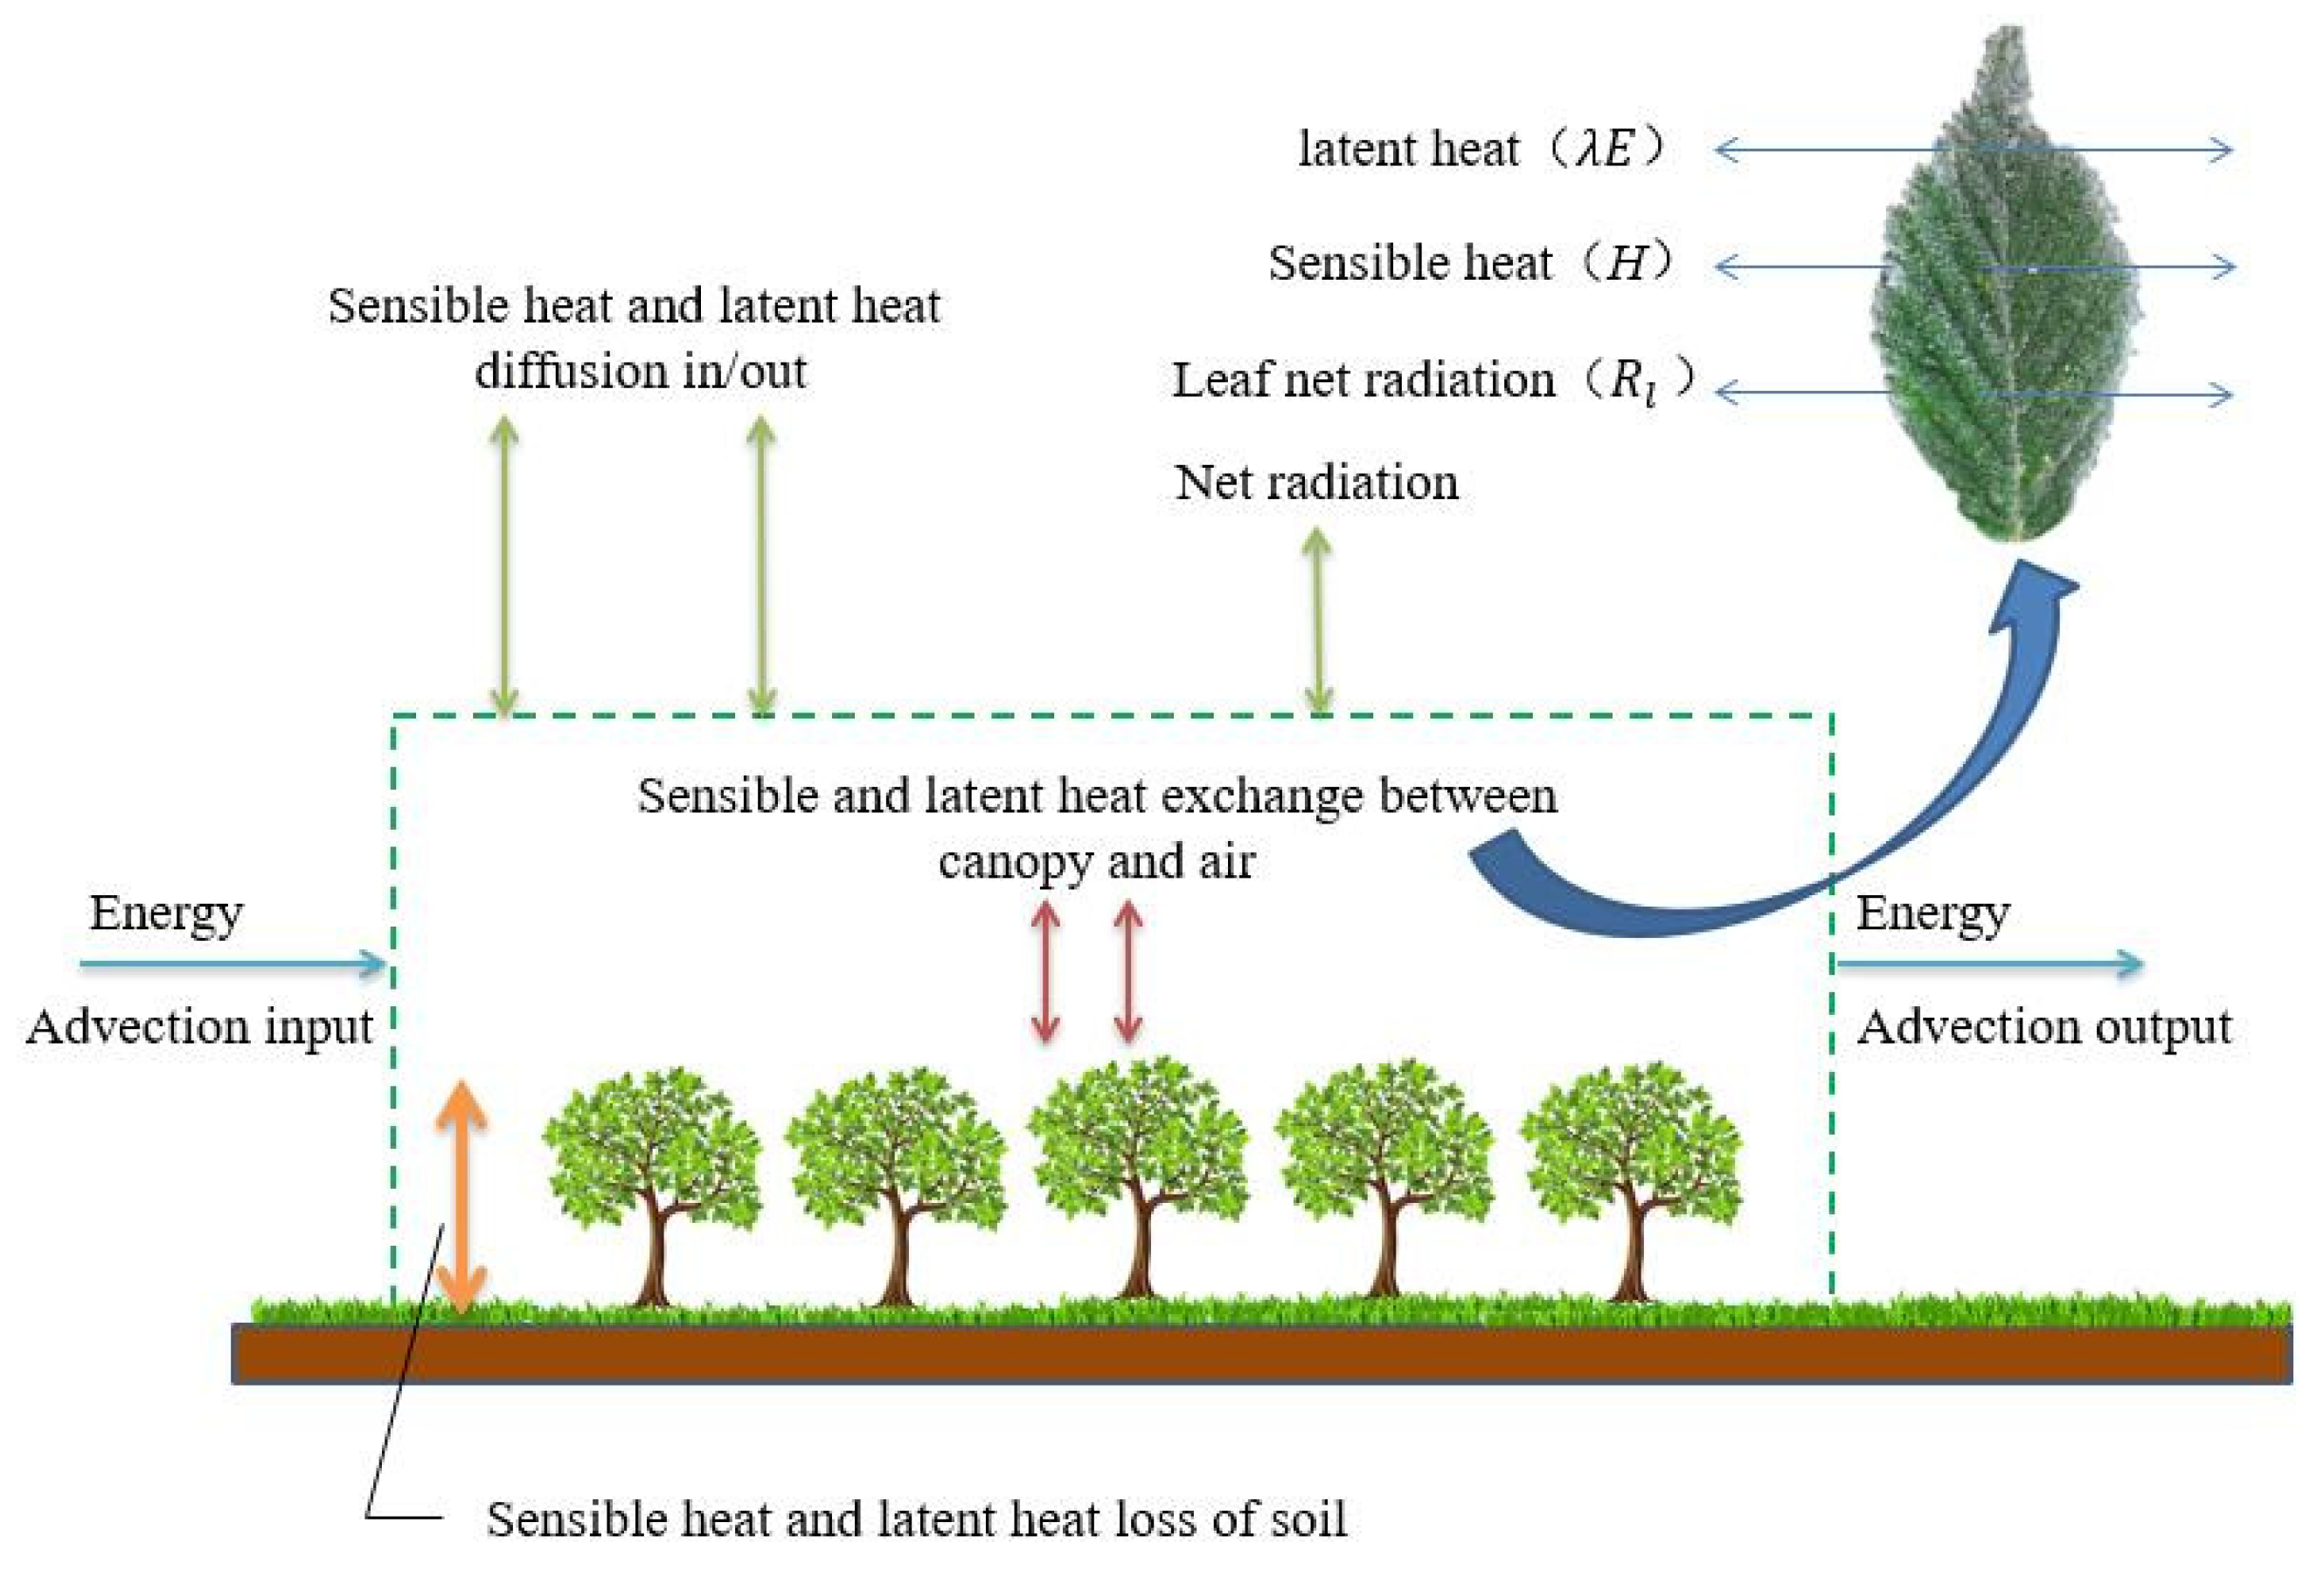
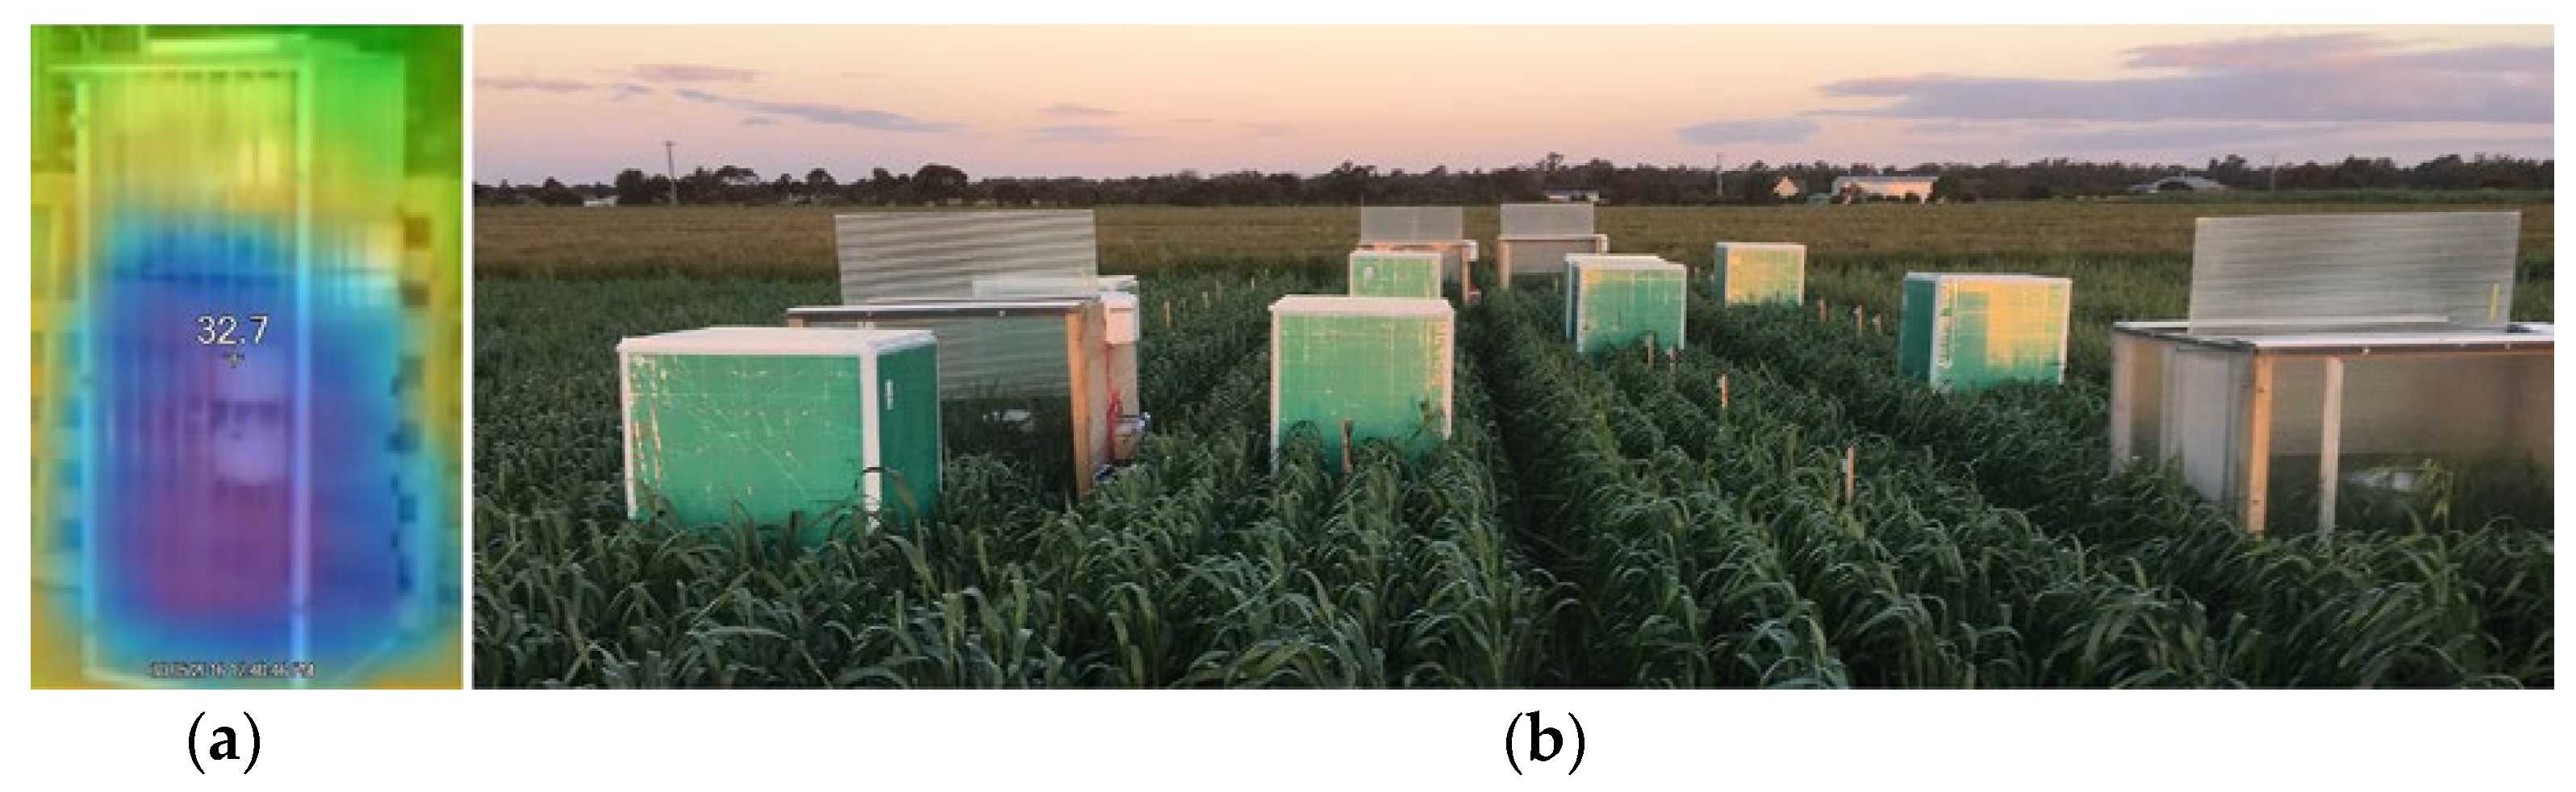
1.4.1. Micrometeorological Model Observation

Some authors such as Jordan and Smith [6], using the principle of micrometeorology through the collection of frost data at night from weather stations, established energy balance models to predict the temperature of leaves at night and whether frost will occur. Radiation is the way in which substances transmit energy through electromagnetic waves. In fact, every substance is constantly radiating into the sky and absorbing the radiation emitted by other substances [55]. In the process of plant frosting, exchange radiation also exists in leaves, the sky, and the ground. The radiant flux is mainly dominated by sensible heat during the daytime, while at night, latent heat dominates due to phase changes.
On nights with frost conditions, the temperature drops and the humidity increases, and the transpiration water in plants evaporates out in the form of water vapor and eventually cause the temperature of the leaves to drop until it reaches the frost point. Figure 3 shows the energy exchange at the plant canopy scale under frosty night conditions.
The principle focus of micrometeorology is to integrate various meteorological parameters in the natural environment, and construct mathematical relationship models by selecting significant parameters through mass transfer and energy balance mechanisms to predict or characterize the occurrence of frost. This method can explain the occurrence of frost from energy balance mechanisms and lays a theoretical foundation for frost-sensing research.
Based on the micrometeorology principle, Lu et al. [56] used support vector machine (SVM) machine learning technology to analyze the canopy energy of tea plants on frosty nights to determine the best model of radiation frost prediction and the most relevant micrometeorological parameters. Furthermore, according to the double-layer model of turbulent diffusion theory [57,58], the soil is regarded as a layer and the crop canopy is regarded as a layer. Assumed energy is only transmitted in the vertical direction of the canopy and the convective transmission occurs only in the horizontal direction; heat reserves of crops and air are negligible because the tea plants’ canopy transmits energy with air below and above the tea plants’ canopy, respectively. By establishing the energy transmission model of the atmosphere–tea plants–soil system on frosty nights and analyzing the internal energy of the atmosphere–tea plants–soil system, the three seasons of frosty nights (autumn, winter, and spring) and three kinds of intensity frost nights (light, medium, and heavy) are identified. It quantifies the energy budget of each part of the system and provides a theoretical basis for the effective distribution of anti-frost energy.

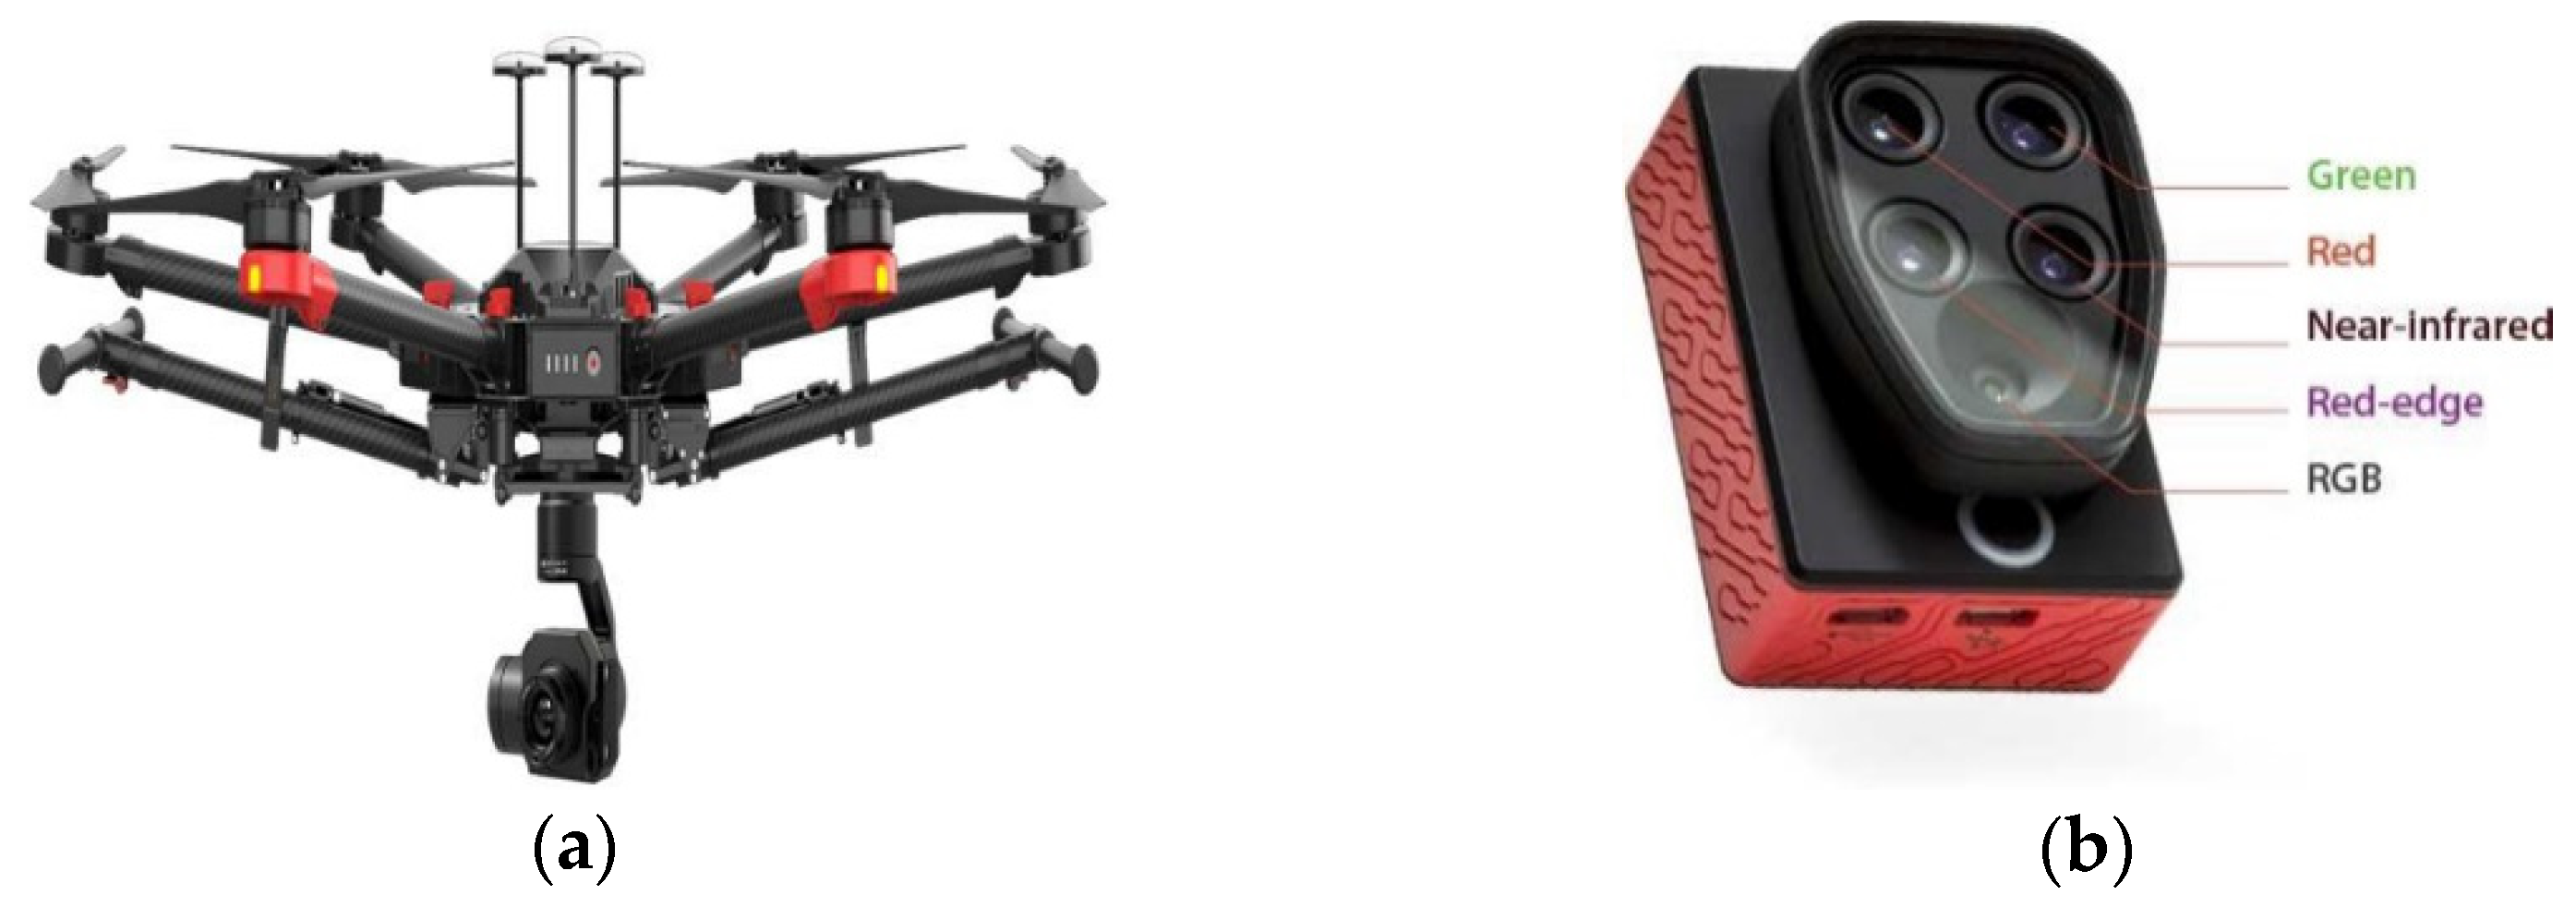
1.4.2. Spectrum and Remote-Sensing Model Monitoring

Reflectivity is an important parameter that determines the properties of a substance in the frost detection process. John et al. [59] used a thermal infrared spectrometer to detect the reflectance spectra of feather-like frost crystals and wrapped frost crystals to obtain true frost reflectance. The results were compared with reflectance spectra calculated based on Kirchhoff’s law and it was same in the range of 2–14 μm, but the reflectance of frost crystals with a smaller particle size was higher than that of frost crystals with a larger particle size under the condition of crystals with different particle sizes.
Since tea leaves are sensitive to low-temperature frost reactions, the leaves exposed to frost will show different characteristics on its surface. Hu et al. [60] obtained the diffuse reflectance spectrum information of tea leaves treated with different low-temperature frost damage. He established a visible, nearly infrared spectrum prediction model for frost leaves by using the partial least square and artificial neural network method. It can quickly and accurately identify normal leaves and mildly frost-damaged leaves based on this model, providing a new detection method for determining the critical low temperature of frost damage on leaves and a parameter basis for airflow disturbance anti-frost control.
The above is a small-scale prediction for a single plant which can be studied by spectroscopy technology, while larger-scale farmlands like Goswami [61] can be monitored by remote-sensing methods. As shown in Figure 4, a dataset of spectral images in the four bands of red, green, blue, and nearly infrared before and after frost in a maize field was collected by a light six-rotor unmanned aerial vehicle equipped with a multispectral sensor; it recognizes the rapid identification of corn frosting status combined with four different model classifications, including Random Forest, Random Committee, SVM, and Artificial Neural Network.
James et al. [62] used remote-sensing technology to simulate the frosting environment through an artificial frost chamber in the field, and treated wheat with artificial frost at a low temperature. The canopy reflectivity of wheat is used to detect frost conditions, as shown in Figure 5. Combined with fluorescence-imaging technology, the visual effect of wheat suffering frost damage was realized.

2. Method and Technology for Detecting Frost on Leaf Surfaces—Contactless Detection

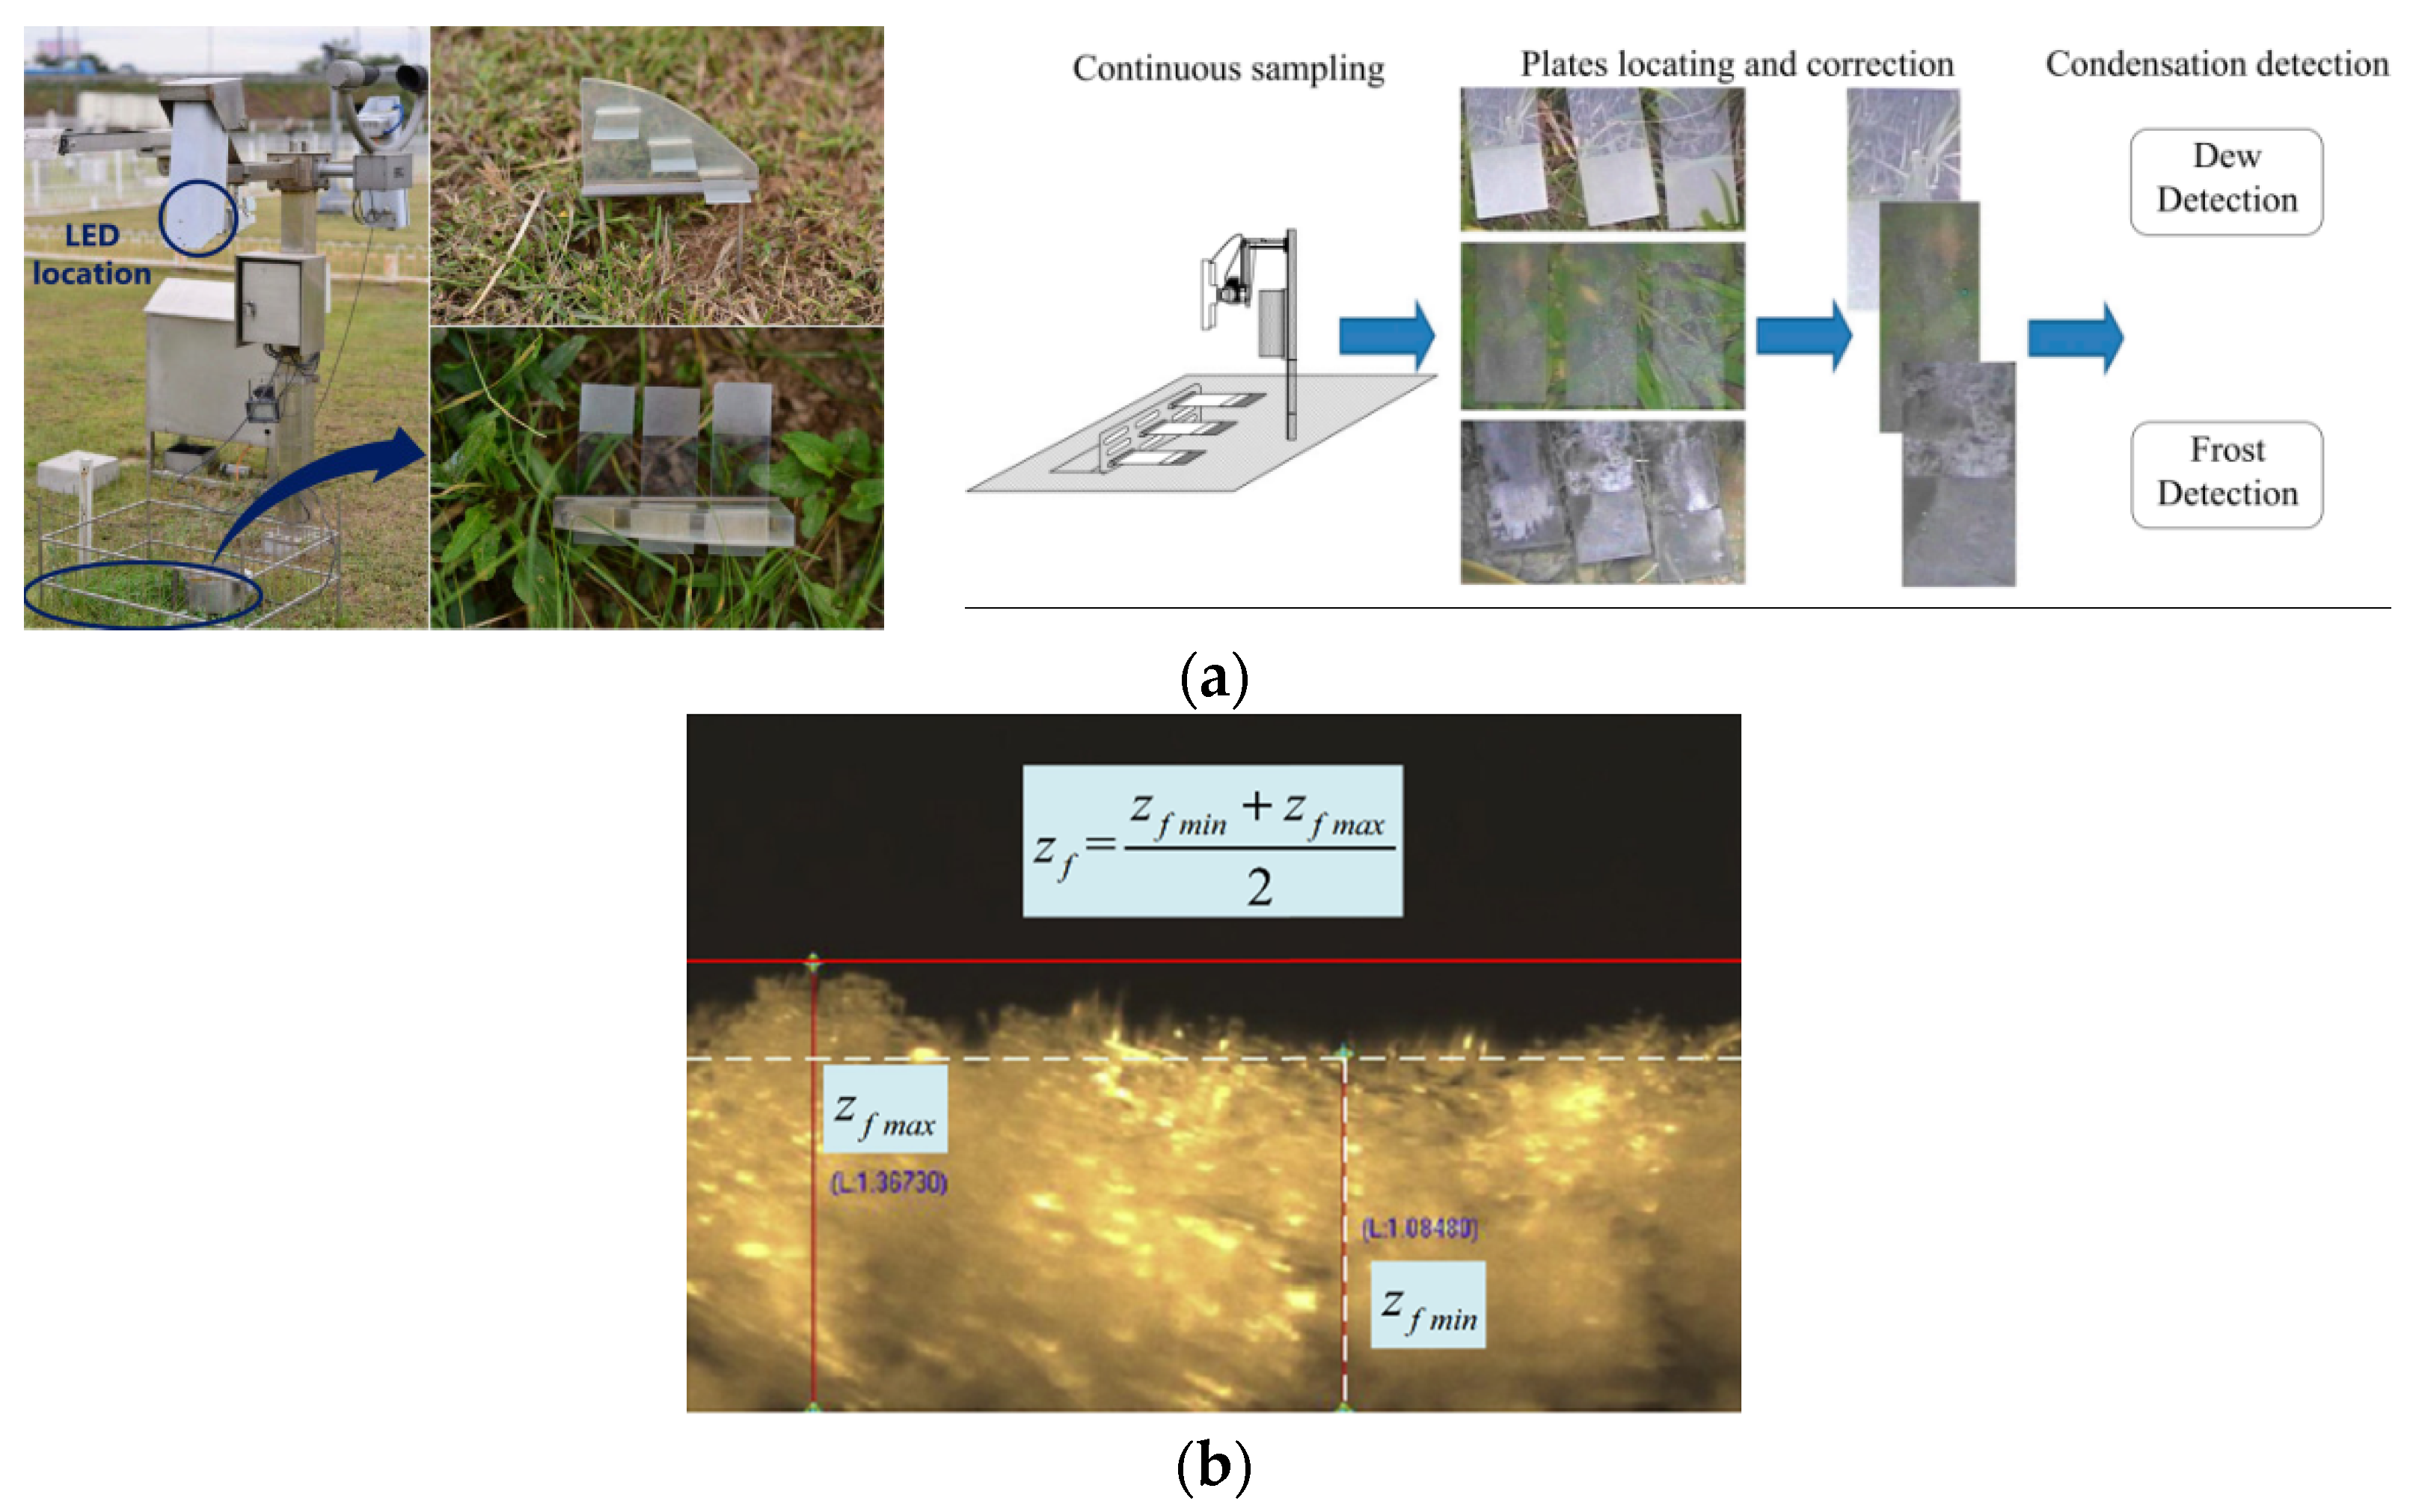
2.1. Image Recognition Detection

Machine vision is a feasible method that has been adopted by some scientists for the changing characteristics of frost crystal growth [63,64]. In order to gather the image of frosting phenomena close to the ground, Zhu et al. [65] designed a carrier suitable for image observation of dew and frost phenomena using a surface image change modeling frost phenomenon detection algorithm, and then through the proposed numerical model of fitting the similarity to determine potential frost phenomena. As shown in Figure 6a, it is noteworthy that the frost carrier of this automatic observation equipment is cleverly polished on both sides and is placed on the grass close to the ground, with the frost on its surface being captured periodically by a camera fixed above.
Due to the complex background of frost imaging, the diversity of natural vegetation, and the classification effect of the frost recognition classifier, it was realized that according to the above algorithm, offline learning is not good enough. Therefore, the author made improvements in the follow-up work and used saliency regions based on the image, using the task-driven saliency detection model, and taking the color feature of frosting images as prior knowledge. The manifold learning theory [67] to calculate the significance of pixel probability of frosty areas is a method of detecting dew and frost events proposed by Huazhong University of Science and Technology and is the first attempt of using computer vision. Therefore, there is still much space for improvement in recognition accuracy.
Based on the collection of surface condensation images gathered by automatic surface observation equipment, Zhou et al. [68] used deep learning methods to classify and recognize surface condensation images such as dew, frost, rain, and other surface images. They carried out the classification and identification of research, including the surface condensation image set, using self-built and expanded traditional convolution of the neural network classification method, in addition to using the improved convolution neural network classification method, which further improved surface condensation image recognition accuracy.
Also based on image processing technology, Shirin [14] and Wang [66] used a digital camera to take time-lapse photography of frost on the test sample, as shown in Figure 6b; through the calibration of the frost image, frost thickness was investigated with MATLAB software. Shirin’s results show that surface roughness is related to frost density regardless of operating conditions, and frost density decreases with an increase in frost surface roughness. Furthermore, a modified correlation of initial frost density was proposed by Wang and the frost surface temperature and heat flux were predicted under a wide range of frosting conditions. This research fully demonstrates the necessity of image processing in frost detection.

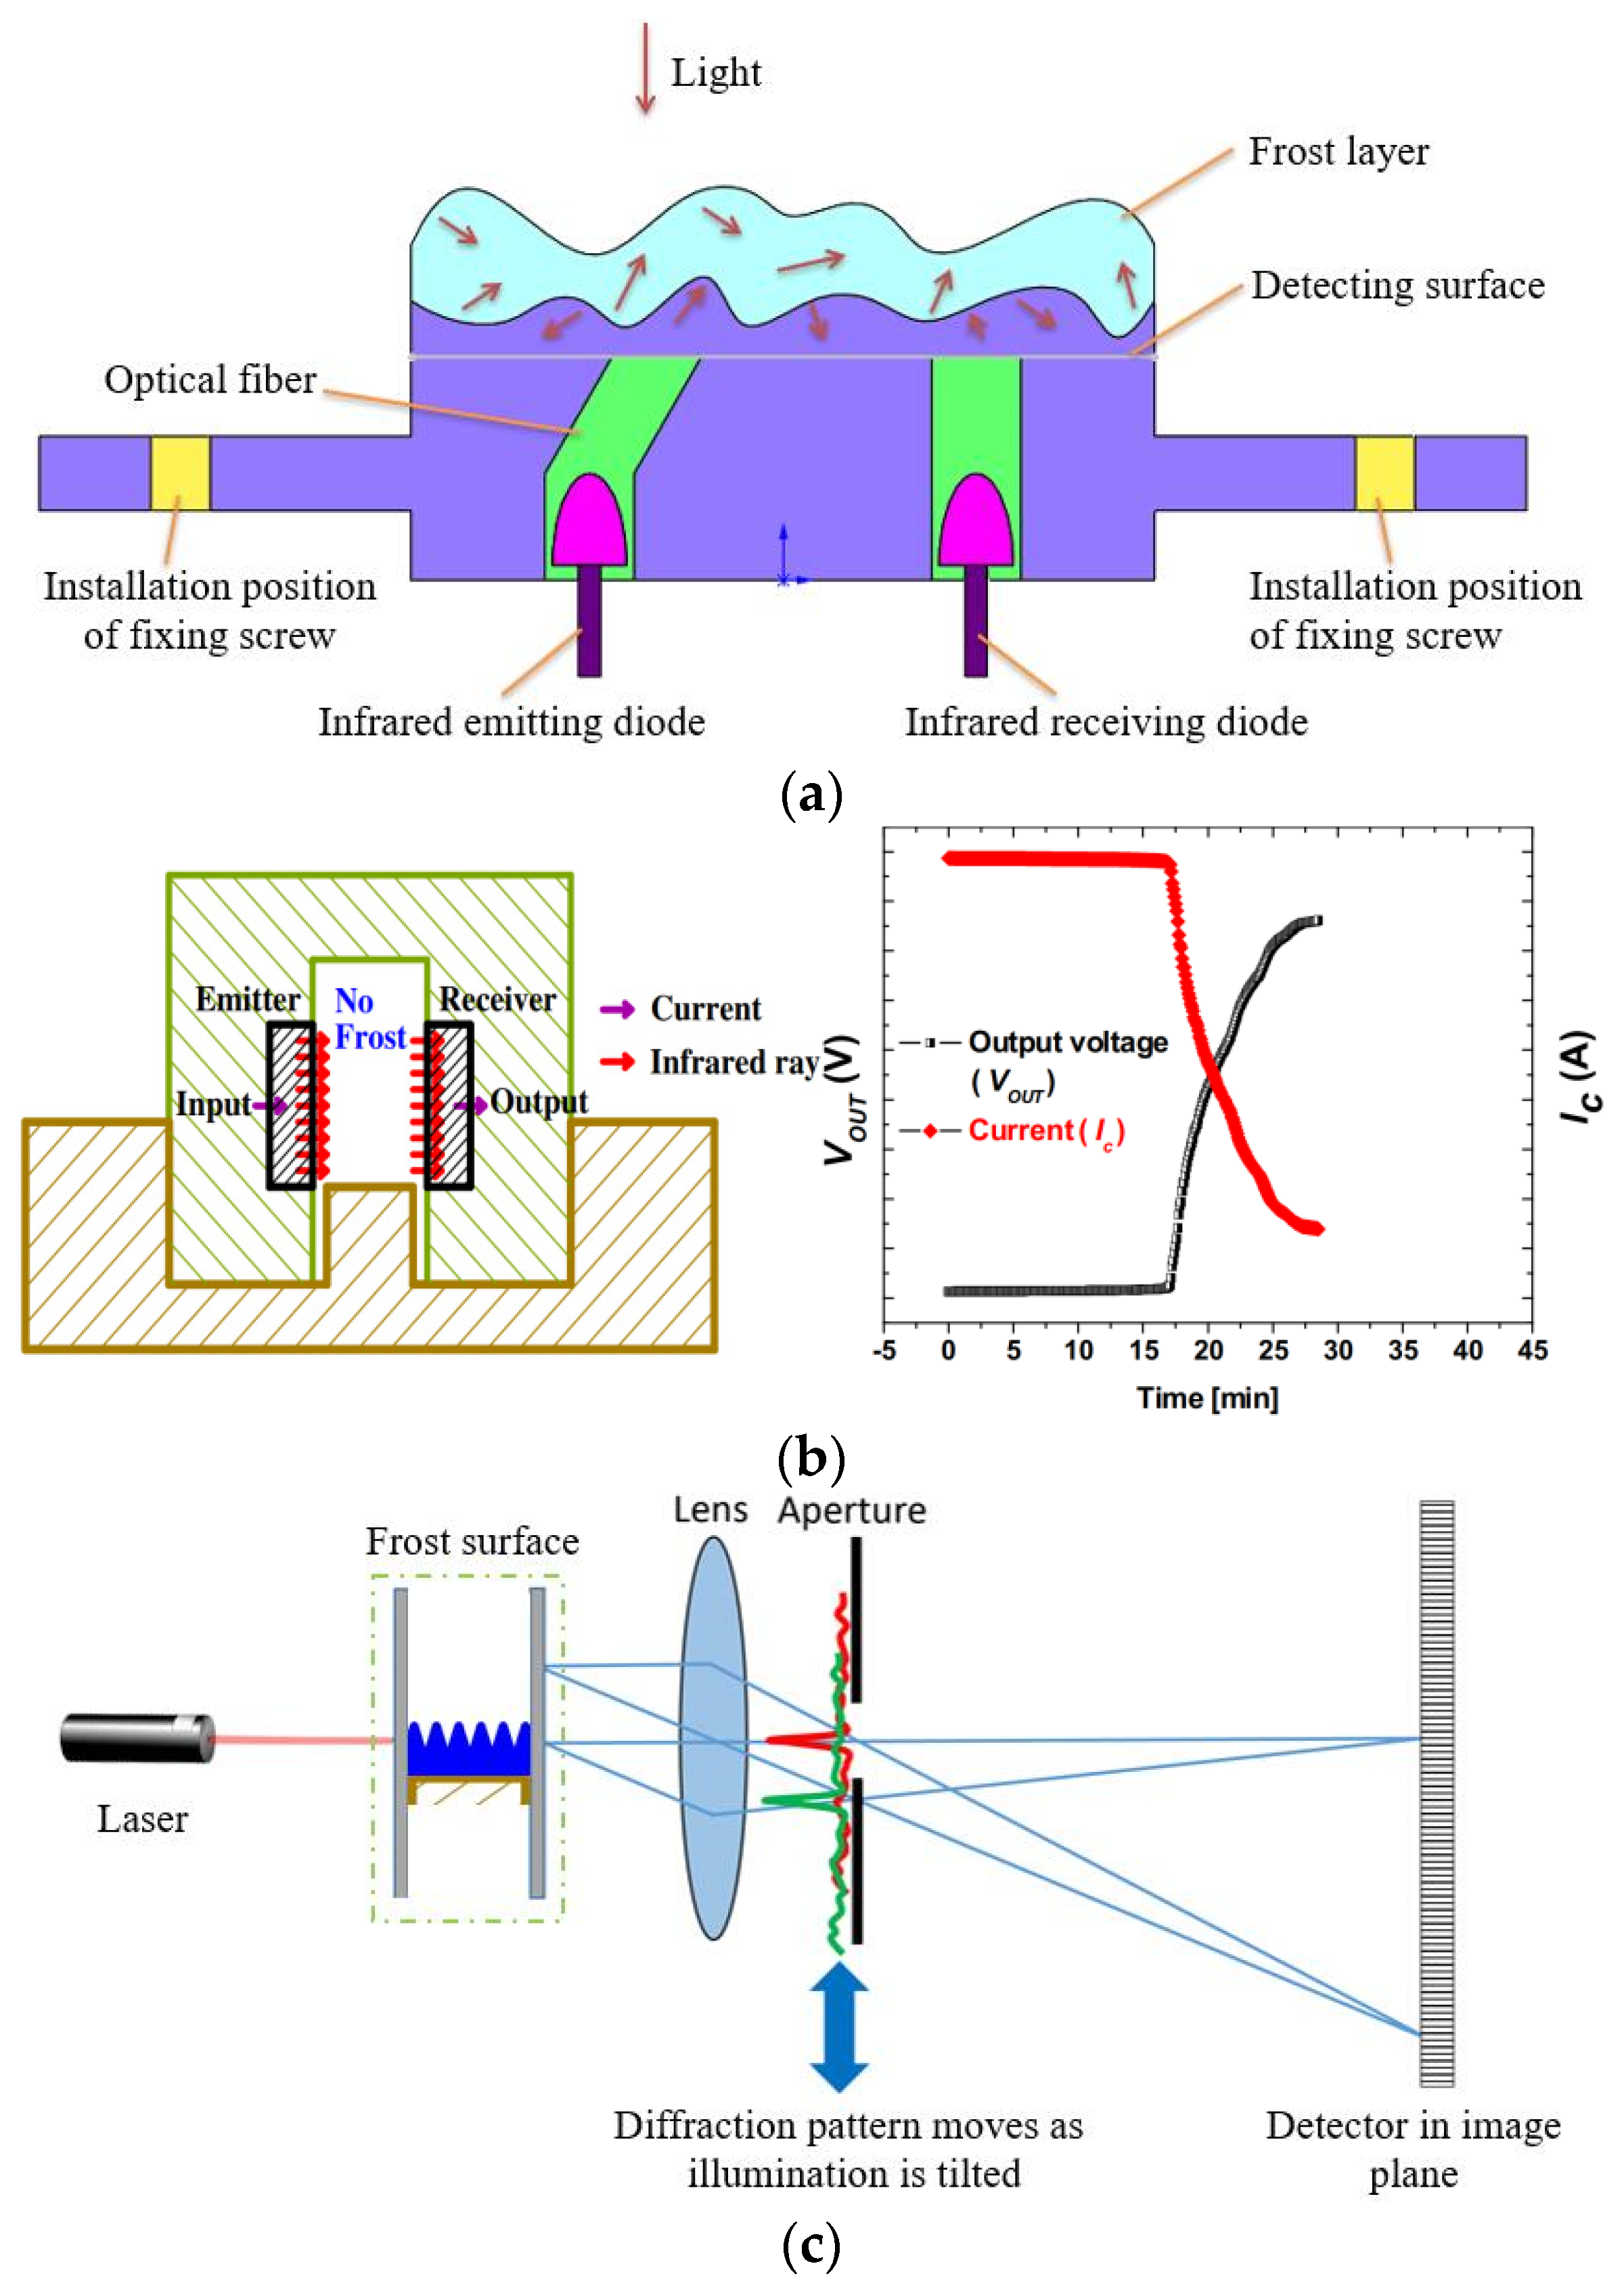
2.2. Optical Detection

In the ideal uniform transparent medium, light can only spread along the direction of itself; it does not scatter along other directions. However, because of the complex ice crystal structure of frost, the uniformity of the refractive index is destroyed; the frost will absorb, scatter, and reflect the light in a complex way. The frost sensor designed by Zhang et al. [69] makes use of this principle.
Figure 7a shows the optical path schematic of the frost sensor; it measures frost thickness by detecting the intensity of the received optical signal. The emitting diode in Figure 7a will emit infrared light and reach the probe surface. When there is no frost on the probe surface, light will emit into the air, and the receiving diode will have no light current output because no emitted light will reach it. The infrared light will scatter, reflecting the frost once frost begins to form on the probe surface. The frost-air, interface-reflected light and the scattered light in the frost will emit into a receiving diode and produce an electric signal. The light in the cross-sectional area of the optical pathway will change as well once the frost thickness changes.
The sensor has good consistency. Its output voltage drops relatively slowly when frost thickness is less than 0.6 mm and drops accelerated significantly when frost thickness increases from 0.6 mm to 4.0 mm. However, the change rate of the output voltage value becomes slow when frost thickness is greater than 4.0 mm. That’s mainly because there is distance between the emitting diode and receiving diode, so there are measurement dead zones when the frost thickness is very thin. Scattering light increases gradually, and the output voltage decreases rapidly with increased frost thickness. Output voltage changes start to slow down because scattering has reached its maximum when the frost thickness reaches a certain value.
Since the emission of light through the medium depends on the frost layer pattern, which is closely related not only to the test conditions but also to the porosity, the test material properties, and the packaging form of the sensor, it is necessary to more precisely verify the calibration model of frost volume in combination with different working conditions and these factors in order to reduce deviations.
A frost sensor designed by Wang et al. [70] based on the principle of light transmission is also an “electric-photo-electric” conversion device that transmits electrical signals with light as the medium, which is mainly composed of an emitter and a receiver [71]. Figure 7b illustrates the variation of Vout and Ic for frost growth, and the transmitter converts the external voltage signal into an optical signal; then the receiver converts the received optical signal into a voltage signal for output. When the optical medium is partially or completely blocked, the growth of the frost layer blocks the propagation of the optical medium and the output voltage of the receiver changes immediately. The thickness of the frost layer on the cold surface can be judged by the change of the output voltage [72,73].
As shown in Figure 7b, no frost exists in the passage; most of the infrared energy can be absorbed by the receiver, and the current Ic is maintained at high value while the output voltage Vout remains at its minimum value. However, with the accumulation of frost, the infrared energy arriving at the receiver is weakened or interrupted, and the current Ic decreases, which makes Vout increase progressively. Finally, when the passage is fully filled with frost, little infrared energy reaches the receiver, and Ic drops down to the minimum value while the output voltage Vout increases to its maximum value.
In addition to the two methods for optical detection of frost phenomena shown above, there is also a method of frost detection using light diffraction, which is based on the Fraunhofer diffraction effect formed by the gap between the frost growth interface and the reference surface [30]. As shown in Figure 7c, when parallel light irradiates the gap between the frost growth interface and the reference surface, this is equivalent to the far-field diffraction of a single slit. When the distance from the observation screen is RB/λ, B is the gap width, λ is the laser wavelength, and clear diffraction fringes are obtained on the test field of the observation screen.
Since a frost layer is a heterogeneous medium, it will present a variety of complex phenomena such as reflection, scattering, and transmission when light beams pass through the medium. It clearly has certain research and application value using optical detection for the frost detection on plant surfaces.

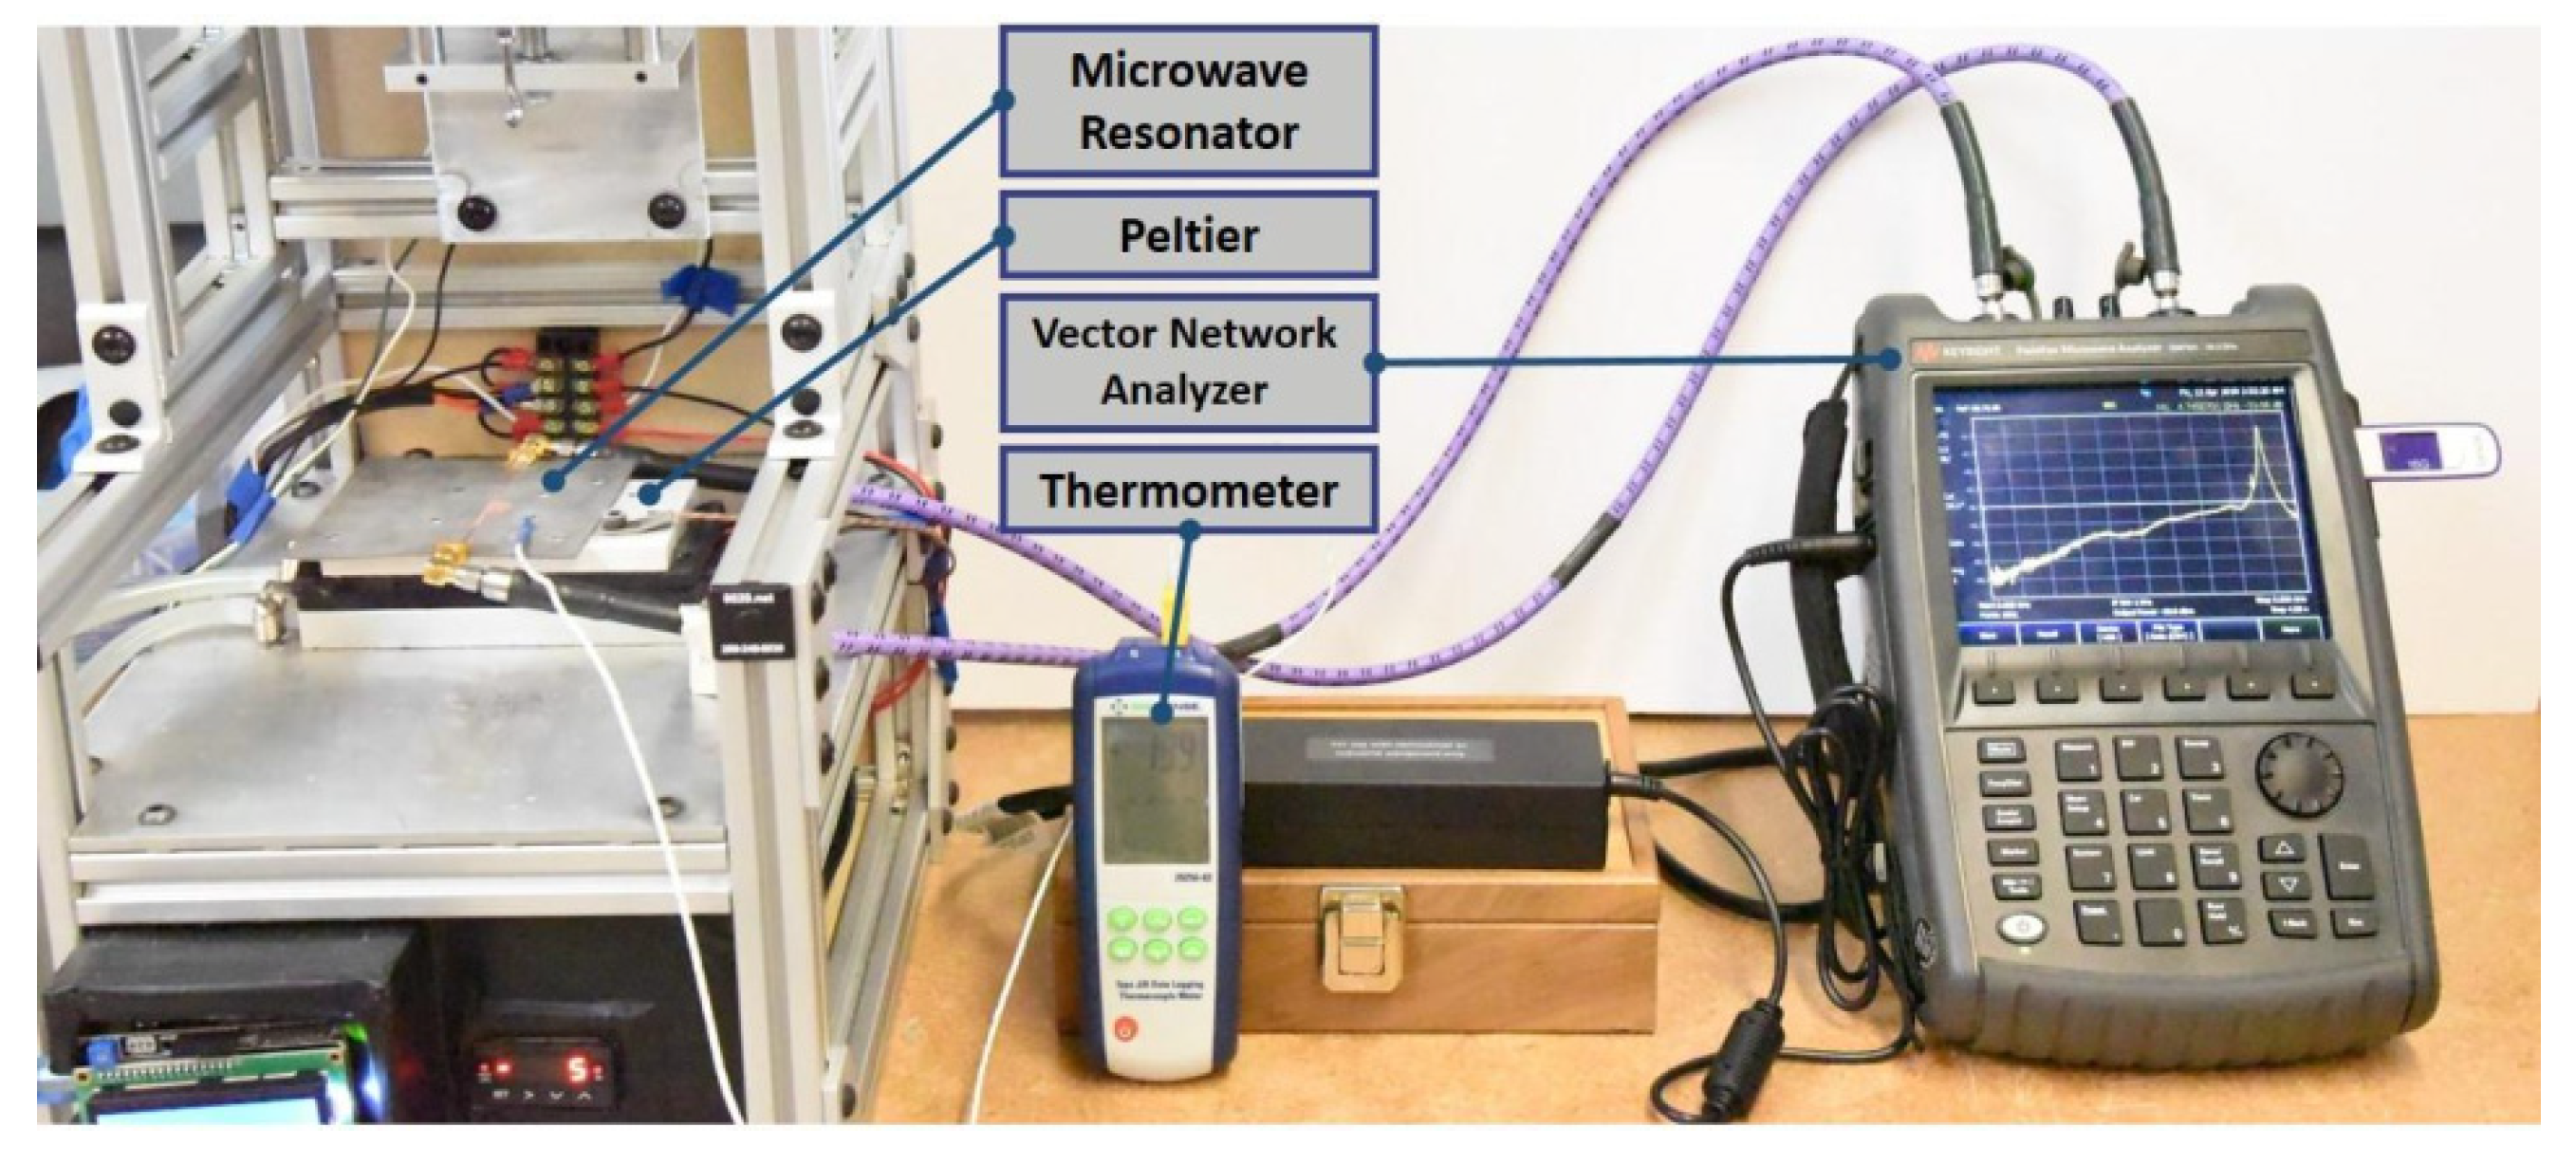
2.3. Microwave-Based Detection

Among all contactless inspections, the use of microwave technology to detect surface frosting was first proposed by Wiltshive et al. [74]. They introduce a microwave resonator sensor fabricated on a planar substrate operating between 3.5 and 5 GHz with a resonant amplitude of −14.5 dB and a quality factor of 250 (Figure 8). The resonator detects water, frost, and ice based on the measured resonant frequency, amplitude, and quality factor variation in the scattering parameter, S21, of the sensor. Three situations are investigated to test the effectiveness of the sensor: First, continuous frost formation on the sensor is tracked and the phenomena of water condensation, frost formation, and subsequent frost growth are characterized. Second, a water droplet is placed on the resonator and frozen, enabling faster and more sensitive detection and representing an initial liquid impact or aggregation on a surface followed by freezing. Lastly, controlled frost formation and removal was performed to better understand the effect of substrate temperature on the sensing parameters so that it could be compensated for via calibration. The final conclusions show that the radiofrequency and microwave methods utilized can be easily implemented to achieve wireless and contactless frost detection.

3. Detection Method and Technology of Frost on Leaf Surfaces—Contact Detection

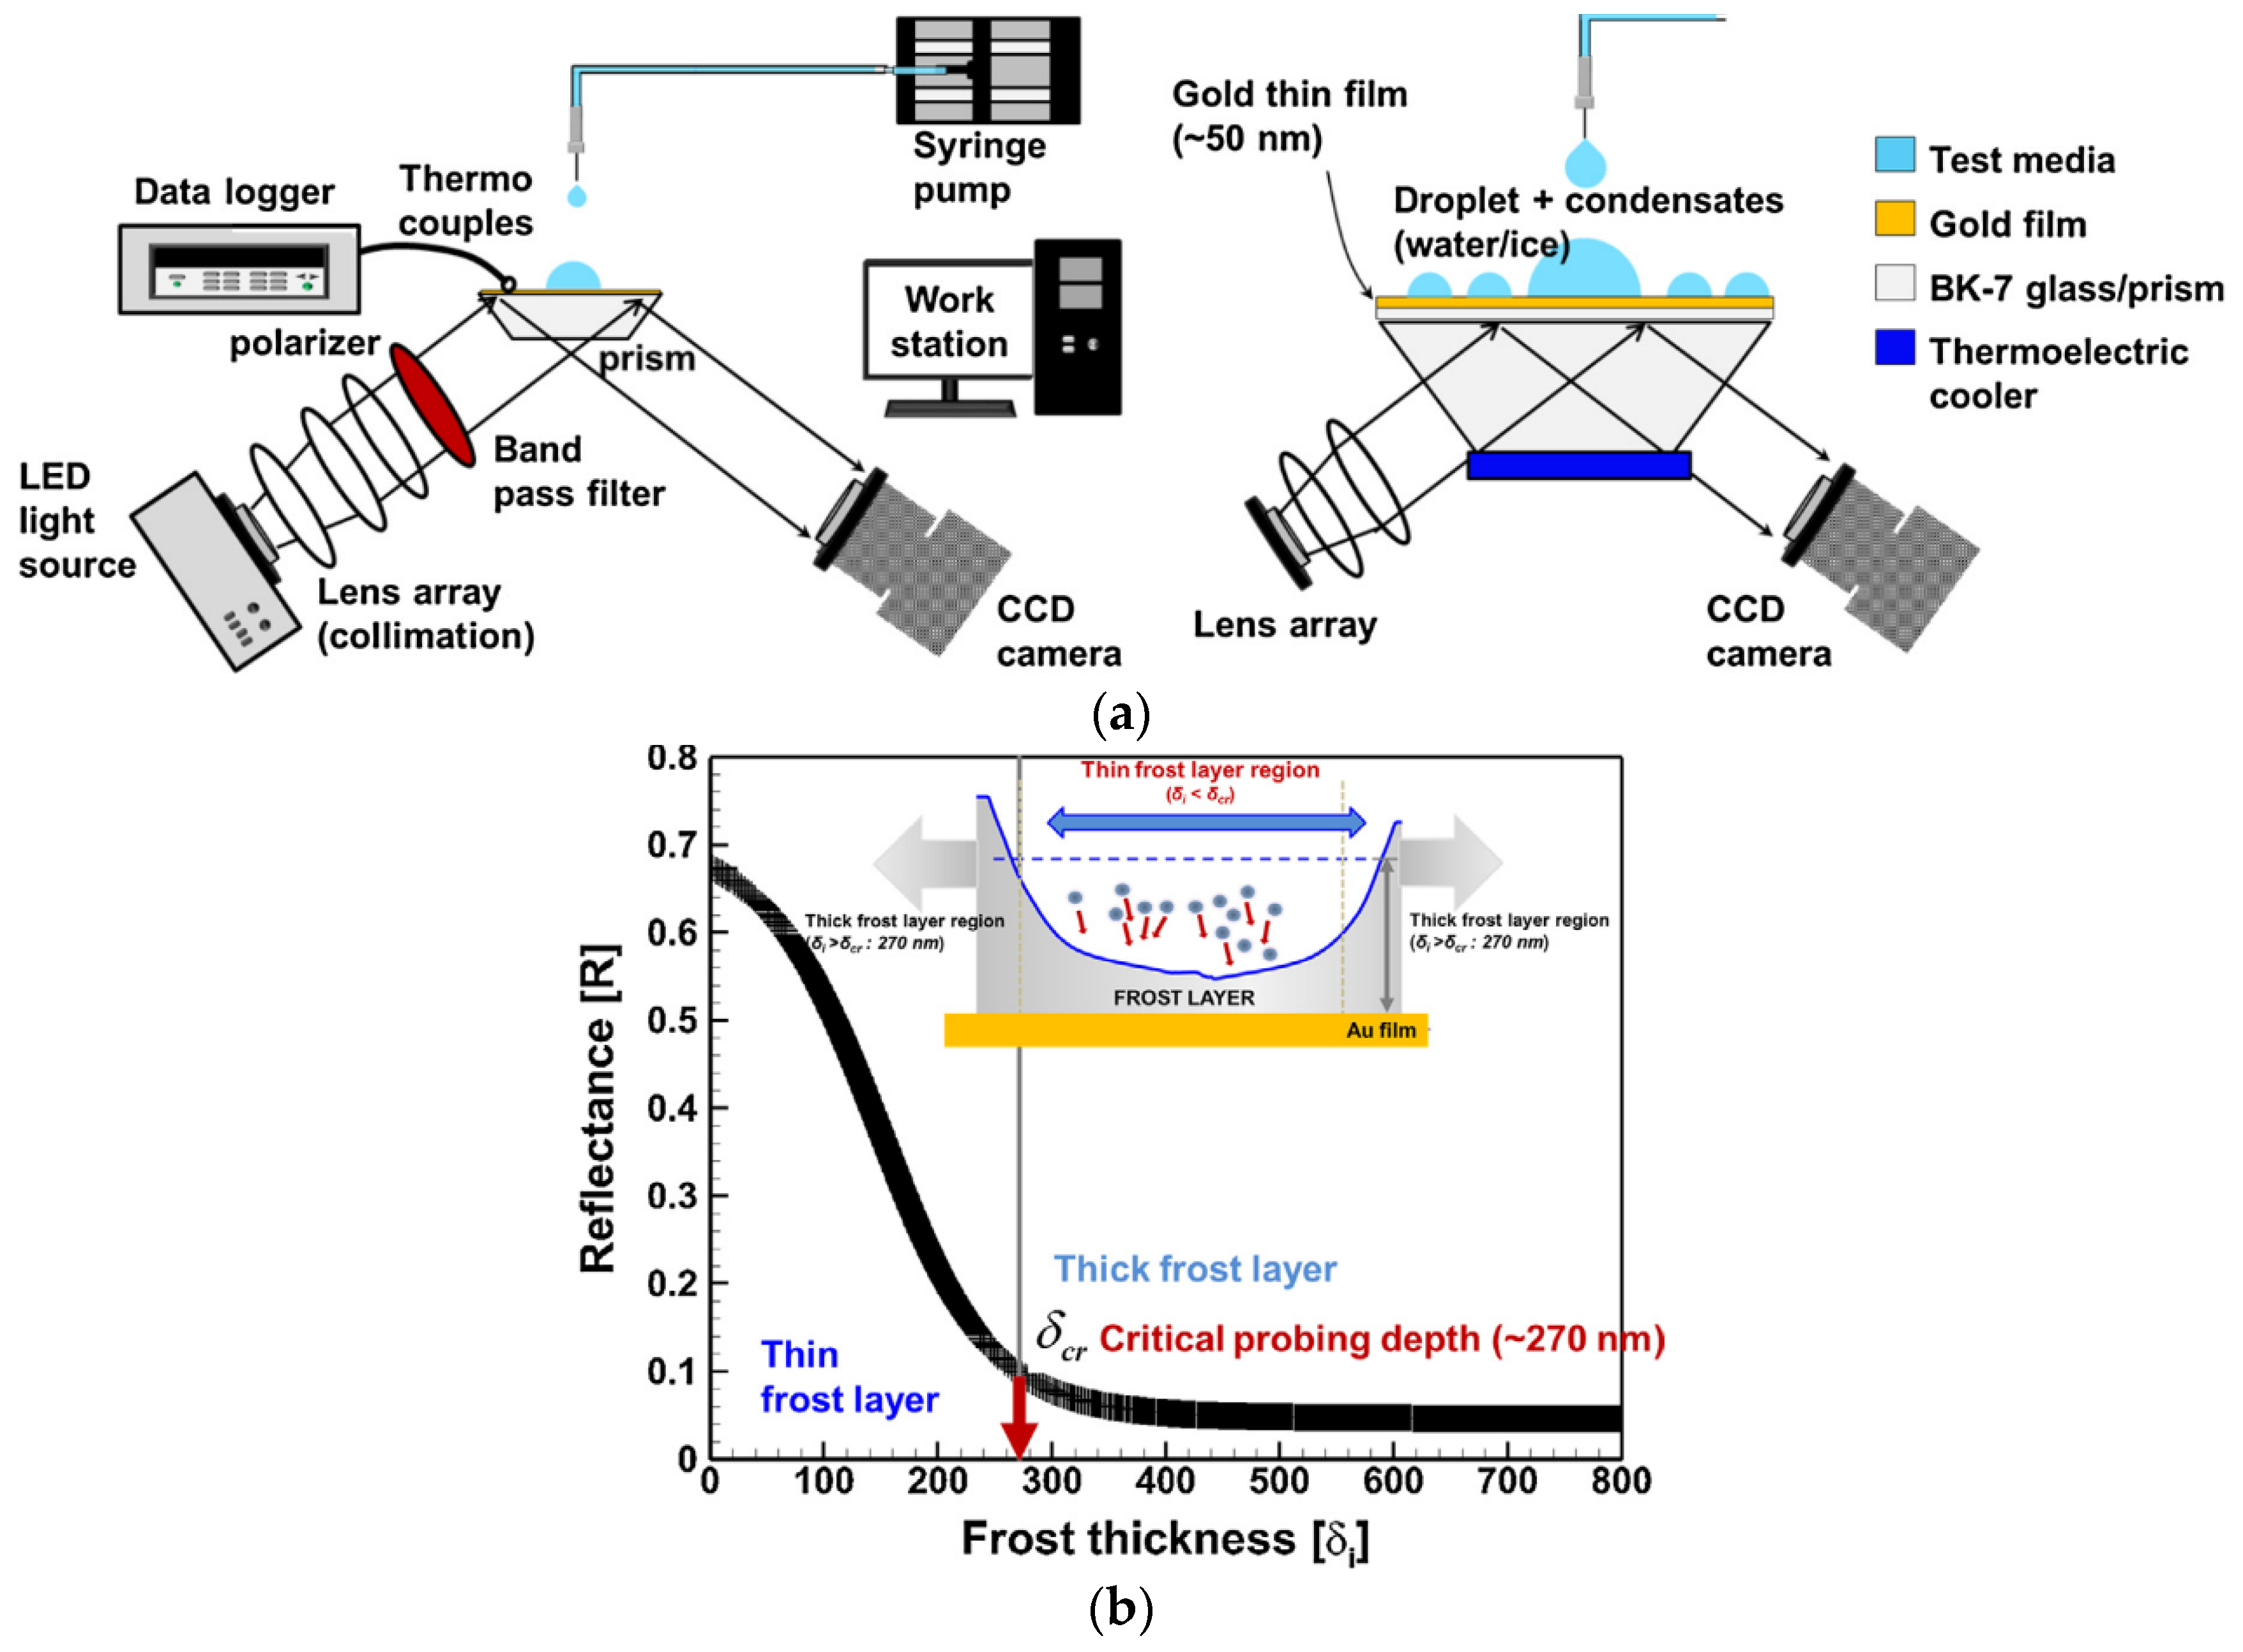
3.1. Surface Plasmon Resonance (SPR) Detection

Chan et al. [75] proposed an analysis method that uses surface plasmon resonance (SPR) visualization technology to distinguish the various stages of frost formation. As shown in Figure 9, the SPR system consists of a 50 nm gold-coated cover glass, a prism, a light source, a polarizer, a lens, and a filter for collimated light of a 600 ± 5 nm wavelength, and a charge coupled device (CCD) camera. The temperature and relative humidity of the modified plate were controlled by a thermoelectric cooler, and the frosting process was visually observed. It was found that the nanoscale thin frost layer between the frozen condensates exists on the surface. The SPR imaging system was used to measure the change in the refractive index (RI) of the medium to characterize the near surface features due to the different stages of the refractive index corresponding to different stages of the frost layer. Ultimately, the spatial distribution of reflectance in relation to frost thickness was further investigated based on the principle that SPR imaging systems can quantify the frosting process, showing advantages of the method in detecting frost thickness.

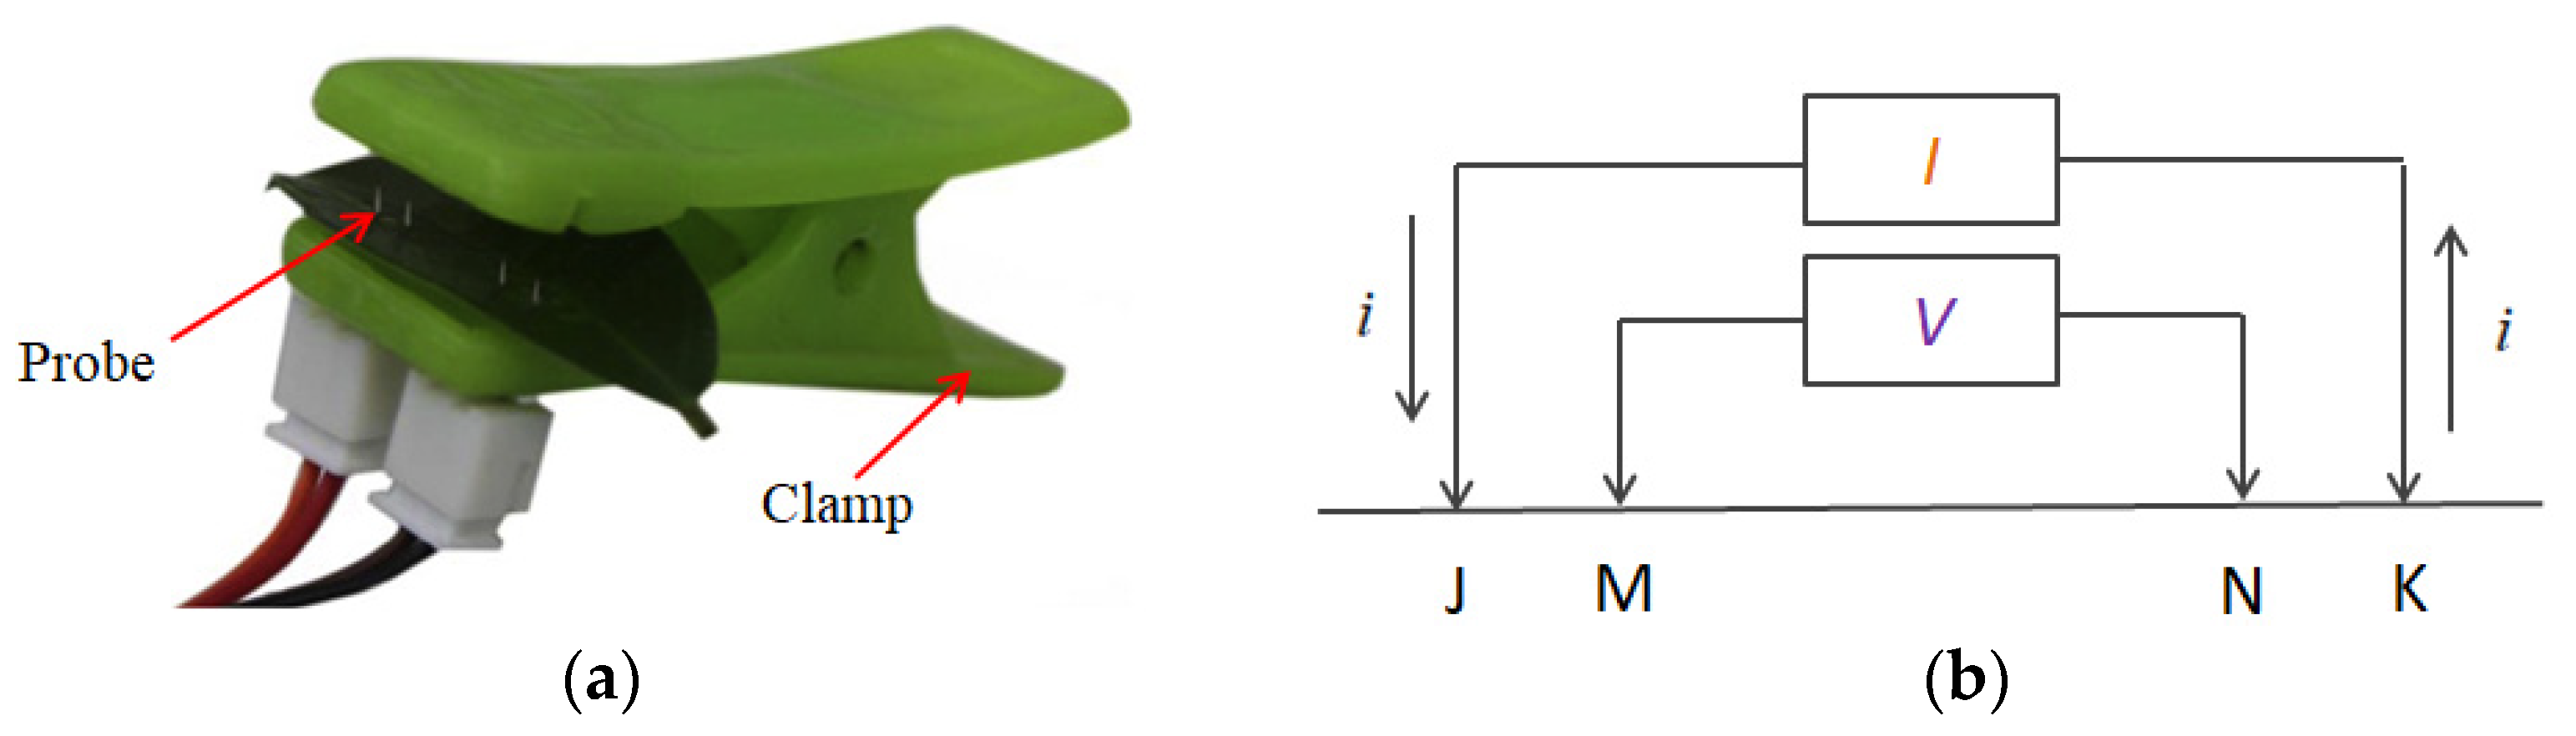
3.2. Plant Electrical Characteristics Detection

In order to measure the water content of plant leaves in real time, Zheng et al. [76] developed a plant electrical characteristics detection device based on the four-electrode method. The detection device is a clamping device, which can firmly clamp the leaves. Four small stainless-steel pins with a diameter of 0.7 mm were chosen as the probes on the edge of the clamp. To detect plant leaves, four probes were connected to wires and fixed to one side of the clip; two outside probes were connected to the power unit on the circuit board in order to inject a constant current through the plant. The probes pierced the plant tissue as the clip sandwiched the leaf. As shown in Figure 10, the two middle probes were connected to the sampling unit to collect the voltage drop signal for recognizing the plant’s electrical property.
The detection device can indirectly detect the changes in leaf water content before and after the frosting of plants, which has certain reference significance for the detection of plant leaf frosting. From the perspective of leaf–water balance, both the leaf surface and the inside of the leaf will be affected during the frosting process.
Therefore, it is also feasible to indirectly characterize the degree of frost by measuring the water content of plant leaves by considering the changes in water transportation.

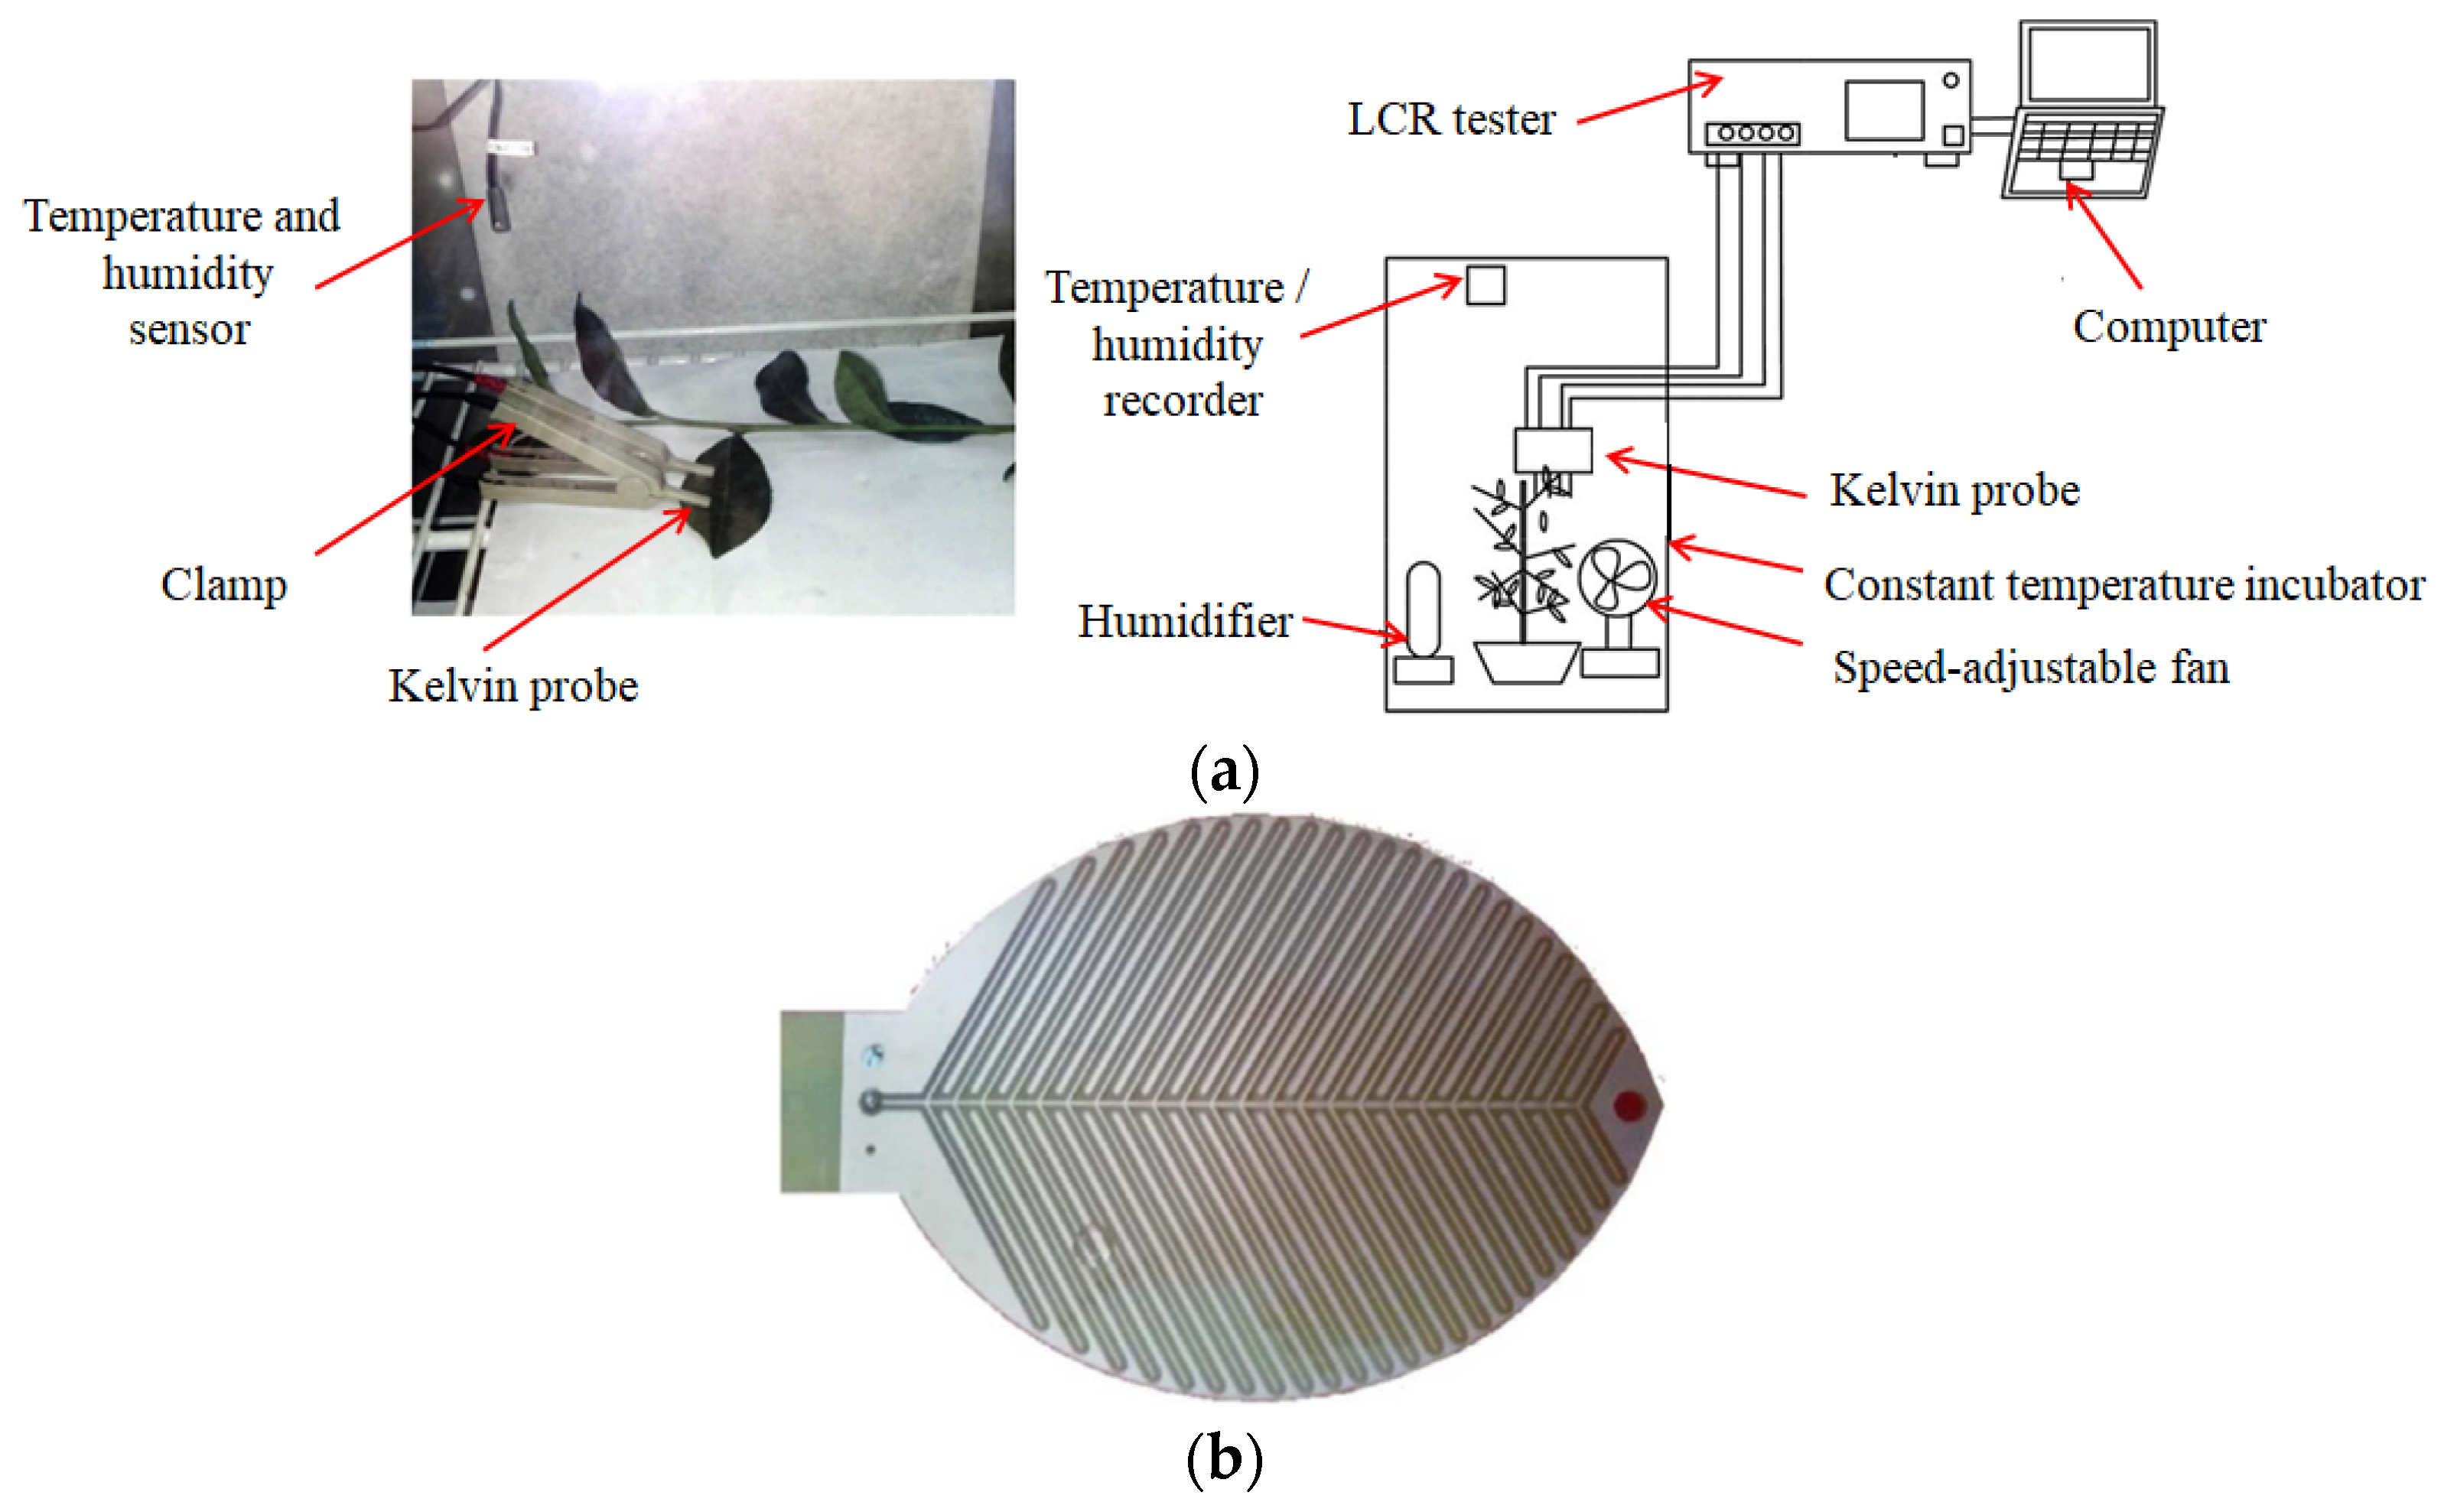
3.3. Capacitivity-Based Detection

The plant leaf frost damage electrical performance test system developed by Lu et al. [77] is mainly composed of a constant temperature incubator, a temperature and humidity recorder, a high precision tester (LCR), a computer, and a four-terminal Kelvin probe. As shown in Figure 11a, the tea plants were placed into the incubator for controlled precooling at 18 °C. The experimental temperatures were set at 0 °C, 2.0 °C, 4.0 °C, 6.0 °C, 8.0 °C and 10 °C for 0.5 h respectively. By clamping the tea leaves with the gripper, the changing electrical characteristics of the tea leaves were captured by the probe as an analogue signal, which was transmitted to the LCR tester for amplification and filtered into a digital signal, with the final data being stored, displayed, and processed by the PC. Although the plant electrical characteristics detection method has strong applicability and the detection device is simple and easy to use, the relationship between the collected plant electrical signal and the degree of frost is not closely related.
The capacitance-based leaf wetness sensor (LWS) was designed by Decagon Devices [79]. The contact surface is coated with a special coating so that the thermodynamic coefficient is close to the real leaf surface, and the thin glass fiber structure of the sensor is similar to a real leaf surface. The overall radiation balance of the leaves is very close, so water will condense and evaporate from the sensor, which is basically the same as the perception characteristics of normal leaves. As water or ice builds up on the sensor surface, the measured dielectric constant increases. As shown in Figure 11b, the leaf wetness sensor can measure the moisture, temperature, and humidity of air and object surfaces.
Once the water vapor in the air has risen until it is high enough to reach saturation, it will adhere to the surface of the LWS and as the temperature drops, the output voltage of the sensor will also rise. This condensation process is similar to the conditions for frost formation, but the mechanism is different in that dew is in a continuous phase change from the gas phase to the liquid phase, whereas frost crystals are in a discontinuous phase change from the gas phase directly to the solid phase.

3.4. Dielectric Property-Based Detection

Campbell Scientific, Inc. developed a frost sensor (Model 0871LH1) to detect the presence of frost and frost thickness based on resonance frequency technology. The main body of the sensor is a nickel alloy rod with a natural resonance frequency of 40 kHz. Its structure includes an ultrasonic vibration probe, a driving coil, a feedback coil, a magnet, a probe heating terminal, and a pillar heater. When the frequency of the rod is reduced by 130 Hz or the frost layer reaches 0.02 inches thick, the internal heater will automatically heat the sensor to de-ice, and the sensor will automatically reset. If the freezing rain sensor is kept in an icy environment, this cycle process will repeat. The frost signal activates at 0.5 mm ice accretion and stays on for 60 s after the end of the icing encounter. Specifically, when the output is activated, a 60 s timer is started. Each time 0.5 mm of frost forms on the probe, the 60 s counter is reset. This method uses the characteristics of resonance frequency change when the surface of the piezoelectric vibrator is frosted, and determines whether the resonance frequency is above a specified value as a frosting state, so as to detect whether frosting occurs.

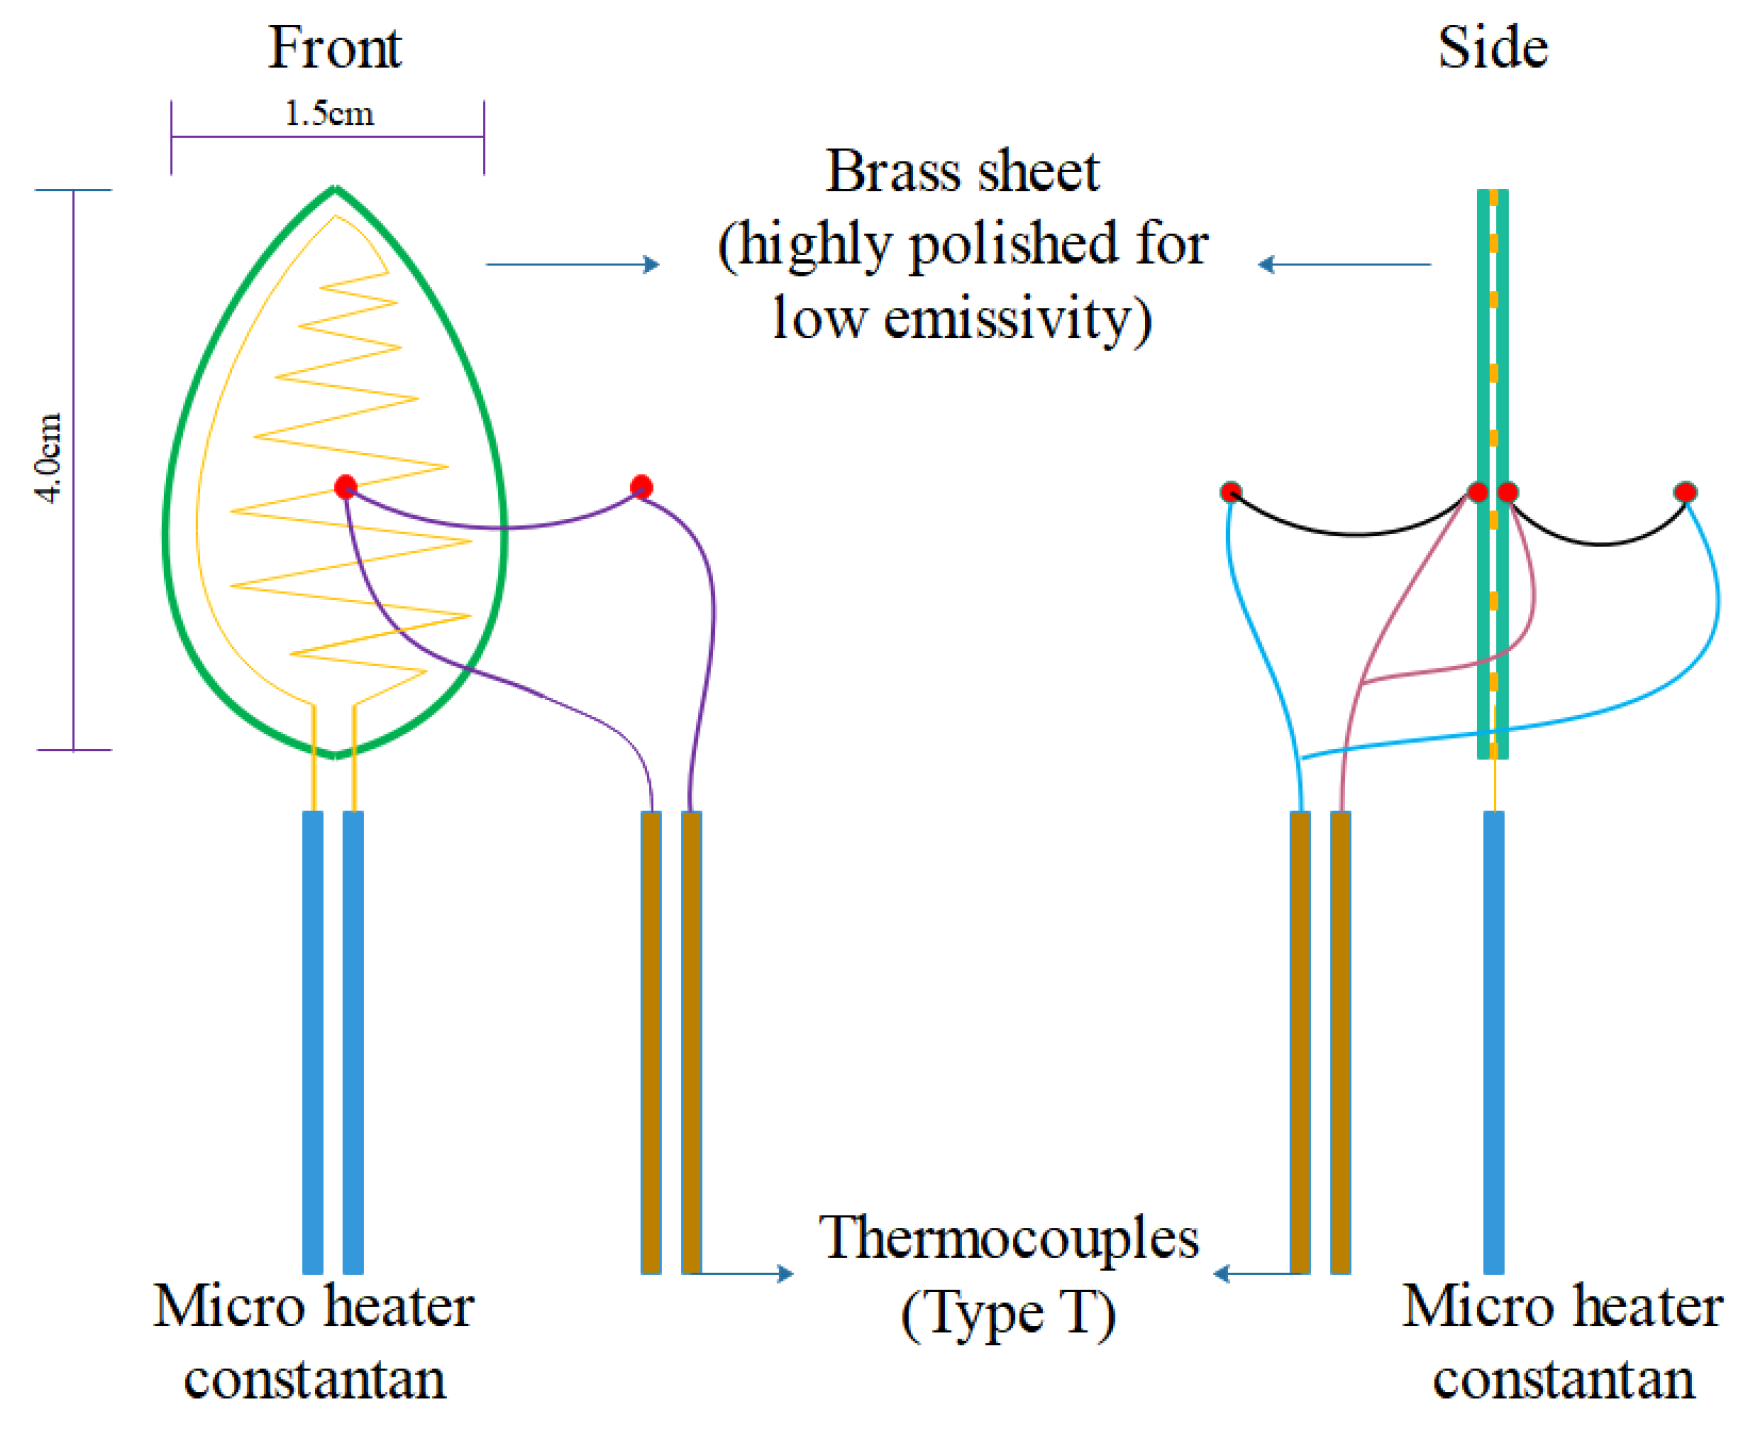
3.5. Pyroelectric Detection

Kensuke Kimura et al. [80] designed a thermocouple leaf temperature sensor in order to study the temporal and spatial distribution of leaf heat under frost protection in tea gardens. The sensor is shaped like a real plant leaf and is made of smooth brass plates. As shown in Figure 12, a pair of thermocouples of copper constantan wire with a 0.1 mm diameter was attached to each side of the leaf. One junction was attached to the leaf surface and the other was placed 1 cm from the surface. These two pairs of thermocouples were wired in parallel to detect the mean leaf-to-air temperature difference on both surfaces.
Although it can approximately replace some of the characteristics of real plant leaves to some extent, the ambient temperature during frost formation cannot uniquely characterize the presence of frost on leaves, so this method still has certain limitations. There are two different methods for measuring the temperature of plant leaves: the temperature on the leaf surface and the temperature inside the leaf. Through the observation of frost phenomena, it can be found that leaf surface temperature and internal temperature is also be reduced in different degrees with the loss of environmental temperature. Frost generally occurs on the leaf surface, and relative to the hot surface, frost will adhere to the cold surface. It can make detection more representative when based on real leaf surfaces by measuring the temperature inside the leaf and the leaf surface.

4. Comparison of Detection Performance

4.1. Summary and Discussion of Frost Detection Methods

The current methods and techniques for detecting frost formation on plant surfaces are systematically summarized and classified to gain some useful inspiration and reference for the development of current frost formation detection techniques. The comparison results are shown in Table 2, which includes a total of 10 related methods.
These 10 detection methods are further subdivided into contact detection and contactless detection according to their detection type. The phases of the detection process are the phase before frosting detection, the phase during frost detection, and the phase after frost detection. The test results are divided into two effect categories: whether it only detects frosting and whether it includes the quantitative characteristics of frost. Of course, the key factors that determine the feasibility of frost detection technology are not only the important related parameters; cost, complexity, accuracy, reliability, and other factors are important as well. Therefore, it is necessary to conduct a detailed comparison and analysis of the above devices and methods.
From the aspect of the frosting detection process, both contactless detection and contact detection are mostly conducted during the frosting process. Relatively speaking, there are fewer methods to detect before and after frosting. For example, light scattering, transmission, and diffraction are closely related to the real-time growth of frost when using optical principles to detect frost, but it doesn’t mean that all detections can be conducted in real-time during frosting. For instance, detecting the electrical characteristics of plant leaves with a probe is not a real-time detection method since the electrical conductivity is not significantly related to the real-time frosting process.
From the actual application of frost detection, contactless detection is the primary method, while contact detection is mainly about technique. For example, the test environment is established through a vector network analyzer and a microwave response resonance sensor to analyze amplitude, frequency, and other parameters of different frost stages based on the principle of a specific wave.
From the perspective of purpose and the results of frost detection, contactless detection mostly detects the characteristics of frost, while contactless detection mostly detects the occurrence of frost. In contrast, contactless detection is more reliable than contact detection in detecting frost on plant surfaces.
In terms of frost characteristic parameters, the necessary process parameters are mainly related to blade surface temperature, relative humidity, wind speed, net radiation, and sensor voltage; these parameters constitute background factors in the detection process but do not belong to the physical properties of the frost crystal itself. However, parameters such as frost thickness and frost density can effectively reflect the degree of frost condensation as a direct indicator of frost volume, but the prerequisite for obtaining such parameters requires an accurate mathematical model.

4.2. Key Problem Analysis—Frost Quantity

As can be seen from these methods, focus on the frost detection problem in the study of physical properties of the frost layer, density of the frost layer, thermal conductivity, and the diffusion coefficient of water vapor in the frost layer are very important parameters. The physical properties of the frost layer are determined by frosting environmental conditions and are closely related to the changes in the frosting process, which change continuously with the growth of frost layer.

4.2.1. Frost Layer Density

Hayashi divides the growth of frost into three periods: the crystal growth period, the frost growth period, and the frost full growth period [12]. The growth of the frost layer in each period has its own characteristics and there is a linear relationship between frost density and effective thermal conductivity of the frost layer, which affects defrosting efficiency.
The frost layer density depends on the shape and size of frost crystals, and the structure of each frost crystal depends on the frost layer’s surface temperature, which is determined by cold surface temperature as well as ambient temperature; frost crystal size depends on ambient humidity [81]. Moreover, some literature [82,83,84] shows that the average density of the frost layer increases with time and the distribution along the thickness direction is nonuniform.
Many factors such as ambient temperature, ambient humidity, cold surface temperature, and frosting time can affect frost layer density. There are still many difficulties when accurately analyzing the changing law of frost layer density, theoretically speaking. Some expressions currently obtained about frost density are empirical formulas and summarized in Table 3.

4.2.2. Frost Layer Thermal Conductivity

Current research shows frost layer thermal conductivity is not only a function of frost layer density but is also affected by frost layer structure [84]. At present, there two main methods for studying frost layer thermal conductivity: obtaining data through experiments and fitting the thermal conductivity expression, and establishing a frost layer structure model theoretically derived from frost layer thermal conductivity. The primary results are shown in Table 4.

4.2.3. Frost Layer Thickness

Frost layer thickness detection is an important parameter for frost detection; it is easier and more intuitive to detect compared with other measurement parameters. Therefore, a large part of the current research on frost characteristics involves the detection of frost thickness. As shown in Table 5, the measurement of frost layer thickness is divided into two categories: experimental verification and model calculation. Model calculation is directly related to environmental variables such as leaf temperature, air temperature, ambient humidity, and effective saturated vapor pressure difference. Based on frost thickness, various frost characteristics such as density, volume, or frost mass can be further obtained. Therefore, frost thickness measurements have great significance for plant frost detection.

5. Future Research Proposal

5.1. Research and Development

Plant surface frost is closely related to surrounding environmental conditions. It not only depends on factors such as temperature, wind speed, and relative humidity, but also varies by plant species and growth stages, especially at night, which makes real-time detection and identification more difficult. Analyzing current detection methods has significance for the development of new trends in the future, and the following ideas might provide some new inspiration.

5.2. Based on the Spectral Analysis Methods

Plant leaves are generally sensitive to frost response. Take tea tree leaves as an example; its frost damage generally starts from the leaf tip, moves across the leaf edge to the middle of the leaf, and scorches the leaf, changing it from red and yellow-brown to black-brown. After the frost leaf sap exudes and meets the air, oxidation occurs, causing the leaf to be scorched red. With the increasing maturity of spectral technology in recent years, its qualitative and quantitative detection characteristics have been used for a wide range of crop objects. For the physiological characteristics of plants subjected to frost, a rapid quantitative relationship between the degree of frost and the corresponding plant physiology might be achieved based on spectral analysis methods.

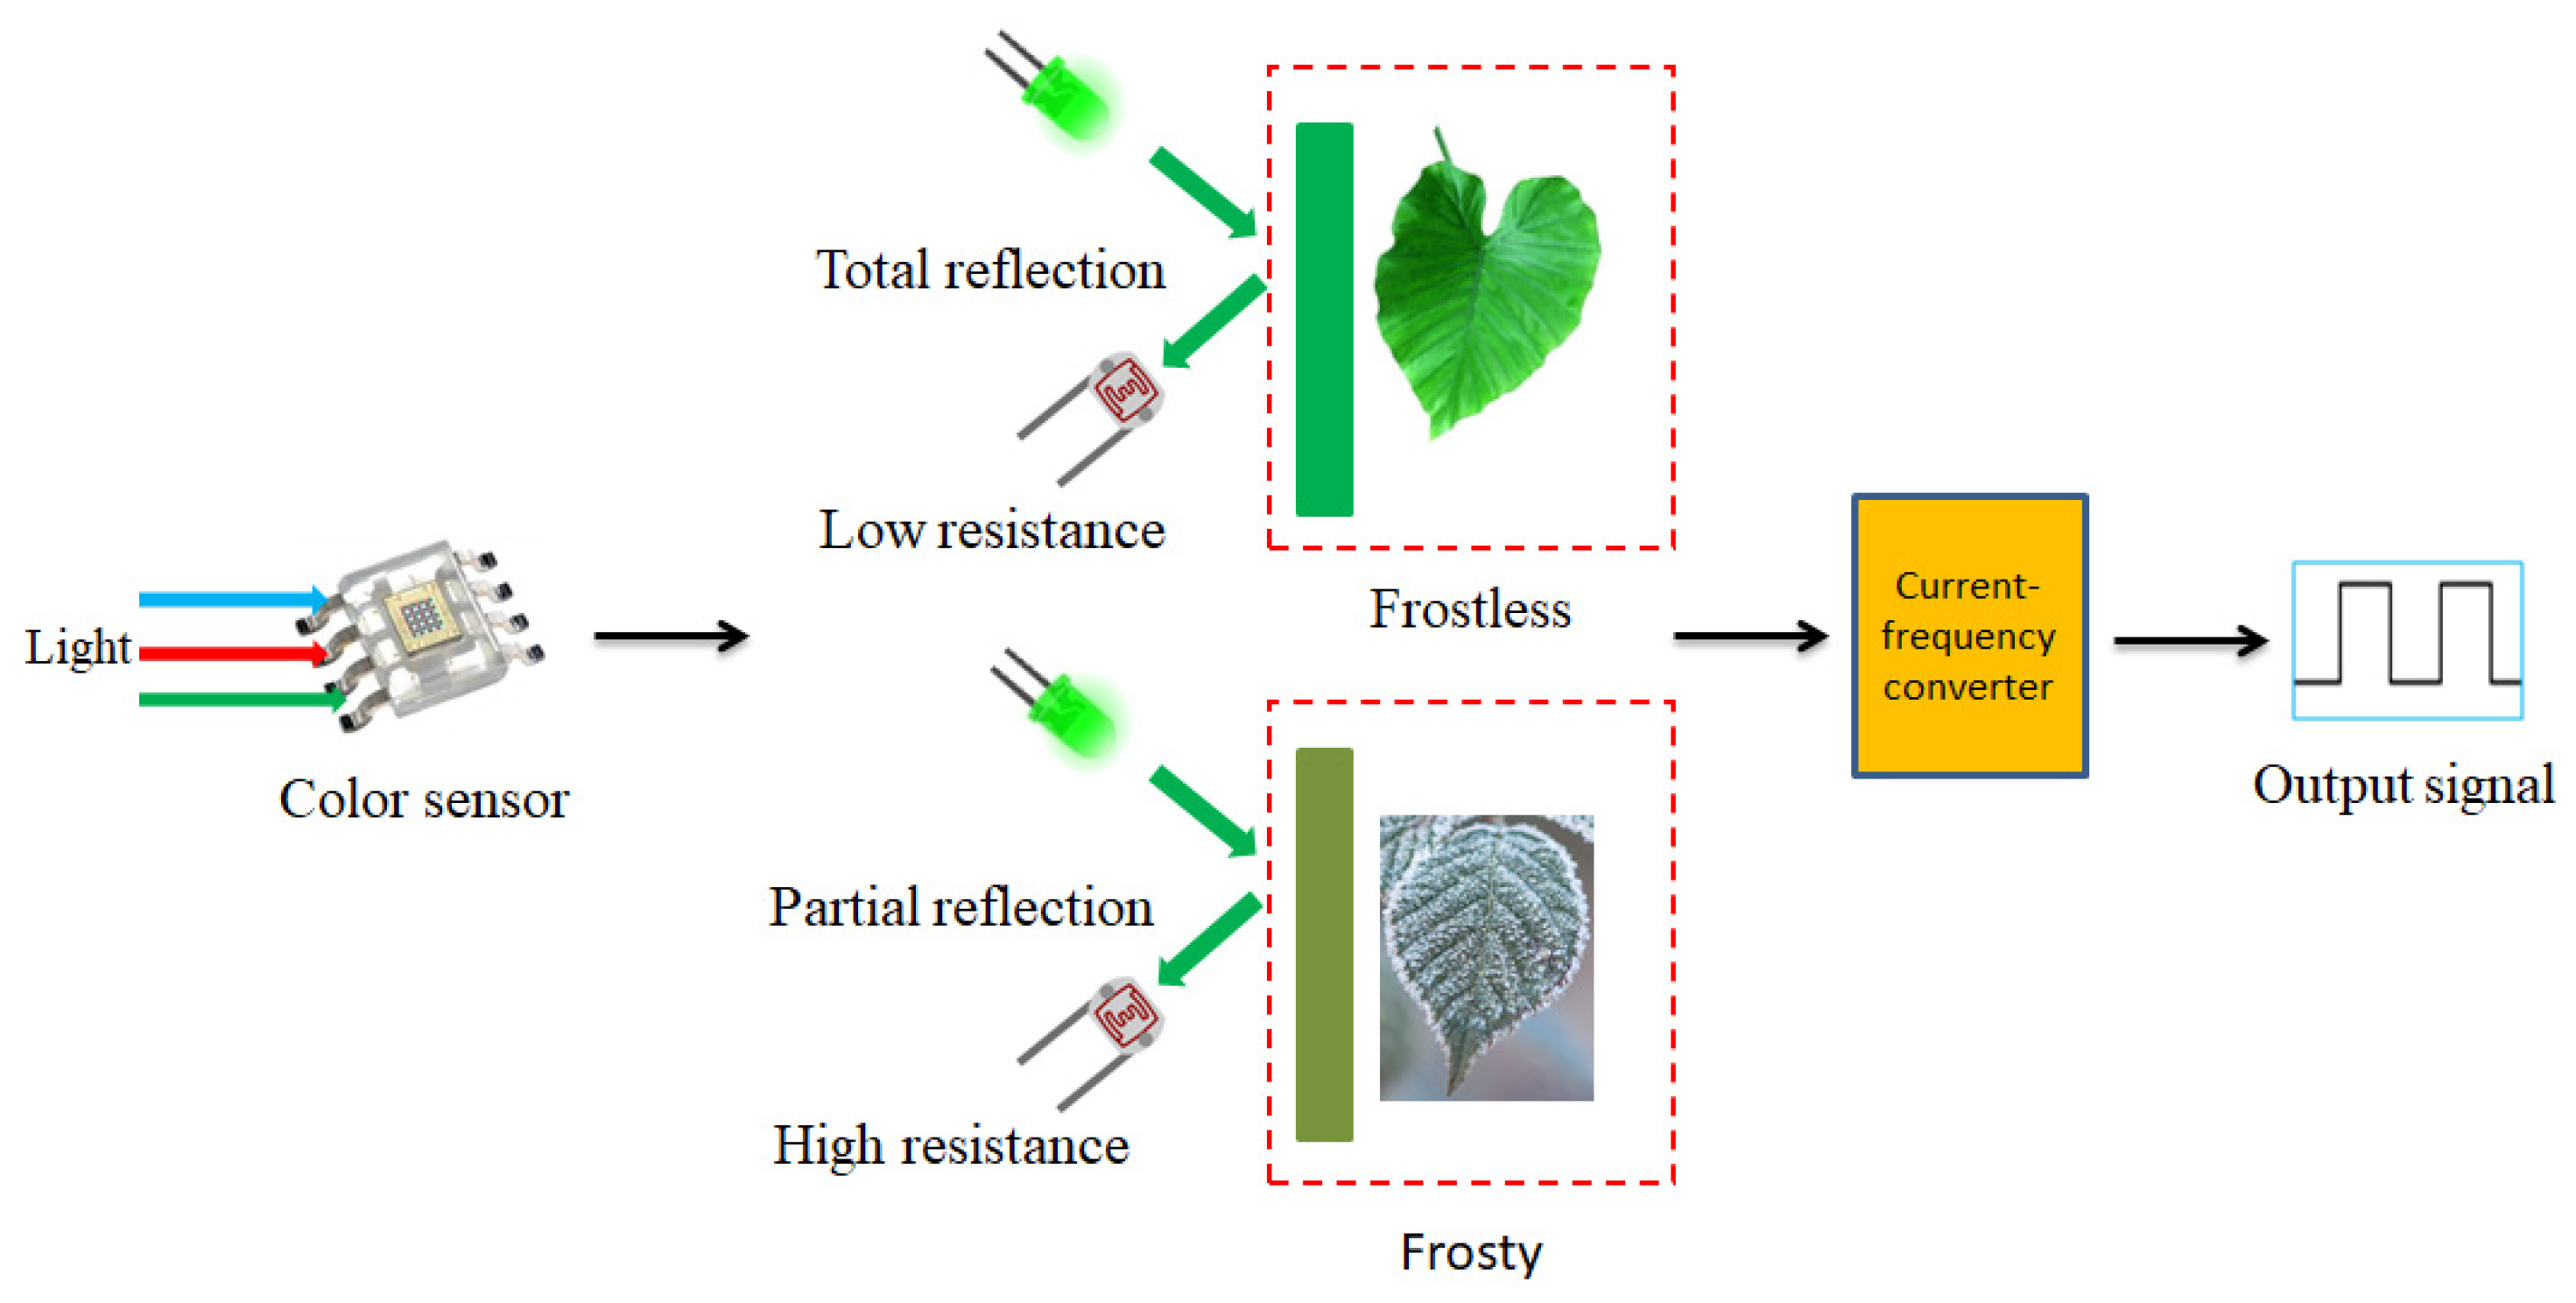
5.3. Based on the Color Sensing Technology

If we consider the color aspect of the frost on the plant’s surface, it could be practical to detect frost using color-sensing technology. For green leaves, a green to white color change will occur over time and the frost will eventually cover the leaf surface completely. The color of the leaf’s surface gradually changes as frost crystals continue to grow because the frost crystals can reflect white under light conditions. As shown in Figure 13, the principle of color-sensing technology is to extract the red green blue (RGB) pixel values via different color filters and compare the object color with the reference color, which is already shown to detect the color sensor and produce the detection result when the two colors match within a certain error range.

5.4. Based on Deep Learning Methods

At present, deep learning has continuously achieved better and better results in the field of image classification and recognition [93]. Deep Learning is a field of machine learning that is very close to artificial intelligence, which is motivated by building, simulating the human brain for analytical learning, and neural networks that can extract features of complex objects more intelligently. In order to improve the accuracy of image recognition, many researchers have begun to use it for image classification and recognition in specific scenarios [94]. Unlike traditional feature extraction algorithms that rely on image pixel value processing, deep convolutional neural networks have a certain degree of adaptability to pixel correlation, deformation, and illumination, and can adaptively extract features for self-learning driven by a large amount of training data. In addition, it has a higher fault tolerance rate and generalization ability. Predictably, using deep learning to detect frost on a plant’s leaf surface will be a mainstream trend in the future.

6. Conclusions

Despite the fact that plant surface frosting mechanisms are a common weather phenomenon in nature, excessive frosts are bound to have a severe impact on agricultural production, especially for cash crops, and will lead to significant direct losses. In order to reduce losses and improve frost control strategies, researchers have made intensive efforts in recent decades to measure and calculate frost characteristics. These efforts include attempts to unravel the mechanisms of frost on plant surfaces and observing the presence or absence of frost and other quantitative characteristics. Based on the available literature on the subject, in this review work, ten methods for detecting plant surface frost were presented and further classified according to different detection types. Moreover, frost characteristics such as frost density, thermal conductivity, thickness, and numerical models were listed to emphasize the important variables for frost detection. Finally, three potential avenues of research were proposed as possible future trends in the detection of frost on plant surfaces.

Author Contributions

Conceptualization, H.S.; writing—review and editing, H.S.; visualization, H.S., Y.H., Y.L., J.W., Q.P. and P.L.; supervision, Y.H. All authors have read and agreed to the published version of the manuscript.

Funding

This research was funded by Natural Science Foundation of the Jiangsu Higher Education Institutions of China (21KJB210019), China and Jiangsu Postdoctoral Science Foundation (2016M600376 and 2021K614C), Priority Academic Program Development of Jiangsu Higher Education Institutions (PAPD-2018-87).

Institutional Review Board Statement

Not applicable.

Data Availability Statement

Not applicable.

Acknowledgments

The authors are thankful to the reviewers for providing insightful and constructive comments and suggestions that have improved the content and exposition of this final product.

Conflicts of Interest

The authors declare no conflict of interest.

References

  1. Sheng, W.; Liu, P.; Dang, C.; Liu, G. Review of restraint frost method on cold surface. Renew. Sustain. Energy Rev. 2017, 79, 806–813. [Google Scholar] [CrossRef]
  2. Seker, D.; Karatas, H.; Egrican, N. Frost formation on fin-and-tube heat exchangers. Part I—Modeling of frost formation on fin-and-tube heat exchangers. Int. J. Refrig. 2004, 27, 367–374. [Google Scholar] [CrossRef]
  3. Song, M.; Deng, S.; Dang, C.; Mao, N.; Wang, Z. Review on improvement for air source heat pump units during frosting and defrosting. Appl. Energy 2018, 211, 1150–1170. [Google Scholar] [CrossRef]
  4. Rafati Nasr, M.; Fauchoux, M.; Besant, R.; Simonson, C. A review of frosting in air-to-air energy exchangers. Renew. Sustain. Energy Rev. 2014, 30, 538–554. [Google Scholar] [CrossRef]
  5. Ribeiro, A.C.; De Melo-Abreu, J.P.; Snyder, R.L. Apple orchard frost protection with wind machine operation. Agric. For. Meteorol. 2006, 141, 71–81. [Google Scholar] [CrossRef]
  6. Rossi, F.; Facini, O.; Loreti, S.; Nardino, M.; Georgiadis, T.; Zinoni, F. Meteorological and micrometeorological applications to frost monitoring in northern Italy orchards. Phys. Chem. Earth Parts A B C 2002, 27, 1077–1089. [Google Scholar] [CrossRef]
  7. Black, P. Advances in Bioclimatology, Vol. 2: The Bioclimatology of Frost. Its Occurrence, Impact and Protection. J. Environ. Qual. 1993, 22, 635. [Google Scholar] [CrossRef]
  8. Paw, U.K.T.; Gao, W. Applications of solutions to non-linear energy budget equations. Agric. For. Meteorol. 1988, 43, 121–145. [Google Scholar] [CrossRef]
  9. Huschke, R.E. Glossary of Meteorology; American Meteorological Society: Boston, MA, USA, 1959; p. 638. [Google Scholar]
  10. Lee, Y.B.; Ro, S.T. Frost formation on a vertical plate in simultaneously developing flow. Exp. Therm. Fluid Sci. 2002, 26, 939–945. [Google Scholar] [CrossRef]
  11. Tao, Y.; Besant, R.; Rezkallah, K. A Mathematical Model for Predicting the Densification and Growth of Frost on a Flat Plate. Int. J. Heat Mass Transf. 1993, 36, 353–363. [Google Scholar] [CrossRef]
  12. Hayashi, Y.; Aoki, A.; Adachi, S.; Hori, K. Study of Frost Properties Correlating with Frost Formation Types. J. Heat Transf. 1977, 99, 239–245. [Google Scholar] [CrossRef]
  13. Zhang, T.; O’Neal, D.L.; McClain, S.T. Analysis of frost thickness and roughness growth from the perspective of frost crystal structure. Int. J. Refrig. Rev. Int. Du Froid 2020, 112, 314–323. [Google Scholar] [CrossRef]
  14. Shirin, N.; Melanie, T.F. Experimental Characterization of Frost Growth on a Horizontal Plate Under Natural Convection. J. Therm. Sci. Eng. Appl. 2019, 11, 011020-1–011020-13. [Google Scholar] [CrossRef]
  15. Schultz, H.B. Microclimates on Spring Frost Nights in Napa Valley Vlneyards. Am. J. Enol. Vitic. 1961, 12, 81. [Google Scholar]
  16. Perry, K. Basics of Frost and Freeze Protection for Horticultural Crops. HortTechnology 1998, 8, 10–15. [Google Scholar] [CrossRef] [Green Version]
  17. Ambroise, V.; Legay, S.; Guerriero, G.; Hausman, J.F.; Cuypers, A.; Sergeant, K. The Roots of Plant Frost Hardiness and Tolerance. Plant Cell Physiol. 2019, 61, 3–20. [Google Scholar] [CrossRef] [Green Version]
  18. Suzuki, S.; Arai, T. Does frost really bring injury to plants? J. Agric. Meteorol. 1952, 7, 127–130. [Google Scholar] [CrossRef]
  19. Richards, K. Observation and simulation of dew in rural and urban environments. Prog. Phys. Geogr. Earth Environ. 2004, 28, 76–94. [Google Scholar] [CrossRef]
  20. Malinovic, S.; Stanojevic, G.; Radovanovic, M.M. Recent changes in first and last frost dates and frost-free period in Serbia. Geogr. Ann. Ser. A Phys. Geogr. 2018, 100, 44–58. [Google Scholar] [CrossRef]
  21. Dominguez-Castro, F.; Gallego, M.C.; Vaquero, J.M.; Herrera, R.G.; Pea-Gallardo, M.; El Kenawy, A.; Vicente-Serrano, S.M. Twelve Years of Daily Weather Descriptions in North America in the Eighteenth Century (Mexico City, 1775–1786). Bull. Am. Meteorol. Soc. 2019, 100, 1531–1547. [Google Scholar] [CrossRef] [Green Version]
  22. Fan, J.; Zhang, M.; Cao, G.; Zhang, X.; Liu, C.; Niu, X.; Xu, W. Frost Monitoring of Fruit Tree with Satellite Data. In Remote Sensing for Agriculture, Ecosystems, and Hydrology XIV; International Society for Optics and Photonics: Bellingham, WA, USA, 2012. [Google Scholar]
  23. Szalay, L.; Gyrgy, Z.; Tth, M. Frost hardiness of apple (Malus X domestica) flowers in different phenological phases. Sci. Hortic. 2019, 253, 309–315. [Google Scholar] [CrossRef]
  24. Atam, E.; Hong, S.-W.; Arteconi, A. Thermofluid Modelling of Large-Scale Orchards for Optimal Design and Control of Active Frost Prevention Systems. Energies 2020, 13, 378. [Google Scholar] [CrossRef] [Green Version]
  25. Pakkish, Z.; Tabatabaienia, M. The use and mechanism of NO to prevent frost damage to flower of apricot. Sci. Hortic. 2016, 198, 318–325. [Google Scholar] [CrossRef]
  26. Wu, X.; Dai, W.; Xu, W.; Tang, L. Mesoscale investigation of frost formation on a cold surface. Exp. Therm. Fluid Sci. 2007, 31, 1043–1048. [Google Scholar] [CrossRef]
  27. O’Neal, D.; Tree, D.R. A review of frost formation in simple geometries. ASHRAE Trans. 1985, 91, 267–281. [Google Scholar]
  28. Leoni, A.; Mondot, M.; Durier, F.; Revellin, R.; Haberschill, P. Frost formation and development on flat plate: Experimental investigation and comparison to predictive methods. Exp. Therm. Fluid Sci. 2017, 88, 220–233. [Google Scholar] [CrossRef]
  29. Huang, L.; Liu, Z.; Liu, Y.; Gou, Y. Experimental study of frost growth on a horizontal cold surface under forced convection. J. Mech. Sci. Technol. 2010, 24, 1523–1529. [Google Scholar] [CrossRef]
  30. Östin, R.; Andersson, S. Frost Growth Parameters in a Forced Air Stream. Int. J. Heat Mass Transf. 1991, 34, 1009–1017. [Google Scholar] [CrossRef]
  31. O’Neal, D.; Tree, D.R. Measurement of frost growth and density in a parallel plate geometry. ASHRAE Trans. 1984, 90, 278–290. [Google Scholar]
  32. Lee, K.S.; Kim, W.-S.; Lee, T.-H. A One-Dimensional Model for Frost Formation on a Cold Flat Surface. Int. J. Heat Mass Transf. 1997, 40, 4359–4365. [Google Scholar] [CrossRef]
  33. Cheng, C.H.; Shiu, C.-C. Frost formation and frost crystal growth on a cold plate in atmospheric air flow. Int. J. Heat Mass Transf. 2002, 45, 4289–4303. [Google Scholar] [CrossRef]
  34. Lu, Y.; Hu, Y.; Snyder, R.L.; Kent, E.R. Tea leaf’s microstructure and ultrastructure response to low temperature in indicating critical damage temperature. Inf. Process. Agric. 2019, 6, 247–254. [Google Scholar] [CrossRef]
  35. Schwartze, J.P.; Brocker, S. The evaporation of water into air of different humidities and the inversion temperature phenomenon. Int. J. Heat Mass Transf. 2000, 43, 1791–1800. [Google Scholar] [CrossRef]
  36. Yu, L.P.; Wang, C.; Wang, Z.H. Quantitative Evaluation Model of Frost Disaster in Early Spring Tea in Zhejiang Province. Meteorol. Environ. Sci. 2017, 40, 44–48. (In Chinese) [Google Scholar]
  37. Jian, Y. The advance in frost injury research of fruit trees. J. Agric. Univ. Hebei 2000, 23, 54–58. [Google Scholar]
  38. He, S.; Zhang, Y.; Yang, W. Fabrication and Frosting Properties Study of Surface-Active Agents Coating Based on Nanoporous Aluminum Substrate. Energies 2018, 11, 2797. [Google Scholar] [CrossRef] [Green Version]
  39. Esmeryan, K.D.; Castano, C.E.; Mohammadi, R.; Lazarov, Y.; Radeva, E.I. Delayed condensation and frost formation on superhydrophobic carbon soot coatings by controlling the presence of hydrophilic active sites. J. Phys. D Appl. Phys. 2018, 51, 055302. [Google Scholar] [CrossRef]
  40. Yao, Y.; Jiang, Y.; Deng, S.; Ma, Z. A study on the performance of the airside heat exchanger under frosting in an air source heat pump water heater/chiller unit. Int. J. Heat Mass Transf. 2004, 47, 3745–3756. [Google Scholar] [CrossRef]
  41. Boreyko, J.B.; Collier, C.P. Delayed frost growth on jumping-drop superhydrophobic surfaces. ACS Nano 2013, 7, 1618–1627. [Google Scholar] [CrossRef]
  42. Wei, C.; Jin, B.; Zhang, Q.; Zhan, X.; Chen, F. Anti-icing performance of super-wetting surfaces from icing-resistance to ice-phobic aspects: Robust hydrophobic or slippery surfaces. J. Alloy. Compd. 2018, 765, 721–730. [Google Scholar] [CrossRef]
  43. Chen, T.; Yan, W.; Hongtao, L.; Zhu, W.; Guo, K.; Li, J. Facile preparation of superamphiphobic phosphate-Cu coating on iron substrate with mechanical stability, anti-frosting properties, and corrosion resistance. J. Mater. Sci. 2017, 52, 4675–4688. [Google Scholar] [CrossRef]
  44. Lee, J.; Jeong, H.; Kim, D.R.; Lee, K.-S. Frost layer growth behavior under cryogenic conditions. Appl. Therm. Eng. 2019, 163, 114333. [Google Scholar] [CrossRef]
  45. Gong, J.; Hou, J.; Li, G.; Gao, T.; Sun, J. A lattice Boltzmann study of frost growth on a cold surface. Int. Commun. Heat Mass Transf. 2018, 98, 116–124. [Google Scholar] [CrossRef]
  46. Liping, X.; Xianmin, G.; Zhen, X. Experimental Study of Frost Growth Characteristics on Surface of Fin-tube Heat Exchanger. Energy Procedia 2017, 105, 5114–5121. [Google Scholar] [CrossRef]
  47. Lee, J.; Kim, J.; Kim, D.R.; Lee, K.-S. Modeling of frost layer growth considering frost porosity. Int. J. Heat Mass Transf. 2018, 126, 980–988. [Google Scholar] [CrossRef]
  48. Song, M.; Dang, C. Review on the measurement and calculation of frost characteristics. Int. J. Heat Mass Transf. 2018, 124, 586–614. [Google Scholar] [CrossRef]
  49. Lu, Y.Z.; Hu, Y.G.; Tian, J.T.; Song, H.; Snyder, R.L. Artificial Radiation Frost Chamber for Frost Formation on Tea. Appl. Sci. 2019, 9, 4726. [Google Scholar] [CrossRef] [Green Version]
  50. Kotikot, S.M.; Flores, A.; Griffin, R.E.; Irwin, D.E. Statistical characterization of frost zones: Case of tea freeze damage in the Kenyan highlands. Int. J. Appl. Earth Obs. Geoinf. 2020, 84, 101971. [Google Scholar] [CrossRef]
  51. Vieira Junior, N.A.; Caramori, P.H.; de Aguiar e Silva, M.A.; Nitsche, P.R. Minimum temperature differences between the meteorological screen and grass in radiative frost nights. Semin. Cienc. Agrar. 2018, 38, 2337–2349. [Google Scholar] [CrossRef]
  52. Unterberger, C.; Brunner, L.; Nabernegg, S. Spring frost risk for regional apple production under a warmer climate. PLoS ONE 2018, 13, e0200201. [Google Scholar] [CrossRef]
  53. Kiktev, D.; Astakhova, E.; Zaripov, R.; Murav’ev, A.; Smirnov, A.; Tsyrulnikov, M. FROST-2014 Project and Meteorological Support of the Sochi-2014 Olympics. Russ. Meteorol. Hydrol. 2015, 40, 504–512. [Google Scholar] [CrossRef]
  54. Tomczyk, A.M.; Szyga-Pluta, K.; Bednorz, E. Occurrence and synoptic background of strong and very strong frost in spring and autumn in Central Europe. Int. J. Biometeorol. 2020, 64, 59–70. [Google Scholar] [CrossRef] [PubMed] [Green Version]
  55. Shin, J.; Tikhonov, A.V.; Kim, C. Experimental study on frost structure on surfaces with different hydrophilicity: Density and thermal conductivity. J. Heat Transf. Trans. Asme 2003, 125, 84–94. [Google Scholar] [CrossRef]
  56. Lu, Y.Z.; Hu, Y.G.; Li, P.P.; Paw, U.K.T.; Snyder, R.L. Prediction of Radiation Frost Using Support Vector Machines Based on Micrometeorological Data. Appl. Sci. 2020, 10, 283. [Google Scholar] [CrossRef] [Green Version]
  57. Yan, H.; Zhang, C.; Coenders-Gerrits, M.; Acquah, S.; Zhang, H.; Wu, H.; Zhao, B.; Huang, S.; Fu, H. Parametrization of aerodynamic and canopy resistances for modeling evapotranspiration of greenhouse cucumber. Agric. For. Meteorol. 2018, 262, 370–378. [Google Scholar] [CrossRef]
  58. Ball, J.; Woodrow, I.; Berry, J. A Model Predicting Stomatal Conductance and Its Contribution to the Control of Photosynthesis Under Different Environmental Conditions. Prog. Photosynth. Res. 1987, 4, 221–224. [Google Scholar] [CrossRef]
  59. Salisbury, J.W.; Aria, D.M.; Wald, A. Measurements of thermal infrared spectral reflectance of frost, snow, and ice. J. Geophys. Res. Solid Earth 1994, 99, 24235–24240. [Google Scholar] [CrossRef]
  60. Hu, Y. Mechanism and Control Technology of Late Frost for Tea Plant through Air Disturbance. Ph.D. Thesis, Jiangsu University, Zhenjiang, China, 2011. (In Chinese). [Google Scholar]
  61. Goswami, J.; Sharma, V.; Choudhury, B.; Raju, P. Rapid identification of abiotic stress (frost) in in-filed maize crop using UAV. Int. Arch. Photogramm. Remote. Sens. Spat. Inf. Sci. 2019, XLII-3/W6, 467–471. [Google Scholar] [CrossRef] [Green Version]
  62. Nuttall, J.G.; Perry, E.M.; O’Leary, G.J.; Barlow, K.M.; Wallace, A.J. Frost response in wheat and early detection using proximal sensors. J. Agron. Crop. Sci. 2019, 205, 220–234. [Google Scholar] [CrossRef] [Green Version]
  63. Zhu, L.; Cao, Z.; Zhuo, W.; Yan, R.; Ma, S. A New Dew and Frost Detection Sensor Based on Computer Vision. J. Atmos. Ocean. Technol. 2014, 31, 2692–2712. [Google Scholar] [CrossRef]
  64. Janssen, D.; Mohs, B.; Kulacki, F. Frost Layer Growth Based on High Resolution Image Analysis. J. Therm. Sci. Eng. Appl. 2016, 8, 021018. [Google Scholar] [CrossRef]
  65. Zhu, L.; Cao, Z.; Zhuo, W.; Yan, R. A Method of Frost Observation Based on Intensity Changing Regularity Simulation and Texture Analysis. In Mippr 2011: Pattern Recognition and Computer Vision; Roberts, J., Ma, J., Eds.; SPIE: Bellingham, WA, USA, 2011; Volume 8004. [Google Scholar]
  66. Wang, W.; Guo, Q.C.; Lu, W.P.; Feng, Y.C.; Na, W. A generalized simple model for predicting frost growth on cold flat plate. Int. J. Refrig. 2012, 35, 475–486. [Google Scholar] [CrossRef]
  67. Mu, P.P.; Zhang, S.Y.; Zhang, Y.; Ye, X.Z.; Pan, X. Image-based 3D model retrieval using manifold learning. Front. Inf. Technol. Electron. Eng. 2018, 19, 1397–1408. [Google Scholar] [CrossRef]
  68. Zhou, Z.; Wu, J.; Zhu, L. Dew image classification based on multi-path feature fusion and deep learning. Comput. Appl. Softw. 2008, 35, 205–210. (In Chinese) [Google Scholar]
  69. Zhang, L.H.; Zhang, J.; Li, H.-W.; Hu, Q. The research of optical fiber frost sensor and intelligent refrigerator defrost system. In Proceedings of the 2012 IEEE 11th International Conference on Signal Processing, Beijing, China, 21–25 October 2012; p. 2199. [Google Scholar]
  70. Wang, W.; Zhang, F.; Xiao, J.; Zhao, Y. Feasibility study of photoelectric coupling on-line frost detection technology. J. Appl. Found. Eng. Sci. 2010, 18, 299–303. (In Chinese) [Google Scholar]
  71. Xiao, J.; Wang, W.; Guo, Q.C.; Zhao, Y.H. An experimental study of the correlation for predicting the frost height in applying the photoelectric technology. Int. J. Refrig. Rev. Int. Du Froud 2010, 33, 1006–1014. [Google Scholar] [CrossRef]
  72. Wu, X.; Dai, W.; Wang, W. Interface evolution and mechanism analysis of frost crystal growth. J. Tsinghua Univ. 2007, 8, 1352–1355. [Google Scholar]
  73. Dong, J.; Wang, W.; Dong, Z. Real-time measurement for evaporator frosting rate. Laser Technol. 2000, 24, 179–181. [Google Scholar]
  74. Wiltshire, B.; Mir, S.K.; Golovkin, K.; Zarifi, M.H. Robust and sensitive frost and ice detection via planar microwave resonator sensor. Sens. Actuators B Chem. 2019, 301, 126881. [Google Scholar] [CrossRef]
  75. Chan, H.J.; Dong, H.S.; Vina, K.K.; Jeffrey, S.A.; Chang, K.C. Quantitative measurements of nanoscale thin frost layers using surface plasmon resonance imaging. Int. J. Heat Mass Transf. 2018, 124, 83–89. [Google Scholar] [CrossRef]
  76. Zheng, L.; Wang, Z.; Sun, H.; Zhang, M.; Li, M. Real-time evaluation of corn leaf water content based on the electrical property of leaf. Comput. Electron. Agric. 2015, 112, 102–109. [Google Scholar] [CrossRef]
  77. Lu, Y.; Hu, Y.; Li, P. Consistency of electrical and physiological properties of tea leaves on indicating critical cold temperature. Biosyst. Eng. 2017, 159, 89–96. [Google Scholar] [CrossRef]
  78. Gemma, H.; Jorge, E.G.; Ernesto, S.F. A novel low-cost smart leaf wetness sensor. Comput. Electron. Agric. 2017, 143, 286–292. [Google Scholar] [CrossRef] [Green Version]
  79. Grant, G.; Scott, L.; Roy, R.; Jennifer, B.; Andrew, G. A Combined Sensor Method for Detecting Frost Formation. Am. Meteorol. Soc. 2010, 11, 16–21. [Google Scholar]
  80. Kimura, K.; Yasutake, D.; Nakazono, K.; Kitano, M. Dynamic distribution of thermal effects of an oscillating frost protective fan in a tea field. Biosyst. Eng. 2017, 164, 98–109. [Google Scholar] [CrossRef]
  81. Sahin, A.Z. An experimental study on the initiation and growth of frost formation on a horizontal plate. Exp. Heat Transf. 1994, 7, 101–119. [Google Scholar] [CrossRef]
  82. Yonko, J.D.; Sepsy, C.F. An investigation of the thermal conductivity of frost on a flat plate. ASHRAE Trans. 1967, 73, 12–16. [Google Scholar]
  83. Mao, Y.; Besant, R.W.; Rezkallah, K.S. Measurement and correlations of frost properties with airflow over a flat plate. ASHRAE Trans. 1992, 98, 65–77. [Google Scholar]
  84. Yu, W.P. Experimental Study and Theory Analyses on Frost Formation. Ph.D. Dissertation, Southeast University, Dhaka, Bangladesh, 2006. (In Chinese). [Google Scholar]
  85. Christian, J.H.; Robson, O.P.; Barbosa, J.R. A study of frost growth and densification on flat surfaces. Exp. Therm. Fluid Sci. 2009, 33, 371–379. [Google Scholar] [CrossRef]
  86. Biguria, G.; Wenzel, L.A. Measurement and Correlation of Water Frost Thermal Conductivity and Density. Ind. Eng. Chem. Fundam. 1970, 9, 129–138. [Google Scholar] [CrossRef]
  87. Amne, E.C.; Anthony, J. A mathematical model for frost growth and densification on flat surfaces. Int. J. Heat Mass Transf. 2014, 77, 604–611. [Google Scholar] [CrossRef]
  88. Machielsen, C.H.M.; Kerschbaumer, H.G. Influence of frost formation and defrosting on the performance of air coolers: Standards and dimensionless coefficients for the system designer. Int. J. Refrig. 1989, 12, 283–290. [Google Scholar] [CrossRef]
  89. Brian, P.L.T.; Reid, R.C.; Shah, Y.T. Frost Deposition on Cold Surfaces. Ind. Eng. Chem. Fundam. 1970, 9, 375–380. [Google Scholar] [CrossRef]
  90. Cai, L.; Hou, P.; Li, S.; Yu, W. Theoretical Model of Frost Layer’s Thermal Conductivity at Different Porosity. Build. Energy Environ. 2005, 24, 62–64. [Google Scholar]
  91. Sengupta, S.; Sherif, S.A.; Wong, K.V. Empirical heat transfer and frost thickness correlations during frost deposition on a cylinder in cross-flow in the transient regime. Int. J. Energy Res. 1998, 22, 615–624. [Google Scholar] [CrossRef]
  92. Cremers, J.C.; Mehra, V.K. Frost formation in vertical cylinders in free convection. Am. Soc. Mech. Eng. 1980, 104, 3–7. [Google Scholar] [CrossRef]
  93. Hacıefendioğlu, K.; Başağa, H.B.; Mohammad, Z.Y.; Karimi, T. Intelligent ice detection on wind turbine blades using semantic segmentation and class activation map approaches based on deep learning method. Renew. Energy 2022, 182, 1–16. [Google Scholar] [CrossRef]
  94. Poornam, S.; Francis, S.D.A. Image based Plant leaf disease detection using Deep learning. Int. J. Comput. Commun. Inf. 2021, 3, 53–65. [Google Scholar] [CrossRef]
Figure 1. Schematic diagram of plant surface frosting under natural radiation conditions: (a) natural radiation frost formation conditions; (b) principle frost formation on plant surface.
Agriculture 11 01142 g001
Figure 2. Symptoms of frost damage on tea plants: (a) light frost damage; (b) medium frost damage; (c) heavy frost damage.
Agriculture 11 01142 g002
Figure 3. Schematic diagram of energy exchange at the plant canopy under frost conditions.
Agriculture 11 01142 g003
Figure 4. Monitoring equipment fitted with multispectral sensors: (a) unmanned aerial vehicle; (b) multispectral sensor.
Agriculture 11 01142 g004
Figure 5. Frost chambers: (a) performance testing using visual IR thermometer at 32.7 °F; (b) monitoring the effect of frost on wheat growth using proximal sensors.
Agriculture 11 01142 g005
Figure 6. Machine vision detection method: (a) automatic frost observation equipment and treatment process based on a glass carrier; (b) using the image method to measure frost thickness (Zf is the average thickness of frost, Zfmax is the average maximum thickness of frost, Zfmin is the average minimum thickness of frost) [48,66].
Agriculture 11 01142 g006
Figure 7. Frost detection methods based on light scattering, light transmission, and light diffraction principles: (a) scattered light detection; (b) transmission light detection; (c) diffraction light detection.
Agriculture 11 01142 g007
Figure 8. The frost detection device based on microwave.
Agriculture 11 01142 g008
Figure 9. Surface plasmon resonance (SPR) detection: (a) a schematic diagram of the SPR imaging setup used in this research; (b) reflectance curve regarding changes in frost layer thickness in the air.
Agriculture 11 01142 g009
Figure 10. Four-electrode detector structure and scheme: (a) four-electrode probe detection device; (b) circuit diagram of four-electrode probe detection device.
Agriculture 11 01142 g010
Figure 11. Capacitive frost detection technology: (a) testing system of tea leaf electrical property; (b) the leaf wetness sensor (LWS) [78].
Agriculture 11 01142 g011
Figure 12. Schematic diagram of thermocouple leaf.
Agriculture 11 01142 g012
Figure 13. Detecting frost formation principle on plant surface based on color sensing theory.
Agriculture 11 01142 g013
Table 1. Meteorological frost severities and its standard.
Frost
Severities
Evaluation StandardLegend
IIIThe minimum temperature on the ground will drop below 0 °C within 48 h, which will have an impact on agriculture, or it has dropped below 0 °C, which will have an impact on agriculture and may continue. Agriculture 11 01142 i001
IIThe minimum temperature on the ground will drop below minus 3 °C within 24 h, which will have a serious impact on agriculture, or it has dropped below minus 3 °C, which will have a serious impact on agriculture and may continue. Agriculture 11 01142 i002
IThe minimum temperature on the ground will drop below minus 5 °C within 24 h, which will have a serious impact on agriculture, or it has dropped below minus 5 °C, which will have a serious impact on agriculture and will continue. Agriculture 11 01142 i003
Table 2. Ten methods of frost detection.
MethodMethod TypeRelevant
Parameter
Detection
Target
References
Contact
/Non-Contact
Detection
Phase 1
Micrometeorological
observation
Non-contactBF T l ,   T a ,   S w  
R n ,   H ,   L E
OccurrenceSmith [6]
Spectral remote sensingNon-contactAF T c ,   P R I OccurrenceGoswami [61]
Image recognitionNon-contactDF δ f ,   R a ,   ρ f QuantityShirin [14]
Optical detectionNon-contactDF T s ,   δ f ,     U Occurrence & QuantityWang [70]
MicrowaveNon-contactAF S 21 ,   f QuantityWiltshive et al. [74]
SPR2ContactAF δ f ,   δ c r ,   R f QuantityChan [75]
Electrical propertiesContactDF R W C , U OccurrenceZheng [76]
CapacitanceContactBF R H ,   L T 50 ,   R E C OccurrenceLu [77]
Dielectric propertyContactDF δ f ,   ε f ,   f QuantityCampbell [79]
PyroelectricityContactDF G A ,   T a ,   T l OccurrenceKimura [80]
Detect phase 1: BF (detect before frosting); DF (detect during frosting); AF (detect after frosting); SPR2: surface plasmon resonance; T l : leaf temperature, °C; T a : air temperature, °C; S w : wind speed, m/s; R n : net radiation, W/m2; H : sensible heat flux, W/m2; L E : latent heat flux, W/m2; T c : the temperature of canopy, °C; P R I : photochemical response index; δ f : thickness of the frost layer, mm; Ra: the surface roughness of frost layer, µm ρ f : the density of frost layer, kg/m³; T s : surface temperature, °C; U : output voltage, mV; S 21 : scattering parameter of the sensor, dB; f : resonant frequency of the sensor, Hz; δ c r : critical probing thickness, mm; R f : reflectance of frost, %; R W C : relative water content, %; R H : relative humidity, %; L T 50 : low semi-lethal temperature, °C; R E C : relative electrical conductivity, %; ε f : the dielectric coefficient of frost, C²/(N·M²); G A : leaf boundary layer conductance, S/m.
Table 3. The density variation of frost layer.
T a d/RH V a T w Frost DensityReferences
0–1050–80%1–5−20–−5 ρ f = 340 T w 0.455 + ν Tao [11]
16–2250–80%0.7−15–−5 ρ f = 207.3 e x p ( 0.266 T s + 0.0615 T w ) Christian [85]
26–316.5–13.52.7–12.5−96–−29 ln ρ f = 11.95 + 0.02 T w + 35.55
0.36 ν + 1.21 × 10 4 T w ν
Biguria [86]
−10–260.2–21–4−20.5–−11 ρ f = 1.0382 x 0.0053 0.317 T f s 1.381
R e 0.279 F o 0.328
Mao [83]
7–1860–74%1.1−10–−15 ρ f ( z ) = ( z ) ρ a + ( 1 ( z ) ρ a ) ρ i Amne [87]
−8–1942–80%5−16–−8 ρ f = M z f · l 2 Wang [68]
Ta: ambient temperature, °C; d : humidity ratio, g/kg; R H : relative humidity, %; V a : air velocity, m/s; ρ f : frost layer density, kg/m3; T w : cold surface temperature, °C; T f s : frost layer surface temperature, °C; ϕ : air relative humidity, %; R e : Reynolds number, R e = ρ v d μ : fluid density, v : fluid velocity, d : characteristic length, μ : the viscosity coefficient of fluid; F o : Fourier number, φ n = arctan b n a n ;   ρ a : air density, kg/m3; ρ i : ice density, kg/m3; ( z ) : frost porosity; M frost mass, g; z f : frost thickness, mm; l : Length of the cold plate, m.
Table 4. Thermal conductivity of frost layer.
ReferenceResearch MethodThermal Conductivity Result
J.D. Yonko [82]Experimental data fitting k f = 0.014 + 0.00668 ρ f + 0.000175 ρ f 2
C.T. Sander [88]Experimental data fitting k f = ( 1.202 × 10 3 ) ρ f 0.963
P.L.T. Brain [89]Experimental data fitting k f = 8.49 × 10 17 T f s 5.44 + 6.68 × 10 14
× ( ρ f 0.025 ) T f s 4.84
BrailsfordParallel model k f m a x = ( 1 ε ) k i + ε k a
BrailsfordSeries model 1 / k f m i n = ( 1 ε ) / k i + ε / k a
BrailsfordMixed model k f m i x = ( 1 η ) k f m i n + η k f m a x
Yonko and Sepsy Ice hockey–lattice model k a / k f = 1 ( 6 ( 1 ε ) π ) 1 / 3 × [ 1 ( c 2 1 2 c ) l n c + 1 c 1 ]
c 2 = 1 + 4 π ( k i k a 1 ) ( 6 ( 1 n ) π ) 2 / 3
0.4764 < ε < 1
Cai L [90]Porous media–icicle composite model k f = k i S i + ( 1 S i ) k
kf: thermal conductivity of frost, B t u / ( f t h F ) ;   k i : thermal conductivity of ice, W / m K ;   k a : air thermal conductivity, W / m K ;   η : structural parameters, indicating the proportion of the parallel part in the overall frost layer; s i : area of frost column per unit cross section; k : thermal conductivity of porous media, W / m K .
Table 5. Thickness of frost layer.
No.TypeEquationsReferences
F t 1 M S f = 0.84 R e 0.15 P r 0.65 ( 1 + W ) 0.71 τ 0.11 Sengupta et al. [91]
F t 2 E Zhang et al. [68]
F t 3 M δ f = ( 0.0852 + 0.00134 D C A ) t 0.6954 0.00154 D C A Shin et al. [55]
F t 4 E Wang et al. [70]
F t 5 E Lee et al. [9]
F t 6 M δ f = 0.12 [ t ( T f s T w ) ] 0.43 Cremers et al. [92]
F t 7 E Yang et al. [69]
F t 8 M h = h f 0 / s i n ( π / 4 ) Cai et al. [90]
Ft: frost thickness; E : experimental verification; M : model calculation; R e : Reynolds number; P r : Prandtl number; W : humidity ratio, g/kg; τ : Fourier number; D C A : dynamic contact angles, °; δ f : frost layer thickness, mm; t : time of frosting, s; T f s : surface temperature of frost layer, K; T w : wall temperature of cold surface, K; h : real height of frost, mm; h f o : height measured from the images, mm.
Publisher’s Note: MDPI stays neutral with regard to jurisdictional claims in published maps and institutional affiliations.

