Article

Characteristics of Agricultural Dust Emissions from Harvesting Operations: Case Study of a Whole-Feed Peanut Combine

1
Nanjing Institute of Agricultural Mechanization, Ministry of Agriculture and Rural Affairs, Nanjing 210014, China
2
Key Laboratory of Modern Agricultural Equipment, Ministry of Agriculture and Rural Affairs, Nanjing 210014, China
3
College of Engineering, China Agricultural University, Beijing 100083, China
*
Authors to whom correspondence should be addressed.
Agriculture 2021, 11(11), 1068; https://doi.org/10.3390/agriculture11111068
Submission received: 12 September 2021 / Revised: 24 October 2021 / Accepted: 27 October 2021 / Published: 29 October 2021
(This article belongs to the Special Issue Agriculture: 10th Anniversary)

Abstract

:
The rapid development of peanut mechanization has increased the amount of dust expelled from peanut mechanized operations, which degrades the air quality and endangers the health of agricultural workers. Therefore, the purpose of this study is to figure out the characteristics of dust emission from mechanized peanut harvesting. To this end, the particulate matters of diameters ≤ 2.5 μm and ≤10 μm and the total suspended particles were sampled in real time during peanut harvesting in Henan Province, China, and the airborne particle concentrations and particle size distributions were measured. The dust particles discharged during the mechanized peanut harvesting were concentrated within the 2~30 µm size range. When the wind speed was reduced below the settling velocity of the largest particles, the more massive particles were carried in the downwind. The amount of free silica in the dust samples was determined by X-ray diffraction analysis. Both the total dust and free silica concentrations exceeded the occupational exposure and threshold limits. To improve the characteristics of dust emission, the microstructure and dispersion of the dust were also investigated. Reducing the agricultural operations during periods of high wind speed, low crop-moisture content, and low air humidity is recommended for reducing the dust exposure of workers. The results will provide guidance and technical support for reducing the dust emissions of mechanized harvesting operations, improving air quality, and reducing the health hazards to operators.

1. Introduction

Large-scale agricultural production has become increasingly mechanized in recent decades. For instance, agricultural planting, harvesting, green manuring, processing after production and even animal husbandry have been mechanized [1,2,3]. However, these developments have elevated the particulate matter (PM) pollution of agricultural production to serious levels [4,5,6], raising concern among some researchers [7,8]. Approximately 20% of the PM emissions in Europe are generated in agricultural fields [9,10]. For example, agricultural operations generally account for 24% of the total PM10 (PM particles of diameter ≤ 10 μm) and 35% of the total suspended particle (TSP, particles of diameter ≤ 100 μm) emissions in the fields of Flanders [11]. The dust produced by agricultural mechanization is a complex mixture that varies with season, climatic conditions, and type of agricultural production [12,13]. It is mainly sourced from soil tillage, crop harvesting, post-processing, and animal husbandry [14]. Besides agricultural land-preparation activities such as tillage, sowing, harvesting, disking, and spraying, high wind speed elevates the PM concentration in the vicinity of farming fields [10]. Dust emissions from agricultural operations usually manifest as particles with diameters larger than 2.5 μm [15].
Concentrated agricultural dust is associated with a number of environmental and health problems [16]. Inhalable PM10 is particularly injurious as the particles can penetrate the deep regions of the respiratory system and deposit in the respiratory tract, alveoli, etc., causing adverse health effects [11]. Dust also enters the human body through the eyes and skin [17]. The hazards to operators are highly variable, as they depend on the properties and chemical composition of the dust. Free silica dust is a high-risk dust that causes extensive nodular fibrosis of the lungs when inhaled in large amounts [18]. Organic dust reportedly accounts for over 65% of the total agricultural dust emissions, and free silica dust contributes around 5–15% [19,20,21,22,23,24,25].
The hazards of agricultural dust, especially those of dust emitted from mechanized operations, have attracted increasing interest in China. The promulgation of the National Oil Crop Production and Development Plan in China has improved the planting area and yield of peanuts (2016–2020) [26]. In 2018, the mechanization levels of peanut planting, sowing, and harvesting in China reached 75.6%, 50.0%, and 39.7%, respectively [1,27], necessitating probes into the air quality and health of agricultural workers during the suitable peanut harvesting period (August to October) [28]. Relevant local standards and dust emission countermeasures from peanut harvesting operations have also been formulated [29,30].
In order to study the dust emission characteristics of agricultural machinery harvest, the present paper characterizes the PM emissions during mechanized agricultural harvesting of peanuts in Henan Province, China, as a case study. Specifically, it determines the total particle mass concentrations and particle size distributions of the dust emitted during actual peanut harvesting operations. The atmospheric particulate samplers were used to measure the particle concentrations on the harvesting site. The microstructures and dispersion of the dust are characterized. The results can support dust collection technology for mechanized harvesting operations and the evaluation of dust emission factors of agricultural machinery operations.

2. Materials and Methods

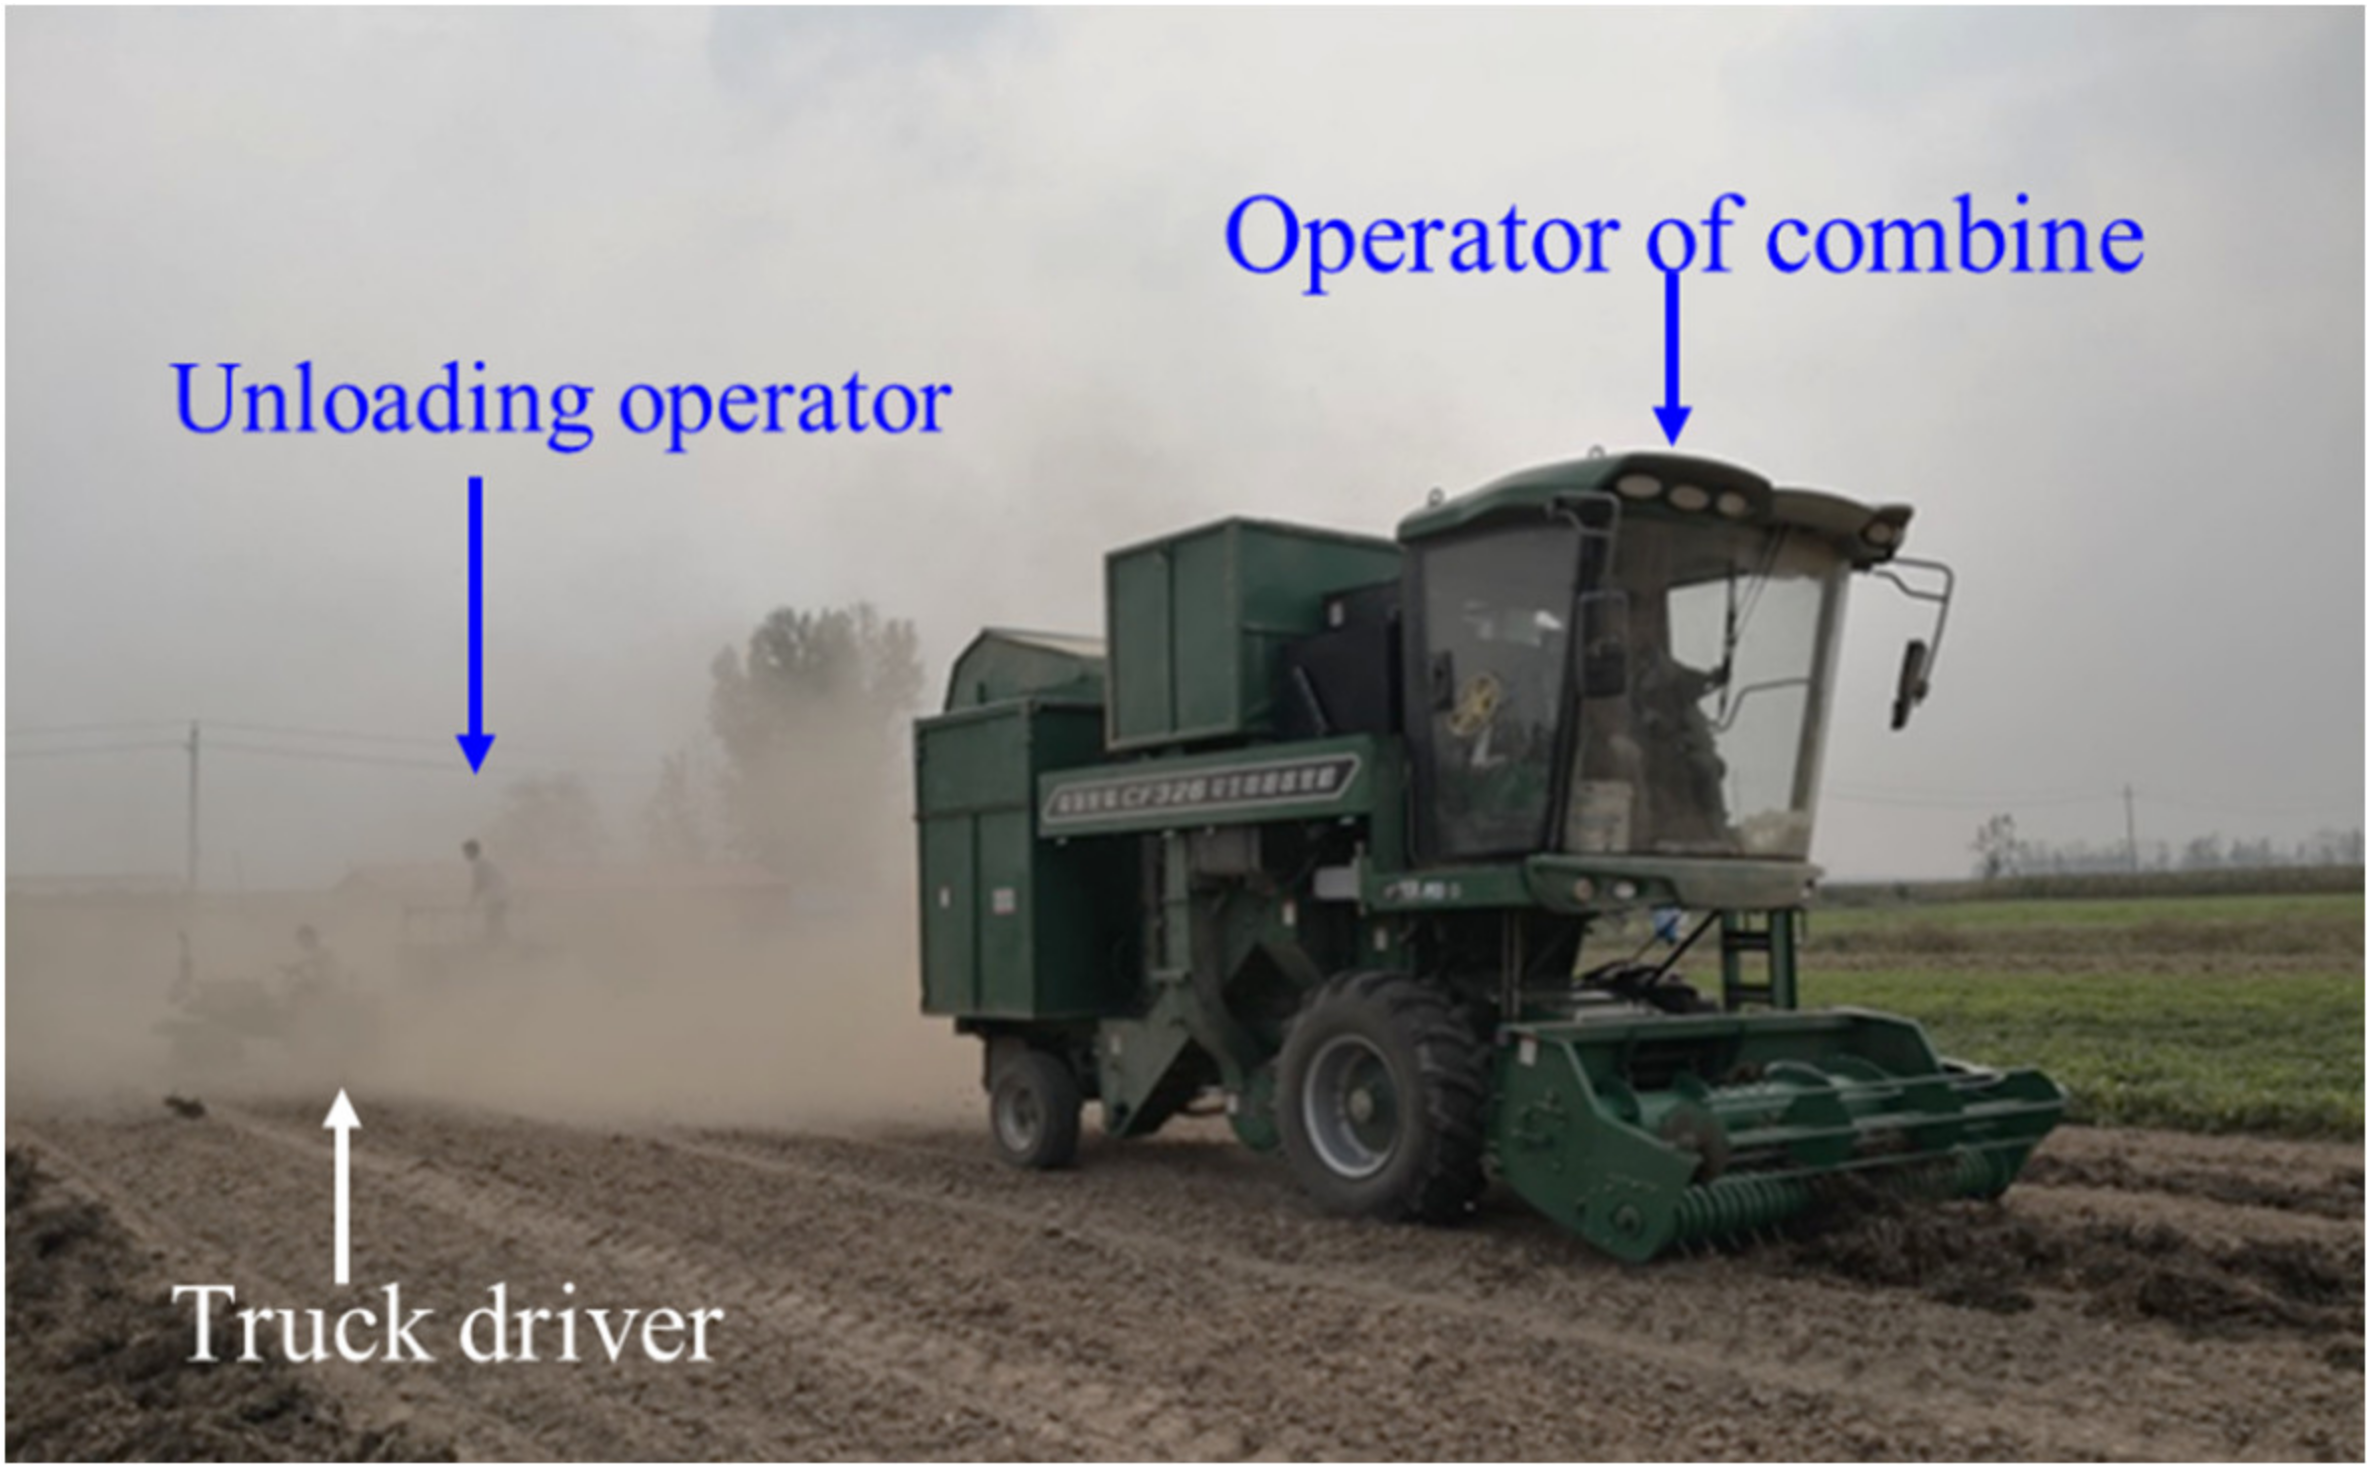
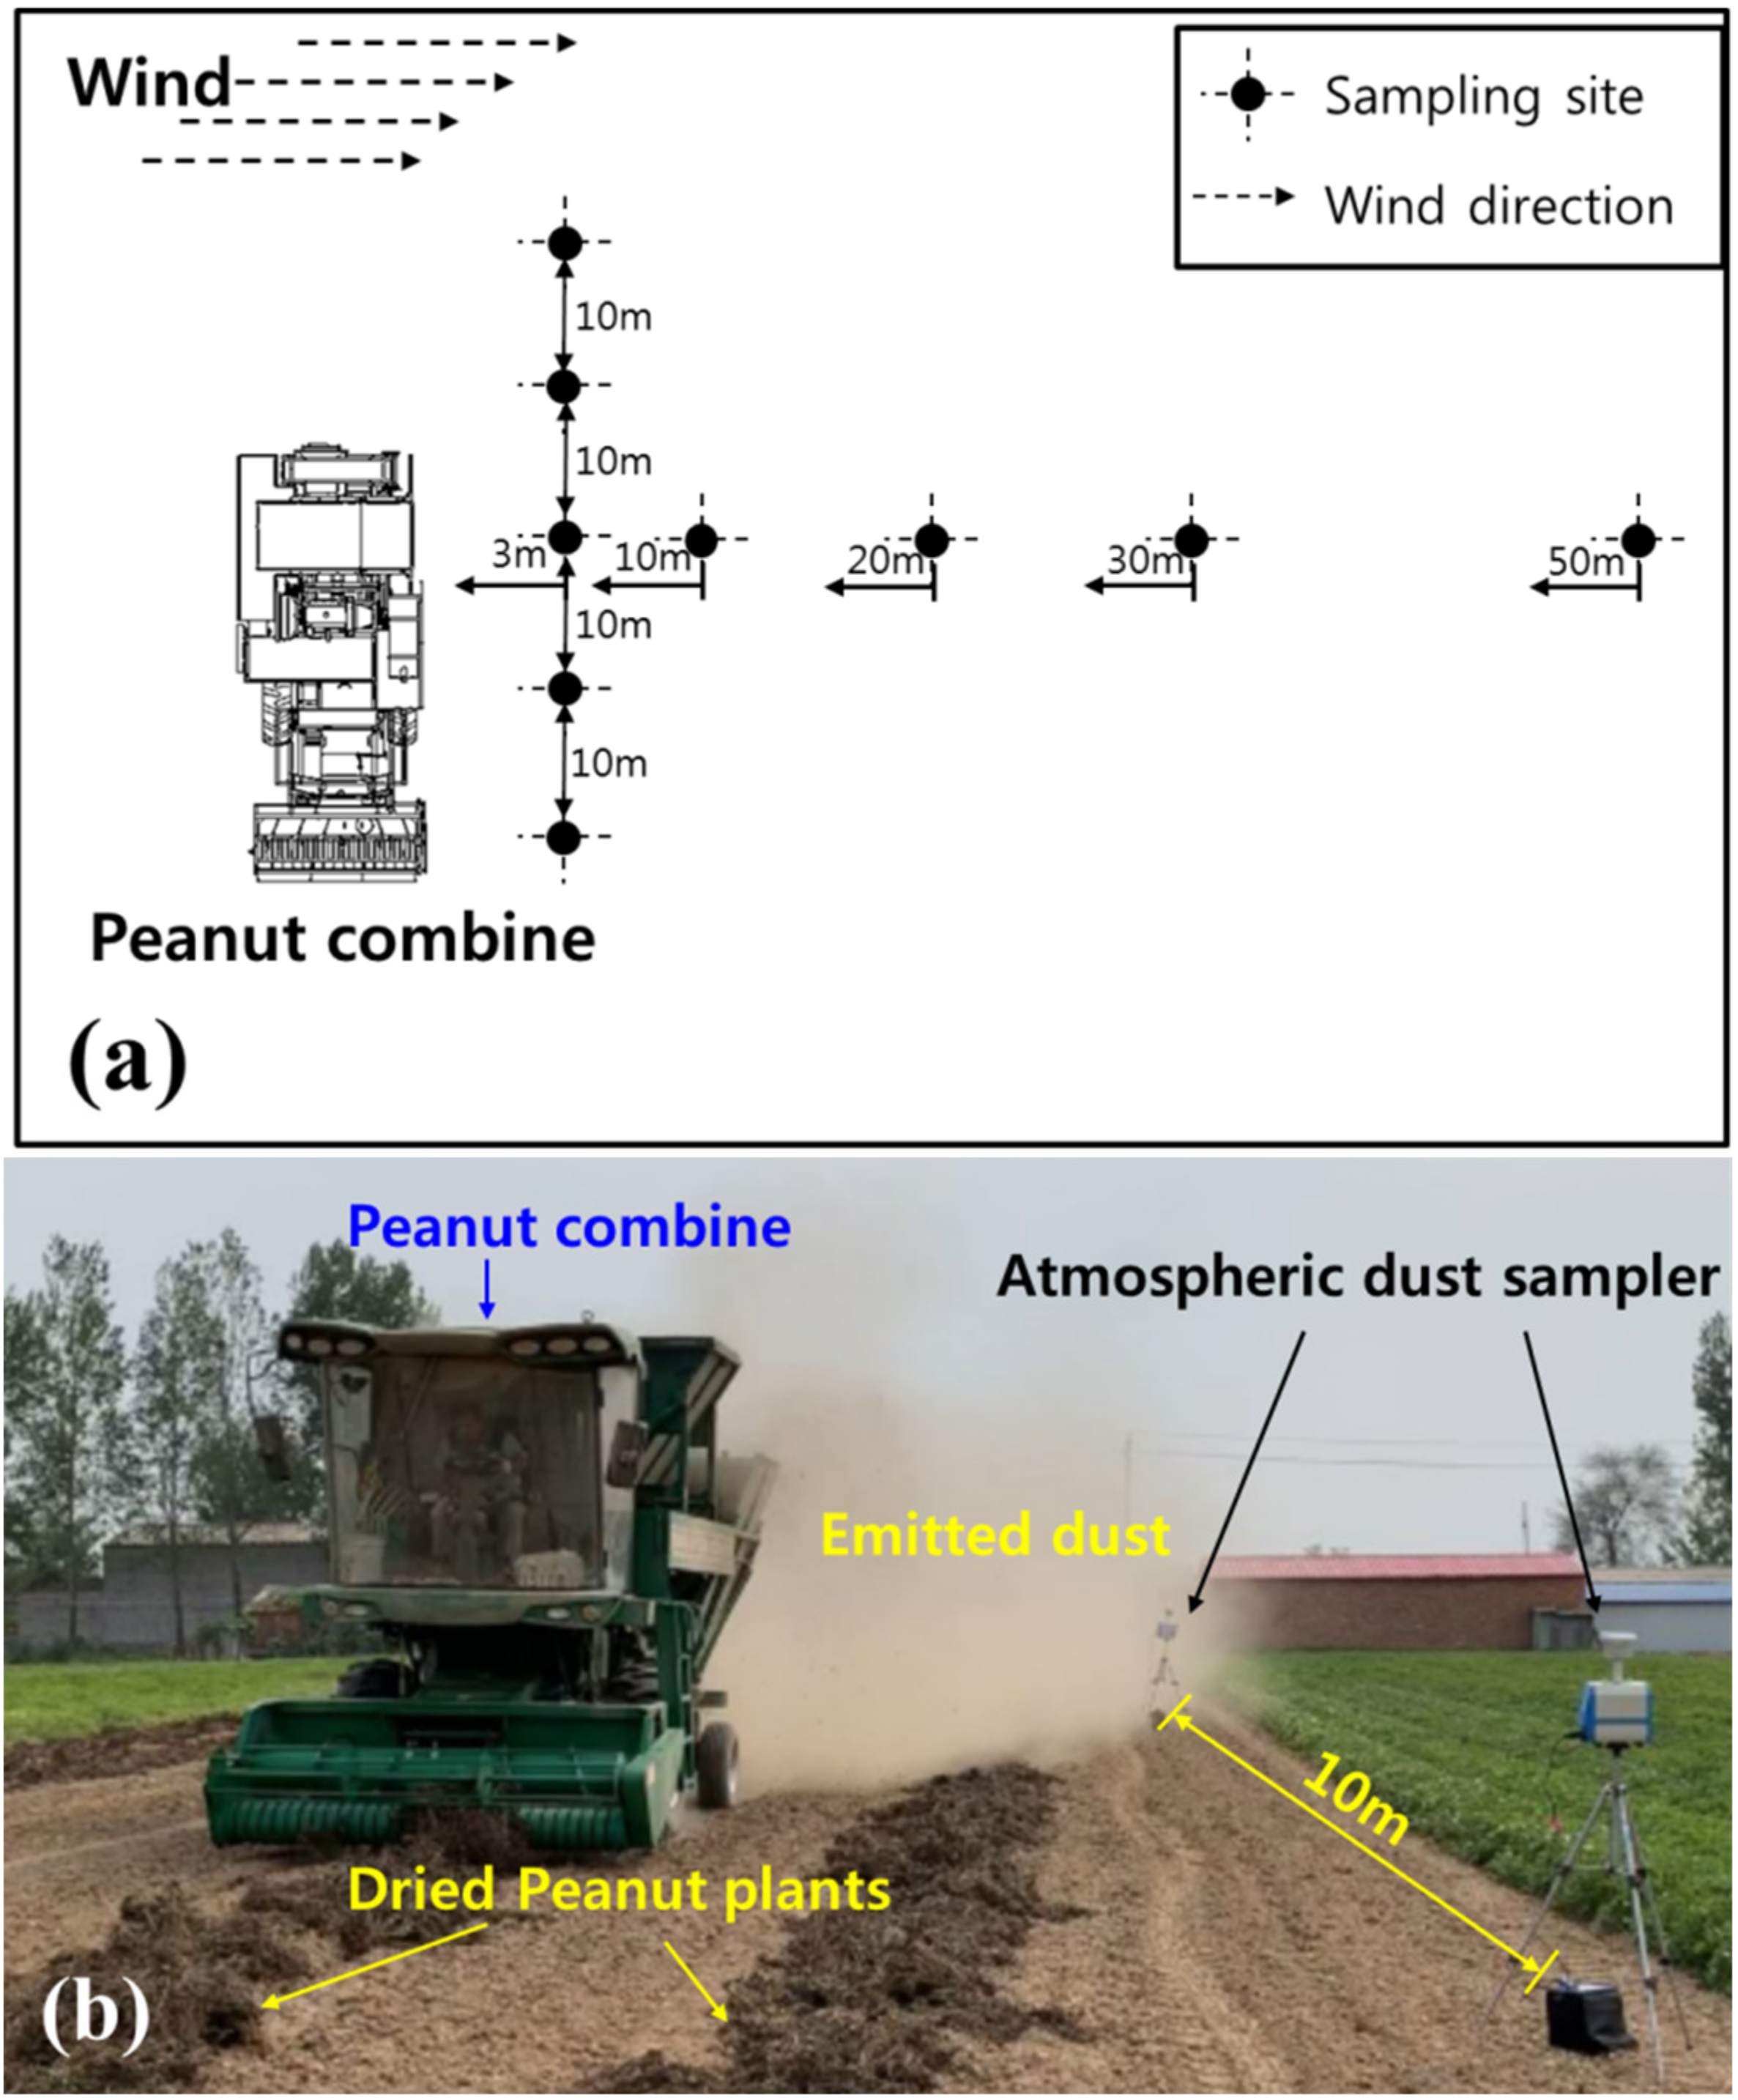
2.1. Field Site and Samplers

The experiment was conducted during the peanut-harvesting season (September–October 2020). The test site was Zhumadian City of Suiping County in Henan Province, China (33°15′53.37″ N, 113°99′80.29″ E, elevation = 67 m). In 2020, the peanut planting area in Henan Province was 14,000 kh2, accounting for 28.8% of the peanut planting area in China [31,32]. Peanuts are cultivated in light sandy soil, which mainly consists of yellow–brown soil, lime concretion black soil, and tidal soil [33,34]. The parameters of the atmospheric environment (wind velocity, temperature, humidity and atmospheric pressure) were measured by an anemometer (TSI 9545-A VELOCICALC, TSI Incorporated, Shoreview, MN, USA), and the peanut crop (Yuhua15) was harvested by a combine harvester (4HJL-Z, Nanjing Institute of Agricultural Mechanization, Ministry of Agriculture and Rural Affairs, Nanjing, China). A single peanut harvest operation covered an area of 0.47 ha and was completed in approximately 1.5 h, so the atmospheric sampling time of each operation was set to 60 min. The sampling conditions are listed in Table 1.
The dust concentration was determined using an intelligent middle flow total suspended particulate sampler (KB-120F, Genstar Co. Ltd., Qingdao, China). Figure 1 presents a photograph of the intelligent middle flow total suspended particulate sampler. The flow rate range of atmospheric PM sampling is 60~130 ± 0.2 L/min, the atmospheric pressure range is 50~130 ± 0.50 kPa, inlet velocity is 0.3 m/s, the available temperature range is −55~+125 ± 2 °C, the sampling time, delay time and interval time (range of 1 min~100 h ± 0.2%) can be flexibly set before sampling, and the range of pre-separator materials of TSP, PM10 and PM2.5 are antistatic aluminum alloy. The samples were filtered through a glass microfiber with a diameter of 90 mm and 1.6 μm pore size (Figure 1). The sampling flow of the atmospheric dust sampler was set to 100 L/min. During the sampling process, the particle concentrations and meteorological parameters were measured at varying heights above the ground (0.5~9 m) by various sampling instruments. The methods are described in the CEN and ISO standards [35,36].
The full loading bin (peanut pod or crushed straw) of combine needs to be emptied and poured into the truck during peanut harvesting (Figure 2). The operator of combine is always in the nearest and not completely exposed position to the dust outlet (within 3 m). The truck driver and the unloading operator are completely exposed to the dust (within 20 m). Considering that there are also villages 50 m away, the sampling sites were set up at 3, 10, 20, 30, and 50 m, respectively, and the parameters were the same at each sample point. The layout of the sampling points is shown in Figure 3a. The sampling sites were designed to be on the side of the movement direction of the peanut combine and along the leeward side. Figure 3b is a photograph of the field measurement site. To ensure the accuracy of the collected data, three samplings were carried out under each condition.

2.2. Moisture Content Determination

The moisture content of the peanut plant was measured by the drying method (GB/T 3543.6-1995) [37]. The sampled plants were cut, weighed, marked, and dried in a preheated drying oven (DGF30/IA, Nanjing Lab., Nanjing, China). Their moisture content was calculated as:
W = m 1 m 2 m 1 × 100 % ,
where m 1 and m 2 are the masses of the sample (g) before and after drying, respectively.

2.3. Velocity of Dust-Particle Settling

The settling velocity of dust particles provides a reference for the dust concentration distribution. The settling velocity of dust particles in the atmosphere was determined by the following Navier–Stokes equation [38]:
u t = d p 2 ρ p ρ 18 μ g C ,
where u t is the gravitational settling end velocity of the particles (m/s), dp (μm) and ρ p (kg/m3) are the diameter and density of the particles, respectively, ρ (kg/m3) and μ (Pa·s) are the density and viscosity of air, respectively, and g denotes gravitational acceleration (m/s2). The Cunningham correction factor is given as:
C = 1 + 1.257 + 0.400   e x p 1.10 k n ,
where kn is the Knudsen number, determined as:
k n = 2 δ d p ,
The mean free path δ of the air particles is calculated as:
δ = μ 0.499 ρ v ¯ ,
where the mean velocity of the gas molecules,   v ¯ , is given as:
v ¯ = 8 R T π M ,
In Equation (6), R is the gas constant (8.314 J·mol−1·K−1), T is the gas temperature (K), and M is the gas molar mass (kg/mol).
As clarified in the above calculation, the dust-particle settling velocity directly depends on the viscosity of air μ , particle density ρ p , particle diameter d p , and gas temperature T.

2.4. Qualitative and Qualitative Analysis of Free Silica

The free silica in the dust was characterized by X-ray diffraction (XRD) analysis. All samples were taken from the harvest site by atmospheric dust sampler. The intensities of the characteristic silicon peaks in the diffraction spectrum are proportional to the mass of irradiated free silica. The free silica in dust was quantitatively and qualitatively determined by measuring the strength of the diffraction spectrum.
The XRD patterns were collected on a Bruker D8 Advance diffractometer (Germany) irradiated with Cu–Kα radiation (λ = 1.5418 Å) at 30 kV and 40 mA. The scan rate was 2° min−1 over 2θ = 5~60°.

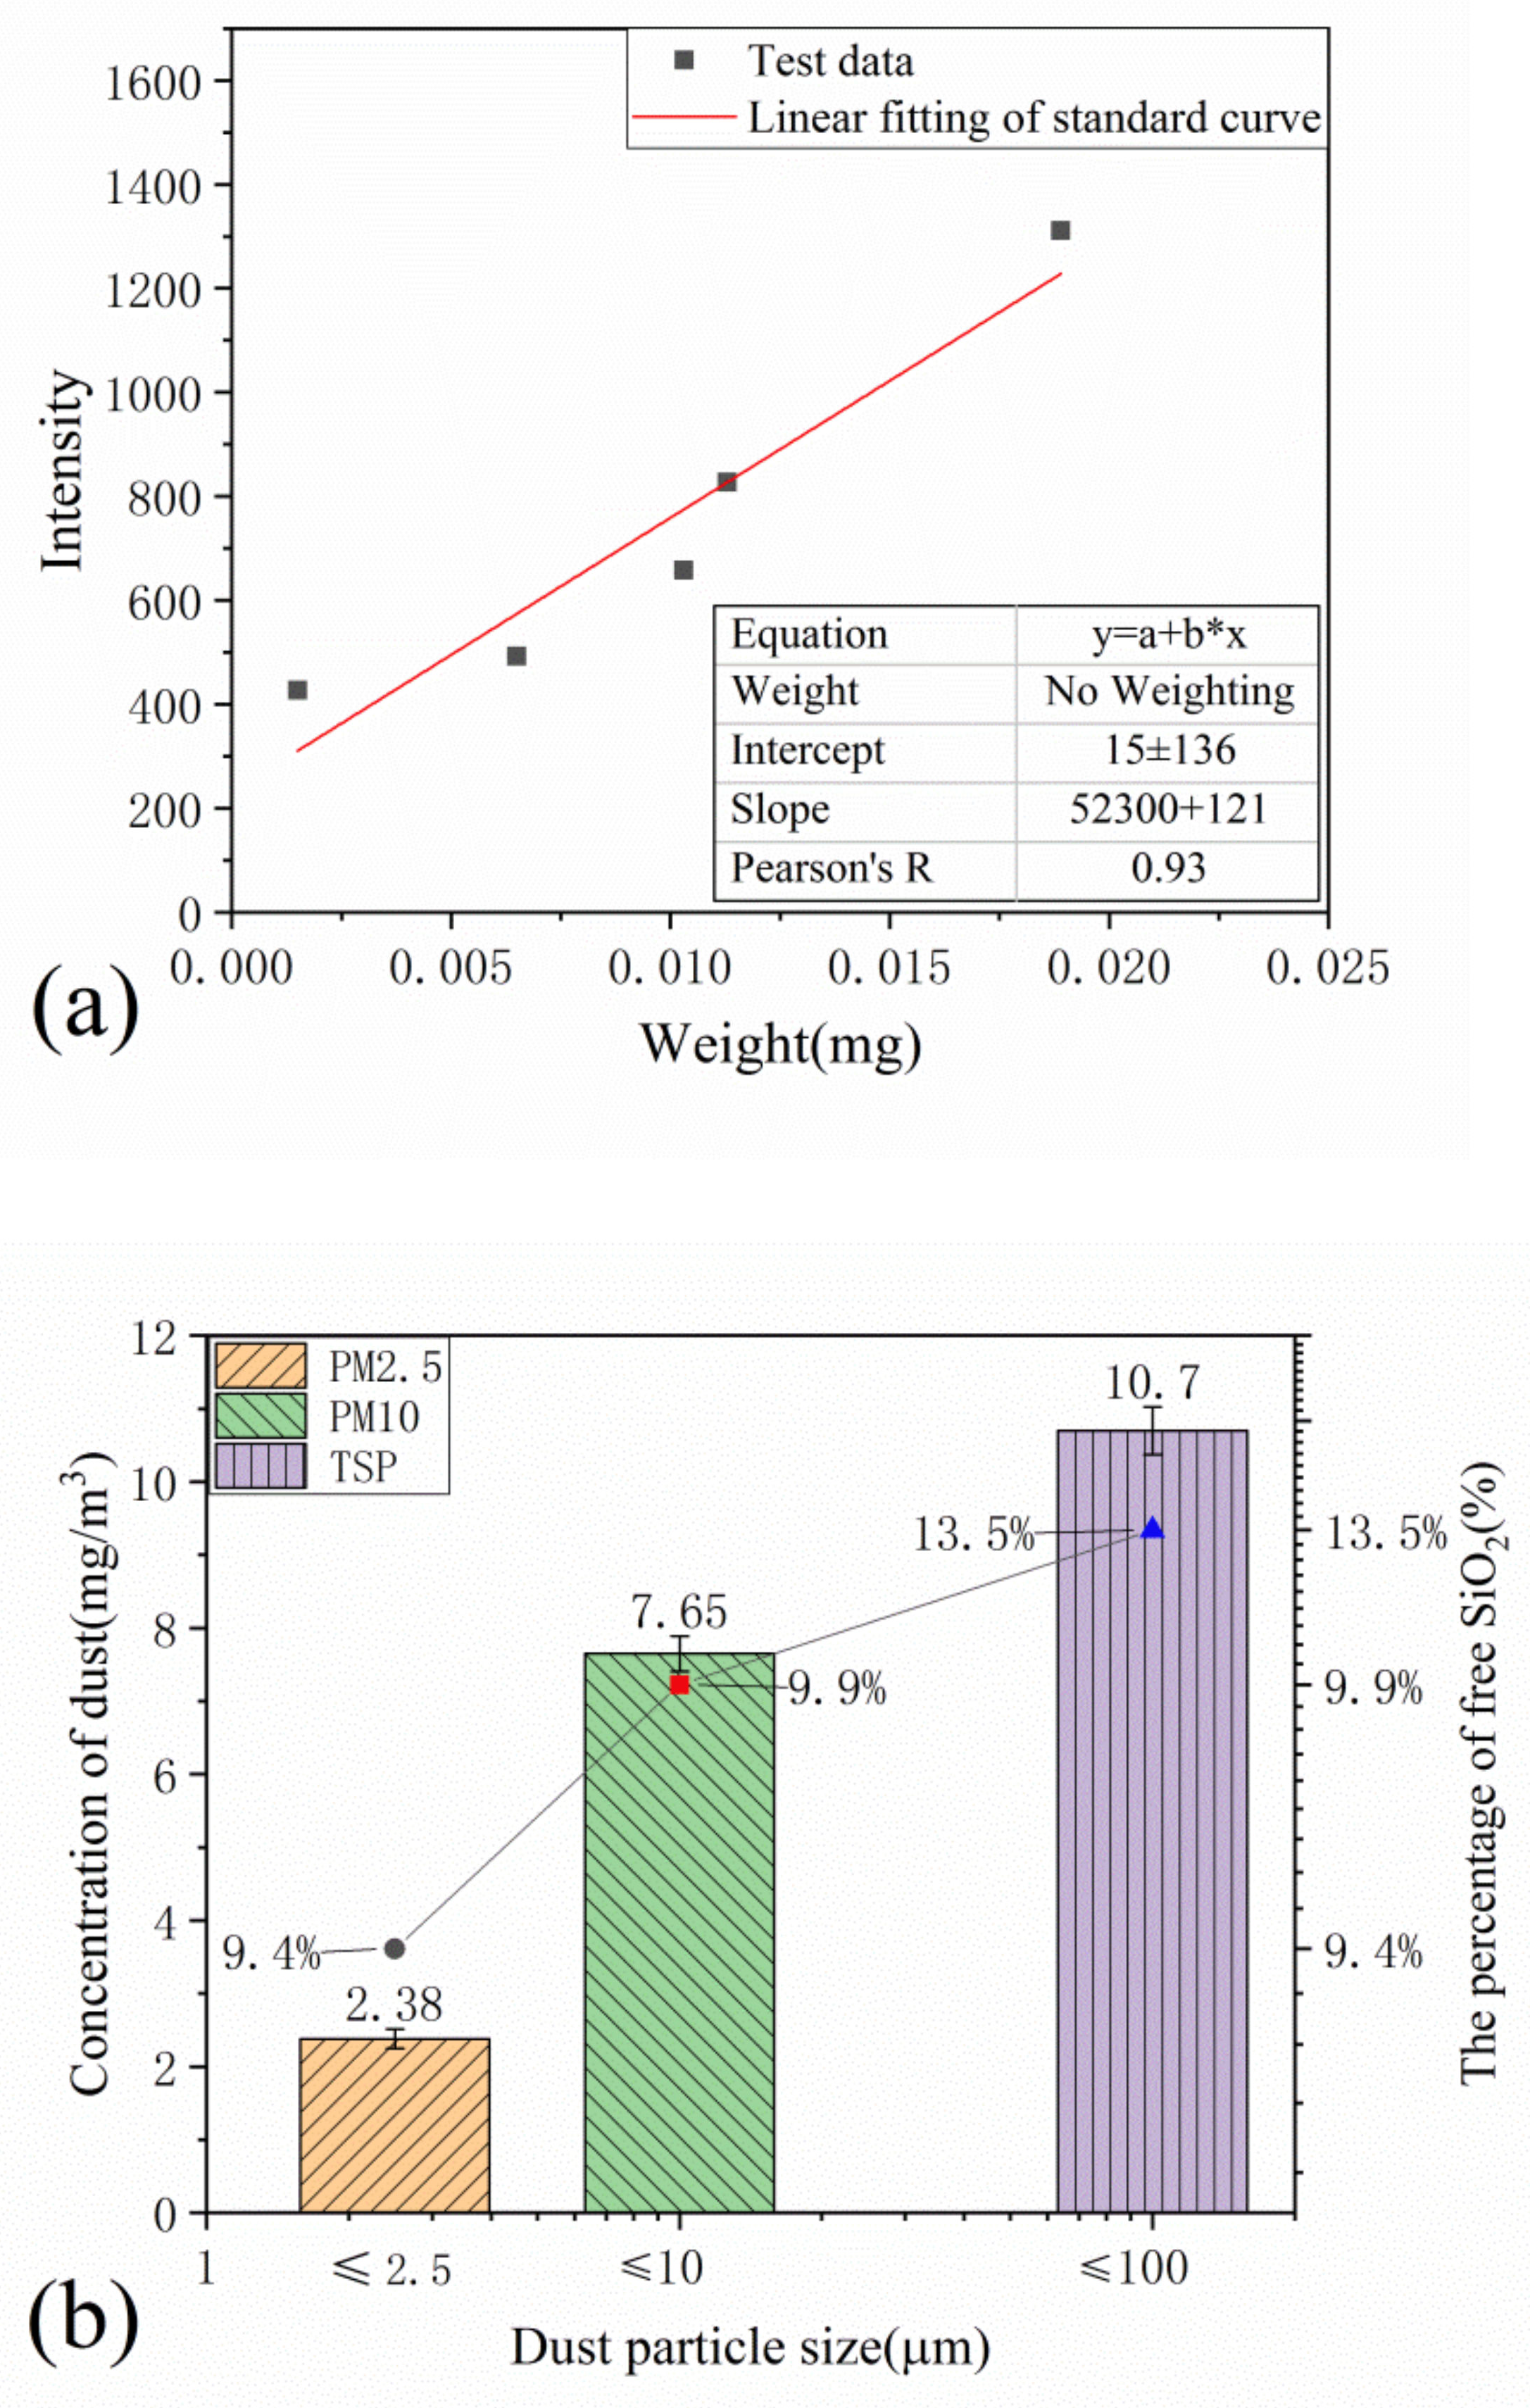
2.5. Standard Curve of Free Silica for Quantitative Analysis

During the weighing experiment, the laboratory temperature and relative humidity were controlled at 18~24 °C and <50%, respectively. The standard quartz dust was collected on a filter membrane of known mass, and the collected amount should weigh between 0.5 and 4.0 mg. Five to six different masses were collected in this range. The incremental weight of the filter film was obtained after a second weighing.

2.6. Content of Free Silica (Quartz)

After measuring the diffraction intensities of the membrane-filtered sample and standard silicon on the filter membrane [39,40], the diffraction intensity of quartz in the dust (CPS) was calculated as:
I B = I i × I s I ,
where Ii is the diffraction intensity of quartz in the membrane-filtered sample (CPS), and Is and I are the diffraction intensities of standard silicon when measuring the standard quartz curve and the quartz on the dust-collecting filter membrane, respectively.
The quality of silicon in the dust on the filter membrane was determined from the standard curve as follows:
S i O 2 F = m M 2 M 1 × 100 ,
where S i O 2 F is the content of free silica (quartz) in the dust (%), m is the mass of free silica (quartz) in the dust on the filter membrane (mg), and M 1 and M 2 are the masses of the filter membrane (mg) with and without the dust sample, respectively.

2.7. Particle Size Distribution

The particle distribution quantitatively characterizes the particle size and sedimentary environment [41,42]. The dust dispersion was captured by a Nikon Eclipse 80i light microscope equipped with a digital camera (DS-Ri2, Nikon Corporation, Tokyo, Japan) and was analyzed using the static image analysis method in ISO 13322-1(2014) and GBZ/T192.3(2007) [41,42]. After measuring the total number of dust particles and the number of same-sized dust particles, the particulate distribution was determined as the percentage of dust particles with of particle size i among the total dust:
P n i = n i n i × 100 % ,
where n i is the number of dust particles of size i, and n i is the total number of dust particles.

2.8. Dust Concentration Calculations

The TSP, PM10, and PM2.5 dust particles were measured with different inertial impactors. During each one-hour sampling period, the peanut bucket was filled and unloaded five times. The particle concentration was calculated by the filter weighing method. The methods are given in GBZ/T 192.1-2007 and GBZ/T 192.2-2007 [43,44]. The concentrations of the dust collected under different conditions were calculated by Equation (10), and were averaged over three independent samples under the same condition to ensure accuracy:
c = m 1 m 0 V × t × 100 % ,
where c is the concentration of total dust in the air (mg/m3), m 0 and m 1 are the masses of the filter membrane (g) after and before sampling, respectively,   V is the sampling flow (L/min), and t is the sampling time (min).

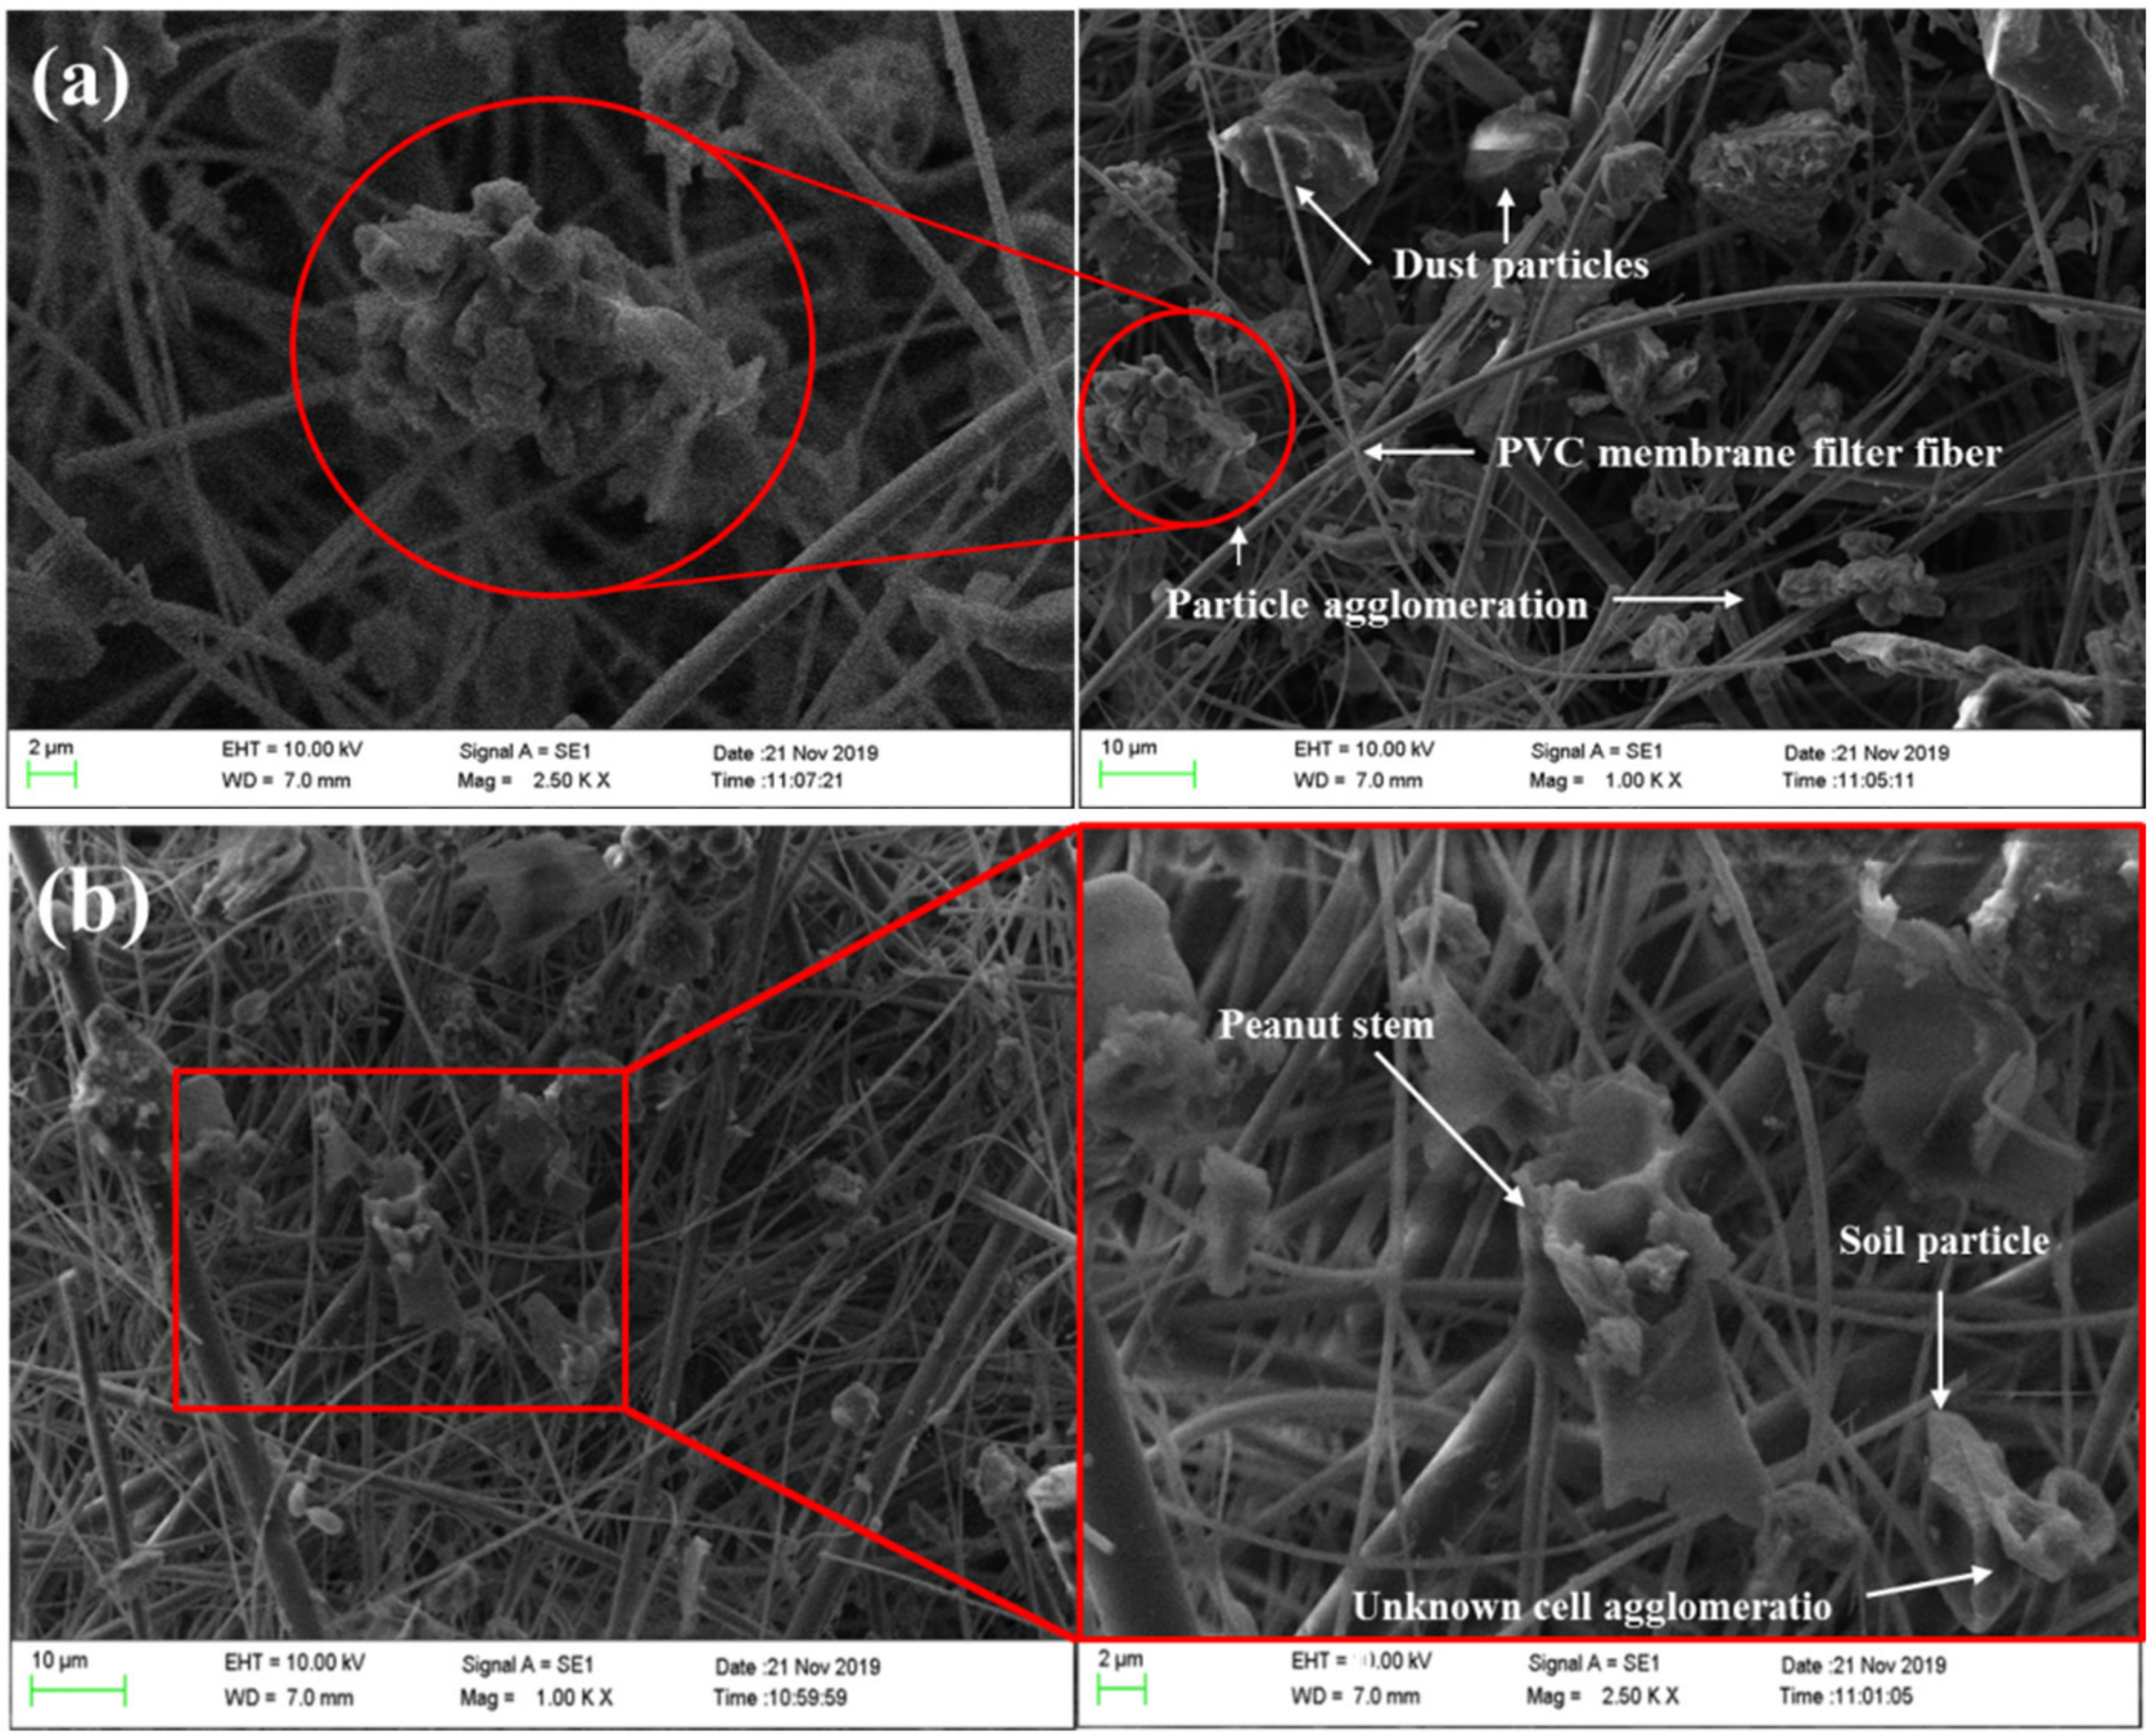
2.9. Morphology Analysis of Dust

Dust is characterized by its morphology and surface polymerization. In the experiment, the microstructures of the dust emissions from the peanut harvesting operations were observed under a scanning electron microscope (SEM) (EVO LS10, Carl Zeiss, Oberkochen, Germany).

3. Results and Discussion

3.1. Particle Concentration Variations with Distance

Figure 4 shows the distribution of dust concentrations at different distances from the combine. Panel (a) of this figure plots the spatial changes in the dust concentration measured by three samplers placed at different distances from the combine harvester. The dust concentration measured by the TSP sampler was highest near the combine harvester, and was significantly lowered as the distance from the harvester increased. The dust-concentration distribution is more intuitively visualized in Figure 4b. The PM2.5 sampler recorded the lowest dust concentration at each sampling site, and its measurements also decreased with increasing distance from the combine harvester. However, as found in the fitting curves of the PM2.5/PM10 and PM2.5/TSP ratios, the decreasing trend was less obvious for PM2.5 than for PM10 and TSP. Although the concentrations of PM10 and TSP both dropped dramatically with distance (86.7% and 87.3%, respectively), the fitting curve of the PM10/TSP concentration ratio trended downward, indicating that the PM10 concentration dropped more rapidly than the TSP concentration. It can be observed that these PM emissions from peanut harvesting will be the main circulating source of atmospheric aerosol load in the harvest season [7,8,11].
This result can be explained by natural sedimentation of the larger particles when the generated dust accelerates during the dispersion process. The number of large particles among the TSP decreased gradually with increasing distance between the sampling site and the combine harvester. In contrast, the small particles sampled by the PM2.5 sampler continued diffusing leeward, and their suspension time was significantly increased. Using Equations (1)–(5), the settling velocities of the dust particles with diameters of 100, 10, and 2.5 µm were calculated as 4.83 × 10 5 , 4.83 × 10 7 and 3.02 × 10 8 m/s, respectively. The deposition of more massive particles in the leeward direction was enhanced by reducing the wind speed to below the settling velocity of the large particles. Although the peanut-farm dust diffused and migrated more slowly than dust from cotton fields [45], its movement was dominated by wind and stability.

3.2. Particle Concentration versus Moisture Content of Peanut Plant

Dust in peanut harvesting is mainly sourced from the agricultural soil and crushed plant dust particles. The crushing degree of plant particles strongly depends on the plant’s moisture content. The full-feed peanut combine investigated in the present study collected and harvested the peanuts after digging and air drying. Moreover, the peanuts were air-dried at different degrees. Figure 5 shows the three-dimensional distribution of dust concentrations of different types after harvesting under different drying conditions (yielding different moisture contents). The collected amounts of all dust types increased with decreasing water content. The TSP and PM2.5 concentrations in the collected dust were significantly affected by the moisture content of the peanut plant. The results showed that in drier peanut plants, the emissions of TSP dust exceeded those of PM10 dust. The water content of the peanut plants more severely affected the PM2.5 concentration than the concentrations of the other emissions. This is very detrimental to the health of the respiratory system of harvester operators and may increase the incidence of pneumoconiosis [16]. To efficiently reduce dust emissions, a conservative harvest is recommended, and agricultural operations should be suspended during periods of high wind speed, low moisture content of crops, and low air humidity [46].

3.3. Content of Free Silica in Dust

In the free silica analysis, the test specimen was placed in the sample holder of the XRD apparatus for phase determination. After calculating the crystal plane spacing of the diffraction data and smoothing the XRD pattern, the position, diffraction intensity, and half-width of the peak were matched to the JCPDS card of alpha quartz (No.75-443). The diffraction pattern was consistent with that of quartz, confirming that quartz was contained in the dust. Therefore, the dust from mechanized harvesting of peanuts can harm the respiratory systems of practitioners.
Figure 6a shows the standard curve of free silica, constructed by plotting the average diffraction-peak intensities against known quartz masses. From the standard curve, the free silica contents in TSP, PM10, and PM2.5 were calculated as 13.5%, 9.9% and 9.4%, respectively. The free silicon in the field soils, analyzed by the same method, was 23.2%. The result indicated that most of the free silica in the sample dust was sourced from the field soil.
Figure 6b compares the concentrations and free silica contents in the TSP, PM10, and PM2.5 dust dispersions. The free silica contents (dust concentrations) in the collected TSP, PM10, and PM2.5 dusts were 9.4% (2.38 mg/m3), 9.9% (7.65 mg/m3), and 13.5% (10.7 mg/m3), respectively. The “Occupational exposure limits for hazardous agents in the workplace-Part 1: Chemical hazardous agents” document [47] specifies the occupational exposure limits (OELs) of grain dust, whereas the American Conference of Governmental Industrial Hygienists (ACGIH) specifies the threshold limit values (TLVs) of grain dust. In these standards, the maximum permissible concentration–time-weighted averages (PC-TWA) of free silica (<10% of the total dust concentration) is 4 mg/m3 [47,48].
In the TSP data of Figure 6b, the total dust concentration and free silica exceeded the OEL and TLV, potentially exposing the workers to upper respiratory tract irritation, pneumoconiosis, and allergic asthma. Although the limit of respirable dust concentration is not clearly defined, the PM10 concentration obviously exceeded the stipulated upper limit.

3.4. Particle Size Distributions

The size distributions in the TSP, PM10, and PM2.5 samples were determined from micrographs such as those in Figure 7. The TSP sample contained larger particles than the PM10 and PM2.5 samples, and was dominated by massive particles from the soil. It is mainly composed of small particles from the soil and irregular small particles of crushed peanut plants.
The sizes and size distributions of the dust particles collected by the samplers were statistically analyzed using the microscope-image recognition method. The analytically determined dispersion of mean particle sizes is presented in Figure 8. One third of the dust particles (68 particles; 33.2% of all particles) were sized 2.5 µm or smaller. Most of the PM10 dust particles (113 particles; 55.5% of all PM10 particles) were concentrated in the 2.5~10 µm size range. Particles larger than 50 µm accounted for 33.3% of all particles. From the above data, the dust particles collected by the samplers were mainly distributed in the 2.5~60 µm range. Therefore, the dust particles emitted during mechanized harvesting of peanuts should also be concentrated in this range. PMs within this range can harm the human respiratory system.

3.5. Morphology Analysis of Dust

Figure 9 shows the microscopic structures of the dust collected during the collection and harvesting of peanuts. Most of the dust particles at the harvesting site were mineral dust particles from the soil and irregular particles from the crushed grain. Panels (a) and (b) of Figure 9 are two representative images of the dust emissions. Dust particles of different sizes were mixed among the PVC membrane filter fibers. Most of the rough-edged dust originated from minerals. Agglomerated particles, unknown cell granulations, and debris particles were also present. Dust particles with rough edges can irritate lung tissue and may induce interstitial lung fibrosis [49,50]. Particles with sizes of 2–10 µm float in the air for more than 100 h, and can be inhaled. The lightweight particles from crushed peanut stalks may float over long distances, affecting the air quality and health of agricultural workers.

4. Conclusions

This paper characterized the dust emissions from mechanized peanut harvesting in China. The dust samplers were arranged in a cross-like configuration, and the dust was sampled on the site of peanut harvesting. The mass concentrations of the dust, effect of moisture content on dust concentration, dust-particle size distributions, free silica content in the dust, particulate distribution, and dust micro-morphologies were analyzed. The observed upper limits (PC-TWAs) of the total dust concentrations and free silica exceeded the OELs and TLVs. Most of the dust particles were concentrated in the 2.5–60 µm size range. The TSP and PM2.5 concentrations in the collected dust were significantly affected by the moisture content of the peanut plant. More massive particles were dispersed in the downwind when the wind speed was lower than the settling velocity of the particles. The particles emitted by the peanut harvesting (including some agglomerated particles, unknown cell granulations, and debris particles) were respirable, risking the air quality and health of the agricultural workers.
Based on the study results, protective harvesting is recommended, and the agricultural operations should be suspended or reduced during periods of high wind speed, low moisture, and low air humidity. The influence of dust removal methods on dust emission must be determined, and governments should speed up the formulation and enhancement of environmental regulations. They should also encourage the use of dust collection technology to gradually control and reduce PM emissions, and improve the dust removal device in mechanized harvesting technology to reduce dust emissions from the source. This study provides a reference for calculating the dust emission factors and regional air quality modeling of peanut harvesting operations in future work.

Author Contributions

Conceptualization, P.Z. and H.X.; methodology, Y.C.; software, Z.Y.; validation, P.Z., H.X. and Z.H.; investigation, P.Z.; data curation, M.C.; writing—original draft preparation, P.Z.; writing—review and editing, H.X. and E.M.; supervision, Z.H. All authors have read and agreed to the published version of the manuscript.

Funding

This research was funded was funded by The Natural Science Foundation of Jiangsu Province (Grant No. BK20190140), and the Central Public-interest Scientific Institution Basal Research Fund (Grant No. S202018 and S202011-01).

Institutional Review Board Statement

Not applicable.

Informed Consent Statement

Not applicable.

Data Availability Statement

The datasets used and/or analyzed during the current study are available from the corresponding author on reasonable request.

Conflicts of Interest

The authors declare that they have no competing interest.

References

  1. Chen, Z.; Gao, L.; Chen, C.; Butts, C.L. Analysis on technology status and development of peanut harvest mechanization of China and the United States. Trans. Chin. Soc. Agric. Mach 2017, 48, 1–21. [Google Scholar]
  2. Yang, M.L. Analysis on Situation of Agricultural Mechanization Development in the Next Five Years. Chin. Agric. Mech. 2011, 1, 9–14. (In Chinese) [Google Scholar] [CrossRef]
  3. Shang, S.Q.; Wang, F.Y.; Liu, S.G.; Zhao, Z.H.; Wang, J.C. Research situation and development trend on peanut harvesting machinery. Trans. Chin. Soc. Agric. Eng. 2004, 20, 20–25. [Google Scholar]
  4. Polin, J.P.; Gu, Z.; Humburg, D.S.; Dalsted, K.J. Source of airborne sunflower dust generated during combine harvester operation. Biosyst. Eng. 2014, 126, 23–29. [Google Scholar] [CrossRef]
  5. Sharratt, B.; Auvermann, B. Dust Pollution from Agriculture. Encycl. Agric. Food Syst. 2014, 2, 487–504. [Google Scholar]
  6. Wang, J.; Miller, D.R.; Sammis, T.W.; Hiscox, A.L.; Yang, W.; Holmén, B.A. Local dust emission factors for agricultural tilling operations. Soil Sci. 2010, 175, 194–200. [Google Scholar] [CrossRef]
  7. Chen, W.; Tong, D.Q.; Zhang, S.; Zhang, X.; Zhao, H. Local PM10 and PM2.5 emission inventories from agricultural tillage and harvest in northeastern China. J. Environ. Sci. 2017, 57, 15–23. [Google Scholar] [CrossRef]
  8. Zhou, L.; Chen, X.; Tian, X. The impact of fine particulate matter (PM2.5) on China’s agricultural production from 2001 to 2010. J. Clean. Prod. 2018, 178, 133–141. [Google Scholar] [CrossRef]
  9. Kasumba, J.; Holmén, B.A.; Hiscox, A.; Wang, J.; Miller, D. Agricultural PM10 emissions from cotton field disking in Las Cruces, NM. Atmos. Environ. 2011, 45, 1668–1674. [Google Scholar] [CrossRef]
  10. Erisman, J.W.; Bleeker, A.; Hensen, A.; Vermeulen, A. Agricultural air quality in Europe and the future perspectives. Atmos. Environ. 2008, 42, 3209–3217. [Google Scholar] [CrossRef] [Green Version]
  11. Bogman, P.; Cornelis, W.; Rollé, H.; Gabriels, D. Prediction of TSP and PM10 emissions from agricultural operations in Flanders, Belgium. In Proceedings of the 14th International Conference “Transport and Air Pollution”, Graz, Austria, 1–3 June 2005; pp. 1–3. [Google Scholar]
  12. Downey, D.; Giles, D.; Thompson, J. In situ transmissiometer measurements for real-time monitoring of dust discharge during orchard nut harvesting. J. Environ. Qual. 2008, 37, 574–581. [Google Scholar] [CrossRef] [PubMed]
  13. Polin, J.P.; Gu, Z.; Humburg, D.; Dalsted, K. Sunflower dust properties that contribute to increased fire risk during harvest and biorefinery operations. Ind. Crop. Prod. 2013, 50, 227–231. [Google Scholar] [CrossRef]
  14. Pye, K. Aeolian Dust and Dust Deposits; Elsevier: Amsterdam, The Netherlands, 2015. [Google Scholar]
  15. Capareda, S.; Wang, L.; Parnell, J.C.; Shaw, B. Particle size distribution of particulate matter emitted by agricultural operations: Impacts on FRM PM10 and PM2.5 concentration measurements. In Proceedings of the Beltwide Cotton Production Conferences, National Cotton Council, Memphis, TN, USA, 5–9 January 2004. [Google Scholar]
  16. Xue, B.; Mitchell, B.; Geng, Y.; Ren, W.; Müller, K.; Ma, Z.; Oliveira, J.A.P.; Fujita, T.; Tobias, M. A review on China’s pollutant emissions reduction assessment. Ecol. Indic. 2014, 38, 272–278. [Google Scholar] [CrossRef]
  17. Zhang, X.; Zhao, L.; Tong, D.Q.; Wu, G.; Dan, M.; Teng, B. A systematic review of global desert dust and associated human health effects. Atmosphere 2016, 7, 158. [Google Scholar] [CrossRef] [Green Version]
  18. Stacey, P.; Thorpe, A.; Roberts, P.; Butler, O. Determination of respirable-sized crystalline silica in different ambient environments in the United Kingdom with a mobile high flow rate sampler utilising porous foams to achieve the required particle size selection. Atmos. Environ. 2018, 182, 51–57. [Google Scholar] [CrossRef]
  19. Donham, K.J. Hazardous agents in agricultural dusts and methods of evaluation. Am. J. Ind. Med. 1986, 10, 205–220. [Google Scholar] [CrossRef] [PubMed]
  20. Geng, H.; Meng, Z.; Zhang, Q. In vitro responses of rat alveolar macrophages to particle suspensions and water-soluble components of dust storm PM2.5. Toxicol. Vitr. 2006, 20, 575–584. [Google Scholar] [CrossRef] [PubMed]
  21. Kumar, R.S.; Rajkumar, P. Characterization of minerals in air dust particles in the state of Tamilnadu, India through FTIR, XRD and SEM analyses. Infrared Phys. Technol. 2014, 67, 30–41. [Google Scholar] [CrossRef]
  22. Li, R.; Kou, X.; Xie, L.; Cheng, F.; Geng, H. Effects of ambient PM 2.5 on pathological injury, inflammation, oxidative stress, metabolic enzyme activity, and expression of c-fos and c-jun in lungs of rats. Environ. Sci. Pollut. Res. 2015, 22, 20167–20176. [Google Scholar] [CrossRef]
  23. Pope Iii, C.A.; Burnett, R.T.; Thun, M.J.; Calle, E.E.; Krewski, D.; Ito, K.; Thurston, G.D. Lung cancer, cardiopulmonary mortality, and long-term exposure to fine particulate air pollution. JAMA 2002, 287, 1132–1141. [Google Scholar] [CrossRef] [PubMed] [Green Version]
  24. Schwartz, J.; Zanobetti, A.; Bateson, T. Morbidity and mortality among elderly residents in cities with daily PM measurements. Revis. Anal. Time Ser. Stud. Air Pollut. Health 2003, 5, 25–58. [Google Scholar]
  25. Von Klot, S.; Peters, A.; Aalto, P.; Bellander, T.; Berglind, N.; D’Ippoliti, D.; Elosua, R.; Hörmann, A.; Kulmala, M.; Lanki, T.; et al. Ambient air pollution is associated with increased risk of hospital cardiac readmissions of myocardial infarction survivors in five European cities. Circulation 2005, 112, 3073–3079. [Google Scholar] [CrossRef] [Green Version]
  26. The National Oil Crop Production Development Plan Was Promulgated (2016–2020); National Development and Reform Commission, Ministry of Agriculture and Rural Affairs and National Forestry Administration: Beijing, China, 2016. Available online: http://www.moa.gov.cn/nybgb/2016/dishiqi/201711/t20171126_5919612.htm (accessed on 29 October 2021). (In Chinese)
  27. Li, J.; Song, Y.; Mao, Y.; Mao, Z.; Wu, Y.; Li, M.; Huang, X.; He, Q.; Hu, M. Chemical characteristics and source apportionment of PM2.5 during the harvest season in eastern China’s agricultural regions. Atmos. Environ. 2014, 92, 442–448. [Google Scholar] [CrossRef]
  28. DB41/T-2020. Guiding Opinions on Control of Dust from Mechanized Peanut Harvesting in Henan Province; Department of Ecology and Environment of Henan Province: Henan, China; Administration for Market Regulation Henan Province: Luoyang, Henan, China, 2019. (In Chinese) [Google Scholar]
  29. Management Norms for Prevention and Control of Dust Pollution Caused by Mechanized Harvesting and Hulling of Peanuts; Local Standard Information Service Center, Department of Ecology and Environment of Henan Province: Zhengzhou, Henan, China, 2020. (In Chinese)
  30. DB41/T 1967–2020. Technical Specification for Prevention and Control of Dust Pollution from Mechanized Harvesting of Peanuts; Local Standard Information Service Center, Department of Ecology and Environment of Henan Province: Zhengzhou, Henan, China, 2020. (In Chinese) [Google Scholar]
  31. FAO. Food and Agriculture Data; Food and Agriculture Organization of the United Nations: Rome, Italy, 2020. [Google Scholar]
  32. Liu, D. Investigation on Peanut Planting Area and Production Situation in 2020. In Proceedings of the China Peanut Industry Development Conference, Qingdao, China, 8–9 July 2021. (In Chinese). [Google Scholar]
  33. Shi, X.; Yu, D.; Warner, E.; Pan, X.; Petersen, G.; Gong, Z.; Weindorf, D. Soil database of 1:1,000,000 digital soil survey and reference system of the Chinese genetic soil classification system. Soil Surv. Horiz. 2004, 45, 129–136. [Google Scholar] [CrossRef]
  34. Shi, X.; Yu, D.; Warner, E.D.; Sun, W.; Petersen, G.; Gong, Z.; Lin, H. Cross-reference system for translating between genetic soil classification of China and soil taxonomy. Soil Sci. Soc. Am. J. 2006, 70, 78–83. [Google Scholar] [CrossRef]
  35. CEN 481-1993. Workplace Atmospheres: Size Fraction Definitions for Measurement of Airborne Particles in the Workplace; Centre European de Normalisation, CEN: Brussels, Belgium, 1993; Volume EN 481. [Google Scholar]
  36. ISO. Stationary Source Emissions Determination of Mass Concentration of Particulate Matter (Dust) at Low Concentrations—Manual Gravimetric Method; International Organisation for Standardisation: Geneva, Switzerland, 2002; p. 12141. [Google Scholar]
  37. GBZ 3543.6. Rules for Agricultural Seed Testing. Determination of Moisture Content; Standardization Administration of the People’s Republic of China: Beijing, China, 1995. [Google Scholar]
  38. Concha, F.; Almendra, E. Settling velocities of particulate systems, 1. Settling velocities of individual spherical particles. Int. J. Miner. Process. 1979, 5, 349–367. [Google Scholar] [CrossRef]
  39. GBZ/T 192.3. Method for Determination of Dust in the Air of Workplace. Part 3: Distribution of Particulate; Standardization Administration of the People’s Republic of China: Beijing, China, 2007. [Google Scholar]
  40. ISO 13322-1. Particle Size Analysis—Image Analysis Methods. Part 1: Static Image Analysis Methods; International Organization for Standardization: Geneva, Switzerland, 2014; Available online: https://www.iso.org/standard/38664.html (accessed on 26 October 2021).
  41. GBZ/T 192.1. Determination of Dust in the Air of Workplace. Part 1: Total Dust Concentration; Standardization Administration of the People’s Republic of China: Beijing, China, 2007. [Google Scholar]
  42. GBZ/T 192.2. Method for Determination of Dust in the Air of Workplace. Part 2: Respirable Dust Concentration; Standardization Administration of the People’s Republic of China: Beijing, China, 2007. [Google Scholar]
  43. Azam, S.; Mishra, D.P. Effects of particle size, dust concentration and dust-dispersion-air pressure on rock dust inertant requirement for coal dust explosion suppression in underground coal mines. Process Saf. Environ. Prot. 2019, 126, 35–43. [Google Scholar] [CrossRef]
  44. He, R.W.; Li, Y.Z.; Xiang, P.; Li, C.; Cui, X.Y.; Ma, L.Q. Impact of particle size on distribution and human exposure of flame retardants in indoor dust. Environ. Res. 2018, 162, 166–172. [Google Scholar] [CrossRef] [PubMed]
  45. Hiscox, A.L.; Miller, D.R.; Holmén, B.A.; Yang, W.; Wang, J. Near-field dust exposure from cotton field tilling and harvesting. J. Environ. Qual. 2008, 37, 551–556. [Google Scholar] [CrossRef] [PubMed] [Green Version]
  46. Chang, X.; Sun, L.; Yu, X.; Jia, G.; Liu, J.; Liu, Z.; Zhu, X.; Wang, Y. Effect of windbreaks on particle concentrations from agricultural fields under a variety of wind conditions in the farming-pastoral ecotone of northern China. Agric. Ecosyst. Environ. 2019, 281, 16–24. [Google Scholar] [CrossRef]
  47. GBZ.2.1. Occupational Exposure Limits for Hazardous Agents in the Workplace. Part 1: Chemical Hazardous Agents; Standardization Administration of the People’s Republic of China: Beijing, China, 2019. [Google Scholar]
  48. ACGIH. TLVs® and BEIs®: Threshold Limit Values for Chemical Substances and Physical Agents and Biological Exposure Indices; American Conference of Governmental Industrial Hygienists Cincinnati: Cincinnati, OH, USA, 2020. [Google Scholar]
  49. Chen, J.; Wang, X.; Lou, J.; Liu, Z. Relationship of jute dust to interstitial fibrosis in rat lung. Agric. Ecosyst. Environ. 2003, 58, 151–155. [Google Scholar] [CrossRef]
  50. Li, W.; Liu, L.; Xu, L.; Zhang, J.; Yuan, Q.; Ding, X.; Hu, W.; Fu, P.; Zhang, D. Overview of primary biological aerosol particles from a Chinese boreal forest: Insight into morphology, size, and mixing state at microscopic scale. Sci. Total. Environ. 2020, 719, 137520. [Google Scholar] [CrossRef] [PubMed]
Figure 1. Intelligent middle flow total suspended particulate sampler.
Agriculture 11 01068 g001
Figure 2. Status of peanut harvesting operations in Henan, China.
Agriculture 11 01068 g002
Figure 3. (a) Distribution of sampling sites for measuring the dust concentration; (b) photograph of the actual field test.
Agriculture 11 01068 g003
Figure 4. Dust-concentration distribution versus distance from the combine harvester, expressed as (a) line plots and (b) planar contours.
Agriculture 11 01068 g004
Figure 5. Dust concentration as a function of dust type and moisture content of the peanut straw.
Agriculture 11 01068 g005
Figure 6. Quantitative analysis of free silica: (a) linear fitting of the standard curve for determining free silica content; (b) dust concentration (left vertical axis) and free silica content (right vertical axis) in the different dust types.
Agriculture 11 01068 g006
Figure 7. Electron microscope images of dust particles from the peanut harvesting operations: (a) TSP, (b) PM10, and (c) PM2.5.
Agriculture 11 01068 g007
Figure 8. Dispersion of average particle sizes in the collected dust.
Agriculture 11 01068 g008
Figure 9. SEM micrographs of the dust particles from peanut harvesting operations: (a) soil dust particles, and (b) grain dust particles.
Agriculture 11 01068 g009
Table 1. Dust-concentration sampling conditions.
ParameterValue
Diameter of glass microfiber (mm)90
Sampling flow (L/min)100 ± 0.20
Sampling duration (min)60
Atmospheric pressure (kPa)101.5
Average temperature (°C)29.6
Average humidity (%RH)39.5
Average wind velocity (m/s)0.64
Moisture content of peanut straw (%)13.8
Rate of harvesting operation (kh2/h)0.7
Distance of sampling point from combine (m)3,10, 20, 30, 50
Type of peanut combine4HJL-Z
Area of harvesting operation (ha)0.47
Publisher’s Note: MDPI stays neutral with regard to jurisdictional claims in published maps and institutional affiliations.

