Article

Identification of a Novel QTL for Chlorate Resistance in Rice (Oryza sativa L.)

Department of Southern Area Crop Science, National Institute of Crop Science, RDA, Miryang 50424, Korea
*
Author to whom correspondence should be addressed.
Agriculture 2020, 10(8), 360; https://doi.org/10.3390/agriculture10080360
Submission received: 17 July 2020 / Revised: 13 August 2020 / Accepted: 13 August 2020 / Published: 15 August 2020
(This article belongs to the Special Issue Rice Breeding and Genetics)

Abstract

:
Chlorate resistance analysis is an effective approach commonly used to distinguish the genetic variation between Oryza sativa L. ssp. indica and japonica, and predict the nitrogen use efficiency (NUE). This study aimed at investigating the response of a doubled haploid (DH) population derived from anther culture of 93-11 × Milyang352 exposed to 0.1% potassium chlorate (KClO3) at the seedling stage. The results revealed that the parental rice lines 93-11 (indica) and Milyang352 (japonica) showed distinctive phenotypic responses. The parental line 93-11 scored highly sensitive (0% survival) and Milyang352 scored resistant (66.7% survival) 7 days after treatment. The DH lines reflected the differential phenotypic response observed in parental lines. Interestingly, we identified a novel quantitative trait locus (QTL) for chlorate resistance on chromosome 3 (qCHR-3, 136 cM, logarithm of the odds—LOD: 4.1) using Kompetitive Allele-Specific PCR (KASP) markers. The additive effect (−11.97) and phenotypic variation explained (PVE; 14.9%) indicated that the allele from Milyang352 explained the observed phenotypic variation. In addition, shoot growth showed a significant difference between parental lines, but not root growth. Moreover, in silico analysis identified candidate genes with diverse and interesting molecular and physiological functions. Therefore, this study suggested that the QTL qCHR-3 harbors promising candidate genes that could play a role in the regulation of nitrogen metabolism in rice.

1. Introduction

Rice is the only cereal crop solely cultivated for human consumption, in addition to being the staple food crop for more than half of the world’s population [1]. Among the cultivated species, Oryza sativa L. is the most cultivated species across the globe [2], and comprises two subspecies, indica and japonica. The indica and japonica rice are reported to have a large genetic variation [3,4], which could be explained in part by the evolutionary genetic differentiation and the independent domestication processes of both rice subspecies investigated through comparative genomic studies [5].
To distinguish the genetic variation between indica and japonica rice subspecies, the resistance to potassium chlorate (KClO3) is commonly used as a reliable strategy, and has been shown to be effective [6,7]. Genotypes exhibiting a high degree of chlorate resistance are expected to have low nitrogen use efficiency (NUE), while those showing a sensitive phenotypic response toward potassium chlorate (KClO3) are expected to have high NUE [8]. A recent report supported that the indica and japonica subspecies differ in their ability to assimilate nitrate (NO3), and therefore have a differential nitrogen use efficiency (NUE) [8]. Gao and colleagues [9] identified nitrate reductase (OsNR2) as the major component explaining NUE difference, and the indica allele of NR2 confers high NUE. The indica allele of nitrate reductase (OsNR2) was reported to promote NO3 uptake, while interacting with the nitrate transporter, OsNRT1.1B, resulting in improved NUE [10]. The japonica group is typically known for having a higher degree of resistance to KClO3 compared with the indica type [11].
In a converse approach, KClO3 is also used to investigate nitrogen metabolism in higher plants, by monitoring nitrate (NO3) uptake, transport, and assimilation, as the main source of nitrogen [12]. In addition, chlorate (ClO3) and nitrate (NO3) are substrates for the nitrate reductase (NR) enzyme that reduces ClO3 to the toxic chlorite, inducing high toxicity in plants [13,14,15]. Chlorates have been reported to have an inhibitory effect on the reducing activity of NR [13]. A number of studies have used ClO3 to isolate mutant plants that are defective in nitrate reduction [14,16], while others supported that when ClO3 was applied exogenously to Arabidopsis plants, an increase in NR mRNA level was observed, but the total NR protein synthesis was not affected [16].
The rate-limiting step of the NO3 assimilation pathway has been suggested to be involved in the reduction of NO3 to nitrite (NO2), which is catalyzed by nitrate reductase [12]. Furthermore, chlorate has been shown to play an important role as a selective inhibitor in dissimilatory nitrate reduction, which is part of the nitrogen biological cycle [17].
Potassium chlorate (KClO3) belongs to the group of chlorates known as oxidizers having a strong toxic effect on plants when applied for a long time or at a high dose [18,19]; they are able to induce oxidative stress, which may result in oxidative damage and lipid peroxidation [20].
The primary step of nitrogen acquisition by roots is the active transport across the plasma membrane of root epidermal and cortical cells. In higher plants, various nitrate transporters/ peptide transporter (NRT1/PTR) and ammonium (NH4) transporters (AMTs) are identified, and reported to be involved in nitrogen uptake and assimilation [21]. Nitrogen assimilation is the formation of organic nitrogen compounds like amino acids from inorganic nitrogen compounds present in the environment. Organisms like fungi, certain bacteria and the majority of plants that cannot fix nitrogen gas (N2) depend on the ability to assimilate nitrate or ammonia for their needs. Other organisms, such as animals, depend entirely on organic nitrogen for their food [22].
Recent advances in plant molecular breeding and genomics have revolutionized the understanding of the genetic response mechanisms of plants to diverse environmental cues. The application of strategic approaches, such as Genome-Wide Association Studies (GWAS) [23,24,25] and OMICS [26], and the emergence of genome sequencing technologies [27,28] significantly increased in the last two decades with the purpose of investigating the functional genetic components of plants involved in the control of major quantitative traits in plants. Genetic mapping and linkage analysis, coupled with GWAS, are considered as powerful tools that help to identify genetic loci affecting important traits in plants, including rice as the established model plant for monocots [29,30,31], and predict quantitative trait loci (QTLs) [32] contributing to the overall plant mechanism under various conditions.
Thus, this study aimed at identifying QTLs associated with chlorate resistance in rice using Kompetitive Allele-Specific PCR (KASP) markers. Therefore, a doubled haploid rice population and parental lines were exposed to potassium chlorate (KClO3) at the seedling stage. The linkage groups were constructed and QTLs were analyzed for all traits considered.

2. Materials and Methods

2.1. Mapping Population and Potassium Chlorate Treatment

The mapping population was a doubled haploid (DH) population derived from anther culture of the cross between 93-11 and Milyang352 (typical indica subspecies (P1) and japonica subspecies (P2), respectively) [33]. A total of 117 rice doubled haploid lines developed through anther culture and both parental lines were used in the study.
Prior to germination, rice seeds were soaked into 0.7% nitric acid (HNO3) (CAS: 7697-37-2, Lot No. 2016B3902; Junsei Chemical Co. Ltd., Tokyo, Japan) for 24 h to break the dormancy [34], followed by incubation at 27 °C for 48 h to induce germination. Seedlings with uniform height (six seedlings per treatment per rice line) were transferred into 50 mL falcon tubes prior to KClO3 application. The roots of seedlings were dipped into 5 mL of 0.1% potassium chlorate (KClO3) (CAS: 3811-04-9, Lot No. BCBW5513; Sigma-Aldrich, St. Louis, MO, USA) solution (pH 5.6) and placed in a growth chamber under dark conditions for 7 days at about 25 °C [6]. The KClO3 solution was replaced three days after initial supplementation by irrigation method. Control seedlings were supplemented with distilled water only. The phenotypic response was recorded 7 days after KClO3 treatment and used for the construction of the linkage groups and QTL analysis. The chlorate resistance was calculated as the percentage of the [(total number of tested seedlings − number of dead seedlings in KClO3)/total number of tested seedlings] × 100. Rice DH lines with a percentage of survival above or equal to 60% were scored resistant to potassium chlorate, while those with a survival percentage below or equal to 50% were scored sensitive. However, shoot inhibition was estimated as the percentage of the [(shoot length under control (SLC) − shoot length under KClO3 (SL_KClO3)/SLC] × 100. The latter formula was also used to estimate the root inhibition percentage [6]. Six replications were used to evaluate the phenotypic response of the DH population to potassium chlorate.

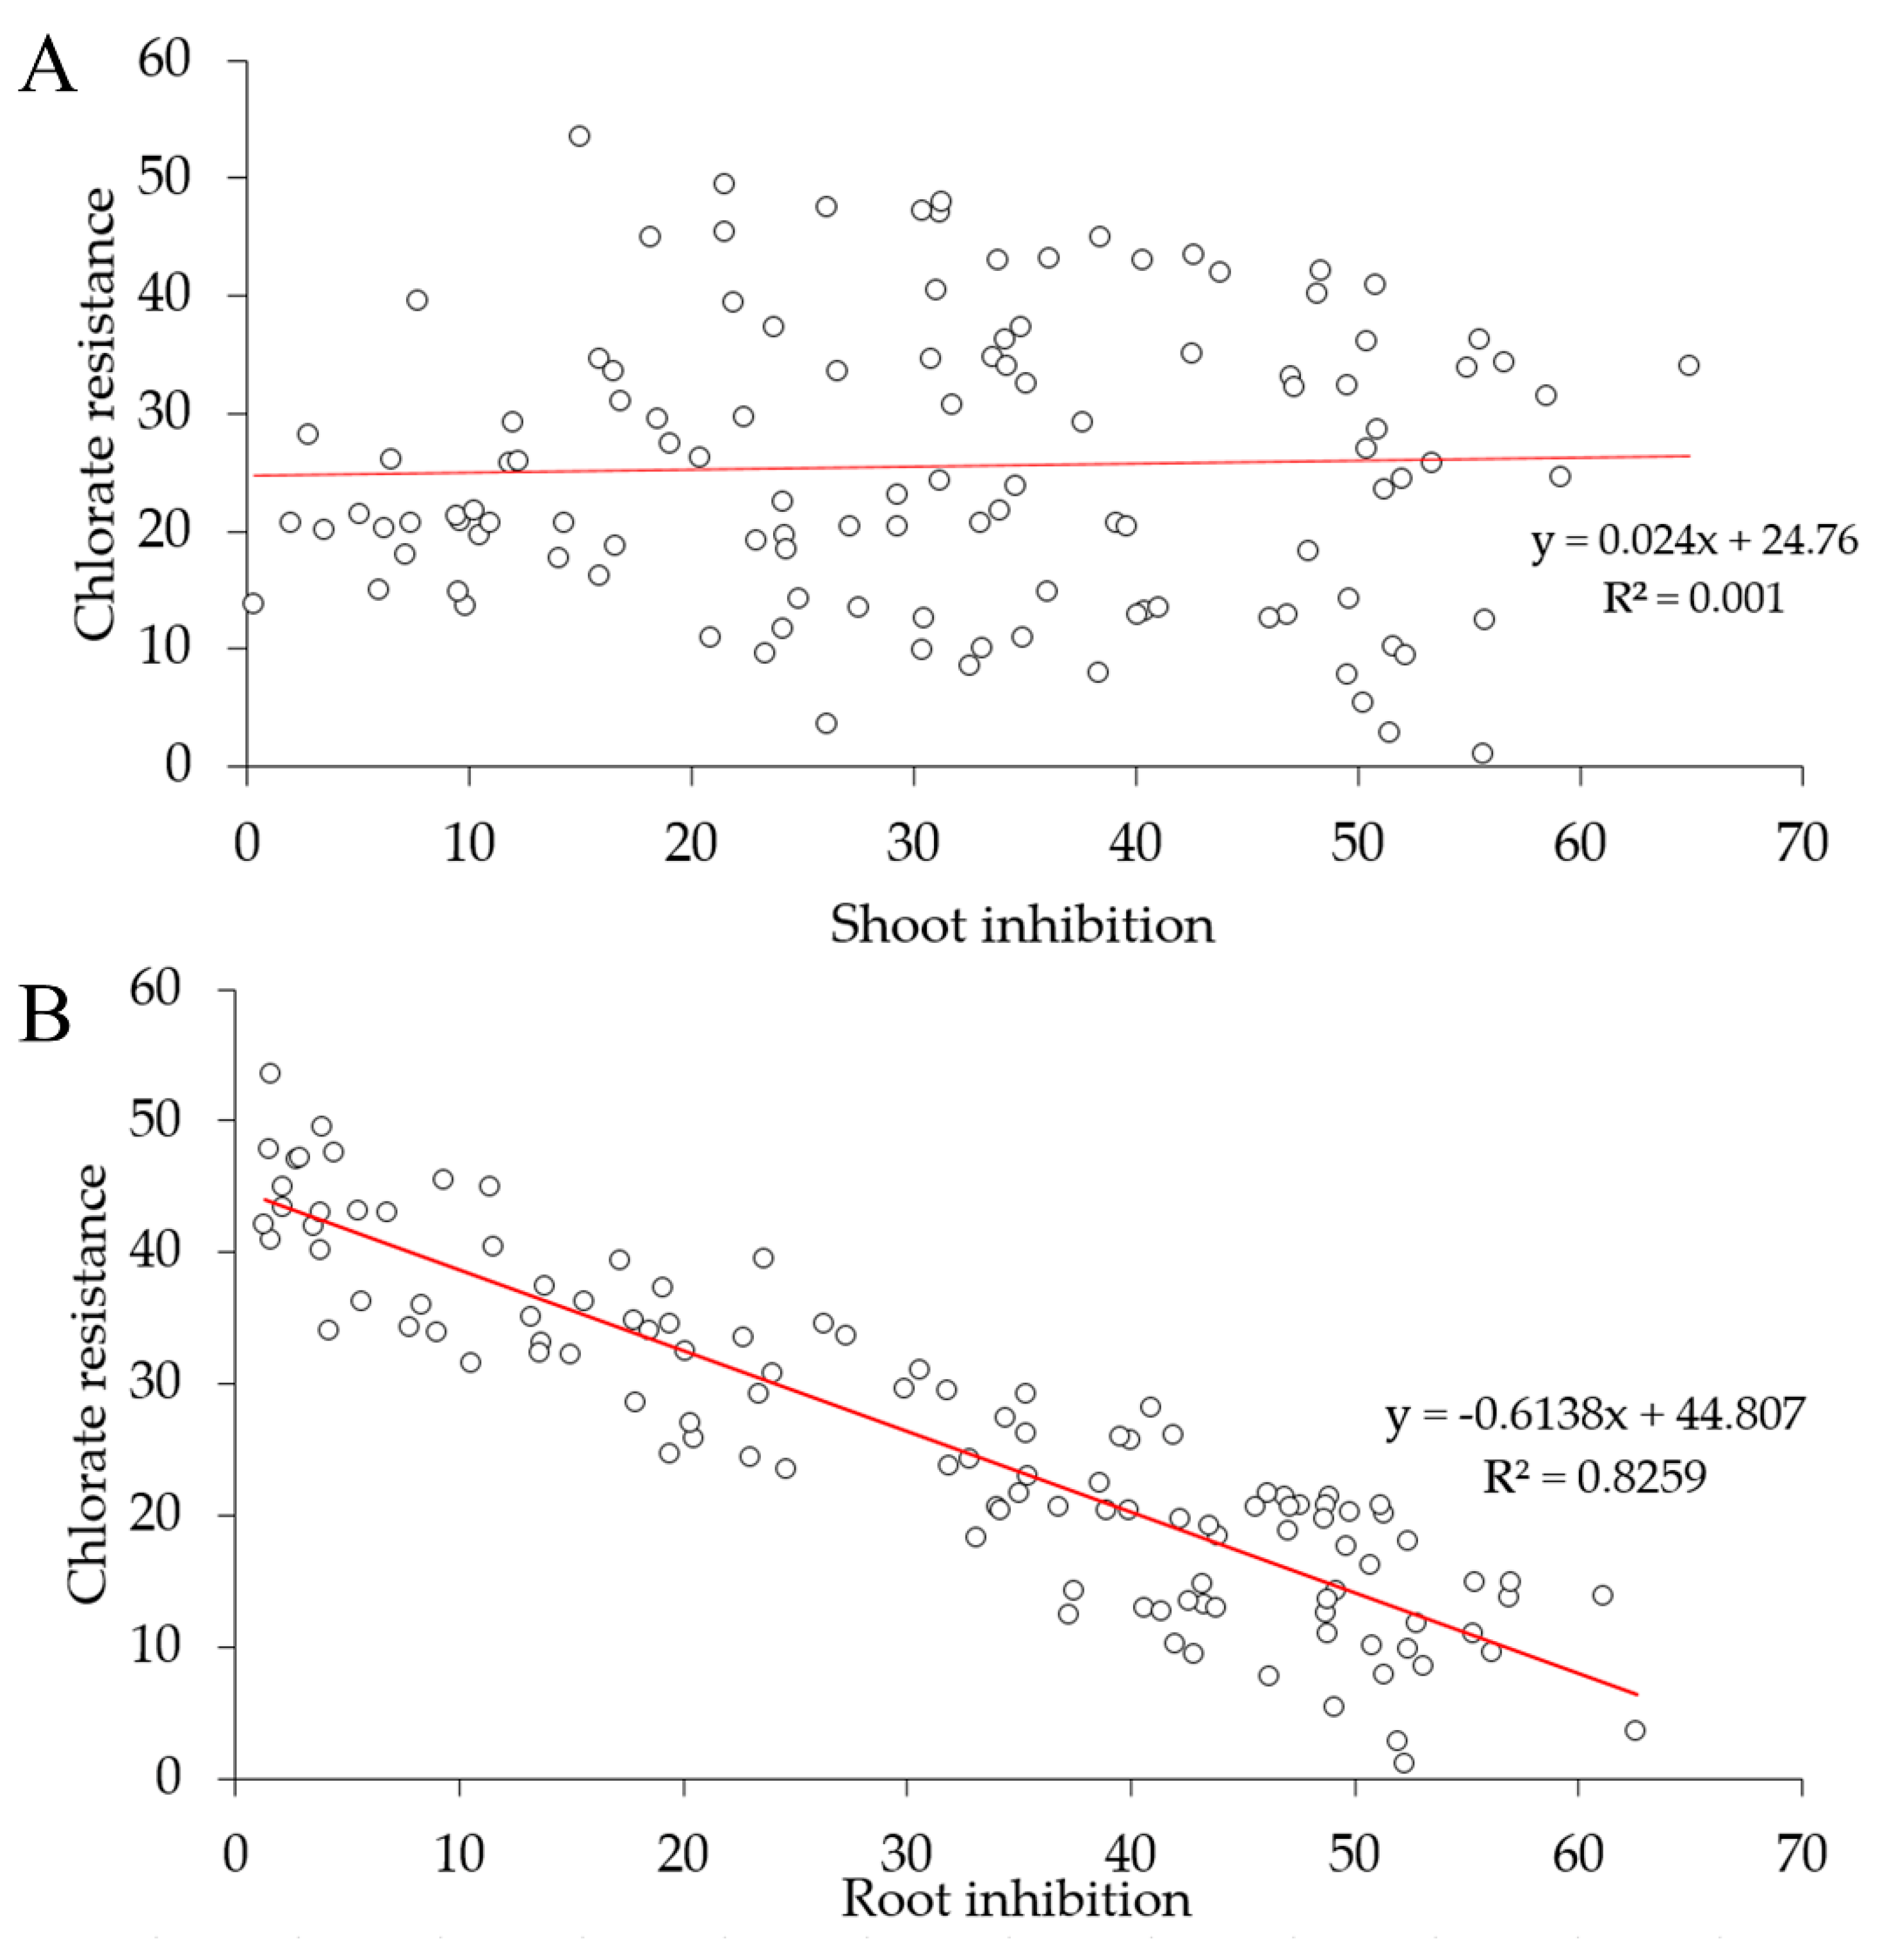
2.2. Q–Q Plot, Frequency Distribution, Correlation Analysis, and Principal Component Analysis

The Quantile–Quantile (Q–Q) plots, frequency distribution, and correlation analysis of all phenotypes of the mapping population, the pairwise kinship matrix, KASP marker density per chromosome, heat map, and principal component analysis were visualized using qqplotr, heatmap.2, tidiverse, cluster, factoextra (for heat map only), GAPIT/LDheatmap, and ggplot2 R packages in RStudio [35,36].

2.3. Construction of Linkage Map and QTL Analysis

The genotype and phenotype data consisted of 229 KASP markers [37] and a population of 117 rice DH lines and parental lines that were used for detecting QTLs associated with chlorate resistance and constructing the genetic linkage map. Phenotypic traits studied were shoot length (SLC for control and SL_KClO3 for treatment) and root length (RLC for control and RL_KClO3 for treatment) under both normal (water) and KClO3 treatment, shoot and root inhibition percentage, and the degree of chlorate resistance (percentage of survived seedlings). An initial formatting of phenotype and genotype raw data was done using fread, pheno.raw, geno.raw, and cbind functions in RStudio environment (v.1.2.5042, 2009–2020; RStudio Inc., Boston, MA, USA). The linkage map was constructed for a bi-parental population with IciMapping software v.4.1.0.0 using position mapping and Kosambi mapping functions [38]. The threshold of logarithm of the odds (LOD) was set as 3.0 (alpha = 0.05) to explain the probability for detecting statistically significant QTLs associated with the chlorate resistance [39].

2.4. Genomic DNA Extraction and Genotyping

The genomic DNA was extracted from leaf samples using the previously described CTAB method with slight modifications [40]. Briefly, frozen leaf samples were crushed in 1.5 mL Eppendorf tubes (e-tubes). Then, 600 μL of 2X CTAB buffer (D2026, Lot D2618U12K; Biosesang, Seongnam-si, Korea) was added and the mixture was vortexed and incubated for 30 min at 65 °C in a dry oven. A solution containing 500 μL of PCI (Phenol:Chloroform:Isoamylalcohol, 25:24:1, Batch No. 0888k0774; Sigma-Aldrich, St. Louis, MO, USA) was added, followed by gentle mixing by inversion. The tubes were centrifuged for 15 min at 13,000 rpm, and the supernatant was transferred to fresh e-tubes, followed by the addition of 500 μL of isopropanol (CAS: 67-63-0, Lot No. SHBC3600V; Sigma-Aldrich, St. Louis, MO, USA), mixing by inversion, incubation at −20 °C for 1 h, and centrifugation at 13,000 rpm for 7 min. The supernatant was removed and the pellets were washed with 70% ethanol (1 mL). Samples were centrifuged at 13,000 rpm for 2 min and ethanol was discarded, followed by drying at room temperature and re-suspension in 100 μL 1X TE buffer (Lot No. 0000278325; Promega, Madison, WI, USA).
The genotyping of parental lines for nitrate reductase (NR) and nitrate transporter (NRT) genes was done by Polymerase Chain Reaction (PCR) using OsNR-IND2194 and OsNRT-M10-22 insertion/deletion (InDel) markers. The reaction volume was 15 µL composed of 1.5 µL 10X reaction buffer, 0.8 µL 10 mM dNTP, 1 µL primers (forward and reverse), 0.1 µL Taq polymerase, and adjusted to the final volume with nuclease-free water. A 3-step cycling reaction was performed including polymerase activation at 95 °C for 5 min, strand separation at 94 °C for 20 s, annealing at 56–59 °C for 30 s for 35 cycles, extension at 72 °C for 1 min/kb, and a final extension at 72 °C for 5 min. The amplicons were separated on 3% agarose gel electrophoresis and the bands were visualized using the gel documentation system. The sequences of InDel primers can be found in Table S1.

2.5. Comparative Alignment of Coding Sequences (CDS) of Candidate Genes between Indica and Japonica Subspecies

We were also interested in investigating the similarity between homolog genes in indica and japonica subspecies in order to predict the similarity of the function of the protein they encode. Therefore, we aligned the coding sequences (CDS) of each gene, downloaded from the Nipponbare genome database (http://rice.plantbiology.msu.edu) for japonica, and indica rice genome database (http://plants.ensembl.org/Oryza_indica), using ClustalW Multiple Alignment function in BioEdit Sequence Alignment Editor [41].

3. Results

3.1. Differential Phenotypic Response of Parental Genotypes and DH Lines

The pattern of shoot growth indicated differential shoot inhibition among DH lines under potassium chlorate treatment (Figure S1A).
The parental line 93-11 (P1, indica subspecies) recorded an average shoot growth reduction of 45%, while the japonica rice cultivar Milyang352 showed about 36% shoot growth inhibition (Figure S1A). The density plot (heat map) displayed the relationship between shoot inhibition and chlorate sensitivity level (Figure S1B). The color intensity showed the degree of chlorate sensitivity of the entire DH population compared to the shoot growth inhibition pattern. Data indicated that a right (positive) skewness for shoot length and root length under control conditions was observed, which revealed the asymmetry from the normal distribution for chlorate resistant trait, while showing a negative Kurtosis relative to the mean (Table S2, Figure 1A,C,E,G). A normal distribution was observed in shoot length and root length under potassium chlorate treatment (Figure 1B,D), also supported by the Q–Q plots (Figure 1F,H). In addition, panels I to M in Figure 1 show a positive skewness for shoot and root inhibition and the chlorate resistance scores of DH lines.
Moreover, the correlation analysis revealed that there was a very weak positive correlation or non-existing correlation between shoot inhibition and chlorate resistance of DH lines (Figure 2A, Table S3). However, a strong negative correlation was observed between root inhibition and chlorate resistance (Figure 2B, Table S3).
Roots are the first organs of plants to sense the stress when exposed to disturbed environment media conditions [42]. Therefore, we evaluated the growth pattern of roots in all DH lines and parental lines. The rice cultivar 93-11 (chlorate-sensitive) showed no significant difference in root inhibition when compared with Milyang352 (chlorate-resistant) (Figure S2A). Furthermore, a differential root growth was observed among the DH lines, indicated by the contrasting green/red patterns in Figure S2B. About 30% of the DH lines recorded an increase in root growth after being exposed to KClO3 (see root inhibition (RI) column, red color strip), whereas about 60% showed an opposite pattern (RI column, green color strip). Moreover, the degree of chlorate resistance did not systematically match the shoot (SI) or root (RI) inhibition pattern. A significant difference in shoot growth inhibition between 93-11 and Milyang352 was observed (Figure 3A,B), but no significant difference was found in root growth inhibition between 93-11 and Milyang352 (Figure 3A,C). Among the 117 rice DH lines, about 24.6% scored resistant (P2 type, above 66% survival) and 75.4% scored sensitive (P1 type, below 50% survival). The parental rice cultivar 93-11 scored highly sensitive (0% survival), while Milyang352 scored resistant (66.7% survival).

3.2. Relatedness and Principal Component Analysis (PCA)

The KASP marker-based kinship matrix (Figure 4A), also known as co-ancestry or half-relatedness, showed the distribution of coefficients of co-ancestry, with the stronger red color indicating individuals that were more related to each other or shared genomic regions derived from common parental lines (93-11 × Milyang352). The principal component analysis (PCA) revealed the contribution from three principal components (PCs) (Figure 4B). In addition, a weak correlation between shoot or root inhibition reduction and chlorate resistance level was observed (Figure 4C). Principal components 1 (PC1) and 2 (PC2) explained about 44.9% and 34.6%, respectively, of the total variation of the phenotypic response of the DH lines, which resulted in the cumulative proportion of 79.5% (Figure 4D). PC1 predicted the existence of a positive correlation between shoot inhibition and chlorate resistance, whereas PC2 suggested a negative correlation between root inhibition and chlorate resistance.

3.3. Novel QTL for Chlorate Resistance Detected on Chromosome 3 in Rice

The result of linkage analysis and QTL mapping revealed the detection of a novel putative QTL associated with chlorate resistance on chromosome 3 at 136 cM (Table 1, Figure 5). KASP markers flanking the QTL qCHR-3 were ah03001094 and id3005168. The distribution of KASP markers over 11 linkage groups (LG) was even, with LG3 and LG7 being the most densely covered (Figure S3).
Candidate genes (Table 2) were pooled from the region covering about 300 kb, the closest to the right marker (the closest to the QTL) flanking the right side of the detected QTL.
Large deletion mutations between indica and japonica were discerned in eight genes (Table 2).

3.4. InDel Markers Amplified Polymorphic Bands between Parental Lines

After their exposure to potassium chlorate (0.1%), parental rice lines 93-11 (P1) and Milyang352 (P2) showed distinctive phenotypic responses toward KClO3, sensitive and tolerant, respectively. We were further interested to investigate the presence of resistance alleles of previously reported genes controlling chlorate resistance in plants, such as nitrate reductase (NR) and nitrate transporter (NRT) [8,10], using the InDel markers, OsNR-IND2194 and OsNRT-M10-22. The genotyping results of parental lines indicated that both the InDel markers amplified polymorphic bands between the parental lines. OsNR-IND2194 amplified a band size of 200 bp in 93-11 (P1) and 188 bp in Milyang352 (P2) (Figure 6A). OsNRT-M10-22 amplified polymorphic bands of 165 bp in 93-11 and 213 bp in Milyang352 (Figure 6C,D). The amplified band sizes matched the deletion of nucleotides observed through in silico analysis of NR- and NRT-coding sequences (CDS) in indica and japonica databases (Figure 6B,D).

4. Discussion

Genotypes exhibiting a high degree of chlorate resistance are expected to have low nitrogen use efficiency (NUE), while those showing a sensitive phenotypic response toward potassium chlorate (KClO3) are expected to have high NUE [8]. The rice cultivar 93-11 harbors the indica allele of nitrate reductase (OsNR2), which was reported to promote NO3 uptake, while interacting with the nitrate transporter, OsNRT1.1B, and improving the NUE [10]. Here, we reported that the indica cultivar 93-11 (P1) was highly sensitive to KClO3 treatment, whereas japonica cultivar Milyang352 (P2) showed a resistant phenotype. We observed that about 75.6% of the mapping population scored sensitive and about 24.4% showed a resistant phenotype, as explained by principal components PC1 and PC2 (Figure 4C). Moreover, shoot inhibition showed a very weak positive correlation that could also be regarded as a non-existing correlation with the recorded chlorate resistance of DH lines (Figure 4D), which implied that the degree of chlorate resistance of the studied DH lines was independent of shoot inhibition in response to KClO3. Under the same conditions, a strong negative correlation was observed between root inhibition and chlorate resistance. Therefore, it may be suggested that a high degree of chlorate resistance could be explained in part by the low reduction in root inhibition under KClO3 treatment.
In addition, the phenotypic records of all traits and the genotype data of the 117 DH lines and parental lines were used to perform a QTL analysis. Of the seven traits evaluated, one significant QTL for chlorate resistance was detected on chromosome 3 in rice. The QTL, qCHR-3 located at 136 cM, is flanked by KASP markers ah03001094 (left, 126.5 cM) and id3005168 (right, 146.5 cM), the latter being closer to the QTL. The resistance allele of the detected QTL was contributed by Milyang352. This QTL counted for 14.9% of the observed phenotypic variation. In addition, the genetic region covered by qCHR-3 harbors genes identified as interesting candidate genes. From their specific functional annotations and conserved domains, these candidate genes resemble in their putative functions, previously reported genes from the same family or belonging to other protein families, for their role in the regulation of nitrogen metabolism or photosynthetic process in plants (Table 2). Previous studies identified genetic loci associated with chlorate resistance and nitrogen use efficiency (NUE) in rice at chromosome 2 (qCR-2) [9]. Moreover, fine mapping of these loci allowed the identification of genes such as nitrate reductase (OsNR2, Chr2) and nitrate transporter (OsNRT1.1B, Chr10) [62,63]. Furthermore, Teng and his colleagues [6] reported earlier the detection of QTLs associated with chlorate resistance (qCHR-2, qCHR-8, and qCHR-10) in an F1 DH population. These genes were reported for playing an important role in the initial steps of nitrate assimilation and transport in plants, one acting to convert nitrate (NO3) to nitrite (NO2) and the other transporting NO3 throughout the cell. The QTLs, qCHR-2, qCHR-8, and qCHR-10, were reported to explain about 26.5%, 12.6%, and 12.6% of the phenotype variance [6]. The results of genotyping (Figure 6) indicated that the parental lines 93-11 (indica) and Milyang352 (japonica) amplified polymorphic bands of both the OsNR-IND2194 and OsNRTM-10-22 markers, matching the deletion patterns observed between indica and japonica through in silico analysis.
From another perspective, NUE is regarded as a complex and integrated mechanism, which can be controlled at different levels, under the influence of various cellular components and metabolic processes [64,65,66,67,68]. It is said that carbon and nitrogen metabolism are intimately related, considering the fact that about 55% of the net carbon in plants, is allocated to nitrogen assimilation and metabolism [69]. Moreover, the authors supported that the energy and carbon supplied from the photosynthetic electron transport chain (ETC), carbon dioxide (CO2) fixation, respiration, or tricarboxylic acid (TCA) cycle are shared by carbon and nitrogen metabolisms [67,70].
Thus, among the candidate genes listed in Table 2, we identified genes coding for ubiquitin-activating enzyme E1 [44,45], ubiquitin-conjugating enzyme, 26S proteasome AtRPT2a [45], senescence-associated gene 20 (SAG20) [49], Calvin cycle protein CP12 [50,51], etc., which share specific conserved domains with previously reported genes for being linked to the regulation of the nitrogen metabolism in plants. Therefore, this QTL could serve as a target locus for breeding for NUE and functional studies. In addition, the large deletion mutations found in the coding sequences of some of the selected candidate genes could be exploited to investigate their differential transcriptional regulation between indica and japonica subspecies.

5. Conclusions

Understanding chlorate resistance and the genes involved in the process would help to better comprehend the mechanism underlying nitrogen metabolism in plants and develop rice varieties with increased efficiency in the use of nitrogen. The present study identified a novel QTL associated with chlorate resistance in rice using Kompetitive Allele-Specific PCR (KASP) markers. This QTL harbors candidate genes that could play important roles in the regulation of nitrogen metabolism in rice with regard to their predicted functions. A downstream breeding program and functional analysis would help to identify key genes and elucidate their function.

Supplementary Materials

The following are available online at https://www.mdpi.com/2077-0472/10/8/360/s1, Figure S1: Shoot growth pattern relative to chlorate resistance, Figure S2: Root growth pattern relative to the level of chlorate resistance, Figure S3: Density of KASP markers across the rice genome, Table S1: Sequences of InDel makers, Table S2: Statistical output of analyzed traits in DH population, Table S3: Correlation analysis between traits.

Author Contributions

Conceptualization, J.-H.L., D.S., and Y.-C.S.; methodology, J.-H.L. and N.R.K.; validation, J.-M.K., J.-H.L., and D.S.; formal analysis, N.R.K., J.-H.L., S.-Y.P., S.-M.L., Y.K., J.-K.C. and S.-M.J.; investigation, N.R.K., J.H.L, and S.-Y.P.; resources, J.-H.L.; data curation, N.R.K. and S.-M.L.; writing—original draft preparation, N.R.K.; writing—review and editing, J.-H.L.; visualization, Y.-C.S.; supervision, J.-H.L. and J.-M.K.; project administration, J.-H.L. and J.-M.K.; funding acquisition, J.-M.K and J.-H.L. All authors have read and agreed to the published version of the manuscript.

Funding

This work was supported by the Cooperative Research Program for Agriculture Science & Technology Development (Project No. PJ01506901) of the Rural Development Administration, Republic of Korea.

Acknowledgments

This work was supported by the Cooperative Research Program for Agriculture Science & Technology Development (Project No. PJ01506901).

Conflicts of Interest

The authors declare no conflict of interest.

References

  1. Campbell, M.T.; Bandillo, N.; Al Shiblawi, F.R.A.; Sharma, S.; Liu, K.; Du, Q.; Schmitz, A.J.; Zhang, C.; Véry, A.-A.; Lorenz, A.J. Allelic variants of OsHKT1; 1 underlie the divergence between indica and japonica subspecies of rice (Oryza sativa) for root sodium content. PLoS Genet. 2017, 13, e1006823. [Google Scholar] [CrossRef] [PubMed]
  2. Cheng, C.; Motohashi, R.; Tsuchimoto, S.; Fukuta, Y.; Ohtsubo, H.; Ohtsubo, E. Polyphyletic origin of cultivated rice: Based on the interspersion pattern of SINEs. Mol. Biol. Evol. 2003, 20, 67–75. [Google Scholar] [CrossRef] [PubMed]
  3. Liu, X.; Lu, T.; Yu, S.; Li, Y.; Huang, Y.; Huang, T.; Zhang, L.; Zhu, J.; Zhao, Q.; Fan, D. A collection of 10,096 indica rice full-length cDNAs reveals highly expressed sequence divergence between Oryza sativa indica and japonica subspecies. Plant Mol. Biol. 2007, 65, 403–415. [Google Scholar] [CrossRef]
  4. Ni, J.; Colowit, P.M.; Mackill, D.J. Evaluation of genetic diversity in rice subspecies using microsatellite markers. Crop Sci. 2002, 42, 601–607. [Google Scholar] [CrossRef] [Green Version]
  5. Sasaki, T.; Ashikari, M. Rice genomics, genetics and breeding; Springer: Berlin/Heidlberg, Germany, 2018. [Google Scholar]
  6. Teng, S.; Tian, C.; Chen, M.; Zeng, D.; Guo, L.; Zhu, L.; Han, B.; Qian, Q.J.E. QTLs and candidate genes for chlorate resistance in rice (Oryzasativa L.). Euphytica 2006, 152, 141–148. [Google Scholar] [CrossRef]
  7. Reflinur, B.K.; Lestari, P.; Akter, M.B.; Koh, H.-J. Identification of QTLs Associated with indica-japonica Differentiation-Related Traits in Rice (Oryza sativa L.). Plant Breed. Biotechnol. 2018, 6, 193–205. [Google Scholar] [CrossRef]
  8. Zhang, Z.; Chu, C. Nitrogen-use divergence between indica and japonica rice: Variation at nitrate assimilation. Mol. Plant 2020, 13, 6–7. [Google Scholar] [CrossRef]
  9. Gao, Z.; Wang, Y.; Chen, G.; Zhang, A.; Yang, S.; Shang, L.; Wang, D.; Ruan, B.; Liu, C.; Jiang, H. The indica nitrate reductase gene OsNR2 allele enhances rice yield potential and nitrogen use efficiency. Nat. Commun. 2019, 10, 1–10. [Google Scholar] [CrossRef]
  10. Duan, D.; Zhang, H. A single SNP in NRT1. 1B has a major impact on nitrogen use efficiency in rice. Sci. China Life Sci. 2015, 58, 827. [Google Scholar] [CrossRef] [Green Version]
  11. Oka, H. Intervarietal variation and classification of cultivated rice. Ind. J. Genet. Plant Breed. 1958, 18, 79–89. [Google Scholar]
  12. Mészáros, A.; Pauk, J. Chlorate resistance as a tool to study the effect of nitrate reductase antisense gene in wheat. Cereal Res. Commun. 2002, 30, 245–252. [Google Scholar] [CrossRef]
  13. Nakagawa, H.; Yamashita, N. Chlorate reducing activity of spinach nitrate reductase. Agric. Biol. Chem. 1986, 50, 1893–1894. [Google Scholar]
  14. Solomonson, L.; Vennesland, B. Nitrate reductase and chlorate toxicity in Chlorella vulgaris Beijerinck. Plant Physiol. 1972, 50, 421–424. [Google Scholar] [CrossRef] [PubMed] [Green Version]
  15. Roldan, M.; Reyes, F.; Moreno-Vivian, C.; Castillo, F. Chlorate and nitrate reduction in the phototrophic bacteriaRhodobacter capsulatus andRhodobacter sphaeroides. Curr. Microbiol. 1994, 29, 241–245. [Google Scholar] [CrossRef]
  16. LaBrie, S.T.; Wilkinson, J.Q.; Crawford, N.M. Effect of chlorate treatment on nitrate reductase and nitrite reductase gene expression in Arabidopsis thaliana. Plant Physiol. 1991, 97, 873–879. [Google Scholar] [CrossRef] [Green Version]
  17. Rusmana, I.; Nedwell, D.B. Use of chlorate as a selective inhibitor to distinguish membrane-bound nitrate reductase (Nar) and periplasmic nitrate reductase (Nap) of dissimilative nitrate reducing bacteria in sediment. FEMS Microbiol. Ecol. 2004, 48, 379–386. [Google Scholar] [CrossRef]
  18. Li, H.-S.Z.X.-Y.; Zeng, X.-Y.; Nie, C.-R. Toxic effects of potassium chlorate on peanut growth. J. Plant Ecol. 2006, 30, 124–131. [Google Scholar]
  19. Lu, J.; Yang, R.; Wang, H.; Huang, X. Stress effects of chlorate on longan (Dimocarpus longan Lour.) trees: Changes in nitrogen and carbon nutrition. Hortic. Plant J. 2017, 3, 237–246. [Google Scholar] [CrossRef]
  20. Clark, I.C.; Melnyk, R.A.; Iavarone, A.T.; Novichkov, P.S.; Coates, J.D. Chlorate reduction in S hewanella algae ACDC is a recently acquired metabolism characterized by gene loss, suboptimal regulation and oxidative stress. Mol. Microbiol. 2014, 94, 107–125. [Google Scholar] [CrossRef]
  21. Krapp, A. Plant nitrogen assimilation and its regulation: A complex puzzle with missing pieces. Curr. Opin. Plant Biol. 2015, 25, 115–122. [Google Scholar] [CrossRef]
  22. Wang, X.; Cai, X.; Xu, C.; Wang, Q.; Dai, S. Drought-responsive mechanisms in plant leaves revealed by proteomics. Int. J. Mol. Sci. 2016, 17, 1706. [Google Scholar] [CrossRef] [PubMed] [Green Version]
  23. Bush, W.S.; Moore, J.H. Genome-Wide Association Studies. PLoS Comput. Biol. 2012, 8, e1002822. [Google Scholar] [CrossRef] [PubMed] [Green Version]
  24. Hirschhorn, J.N.; Daly, M.J. Genome-Wide Association Studies for common diseases and complex traits. Nat. Rev. Genet. 2005, 6, 95–108. [Google Scholar] [CrossRef] [PubMed]
  25. Famoso, A.N.; Zhao, K.; Clark, R.T.; Tung, C.-W.; Wright, M.H.; Bustamante, C.; Kochian, L.V.; McCouch, S.R. Genetic architecture of aluminum tolerance in rice (Oryza sativa) determined through genome-wide association analysis and QTL mapping. PLoS Genet. 2011, 7, e1002221. [Google Scholar] [CrossRef] [Green Version]
  26. Zargar, S.M.; Rai, V. Plant Omics and Crop Breeding; CRC Press: Boca Raton, FL, USA, 2017. [Google Scholar]
  27. Kim, S.; Tang, H.; Mardis, E.R. Genome sequencing technology and algorithms; Artech House, Inc.: Norwook, MA, USA, 2007. [Google Scholar]
  28. Kasahara, M.; Morishita, S. Large-scale genome sequence processing; Imperial College Press: London, UK, 2006. [Google Scholar]
  29. Kovach, M.J.; Sweeney, M.T.; McCouch, S.R. New insights into the history of rice domestication. Trends Genet. 2007, 23, 578–587. [Google Scholar] [CrossRef]
  30. Gondro, C.; Van der Werf, J.; Hayes, B. Genome-wide association studies and genomic prediction; Springer: Berlin/Heidelberg, Germany, 2013. [Google Scholar]
  31. Agrawal, G.K.; Iwahashi, H.; Rakwal, R. Rice MAPKs. Biochem. Biophys. Res. Commun. 2003, 302, 171–180. [Google Scholar] [CrossRef]
  32. Garrick, D.J.; Fernando, R.L. Implementing a QTL detection study (GWAS) using genomic prediction methodology. In Genome-Wide Association Studies and Genomic Prediction; Springer: Berlin/Heidelberg, Germany, 2013; pp. 275–298. [Google Scholar]
  33. Lee, S.-M.; Kang, J.-W.; Lee, J.-Y.; Seo, J.; Shin, D.; Cho, J.-H.; Jo, S.; Song, Y.-C.; Park, D.-S.; Ko, J.-M. QTL Analysis for Fe and Zn Concentrations in Rice Grains Using a Doubled Haploid Population Derived from a Cross Between Rice (Oryza sativa) Cultivar 93-11 and Milyang 352. Plant Breed. Biotechnol. 2020, 8, 69–76. [Google Scholar] [CrossRef]
  34. Mutinda, Y.; Muthomi, J.; Kimani, J.; George Cheminigw’wa, G.; Olubayo, F. Viability and dormancy of rice seeds after storage and pre-treatment with dry heat and chemical agents. J. Agric. Sci. 2017, 9, 175–185. [Google Scholar] [CrossRef] [Green Version]
  35. Thorpe, R. Multiple group principal component analysis and population differentiation. J. Zool. 1988, 216, 37–40. [Google Scholar] [CrossRef]
  36. Team, R.C. R: A language and environment for statistical computing; R Foundation for Statistical Computing: Vienna, Austria, 2013. [Google Scholar]
  37. Cheon, K.-S.; Baek, J.; Cho, Y.-i.; Jeong, Y.-M.; Lee, Y.-Y.; Oh, J.; Won, Y.J.; Kang, D.-Y.; Oh, H.; Kim, S.L. Single nucleotide polymorphism (SNP) discovery and kompetitive allele-specific PCR (KASP) marker development with Korean japonica rice varieties. Plant Breed. Biotechnol. 2018, 6, 391–403. [Google Scholar] [CrossRef]
  38. Meng, L.; Li, H.; Zhang, L.; Wang, J. QTL IciMapping: Integrated software for genetic linkage map construction and quantitative trait locus mapping in biparental populations. Crop J. 2015, 3, 269–283. [Google Scholar] [CrossRef] [Green Version]
  39. Van Ooijen, J.W.J.H. LOD significance thresholds for QTL analysis in experimental populations of diploid species. Heredity 1999, 83, 613–624. [Google Scholar] [CrossRef] [PubMed] [Green Version]
  40. Keb-Llanes, M.; González, G.; Chi-Manzanero, B.; Infante, D. A rapid and simple method for small-scale DNA extraction in Agavaceae and other tropical plants. Plant Mol. Biol. Rep. 2002, 20, 299–300. [Google Scholar] [CrossRef]
  41. Hall, T.A. BioEdit: A user-friendly biological sequence alignment editor and analysis program for Windows 95/98/NT. Nucleic Acids Symp. Ser. 1999, 41, 95–98. [Google Scholar]
  42. Jackson, M. Hormones from roots as signals for the shoots of stressed plants. Trends Plant Sci. 1997, 2, 22–28. [Google Scholar] [CrossRef]
  43. Asano, T.; Wakayama, M.; Aoki, N.; Komatsu, S.; Ichikawa, H.; Hirochika, H.; Ohsugi, R. Overexpression of a calcium-dependent protein kinase gene enhances growth of rice under low-nitrogen conditions. Plant Biotechnol. 2010, 27, 369–373. [Google Scholar] [CrossRef] [Green Version]
  44. Moudry, P.; Lukas, C.; Macurek, L.; Hanzlikova, H.; Hodny, Z.; Lukas, J.; Bartek, J. Ubiquitin-activating enzyme UBA1 is required for cellular response to DNA damage. Cell Cycle 2012, 11, 1573–1582. [Google Scholar] [CrossRef] [PubMed]
  45. Sato, T.; Maekawa, S.; Yasuda, S.; Yamaguchi, J. Carbon and nitrogen metabolism regulated by the ubiquitin-proteasome system. Plant Signal. Behav. 2011, 6, 1465–1468. [Google Scholar] [CrossRef] [Green Version]
  46. SZAL, B.; Podgorska, A. The role of mitochondria in leaf nitrogen metabolism. Plant Cell Environ. 2012, 35, 1756–1768. [Google Scholar] [CrossRef]
  47. Guo, W.; Zhang, F.; Bao, A.; You, Q.; Li, Z.; Chen, J.; Cheng, Y.; Zhao, W.; Shen, X.; Zhou, X. The soybean Rhg1 amino acid transporter gene alters glutamate homeostasis and jasmonic acid-induced resistance to soybean cyst nematode. Mol. Plant Pathol. 2019, 20, 270–286. [Google Scholar] [CrossRef] [Green Version]
  48. Mittl, P.R.; Schneider-Brachert, W. Sel1-like repeat proteins in signal transduction. Cell. Signal. 2007, 19, 20–31. [Google Scholar] [CrossRef]
  49. Masclaux-Daubresse, C.; Carrayol, E.; Valadier, M.-H. The two nitrogen mobilisation-and senescence-associated GS1 and GDH genes are controlled by C and N metabolites. Planta 2005, 221, 580–588. [Google Scholar] [CrossRef] [PubMed]
  50. Feller, U.; Fischer, A. Nitrogen metabolism in senescing leaves. Crit. Rev. Plant Sci. 1994, 13, 241–273. [Google Scholar] [CrossRef]
  51. Fan, P.; Feng, J.; Jiang, P.; Chen, X.; Bao, H.; Nie, L.; Jiang, D.; Lv, S.; Kuang, T.; Li, Y. Coordination of carbon fixation and nitrogen metabolism in Salicornia europaea under salinity: Comparative proteomic analysis on chloroplast proteins. Proteomics 2011, 11, 4346–4367. [Google Scholar] [CrossRef] [PubMed]
  52. Herbik, A.; Koch, G.; Mock, H.P.; Dushkov, D.; Czihal, A.; Thielmann, J.; Stephan, U.; Bäumlein, H. Isolation, characterization and cDNA cloning of nicotianamine synthase from barley: A key enzyme for iron homeostasis in plants. Eur. J. Biochem. 1999, 265, 231–239. [Google Scholar] [CrossRef] [Green Version]
  53. Hakoyama, T.; Watanabe, H.; Tomita, J.; Yamamoto, A.; Sato, S.; Mori, Y.; Kouchi, H.; Suganuma, N. Nicotianamine synthase specifically expressed in root nodules of Lotus japonicus. Planta 2009, 230, 309. [Google Scholar] [CrossRef] [Green Version]
  54. Peng, M.; Hannam, C.; Gu, H.; Bi, Y.M.; Rothstein, S.J. A mutation in NLA, which encodes a RING-type ubiquitin ligase, disrupts the adaptability of Arabidopsis to nitrogen limitation. Plant J. 2007, 50, 320–337. [Google Scholar] [CrossRef]
  55. Podzimska-Sroka, D.; O’Shea, C.; Gregersen, P.L.; Skriver, K. NAC transcription factors in senescence: From molecular structure to function in crops. Plants 2015, 4, 412–448. [Google Scholar] [CrossRef] [Green Version]
  56. Sablowski, R.W.; Meyerowitz, E.M. A homolog of NO APICAL MERISTEM is an immediate target of the floral homeotic genes APETALA3/PISTILLATA. Cell 1998, 92, 93–103. [Google Scholar] [CrossRef] [Green Version]
  57. Ooka, H.; Satoh, K.; Doi, K.; Nagata, T.; Otomo, Y.; Murakami, K.; Matsubara, K.; Osato, N.; Kawai, J.; Carninci, P. Comprehensive analysis of NAC family genes in Oryza sativa and Arabidopsis thaliana. DNA Res. 2003, 10, 239–247. [Google Scholar] [CrossRef]
  58. Harling, H.; Czaja, I.; Schell, J.; Walden, R. A plant cation–chloride co-transporter promoting auxin-independent tobacco protoplast division. EMBO J. 1997, 16, 5855–5866. [Google Scholar] [CrossRef] [Green Version]
  59. Walden, R.; Hayashi, H.; Lubenow, H.; Czaja, I.; Schell, J. Auxin inducibility and developmental expression of axi 1: A gene directing auxin independent growth in tobacco protoplasts. EMBO J. 1999, 18, 2908. [Google Scholar] [CrossRef]
  60. Commichau, F.M.; Forchhammer, K.; Stülke, J. Regulatory links between carbon and nitrogen metabolism. Curr. Opin. Microbiol. 2006, 9, 167–172. [Google Scholar] [CrossRef] [PubMed]
  61. Burkovski, A. 14 Nitrogen Metabolism and Its Regulation. In Handbook of Corynebacterium glutamicum.; CRC Press: Boca Raton, FL, USA, 2005; p. 333. [Google Scholar]
  62. Zhang, J.; Liu, Y.-X.; Zhang, N.; Hu, B.; Jin, T.; Xu, H.; Qin, Y.; Yan, P.; Zhang, X.; Guo, X. NRT1. 1B is associated with root microbiota composition and nitrogen use in field-grown rice. Nat. Biotechnol. 2019, 37, 676–684. [Google Scholar] [CrossRef]
  63. Sun, P.; Liu, F.; Tan, L.; Zhu, Z.; Fu, Y.; Sun, C.; Cai, H.J.I.J.G.P.B. Quantitative trait loci (QTLs) for potassium chlorate resistance and low temperature tolerance in seedling stage in rice (Oryza sativa L.). Indian J. Genet. Plant Breed. 2012, 72, 405–414. [Google Scholar]
  64. Wallsgrove, R.M.; Keys, A.J.; Lea, P.J.; Miflin, B.J. Photosynthesis, photorespiration and nitrogen metabolism. Plant Cell Environ. 1983, 6, 301–309. [Google Scholar]
  65. Steward, F.; Bidwell, R. Nitrogen metabolism, respiration, and growth of cultured plant tissue: PART IV. The impact of growth on protein metabolism and respiration of carrot tissue explants. General discussion of results. J. Exp. Bot. 1958, 285–305. [Google Scholar] [CrossRef]
  66. Weger, H.G.; Turpin, D.H. Mitochondrial respiration Can support NO3− and NO2− reduction during photosynthesis: Interactions between photosynthesis, respiration, and N assimilation in the N-limited green alga Selenastrum minutum. Plant Physiol. 1989, 89, 409–415. [Google Scholar] [CrossRef] [Green Version]
  67. Foyer, C.H.; Noctor, G.; Hodges, M. Respiration and nitrogen assimilation: Targeting mitochondria-associated metabolism as a means to enhance nitrogen use efficiency. J. Exp. Bot. 2011, 62, 1467–1482. [Google Scholar] [CrossRef] [Green Version]
  68. Maier, R.J. Nitrogen fixation and respiration: Two processes linked by the energetic demands of Nitrogenase. In Respiration in Archaea and Bacteria; Springer: Berlin/Heidelberg, Germany, 2004; pp. 101–120. [Google Scholar]
  69. Huppe, H.; Turpin, D. Integration of carbon and nitrogen metabolism in plant and algal cells. Annu. Rev. Plant Biol. 1994, 45, 577–607. [Google Scholar] [CrossRef]
  70. Saïd, H.; El Shishiny, E. Respiration and nitrogen metabolism of whole and sliced radish roots with reference to the effect of alternation of air and nitrogen atmospheres. Plant Physiol. 1947, 22, 452. [Google Scholar] [CrossRef]
Figure 1. Trait frequency distributions under potassium chlorate treatment. (A) Frequency distribution of shoot length of 117 rice doubled haploid lines under normal growth conditions; (B) shoot length in response to 0.1% potassium chlorate (KClO3) treatment; (C) frequency distribution of root length; (D) frequency distribution of chlorate resistance trait; (EH) Quantile–Quantile (Q–Q) plots for shoot length under normal growth conditions and potassium chlorate treatment, shoot inhibition and root inhibition percentages, and chlorate resistance scores; (IK) frequency distribution of shoot and root inhibition percentages, and chlorate resistance scores. (LN) Q–Q plots related to shoot and root inhibition, and chlorate resistance. The red dotted lines in the Q–Q plots indicate the expected distribution under null hypothesis and the thick lines indicate the distribution from the observed associated traits. The frequency distribution and Q–Q plots were generated using hist function and ggplotr R package. P1 refers to 93-11 (parental line 1), and P2 indicates Milyang352 (parental rice line 2). −log10(p) is the log base 10 quantile-quantile (Q-Q) of the p-values (observed and expected) for traits.
Agriculture 10 00360 g001
Figure 2. Correlation between seedling growth inhibition and chlorate resistance. (A) Predicted correlation (weak positive) between shoot inhibition percentage and chlorate resistance score and (B) predicted negative correlation between root inhibition and chlorate resistance phenotypes.
Agriculture 10 00360 g002
Figure 3. Distinctive phenotypic response of 93-11 (indica, P1) and Milyang352 (japonica, P2) toward potassium chlorate (KClO3). (A) Phenotype of parental lines used for the development of doubled haploid lines under 0.1% KClO3 treatment. Picture was captured 7 days after KClO3 treatment by irrigation. The background of the picture was removed for clear visualization using Adobe Photoshop (Version: 13.0.1., Adobe Inc., San Jose, CA, USA) (B,C) Shoot and root growth pattern of 93-11 compared to Milyang352. *** p < 0.001, and ns, non-significant.
Agriculture 10 00360 g003
Figure 4. Kinship matrix and principal component analysis (PCA) results. (A) The heat map of pairwise kinship matrix values based on 229 Kompetitive Allele-Specific PCR (KASP) markers on 117 rice doubled haploid (DH) lines according to VanRaden algorithm. The color histogram indicates the distribution of coefficients of co-ancestry, with the stronger red color showing the DH lines more related to each other, (B) eigenvalue accumulation variance among principal components (PCs) revealed contribution to only 3 PCs, (C) graphic scattered plot of PCA of 117 DH lines, calculated from 229 KASP markers and clustered. Resistant, moderately sensitive, and sensitive lines are respectively grouped in blue (bottom ellipse), brown (middle ellipse), and green (top ellipse), and (D) principal components with correlation between variables.
Agriculture 10 00360 g004
Figure 5. Linkage map and identified QTL associated with chlorate resistance in rice. The significant QTL for chlorate resistance was detected on chromosome 3 (136 cM) in rice. KASP markers associated with the QTL qCHR-3 with logarithm of the odds (LOD) above the threshold set at 3 were Os03_ah03001094 (left, 126.5 cM) and Os03_id3005168 (right, 146.5). Left side of the linkage map shows the position of the mapped KASP markers in cM (right side). The LOD profile is displayed on the right side of the linkage map. SLC, shoot length with no treatment; SL_KClO3, shoot length with treatment; RLC, root length without treatment; RL_KClO3, root length after treatment; SI, shoot inhibition percentage; RI, root inhibition percentage; and CHR, chlorate resistance in percentage.
Agriculture 10 00360 g005
Figure 6. Genotyping of rice cultivars 93-11 (P1, indica) and Milyang352 (P2, japonica) using nitrate reductase (NR) and nitrate transporter (NRT) insertion/deletion (InDel) markers. (A) OsNR-IND2194 amplified a band size of 200 bp in 93-11 (indica) and 188 bp in Milyang352 (japonica), (B) NR-coding sequence alignment showing deletion of 12 nucleotides (coding for alanine, 4 residues) in Oryza sativa ssp. japonica, (C) OsNR-M10-22 amplified a band of 165 bp in 93-11 and 213 bp in Milyang352, and (D) NRT-coding sequence alignment showing big deletion in Oryza sativa ssp. indica. M: ladder, 100 bp. Bands were separated using 3% agarose gel electrophoresis. Coding sequences of genes were downloaded from Nipponbare genome database (http://rice.plantbiology.msu.edu) for japonica, and indica rice genome database (http://plants.ensembl.org/Oryza_indica), using ClustalW Multiple Alignment in BioEdit Sequence Alignment Editor.
Agriculture 10 00360 g006
Table 1. Quantitative Trait Locus (QTL) associated with chlorate resistance in rice.
TraitQTL (a)Chr (b)Position (cM) (c)Left Marker (d)Right Marker (e)LOD (f)PVE (%) (g)Add (h)
Chlorate resistanceqCHR-33136ah03001094id30051684.114.92−11.975
(a) Detected QTL name, (b) chromosome number, (c) absolute position of the QTL from top of the linkage map in centimorgan (cM), (d) left flanking KASP marker, (e) right flanking KASP marker of the QTL position, (f) logarithm of odds scores above the threshold of 3.0, (g) phenotypic variation explained (PVE) by the QTL, and (h) additive effect: the negative value indicates that the allele from Milyang352 increases the trait value.
Table 2. List of candidate genes.
MSU ID (Nipponbare)Indica Database
(Ensembl)
DescriptionRemarksSimilar Papers
LOC_Os03g18170BGIOSGA012400Protein kinase domain-containing protein, expressed162 bp deletion in indica[43]
LOC_Os03g18380BGIOSGA010930Ubiquitin-activating enzyme E1357 bp deletion in japonica[44,45]
LOC_Os03g18500BGIOSGA010922Mitochondrial import inner membrane translocase subunit tim22100% similar[46]
LOC_Os03g18550BGIOSGA012419Mitochondrial carrier protein domain-containing protein100% similar[46]
LOC_Os03g18630BGIOSGA012425Leucine-rich repeat family protein, receptor-like kinase RHG1, putative, expressed100% similar[47]
LOC_Os03g18690BGIOSGA01243226S protease regulatory subunit 4 homolog (26S proteasome subunit AtRPT2a)72 bp deletion in indica and 102 bp deletion in japonica[45]
LOC_Os03g18700BGIOSGA010916Sel1-like domain containing protein (Sel1-like repeats); these represent a subfamily of TPR (tetratricopeptide repeat) sequences.306 bp deletion in indica, and 30 bp deletion in japonica[48]
LOC_Os03g18790BGIOSGA010911Senescence-associated gene 20 (SAG20) putative, expressed. Cys-rich family protein (DUF2985) and PLAC8 family domains. This family includes the placenta-specific gene 8 protein.100% similar[49]
LOC_Os03g19290BGIOSGA012456Mitochondrial import inner membrane translocase, subunit Tim17/22 family protein, putative, expressed27 bp deletion in japonica[46]
LOC_Os03g19380BGIOSGA012463Calvin cycle protein CP12, putative, expressed. A chloroplast protein that regulates the Calvin cycle responsible for CO2 assimilation.100% similar[50,51]
LOC_Os03g19420BGIOSGA010884Nicotianamine synthase 2, putative, expressed100% similar[52,53]
LOC_Os03g19500BGIOSGA012473Ubiquitin-conjugating enzyme/RWD-like domain containing protein3 bp deletion in indica[45]
LOC_Os03g20980BGIOSGA010820Zinc finger, RING-type domain-containing protein. Zinc finger, C3HC4 type domain-containing protein, expressed.51 bp deletion in indica and 3 bp deletion in japonica[54]
LOC_Os03g21060BGIOSGA026407NAC domain-containing protein 29 (ANAC029) (NAC2) (NAC-LIKE, ACTIVATED BY AP3/PI protein) (NAP). No apical meristem protein, putative, expressed.156 bp deletion in indica and 12 bp deletion in japonica[55,56,57]
LOC_Os03g21090BGIOSGA010814Axi1 auxin-independent growth promoter protein, putative, expressed100% similar[58,59]
LOC_Os03g21490BGIOSGA010800ABC transporter, ATP-binding component. ABC transporter I family member 6, chloroplastic 100% similar[60,61]

