Next Article in Journal
Currents Status, Challenges, and Future Directions in Identifying Critical Source Areas for Non-Point Source Pollution in Canadian Conditions
Next Article in Special Issue
Applying a Mathematical Model to Compare, Choose, and Optimize the Management and Economics of Milking Parlors in Dairy Farms
Previous Article in Journal
Organic Matter Composition and Phosphorus Speciation of Solid Waste from an African Catfish Recirculating Aquaculture System
Previous Article in Special Issue
A Mathematical Model of Plane-Parallel Movement of the Tractor Aggregate Modular Type
 
 
Correction published on 23 November 2020, see Agriculture 2020, 10(11), 575.
Article

Experimental Study of Disc Fertilizer Spreader Performance

1
Department of Machinery Exploitation and Management of Production Processes, University of Life Sciences in Lublin, 20-033 Lublin, Poland
2
Department of Agricultural and Environmental Science, University of Bari Aldo Moro, Via Amendola 165/A, 70126 Bari, Italy
3
Department of Technology Fundamentals, University of Life Sciences in Lublin, 20-033 Lublin, Poland
*
Author to whom correspondence should be addressed.
Agriculture 2020, 10(10), 467; https://doi.org/10.3390/agriculture10100467
Submission received: 25 August 2020 / Revised: 1 October 2020 / Accepted: 8 October 2020 / Published: 12 October 2020
(This article belongs to the Special Issue Selected Papers from Engineering for Rural Development)

Abstract

:
We report the experimental results of tests aimed at assessing the effects of different settings on the mean radius of mineral fertilizer distribution using a disc fertilizer spreader. Our aim was to improve the performance of fertilizer distribution in sustainable agriculture. Three types of mineral fertilizers with different physical characteristics, commonly used in agriculture, were considered: urea, calcium ammonium nitrate and ammonium sulfate. A complete randomization method based on a four-factor experimental model was used to study the influence of the functional and operational parameters on the mean radius of fertilizer spread. Fixed model analysis of variance showed that fertilizer type, vane configuration and disc angular velocity explained 91.74% of the variance of the spread mean radius, while linear multiple regression analysis highlighted that the fertilizer dust fraction and disc angular velocity had an overall effect of 82.72%, the former showing an inverse correlation as high as 72.77%.

1. Introduction

The most common method for distributing dry mineral fertilizer is with a fertilizer spreader. In a sustainable framework, economic and political aspects also have to be considered in order to achieve the best possible maintenance of environmental and natural resources [1,2,3]. A sustainable economy requires the conservation and maintenance of the natural soil environment [4,5], in which the leading objective must be improvement of soil sorption properties and the maximum possible increase in humus content, which is influenced among other things by the soil cultivation method [6,7]. Many aspects of this issue depend on the plant cultivation technology, the subsequent processing phase [8,9,10] and how biomass used for energy production is stored [11,12,13]. In each of these areas, occupational safety is also important and requires farmers to specialize. This increases production quality, sustainability [14,15] and compliance with local and international regulations [16]. A major technical problem in agriculture, directly related to increasing production in sustainable agriculture, is optimization of the construction of agricultural machinery to increase its reliability and efficiency. Liquid [7] and granular fertilization are both greatly affected by the shape and uniformity of fertilizer distribution on the soil [17,18]. Fertilizing fields at the recommended doses, adjusted for soil nutrient content and plant requirements, is of paramount importance for obtaining high-quality crops without depleting the environment. Any error in the fertilization phase, such as excessive doses and wrong proportions of elements, can cause pollution and environmental degradation.
In this framework, mathematical models can be used to improve the performance of agrotechnical operations [19,20,21,22] by testing the different solutions for machinery with the given technical and operational characteristics. For mineral fertilizer spreaders, basic information on these characteristics is provided by tests of spread lateral and longitudinal unevenness. Research on uneven distribution of fertilizers is conducted around the world according to standardized methodological recommendations [23]. A quality assessment of mineral fertilization is first of all related to the transverse distribution of the fertilizer on the ground, in which the radius of the spreading field density plays an important role [24]. The distribution shape depends on three main factors: (i) the technical and operational characteristics of the machinery; (ii) the physical characteristics of the fertilizers; and (iii) the environmental conditions in which the process takes place. Regarding the machine construction characteristics and settings of the spreading discs, parameters like transverse and longitudinal absolute tilt of the machinery, vane angle and angular velocity are of paramount importance for machine performance and are hard to set because they depend on many factors, especially the physicochemical properties of fertilizers and the geometric and kinematic parameters of the discs. Mineral fertilizers used in agriculture have very different physical properties, which makes computer-aided numerical simulations necessary to develop accurate and reliable spreading tables. In turn, this numerical approach requires testing to determine the relationship between the specific parameters of fertilizer distribution and the factors affecting it.
The aim of the present study was to analyze the theoretical kinematic and dynamic aspects of the spreading process and to assess the role of disc settings that affect the radius of distribution for mineral fertilizers with different physical properties.

2. Materials and Methods

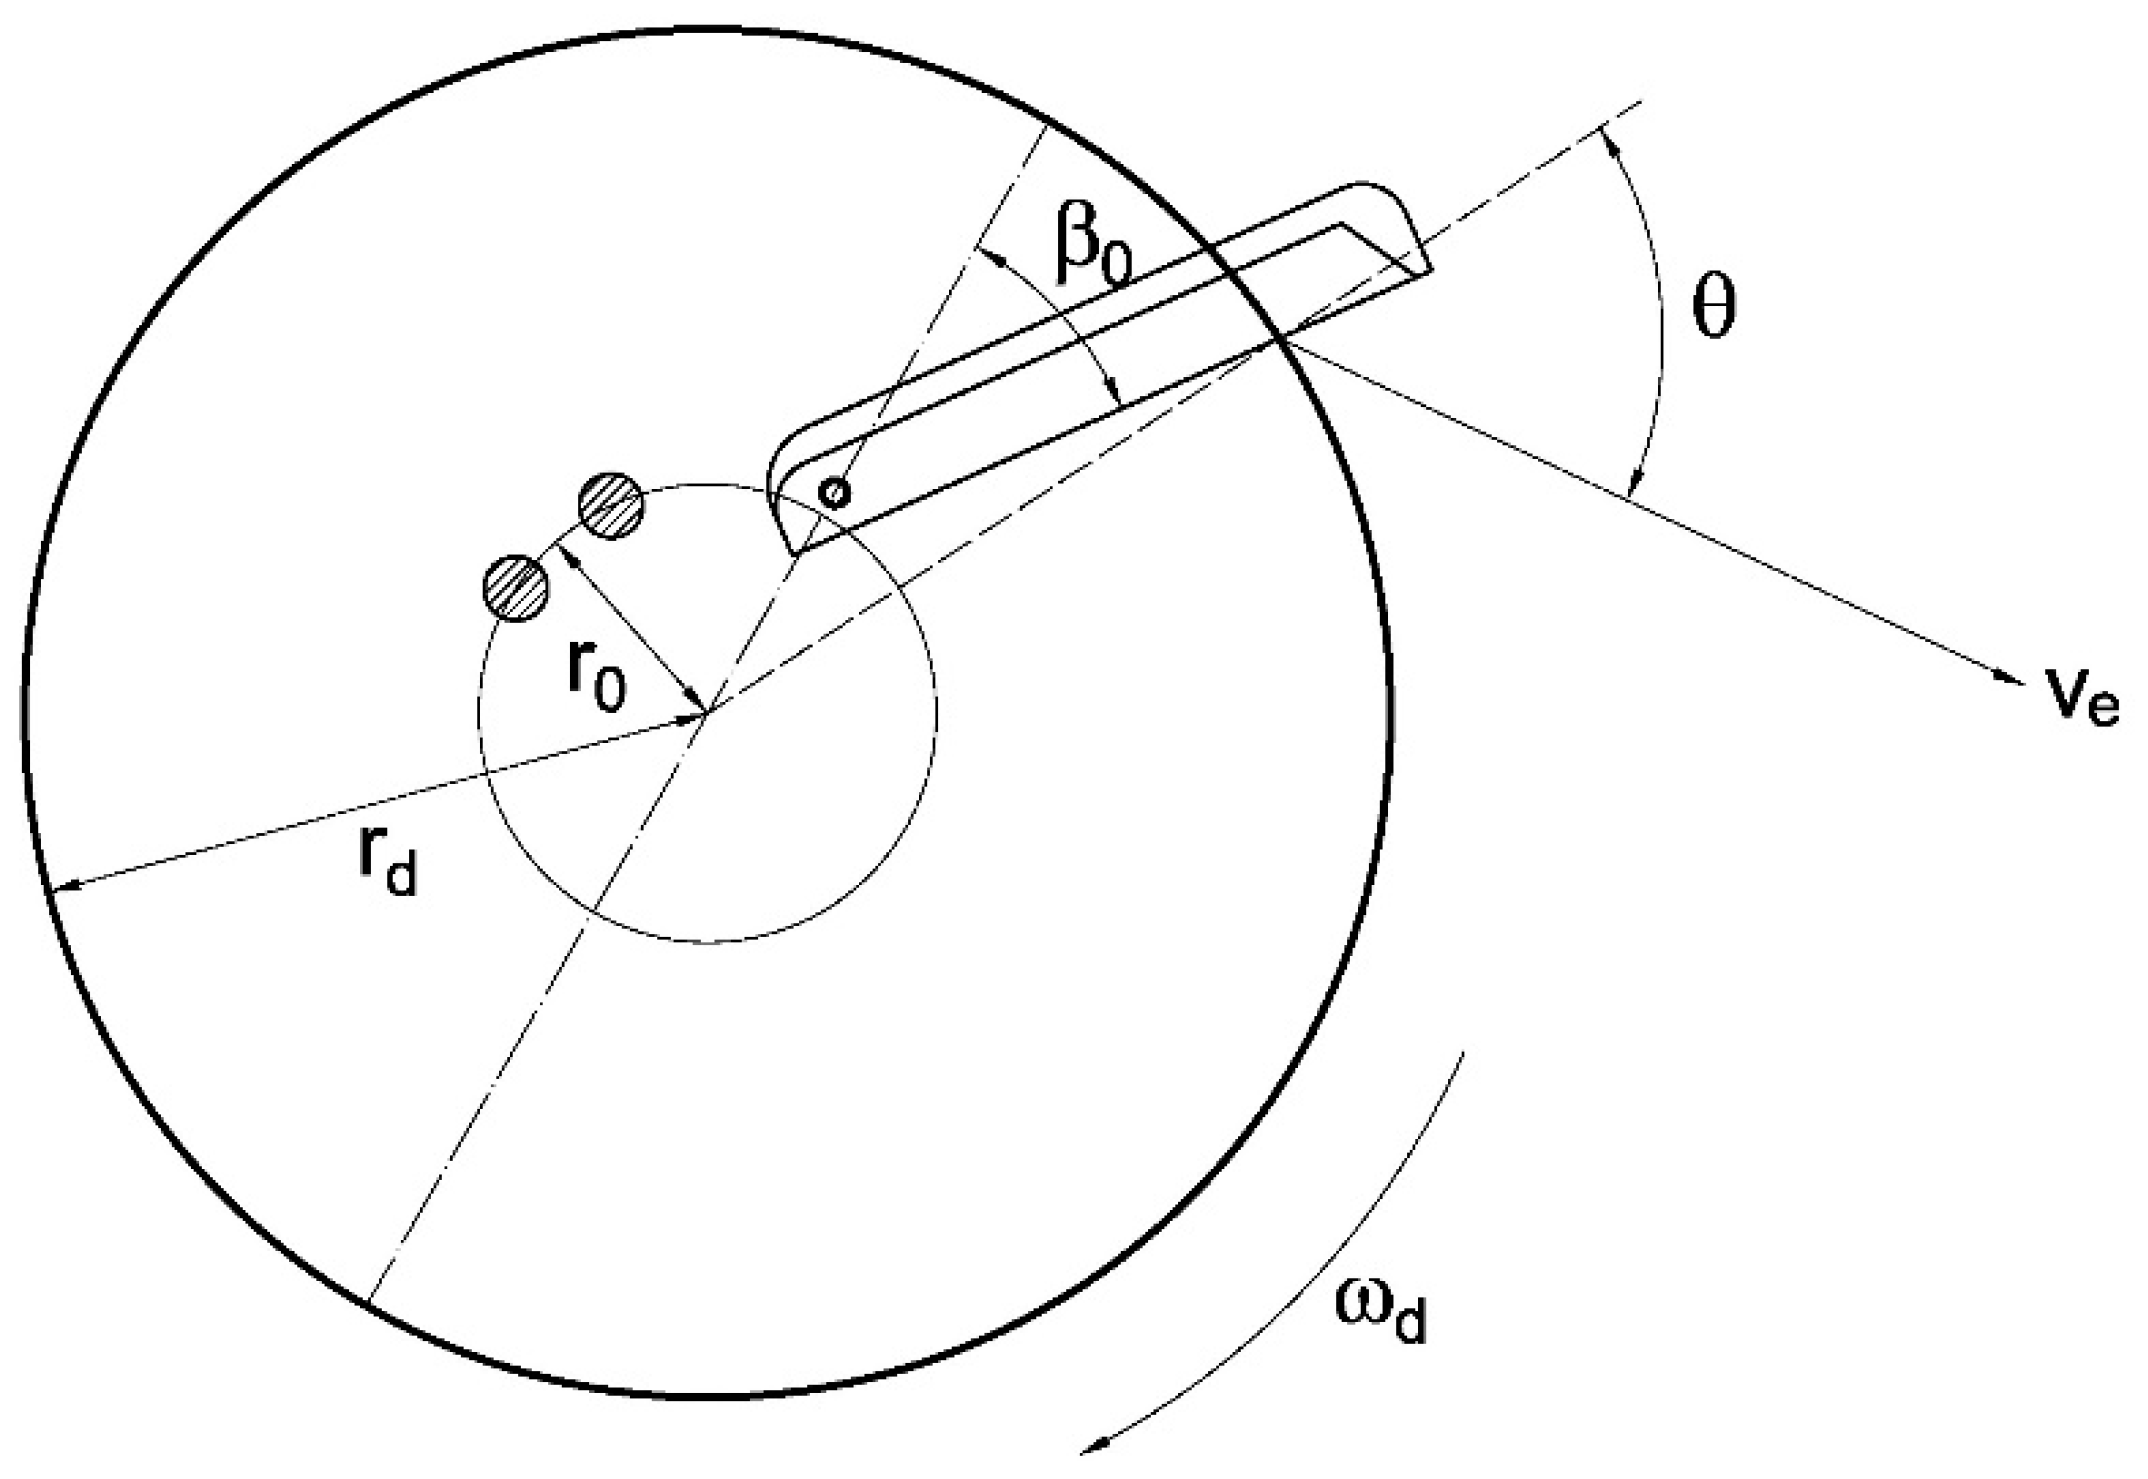
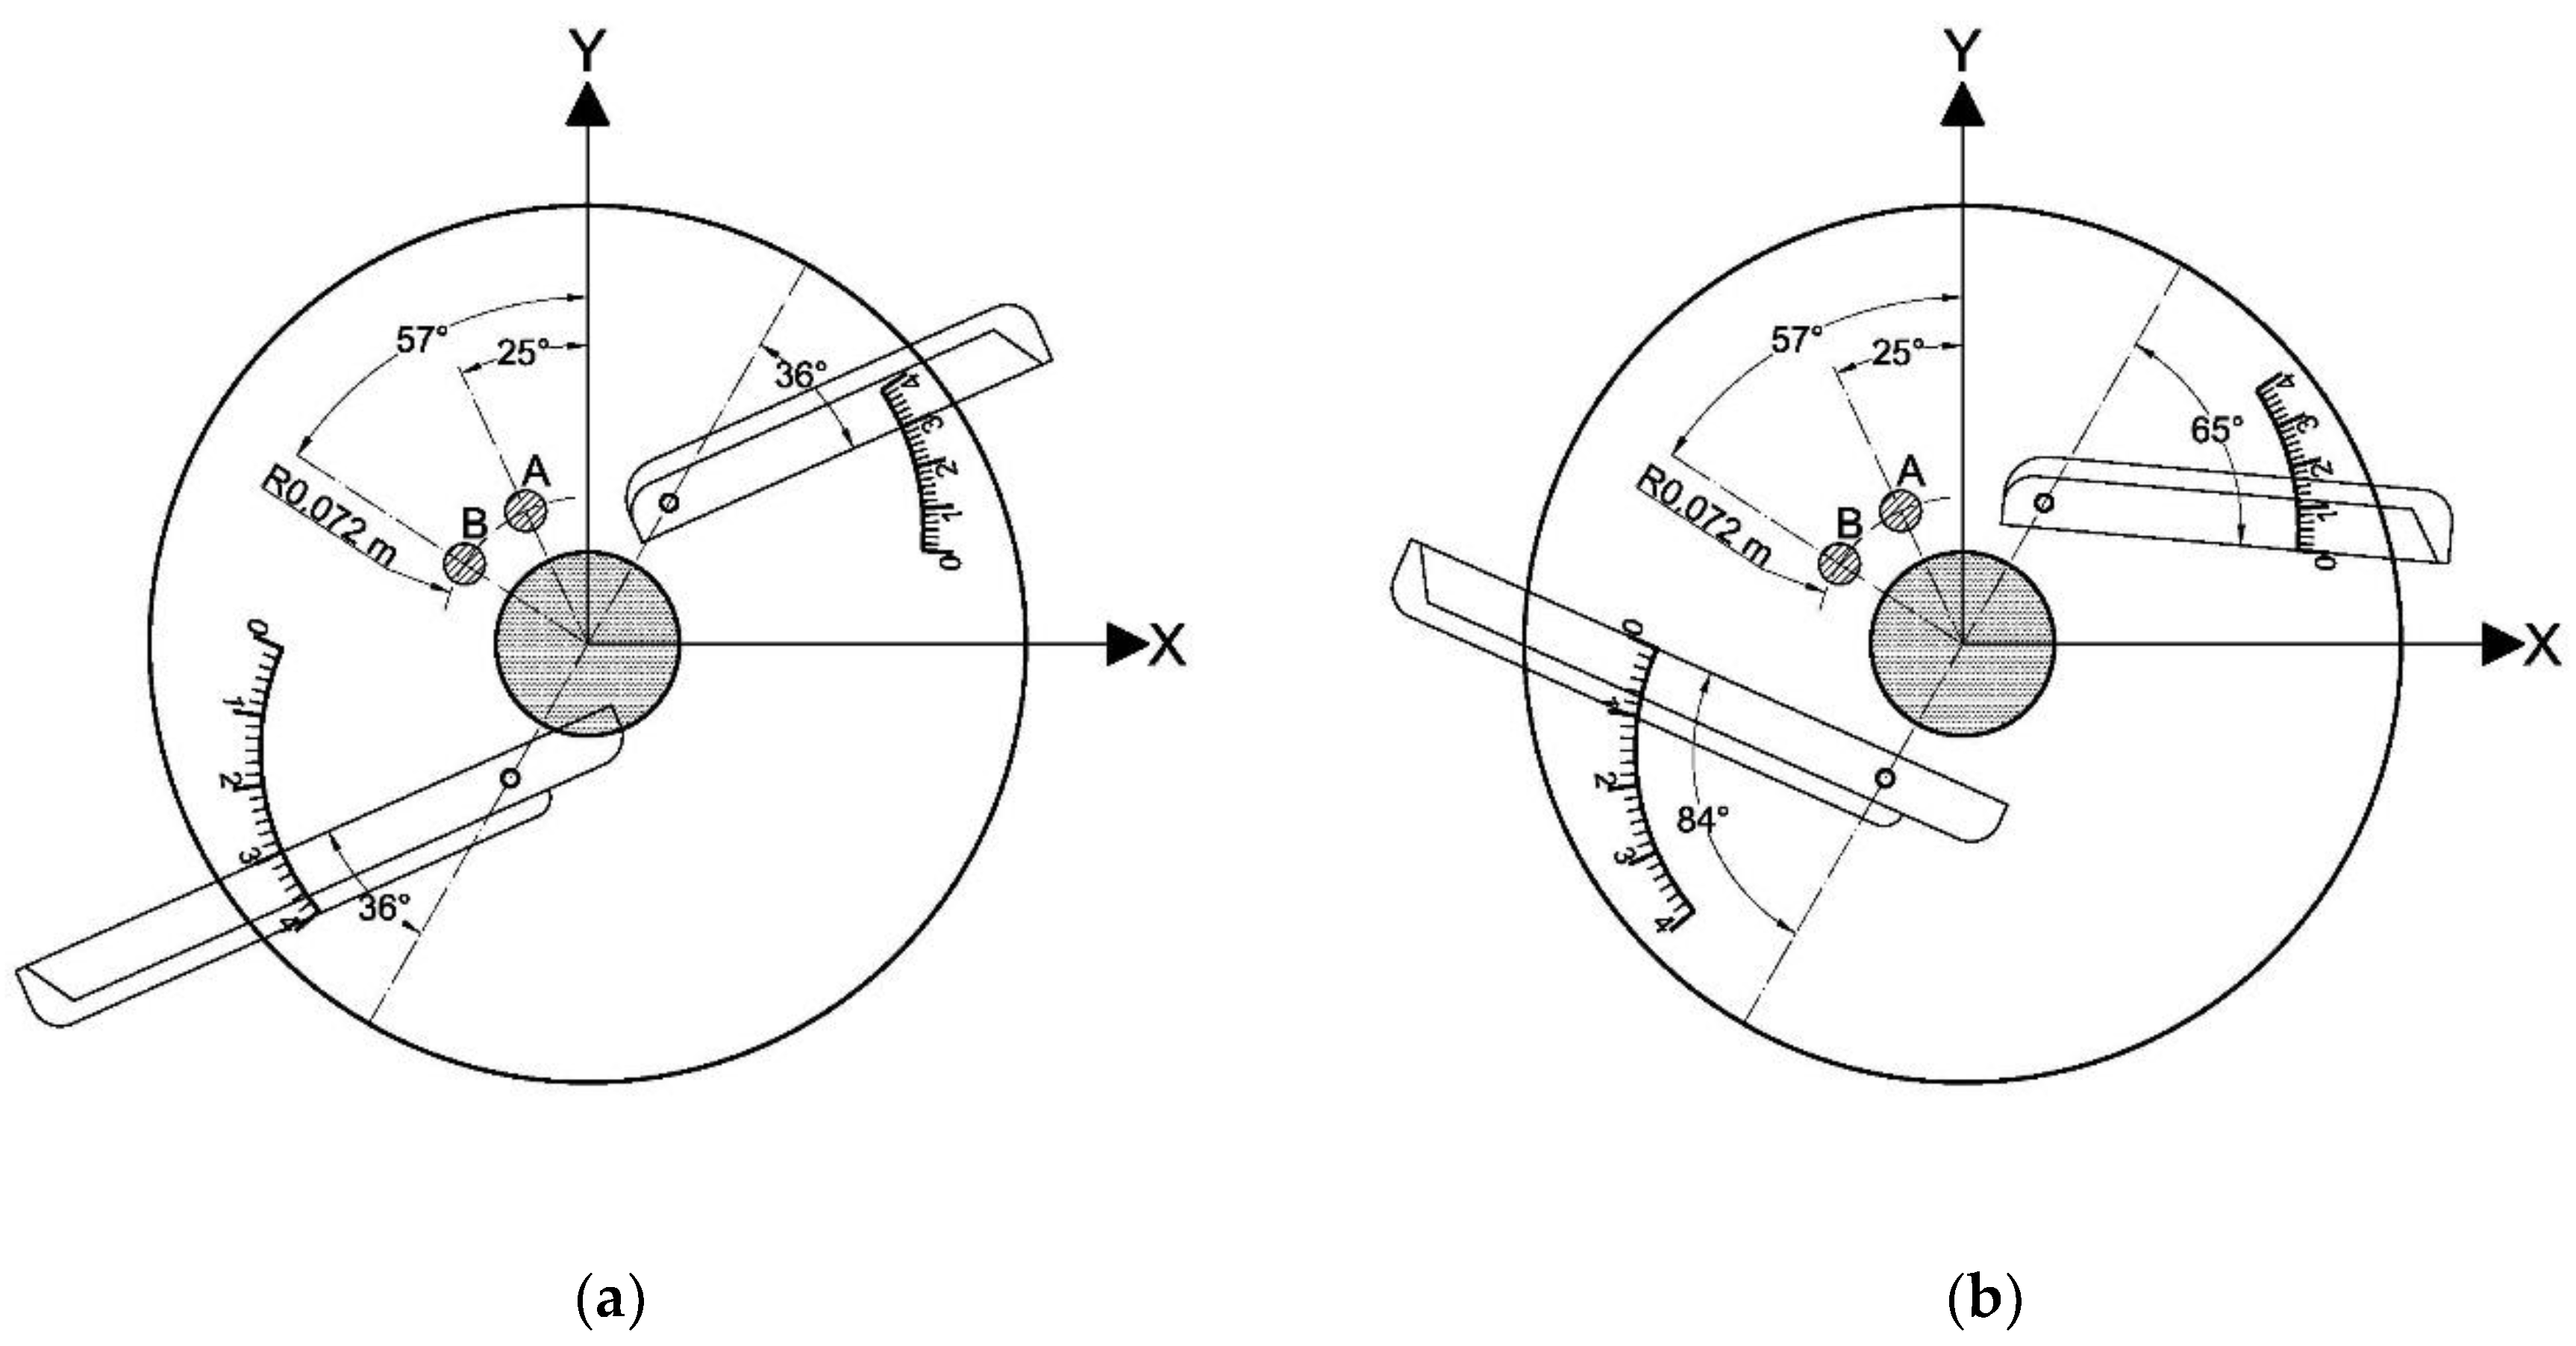
2.1. Theoretical Considerations

The considered disc fertilizer spreader consists of a single rotating disc having two straight vanes mounted on it. A hopper having a dosing outlet and a stirrer feeds the disc with the fertilizer. Usually, the fertilizer is thrown away from the disc-vanes device with a speed ve that ranges between 15–50 m·s−1 with a maximum value that, in some case, can reach 70 m·s−1 with higher speeds related to wider working widths [25]. The fertilizer particle eject speed is directly related (Figure 1) to the angular speed of the disc wd and to specific design factors of the spreader itself such as: (i) the disc radius rd; (ii) the fertilizer feed point radius r0; (iii) the angle between each vane and the corresponding radius (pitch angle β0) and (iv) the cone angle of the rotating disc.
Taking into account the D’Alembert’s Principle, the motion of a single fertilizer particle is described by a differential equation which considers all the forces that act on it [25]. Among these forces, the friction force plays a significant role in the present study. It depends on the particle weight and on the fertilizer physical characteristics. An increase of the friction force due mainly to an increase of the friction coefficient between the fertilizer particle and the disc-vanes device, leads to both a lower eject speed ve and a smaller eject angle θ [25].

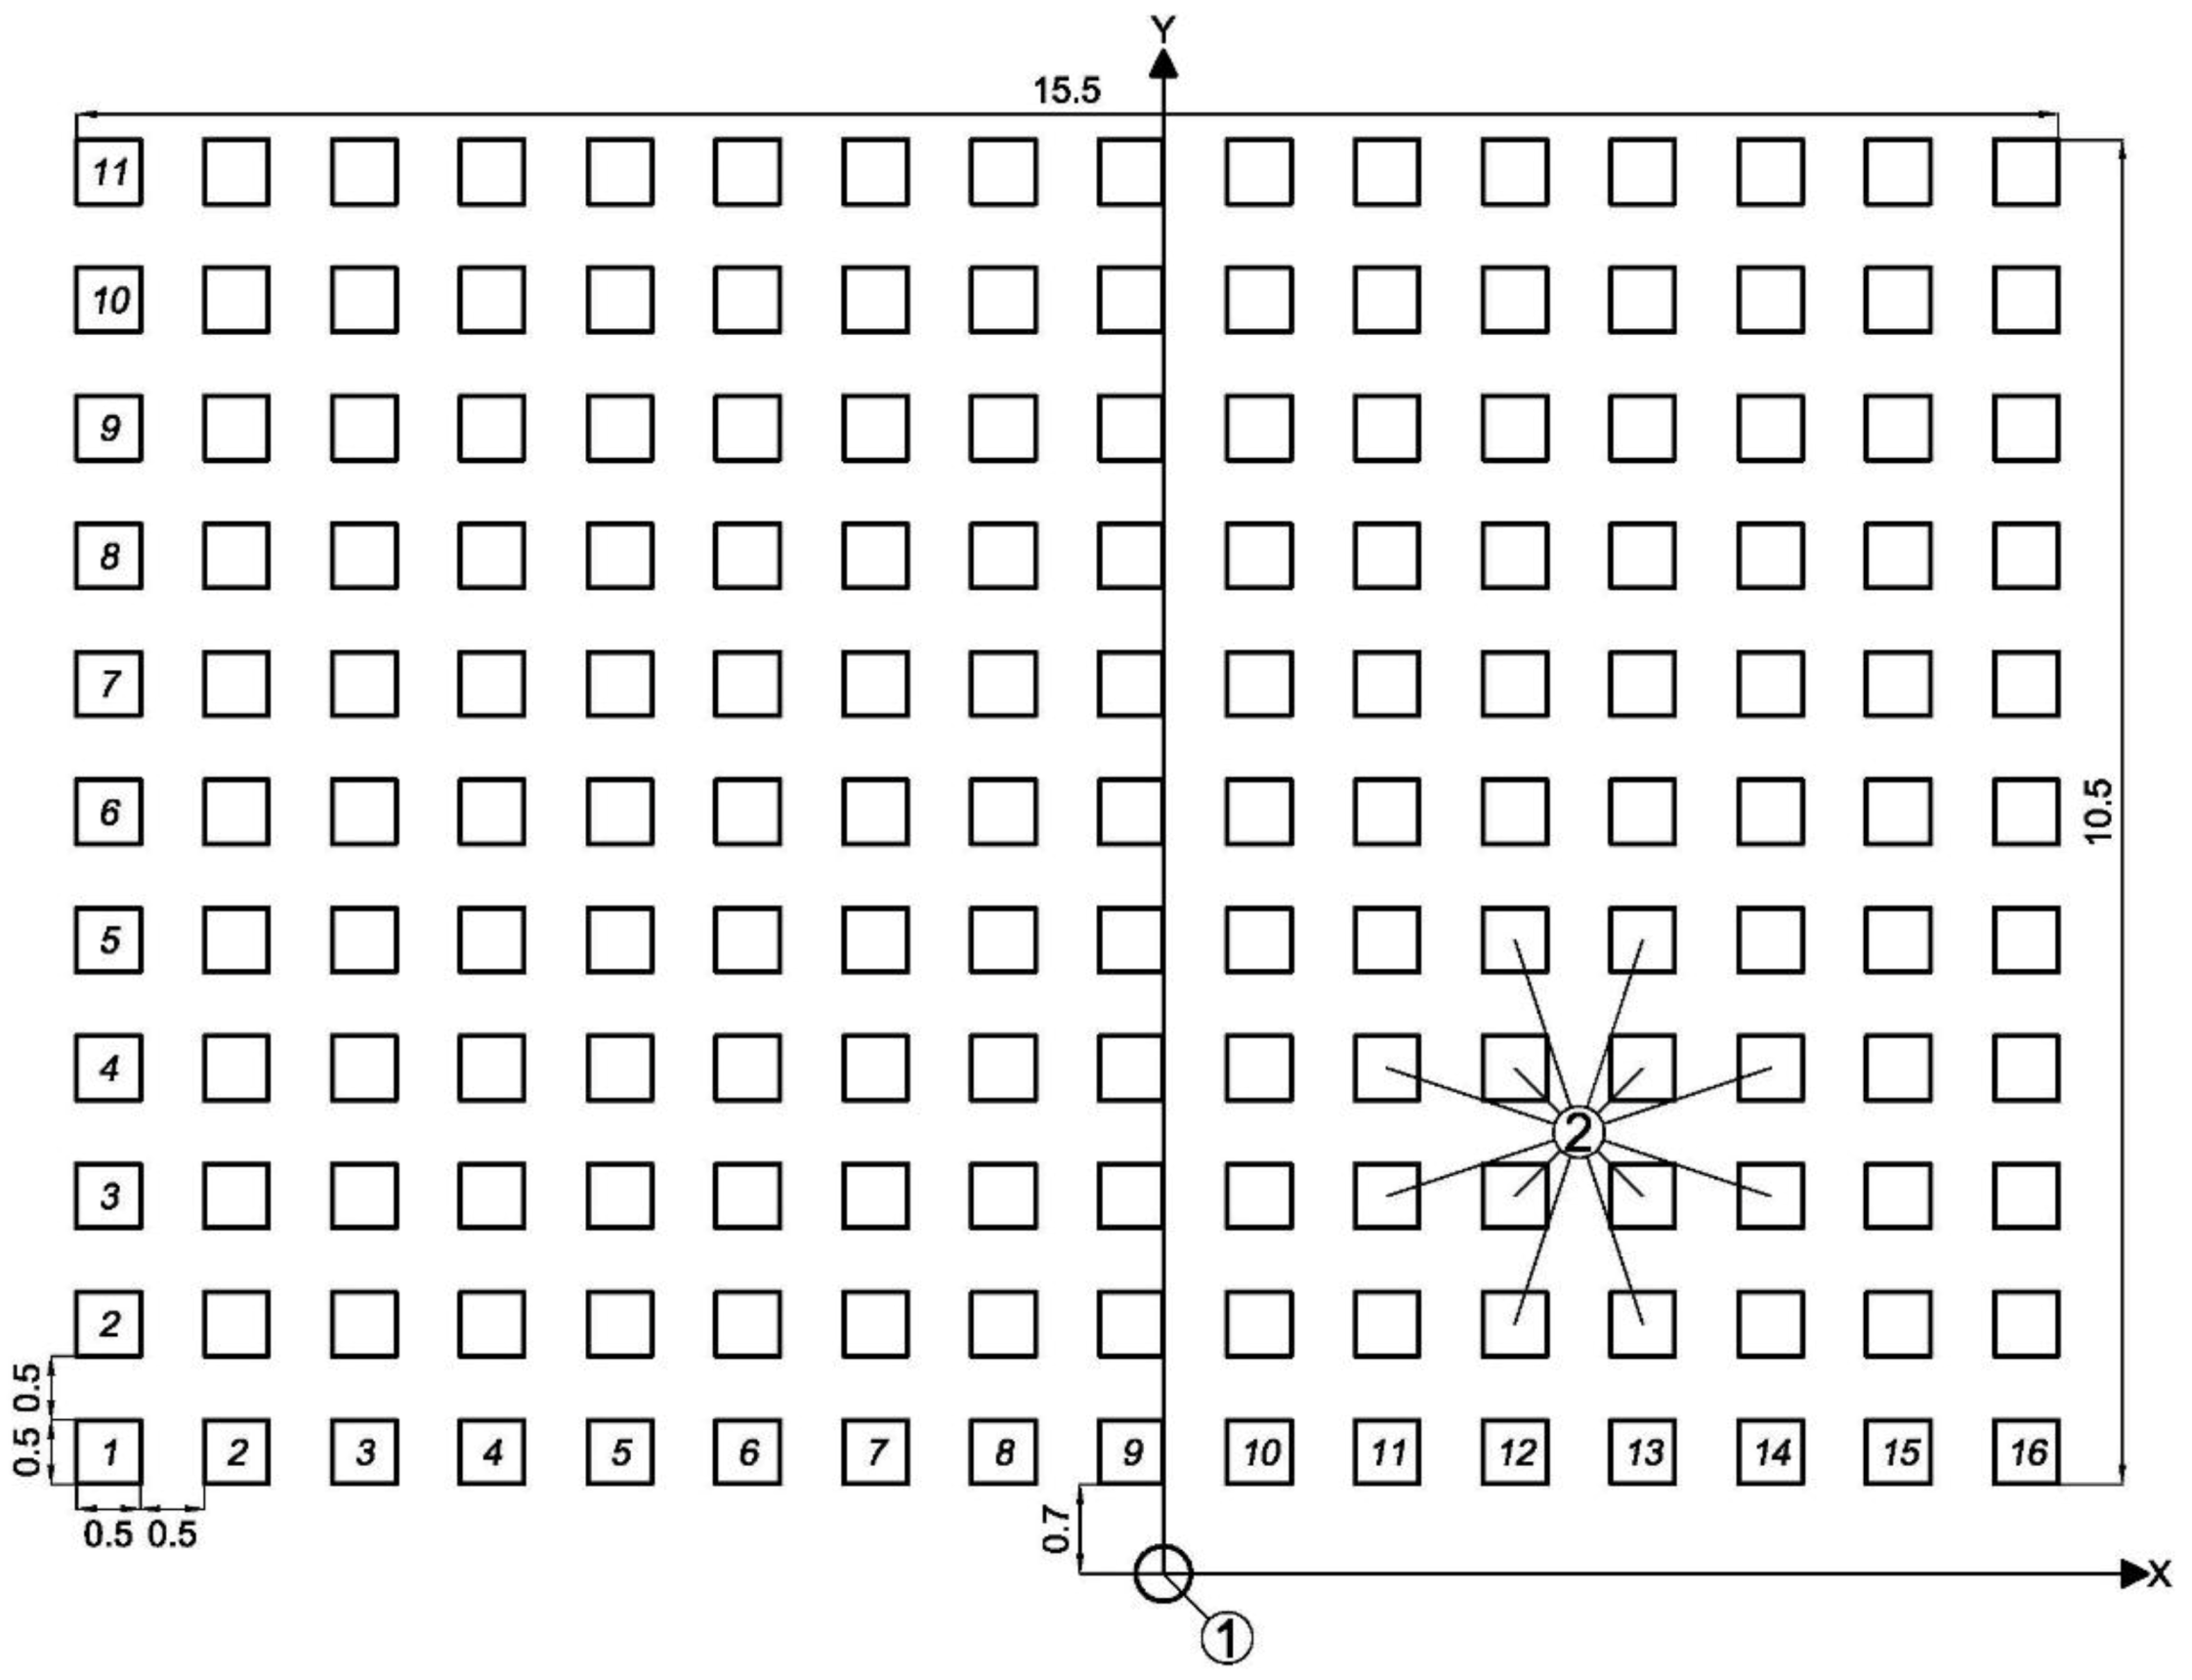
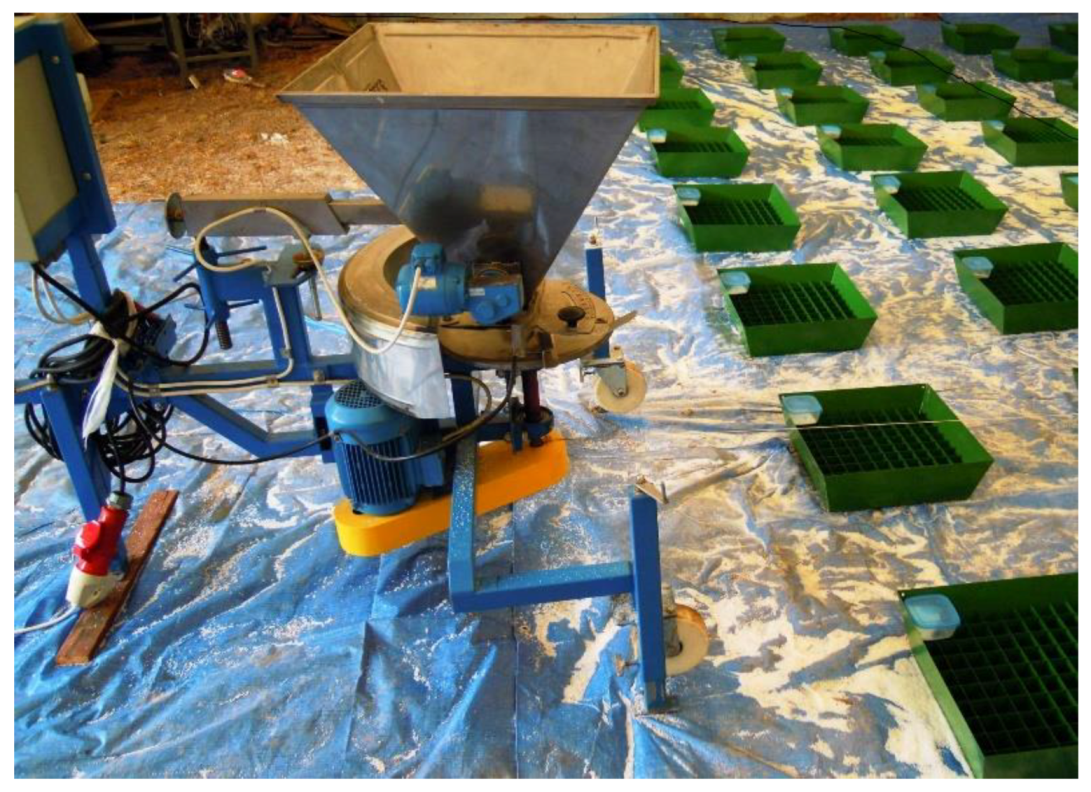
2.2. Esperimental Tests

Fertilizer spreading was studied in relation to the mean radius of spread. We developed a bench testing method for a single-disc spreader based on the literature and relevant compulsory standards. In particular, in line with EN 13739-2:2011 recommendations [26], the experiment was conducted in a suitably equipped indoor laboratory. Wind direction and speed were therefore not recorded. Relative humidity was 52.0–57.7% and temperature 13–17 °C in compliance with the said recommendations [26].
The test area, measuring 167.4 m2, consisted of an array of 176 collection trays, each measuring 0.5 m × 0.5 m × 0.15 m (length × width × height), arranged in 11 rows and 16 columns, separated from each other by 0.5 m (2 in Figure 2). The spreader (Sipma RN 410-Antek, Lublin, Poland) was located almost in the middle of the first row, 0.7 m from the right lower edge of the first tray in Column 9 (1 in Figure 2). The center of the rotating disc was taken as the origin from which the fertilizer range was measured.
The spreader was mounted on an experimental test stand (Figure 3) consisting of a frame, a hopper (capacity about 0.09 m3) with a dosing outlet and a stirrer, a disc (diameter 0.43 m, concavity angle 6°) mounted 0.67 m from the ground, two electric motors (to drive the disc and the stirrer) and controls. The design allowed the parameters, such as the fertilizer feed point on the disc, the angular velocity of the disc and the pitch of the vanes, to be readily modified.
A complete randomization method based on a four-factor experimental model was used, in which the independent variables were disc angular velocity, vane settings on the disc, fertilizer feed point on the disc and types of mineral fertilizers. We tested two disc angular velocities of 42 rad · s 1 and 63 rad · s 1 , which are the most frequent in practice.
Two vanes, 0.32 m and 0.22 m long, were tested in two configurations: L3 and L0, respectively. In the L3 configuration, the angles between the two vanes and the imaginary line connecting the fixing point of each vane was 36° in both cases, whereas in L0 the angle was 65° for the shorter and 84° for the longer vane (Figure 4).
Technical solutions used in commercial spreaders conditioned our choice of the point where the fertilizer was fed onto the rotating disc. We tested two different feed points, both circular with a diameter of 0.02 m and located 0.1 m above the disc surface. Assuming a polar coordinate system with the origin at the disc center and the axis coinciding with the Oy axis in a Cartesian coordinate system, the centers of the projections of the two feed points on the disc had polar coordinates A(0.072 m, 25°) and B(0.072 m, 57°), as shown in Figure 4.
Three mineral fertilizers commonly used in agriculture were tested: (i) urea; (ii) calcium ammonium nitrate (CAN) and (iii) ammonium sulfate (AS). To assess the influence of the basic physical properties of the fertilizers on the multiple regression analysis used to evaluate the radius of spread, we determined the loose bulk density, bulk density after sieving and specific density with an Ultrapyc 1200e automatic gas pycnometer (Quantachrome- Boynton Beach, FL, USA), as well as the granulometric composition and the mass of the dusty fractions with an LPzE-2e sieve shaker (MULTISERW-Morek, Brzeźnica, Poland) in each case (Table 1).
Considering all variables, including the three types of fertilizers, eight different combinations were tested. Each test was replicated three times to improve the statistical significance.
So that the results could be compared, a constant weight (13 kg) of fertilizer was used in the tests. The fertilizer flow rate through the dosing outlet depended on its properties (urea: 0.054 kg · s 1 , test duration 241 s; CAN: 0.048 kg · s 1 , test duration 271 s; and AS: 0.075 kg · s 1 , test duration 173 s). At the end of each replicate, the mass of fertilizer collected in each tray was weighed with a PX3202/1 OHAUS Pioneer analytical balance. To evaluate the density of the fertilizer within the spreading field, we considered the mean radius of spread defined below. It should not be confused with the machine working width, which in the present case was at least as wide as the testing field.
To evaluate the mean radius of spread ( R ¯ ), the following relationship was used [24]:
R ¯ = i = 1 n j = 1 m m i j i = 1 n j = 1 m m i j r i j ,
where,
  • n: number of testing field rows;
  • m: number of testing field columns;
  • m i j : mass of fertilizer collected by tray at row i column j of testing field, kg;
  • r i j : distance between center of tray at row i column j of the testing field and center of disc, m.
A significance level α = 0.05 was set for the multivariate analysis of variance of the fertilizer spreading mean radius constant model. The coefficient of determination R2 was used to explain the variability of the dependent variable in the model. A multiple regression analysis with R version 4.0.2 software (R Foundation for Statistical Computing) was used to assess the relationships between the different variables.
We used a quadruple orthogonal cross classification model (m = 3) with observations in all subclasses to obtain an overall picture of the effects of the factors on the fertilizer distribution shape parameters, based on the following expression:
( R ¯ ) i j k l m = μ + F T i + D S j + F P k + V C l + ( F T . D S ) i j + ( F T . F P ) i k + ( F T . V C ) i l + ( D S . F P ) j k + ( F P . V C ) j l + + ( F P . V C ) k l + e i j k l m ( i = 1 , 2 , 3 ;   j = 1 , 2 ; k = 1 , 2 ; l = 1 , 2 ; m = 1 , 2 , 3 )
where,
  • ( R ¯ ) i j k l m : m-th result of calculations of the mean fertilizer spread radius for the i-th fertilizer, the j-th angular velocity of disc, the k-th point of fertilizer feed onto the disc and the l-th vane configuration, m;
  • μ: general average of the population of fertilizer spread radius measurements, m;
  • FT: main effect of the i-th fertilizer;
  • DS: main effect of the j-th angular velocity of the disc;
  • FP: main effect of the k-th fertilizer feed point on the disc;
  • VC: main effect of the l-th vane configuration on the disc;
  • Ij: interaction effect of the i-th fertilizer with the j-th angular velocity of the disc;
  • ik: interaction effect of the i-th fertilizer with the k-th fertilizer feed point;
  • il: interaction effect of the i-th fertilizer with the l-th vane configuration;
  • jk: interaction effect of the j-th angular velocity of the disc with the k-th fertilizer feed point;
  • jl: interaction effect of the j-th angular velocity of the disc with the l-th vane configuration;
  • kl: interaction effect of the k-th fertilizer feed point with the l-th vane configuration;
  • e i j k l m : random experimental error, m.
Coefficient R2 was used to explain the variability of the dependent variables by a constant model; T-Tukey confidence intervals were used to assess the significance of the differences in individual parameters. The relationships between the dependent variables (parameters of the average fertilizer distribution field) and independent variables were described by first-degree multiple regression equations. Model parameters were estimated using the least squares method [27]. Statistical verification of the model was carried out by the Fisher–Snedecor F test.

3. Results and Discussion

Mean spread radii are reported as a radar plot in Figure 5. The highest mean radius, 6.76 m, was obtained with CAN fertilizer, feed point B, angular velocity of disc 63 rad · s 1 and vane configuration L3. The smallest radius, 2.56 m, was recorded with the AS fertilizer, feed point A, angular velocity of the disc of 42 rad · s 1 and vane configuration L0. A general increase in mean spread radius was observed with vane configuration L3 and, as expected, increasing disc angular velocity.
Figure 5 also shows an amplifying effect of changing the feed point from A to B for urea and CAN, due to their lower coefficient of friction [28] with respect to AS. A lower friction increased the fertilizer velocity along the vane, increasing the radial velocity and consequently discharge velocity and discharge angle (Figure 1).
Table 2, Table 3, Table 4 and Table 5 show the results of the different analyses. Table 2 reports the results of the analysis of variance of the mean fertilizer spread radius fixed model based on quadruple classification (fertilizer type (FT) × disc angular velocity (DS) × fertilizer feed point (FP) × vane configuration (VC)), in which three replicates were done in each subclass. The independent variables explained 99.48% of the variance of the dependent variable. In particular, the FP was substantially irrelevant compared to the other variables (FT, VC and DS), which together explained as much as 91.74% of the variability of the dependent variable. Likewise, among the two-factor interaction effects, including feed point (FP), only fertilizer type (FT) × feed point (FP) contributed, albeit very little, to explaining the variability of the mean radius of fertilizer spread.
Table 3 shows the T-Tukey confidence intervals for differences in the means based on the same number of observations and mean square error. All differences in the mean radius of fertilizer spread proved to be significant.
Since the fixed model analysis of variance for mean radius of fertilizer spread clearly showed that the feed point did not have a significant influence on the mean radius of fertilizer spread, a linear multiple regression was performed excluding that parameter. The results are reported in Table 4 and Table 5, which give the following regression equation where the estimation errors for each parameter are reported in brackets. We see that the estimated values of the dependent variable, the mean radius of fertilizer spread, differ from the empirical ones by an average of 0.103 m.
R ¯ = 0.80798 0.03483 · V C + 0.00690 · D S + 1.65821 · S D 0.04357 · D F ± 0.103 ( 0.47985 )   ( 0.00352 )   ( 0.00047 )   ( 0.23382 )   ( 0.00221 )
In Table 4, we observe a considerable difference in average estimation errors in relation to the different coefficients: while the estimation error of the parameters never exceeded 14%, the corresponding error for the constant was close to 60%.
We also see that the dusty fraction of fertilizer has a partial correlation coefficient of 0.85, which is the highest of all the estimated partial correlation coefficients. This value is so high that the dusty fraction DF alone is responsible for 72.77% ( 0.85308 2 · 100 ) of the variance in mean radius of fertilizer spread. The second most influential variable was disc angular velocity, DS, which explained 9.95% ( 0.31543 2 · 100 ) of the variance in mean radius of fertilizer spread. Likewise, if we consider the remaining two variables (specific density (SD) and vane configuration (VC)), we find that their overall contribution to the variance in mean radius of fertilizer spread was only 1.64%, to which specific density SD makes a negligible contribution (0.00177%).
In line with the instructions provided with the disc spreader, the coefficient of the dust fraction (DF) is negative in the regression (Equation (3)), resulting in a decrease in the dependent variable as the independent variable increases. From a practical point of view, this means that the average radius of spread decreases considerably with increasing fertilizer dust fraction.

4. Conclusions

The present study shows, by the fertilizer spread mean radius fixed model analysis of variance, that the feed point on the disc has a very marginal role in the mineral fertilizer spreading process while the other functional and operational parameters (fertilizer type, vane configuration and disc angular velocity) together explain 91.74% of the variance of the dependent variable.
Furthermore, on the basis of linear multiple regression analysis, the main parameters that determine the mean radius of fertilizer spread are the fertilizer dust fraction and the disc angular velocity with an overall influence of 82.72%. The dust fraction determines 72.77% of the variance, confirming its inverse correlation with the mean radius of spread possible with the machine. This could be a practical indication for farmers, enabling them to focus on the angular velocity setting, once the fertilizer type has been chosen.
Further tests are underway to acquire better insights into the relationships affecting the mean radius of fertilizer spread and to evaluate which of the same parameters affect angular spread, from the point of view of improving the effectiveness of fertilization procedures for precision and sustainable agriculture.

Author Contributions

Conceptualization, A.P. (Artur Przywara), F.S. and S.P.; methodology, A.P. (Artur Przywara); software, A.P. (Artur Przywara) and F.S.; validation, A.K. and A.P. (Anna Pecyna); formal analysis, S.P.; writing—original draft preparation, A.P. (Artur Przywara), A.K., A.P. (Anna Pecyna); writing—review and editing, A.P. (Artur Przywara) and F.S.; visualization, A.P. (Anna Pecyna); supervision, S.P. All authors have read and agreed to the published version of the manuscript.

Funding

This research received no external funding.

Conflicts of Interest

The authors declare no conflict of interest.

References

  1. Sobczak, P.; Mazur, J.; Zawiślak, K.; Panasiewicz, M.; Żukiewicz-Sobczak, W.; Królczyk, J.; Lechowski, J. Evaluation of dust concentration during grinding grain in sustainable agriculture. Sustainability 2019, 11, 4572. [Google Scholar] [CrossRef] [Green Version]
  2. Żukiewicz-Sobczak, W.; Sobczak, P.; Rogóż, A.; Wojtyła-Buciora, P.; Kozak, M.; Zagórski, J. Evaluation of the content of selected elements in herbs cultivated in organic farms in the Lublin region. In Proceedings of the Farm Machinery and Processes Management in Sustainable Agriculture, Lublin, Poland, 22–24 November 2017; pp. 461–464. [Google Scholar] [CrossRef]
  3. Kachel-Jakubowska, M.; Matwijczuk, A.; Gagoś, M. Analysis of the physicochemical properties of post-manufacturing waste derived from production of methyl esters from rapeseed oil. Int. Agrophys. 2017, 31, 175–182. [Google Scholar] [CrossRef]
  4. Kachel, M.; Matwijczuk, A.; Sujak, A.; Czernel, G.; Niemczynowicz, A.; Nowicka, A. The influence of copper and silver nanocolloids on the quality of pressed spring rapeseed oil. Agronomy 2019, 9, 643. [Google Scholar] [CrossRef] [Green Version]
  5. Blicharz-Kania, A.; Pecyna, A.; Krajewska, M.; Andrejko, D.; Szmigielski, M.; Zawiślak, K.; Sobczak, P.; Berbec, A. Chemical properties of tobacco seed oil. Przem. Chem. 2018, 97, 1906–1909. [Google Scholar] [CrossRef]
  6. Kozak-Kalita, M.; Sobczak, P.; Zawiślak, K.; Mazur, J.; Panasiewicz, M.; Żukiewicz-Sobczak, W. Influence of UV-C radiation on the microbiological purity in selected species of herbs. Health Probl. Civiliz. 2018, 12, 285–290. [Google Scholar] [CrossRef]
  7. Przywara, A.; Kachel, M.; Koszel, M.; Leszczyński, N.; Kraszkiewicz, A.; Anifantis, A.S. The influence of digestate on the static strength of spring rapeseeds (Brassica napus var. arvensis). Sustainability 2019, 11, 2133. [Google Scholar] [CrossRef] [Green Version]
  8. Guerrieri, A.S.; Anifantis, A.S.; Santoro, F.; Pascuzzi, S. Study of a large square baler with innovative technological systems that optimize the baling effectiveness. Agriculture 2019, 9, 86. [Google Scholar] [CrossRef] [Green Version]
  9. Kraszkiewicz, A.; Kachel, M.; Parafiniuk, S.; Zając, G.; Niedziółka, I.; Sprawka, M. Assessment of the possibility of using hemp biomass (Cannabis sativa L.) for energy purposes: A case study. Appl. Sci. Basel 2019, 9, 4437. [Google Scholar] [CrossRef] [Green Version]
  10. Rajabi Hamedani, S.; Villarini, M.; Colantoni, A.; Carlini, M.; Cecchini, M.; Santoro, F.; Pantaleo, A. Environmental and economic analysis of an anaerobic co-digestion power plant integrated with a compost plant. Energies 2020, 13, 2724. [Google Scholar] [CrossRef]
  11. Pantaleo, A.; Villarini, M.; Colantoni, A.; Carlini, M.; Santoro, F.; Rajabi Hamedani, S. Techno-economic modeling of biomass pellet routes: Feasibility in Italy. Energies 2020, 13, 1636. [Google Scholar] [CrossRef] [Green Version]
  12. Bulgakov, V.; Pascuzzi, S.; Anifantis, A.S.; Santoro, F. Oscillations analysis of front-mounted beet topper machine for biomass harvesting. Energies 2019, 12, 2774. [Google Scholar] [CrossRef] [Green Version]
  13. Bulgakov, V.; Pascuzzi, S.; Ivanovs, S.; Santoro, F.; Anifantis, A.S.; Ihnatiev, I. Performance assessment of front-mounted beet topper machine for biomass harvesting. Energies 2020, 3, 3524. [Google Scholar] [CrossRef]
  14. Pascuzzi, S.; Bulgakov, V.; Santoro, F.; Anifantis, A.S.; Ivanovs, S.; Holovach, I. A study on the drift of spray droplets dipped in airflows with different directions. Sustainability 2020, 12, 4644. [Google Scholar] [CrossRef]
  15. Pascuzzi, S.; Santoro, F.; Manetto, G.; Cerruto, E. Study of the correlation between foliar and patternator deposits in a “Tendone” vineyard. Agric. Eng. Int. CIGR J. 2018, 20, 97–107. [Google Scholar]
  16. Santoro, F.; Anifantis, A.S.; Ruggiero, G.; Zavadskiy, V.; Pascuzzi, S. Lightning protection systems suitable for stables: a case study. Agriculture 2019, 9, 72. [Google Scholar] [CrossRef] [Green Version]
  17. Przywara, A. The impact of structural and operational parameters of the centrifugal disc spreader on the spatial distribution of fertilizer. Agric. Agric. Sci. Procedia 2015, 7, 215–222. [Google Scholar] [CrossRef] [Green Version]
  18. Dintwa, E.; Tijskens, E.; Olieslagers, R.; De Baerdemaeker, J.; Ramon, H. Calibration of a spinning disc spreader simulation model for accurate site-specific fertiliser Application. Biosyst. Eng. 2004, 88, 49–62. [Google Scholar] [CrossRef]
  19. Anifantis, A.S.; Camposeo, S.; Vivaldi, G.A.; Santoro, F.; Pascuzzi, S. Comparison of UAV photogrammetry and 3D modeling techniques with other currently used methods for estimation of the tree row volume of a super-high-density olive orchard. Agriculture 2019, 9, 233. [Google Scholar] [CrossRef] [Green Version]
  20. Bulgakov, V.; Pascuzzi, S.; Santoro, F.; Anifantis, A.S. Mathematical model of the plane-parallel movement of the self-propelled root-harvesting machine. Sustainability 2018, 10, 3614. [Google Scholar] [CrossRef] [Green Version]
  21. Bulgakov, V.; Pascuzzi, S.; Nadykto, V.; Ivanovs, S. A mathematical model of the plane-parallel movement of an asymmetric machine-and-tractor aggregate. Agriculture 2018, 8, 151. [Google Scholar] [CrossRef] [Green Version]
  22. Abbou-ou-Cherif, E.M.; Piron, E.; Chateauneuf, A.; Vilette, S. On-the-field simulation of fertilizer spreading: Part 3—Control of disk inclination for uniform application on undulating fields. Comput. Electron. Agric. 2019, 158, 150–158. [Google Scholar] [CrossRef]
  23. Grift, T.E.; Kweon, G. Development of a Uniformity Controlled Granular Fertilizer Spreader; American Society of Agricultural and Biological Engineers: St. Joseph, MI, USA, 2006; pp. 1–14. [Google Scholar]
  24. Koko, J.; Virin, T. Optimization of a fertilizer spreading process. Math. Comput. Simul. 2009, 79, 3099–3109. [Google Scholar] [CrossRef]
  25. Hofstee, J.W.; Speelman, L.; Scheufler, B. 1.4-Fertilizer Distributors. In CIGR Handbook of Agricultural Engineering; The International Commission of Agricultural Engineering, Stout, B.A., Cheze, B., Eds.; American Society of Agricultural Engineers: St. Joseph, MI, USA, 1999; Volume III, pp. 240–268. [Google Scholar]
  26. EN 13739-2:2011 European Standard. Agricultural Machinery—Solid Fertilizer Broadcasters and Full Width Distributors—Environmental Protection—Part 2: Test Methods; CEN: Bruxselles, Belgium, 2011. [Google Scholar]
  27. Kleinman, K.; Horton, N.J. SAS and R. Data Management, Statistical Analysis, and Graphics; CRR Press-Taylor & Francis Group: Boca Raton, FL, USA, 2010. [Google Scholar]
  28. Hofstee, J.W.; Huisman, W. Handling and spreading of fertilizers: Part 1, Physical properties of fertilizer in relation to particle motion. J. Agric. Eng. Res. 1990, 62, 9–24. [Google Scholar] [CrossRef]
Figure 1. Geometry, kinematics, and dynamics of a spinning disc fertilizer.
Agriculture 10 00467 g001
Figure 2. Scheme of experimental test site: (1) disc spreader; (2) collection trays.
Agriculture 10 00467 g002
Figure 3. Disc spreader experimental test stand.
Agriculture 10 00467 g003
Figure 4. Spreading disc showing the location of the fertilizer feed points A and B: (a) the L3 vane configuration; (b) the L0 vane configuration.
Agriculture 10 00467 g004
Figure 5. Mean spread radius for the different fertilizers (axes: DS–FP–VC).
Agriculture 10 00467 g005
Table 1. Physical properties of the mineral fertilizers.
PropertyFertilizer
UreaCANAS
Bulk density (loose), kg · m 3 75810291018
Bulk density (sieved), kg · m 3 78910621104
Specific density, kg · m 3 134018001780
Mass powdery fraction ( < 1 · 10 3   m ) , %10.3500.03052.500
Median diameter d 50 , 10 3   m 0.8302.1000.490
Table 2. Fixed model analysis of variance for the mean radius of fertilizer spread.
VariationDoFSum of SquaresMean of SquaresF Function ValuePr > F
Model14123.828.84783.26<0.0001
Error570.640.01
Total71124.46
R 2 = 0.9948
Average mean radius of fertilizer spread = 4.10 m
Standard Estimation Error = 0.103 m
Coefficient of Variation = 0.0248
FT263.4431.722809.03<0.0001
DS134.2434.243032.2<0.0001
FP10.010.010.940.337
VC115.9215.921409.65<0.0001
FT × DS26.163.08272.55<0.0001
FT × FP20.050.0252.160.1241
FT × VC23.021.51133.76<0.0001
DS × FP10.050.054.210.0448
DS × VC10.890.8979.54<0.0001
FP × VC10.050.054.120.0471
FT: fertilizer type; DS: disc angular velocity; FP feed point position; VC: vane configuration.
Table 3. T-Tukey’s multiple confidence intervals comparing the average mean radius of fertilizer spread.
Compared Averages forAverage
Value
Number of ObservationsMean Square ErrorLimit Value
(α = 0.05)
Least Significant Difference
Fertilizer type (FT): Urea4.23240.0113.400.074
Fertilizer type (FT): CAN5.45240.0113.40
Fertilizer type (FT): AS3.15240.0113.40
angular velocity of disc (DS): 42 rad · s 1 3.59360.0112.830.05
angular velocity of disc (DS): 63 rad · s 1 4.97360.0112.83
Fertilizer feed point (FP): A4.26360.0112.830.05
Fertilizer feed point (FP): B4.29360.0112.83
Vane configuration (VC): L03.81360.0112.831.86
Vane configuration (VC): L34.75360.0112.83
Table 4. Model parameter assessment of the linear multiple regression of the mean radius of fertilizer spread.
VariationParameterSEF Function ValuePr > FPartial Correlations
Constant0.807980.479852.840.0969-
VC−0.034830.0035298.1<0.00010.12789
DS0.006900.00047211.01<0.00010.31543
SD1.658210.2338250.29<0.00010.00421
DF−0.043570.00221389.04<0.00010.85308
VC: vane configuration; DS: disc angular velocity; SD: specific density; DF: dusty fraction.
Table 5. Analysis of variance for the linear multiple regression model of the relationship between the mean radius of fertilizer spread and the considered parameters.
VariationDoFSum of SquaresMean of SquaresF Function ValuePr > F
Model4113.5951228.39878175.02<0.0001
Error6710.871440.16226
Total71124.46656
R 2 = 0.9127
Coefficient of Variation = 0.0942

