Article

Simulation of Internet of Things Water Management for Efficient Rice Irrigation in Rwanda

1
African Center of Excellence in Internet of Things, College of Science and Technology, University of Rwanda, KN 67 Street, Kigali, Rwanda
2
Chester F. Carlson Center for Imaging Science, Rochester Institute of Technology, Rochester, NY 14623, USA
3
SBAB Bank, 17104 Solna, Stockholm, Sweden
4
Rwanda Information Society Authority, KG 7 Street, Kigali, Rwanda
*
Author to whom correspondence should be addressed.
Agriculture 2020, 10(10), 431; https://doi.org/10.3390/agriculture10100431
Submission received: 24 July 2020 / Revised: 4 September 2020 / Accepted: 7 September 2020 / Published: 25 September 2020

Abstract

:
The central role of water access for agriculture is a clear challenge anywhere in the world and particularly in areas with significant seasonal variation in rainfall such as in Eastern and Central Africa. The combination of modern sensor technologies, the Internet, and advanced irrigation equipment combined in an Internet of Things (IoT) approach allow a relatively precise control of agricultural irrigation and creating the opportunity for high efficiency of water use for agricultural demands. This IoT approach can thereby increase the resilience of agricultural systems in the face of complex demands for water use. Most previous works on agricultural IoT systems are in the context of countries with higher levels of economic development. However, in Rwanda, with a low level of economic development, the advantages of efficient water use from the application of IoT technology requires overcoming constraints such as lack of irrigation control for individual farmers, lack of access to equipment, and low reliability of power and Internet access. In this work, we describe an approach for adapting previous studies to the Rwandan context for rice (Oryza sativa) farming with irrigation. The proposed low cost system would automatically provide irrigation control according to seasonal and daily irrigational needs when the system sensors and communications are operating correctly. In cases of system component failure, the system switches to an alternative prediction mode and messages farmers with information about the faults and realistic irrigation options until the failure is corrected. We use simulations to demonstrate, for the Muvumba Rice Irrigation Project in Northeast Rwanda, how the system would respond to growth stage, effective rainfall, and evapotranspiration for both correct operation and failure scenarios.

1. Introduction

The efficient use of water for agriculture can be critical to ensure high yields and maximize economic benefits, especially for regions facing annual or seasonal strains on water availability. Around 90% of the population of Rwanda is engaged in agriculture considering farming for both subsistence and economic development [1,2]. The intensive practice of agriculture across Rwanda places a large demand on water resources, with an estimate of as much as 70% of the available water resources are used for agriculture [3]. One water intensive crop of increasing importance in Rwanda is rice (Oryza sativa), currently the second most important cereal. The water demands for rice are considerable during the succession of growth stages with varying water requirements for the stages as shown in Table 1. The total demand value is a typical seasonal water requirement for the growth stages of rice in a tropical environment [4], though actual requirements can be plus or minus as much as 500 mm, mostly depending on soil type and percolation.
According to the National Rice Program of the Government of Rwanda [5], past predictions for the national demand for rice were underestimated; so one aspect of food security for Rwanda is to bolster domestic rice production. However, according to the National Institute of Statistics of Rwanda (NISR), production as recently as 2018 was only about a third of demand, thus leading to unfavorable economics [6]. For this reason, the Government of Rwanda makes rice production a priority area for improving agricultural output, and addressing the inefficient use of water in irrigation is part of the solution [7,8].

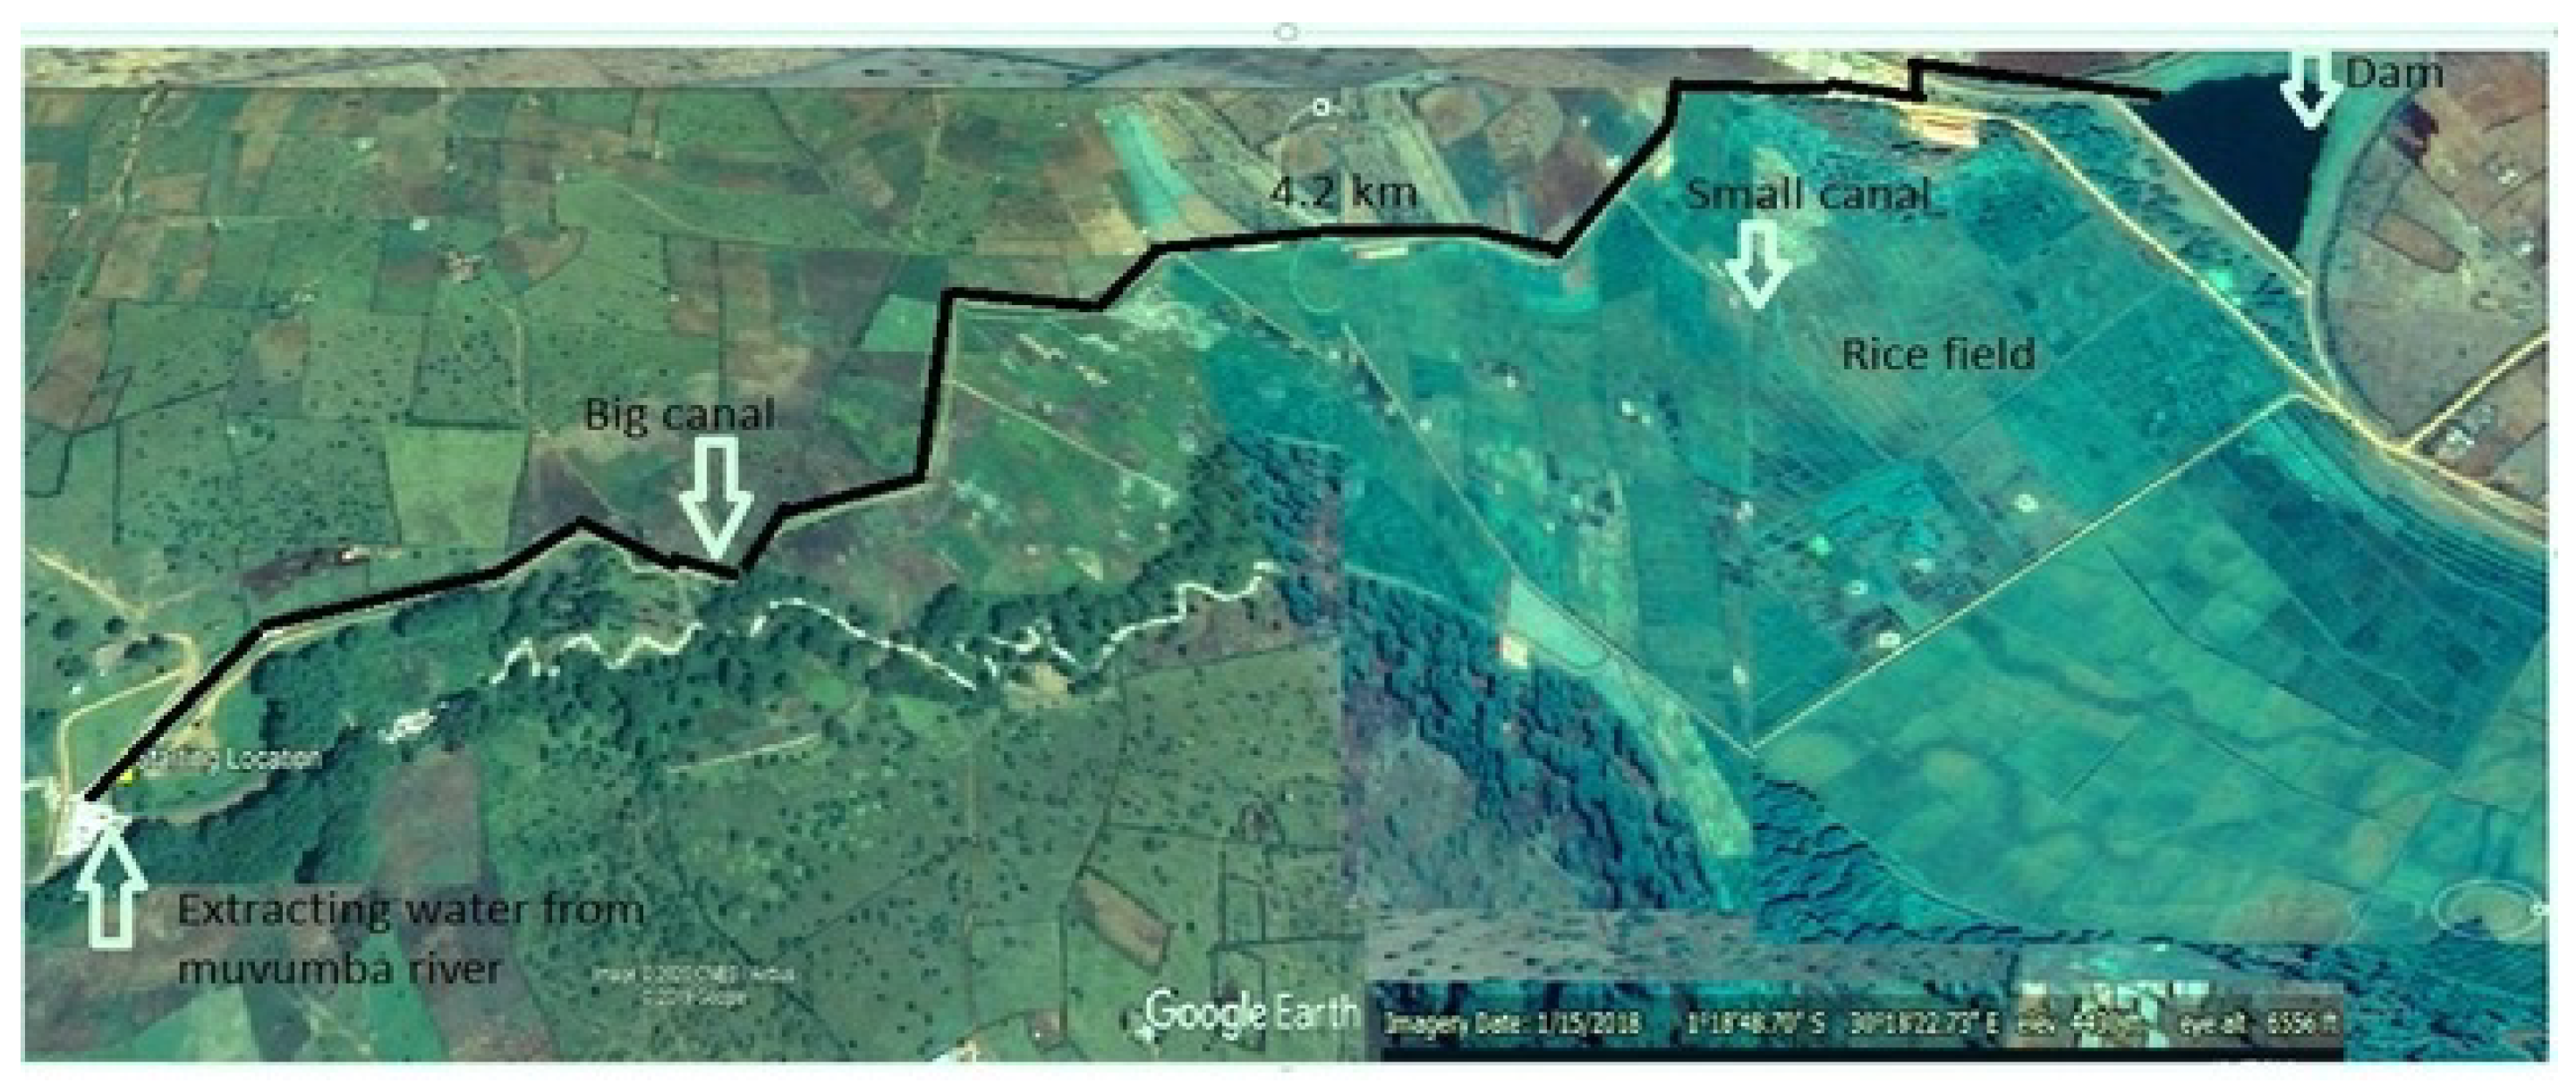
1.1. The Current Situation for Rice Irrigation in Rwanda

Due to the hilly nature of the Rwandan countryside, most existing irrigation schemes are typically local and designed for intensive agricultural practices in the relatively flat marshland terrain of valley bottoms [1,2]. These irrigation schemes are necessary to increase production, since rainfall alone is excessively variable and, especially in Eastern Rwanda where we site our study, rainfall for rice cropping is inadequate in a typical year. With irrigation, these marshlands can support two rice crops per year due to the two rainy seasons in this equatorial region; Season A is March to August and Season B is September to January. Each growing season starts in a rainy season and ends in a dry season. Even in the rainy season, irrigation is required to respond to rainfall variability and in the dry season, it is mandatory for the final growth stages before harvest. According to [3], the current system is manual, where farmers observe the water depth and when the water is reduced to a certain level they contact the authorities to divert water to the canals so they can irrigate. However, conflicts arise in this system. First, there has to be a collective request of the farmers to achieve maximum consumption. As a result, the farmers are obliged to plant at the same time. Second, water control structures are minimal, causing further conflicts among farmers when inadequate control of water creates flooding of plots when it is not needed. Finer control of water would decrease conflicts and provide the farmers more choice in planting and harvest.
An existing irrigation scheme in Rwanda with these characteristics for which our study is designed is Muvumba Valley Rice Plantation in Nyagatare District, Eastern Province (Figure 1).
Internet of Things (IoT) technology has great potential to solve problems such as irrigation control at low cost [9]. Irrigation control does require core algorithms for irrigation decision-making that are sensitive to growth stage, to make the IoT system more autonomous. Like any IoT agriculture system, there are field sensors for detecting the desired parameter; in this case, water level in flooded rice fields. When the water level is below a threshold, the system will irrigate, send field sensor data to a cloud network, and then send system status updates by smartphone, or short message service (SMS) to those farmers without a smartphone, for normal operation. In the case of system failure in the field, farmers will receive an alert and an irrigation recommendation so the farmer can manually intervene. The system will react automatically to water level through an algorithm that adjusts irrigation needs according to growth stage, evapotranspiration, and rainfall. In this study, the core algorithms for water control for normal operation and for failure mode operation are tested through simulation.

1.2. Related Work

In this section we review some examples of IoT sensors and common system components and architectures for agricultural systems as well as the important role of decision modeling for translating data into actionable information. We then summarize our objectives for this study.

1.2.1. Sensors and Systems for Agriculture

Previous work on IoT systems describes components to be adapted to the Rwanda context. Sensors for measuring water level in real time in disaster prone areas is one example, where the water level sensor value is compared to a threshold and if the water level reaches the threshold, the signal is fed in real time to social networks [10]. That system also uses a cloud server configured as a data repository and the water level alarm is also displayed on a remote dashboard. Water level measurement in tanks is widespread in process industries when it is necessary to measure the level of a liquid [11]. A variety of level measurement technologies for field deployment are on the market today, such as ultrasonic level sensors, capacitance level sensors, and others [12,13].
An example irrigation system is outlined in [14] with sensor components for soil moisture, light, temperature, and humidity. Other examples relevant to our study include a complete IoT architecture for irrigation [15] and a low cost architecture for heterogeneous data sources [16]. In direct relation to smart farming, several researchers have promoted scalable network architectures for monitoring and controlling agriculture and farms in rural areas [17,18]. Such systems have the goal of improving data communication with methods such as a cross-layer-based channel access and routing solution for sensing and actuating to improve coverage range, throughput, and latency [19,20]. Most of these systems have common components of sensors for field measurements, cloud computing for data analysis, and decisions for actuators returned to the farmer or farming system.

1.2.2. Decision Modeling

Given the technologies assessed above, other researchers have described how IoT systems have the potential to collect field sensor data in real time and feed the data to integrated modeling tools for producing decision outputs for irrigation and other farming activities [21]. According to [22], an information system for precision agriculture will depend on how data are stored, managed, accessed, and ultimately combined in order to make sound decisions. With knowledge based on these prior explorations of typical components of IoT for agricultural systems, this work focuses on an IoT system that first includes not only sensor data, but also Web-based weather services, and second, modeling of the irrigation requirements for decision making in the context of rice farming in Rwanda. These key components take advantage of freely accessible data via the Internet, knowledge from offline agricultural decision tools, and computational modeling approaches to build the irrigation decision system. The system is also designed for a certain level of fault tolerance, necessary for communicating decisions in a low income country, where sensor faults may not be readily repaired, power may not be reliable, and internet access and end user technology ranges from short message service (SMS) only, to smartphones.

1.2.3. Objectives

The objectives of this study are to investigate how control algorithms within an IoT water management system might be adapted for rice farming in Rwanda and to use simulations to demonstrate the key components of the appropriate automatic control of irrigation as well as fault tolerance.

2. Materials and Methods

This section presents an overview of the control algorithms for an IoT water management system. Details are provided of the Markov chain process used to model the irrigation decision algorithm when the IoT system is fully functional as well as details of the SARSA temporal difference algorithm for when the system has a fault. This built in fault tolerance is important for the context of a low economic development country, where power or communications loss can be common and because rice has critical stages, such as flowering, where water deficit can lower yields.

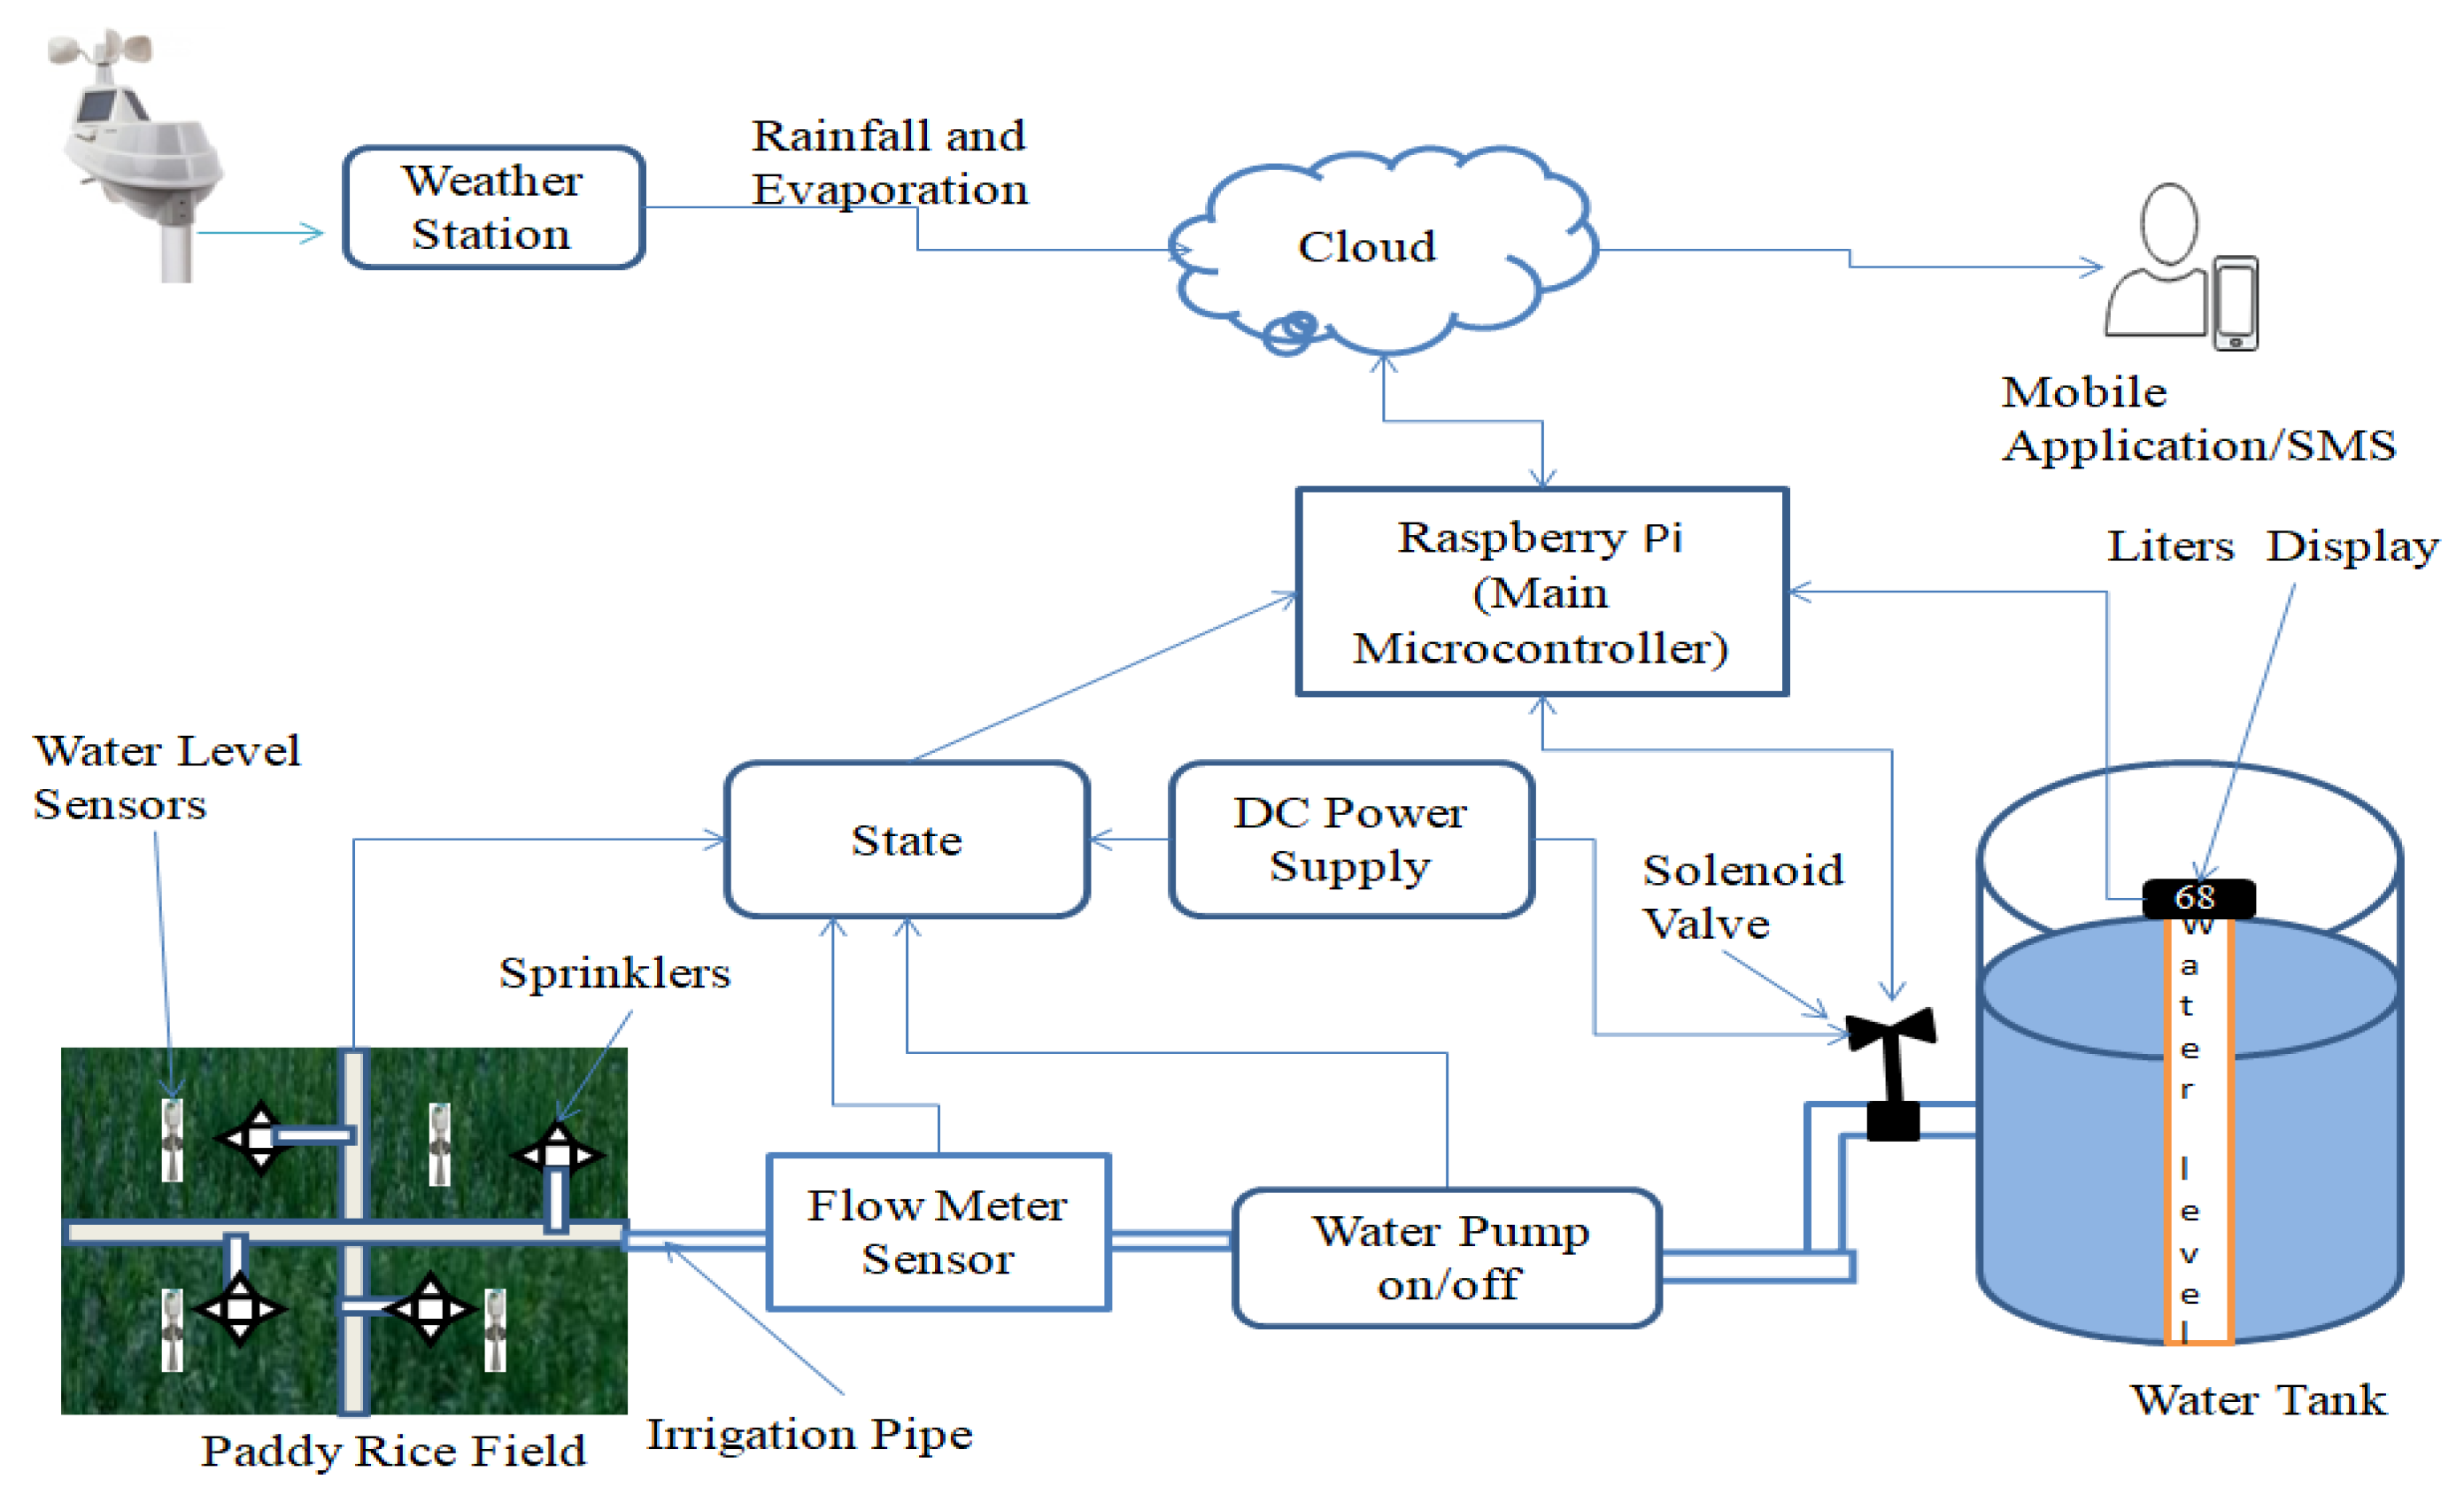
2.1. Overview of Proposed IoT Irrigation System

The flowchart of the IoT system (Figure 2) has two decision pathways, one is the fully functioning automatic system (white), while the second initiates if there is a fault in the automatic system (gray), thereby still providing actionable recommendations for the farmer until the fault is fixed. The fault may arise from communications breakdown, or sensor or actuator failures that prevent data flow. In the fully automatic mode, the farmer is informed on system status and actions via smart phone or SMS, since some farmers will have smartphones but others will not. The mobile phone market is sufficiently developed in Rwanda so that every farmer will at least have a mobile phone that can receive SMS. In the fault mode, the farmer is notified of the fault and irrigation recommendations are communicated, but the farmer must manually control irrigation (turn pumps on and off according to their observations). Different modeling processes are used to model irrigation decisions for the data rich automatic pathway and the data starved pathway when a fault occurs.
In the automatic pathway, the irrigation decision is modeled as a Markov chain process (MCP) [23]. The IoT system will check the water level in the field and the rainfall prediction by Web service. If the level in the field is below the established threshold for the current growth stage, the amount to add will be calculated by taking into account the predicted rainfall. If irrigation water is needed, the system will engage to extract water from the supply to a tank and flow to the field through pipes. This IoT system will allow individual farmers to control the irrigation of their individual plots to overcome limitations of the current practice. The system interface for the farmer can be smartphone or SMS.
If there is a fault in the IoT system, the pathway switches to the SARSA temporal difference method to propagate the recommended control action to the farmer [24,25]. When the system moves to a fault state, conditions are initialized as the last valid MCP output. The SARSA model is used until the fault is identified and repaired. Once the IoT system is again operational, the MCP method resumes with initialization based on the last state of the SARSA method. The farmer will manually control irrigation until maintenance allows restart of the IoT system.
The details of the two pathways are presented in the next two sub-sections.

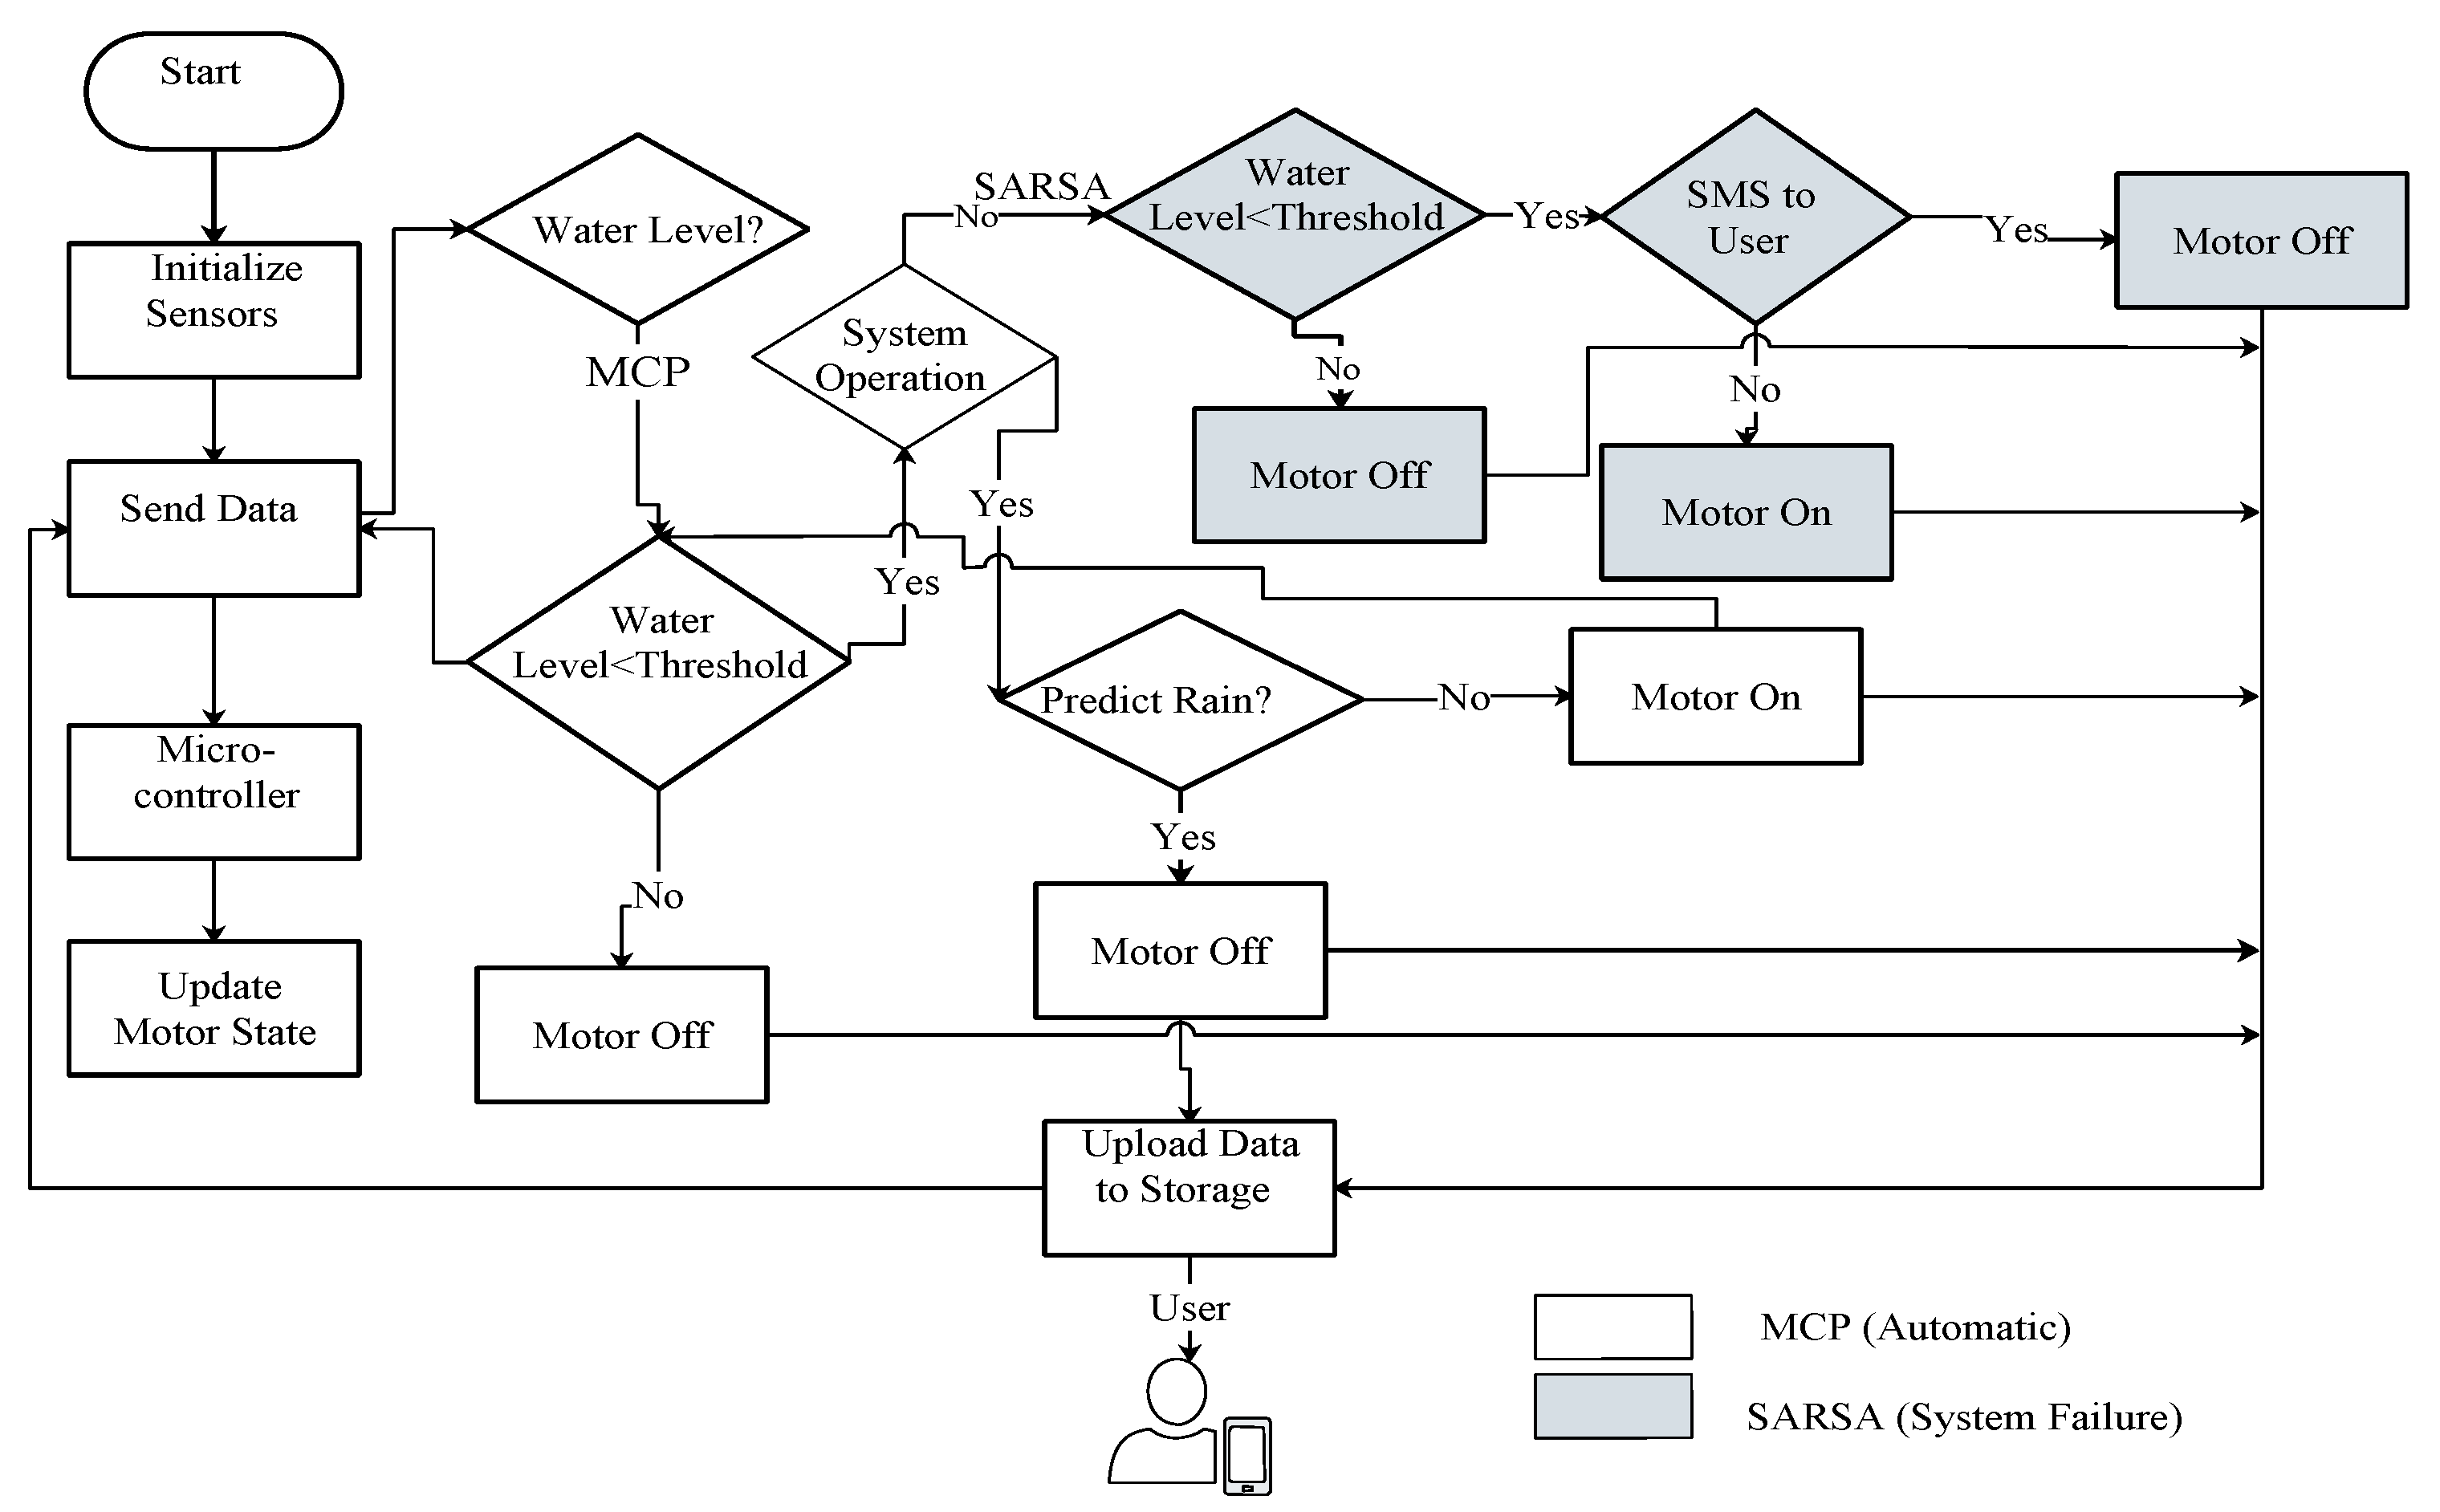
2.2. Markov Chain Process for a Fully Functional IoT System

MCP has been demonstrated to be a valid modeling approach for agricultural crop systems [23] because once a crop reaches a particular growth stage, growth progress to the next stage is independent of prior history. Rice water requirements change for each stage of growth, so the Markov chain process deals with this set of possible stages S and the set of possible actions A, where the effects of an action taken in a stage depend only on that stage and not on the prior history. We thus use the MCP approach to model the probabilistic transitions among a set of stages S = { s 1 , s 2 , } [26], where each stage s i S is defined with a predetermined cumulative total soil water (TSW) range (Table 1). Water loss from each plot is monitored with a water level sensor and daily TSW calculations are summed to provide the cumulative value. Weather variables and the weather forecast are accessed by a Web service query. When no rain is forecast, plot-level water deficits are determined as a calculated needed water (CNW), by accounting for the area of the plot and the water depth, and irrigation occurs to provide the CNW. If the Web query indicates impending rainfall, the system will wait, then recheck the water level sensor reading after the predicted rainfall period. If the water level is still below range, the system determines the CNW within that specific plot to release only the required water in order to avoid a complete water deficit and crop failure while waiting for forecasted rain. A minimum threshold water level is set as a backup [4]. The system reacts to the ingested data to indicate a state of deficit, a sufficient amount, or an excess of water according to the growth stage, and thus define actions to take to satisfy the irrigation demand.
The total soil water ( T S W j , mm) during an irrigation period j can be modeled as the sum of crop evapotranspiration ( E T j , mm) and seepage and percolation in the soil ( S P j , mm) minus effective rainfall ( E R F j , mm), which reduces the irrigation demand [4]. TSW is calculated each day and summed as a way to track the targeted cumulative TSW for each stage.
T S W = E T j + S P j E R F j
Following [4], E R F j = 0.6 × R F since rainfall is typically less than 50 mm per week at the study site. E T r = K c × E T o where E T r is rice evapotranspiration (mm/day), K c is the rice coefficient [27], and  E T o is the reference evapotranspiration (mm/day) according to the FAO Penman Monteith method [28]. The irrigation decision is to choose among a set of actions A = { a 1 , a 2 , } defined as to irrigate, not irrigate, or extract water from the field. This decision is made every other day (2-day time step) with the assumption that daily irrigation is not required, although the system can take daily action since the TSW is calculated daily. The decision of what action to take directly affects the state that can be reached at the next time step as a Markov decision process (MDP). In this MDP, the action is a w A , where a w is the irrigation action to take, given a certain state s i S , where s i is one of five stages which defines the condition C ( s i , a w ) . The strategy of choosing actions at each time step is summarized as a policy, which usually aims to control the condition, which in this case is the flooded water depth as indicated in Table 1.
To illustrate the case where the decision is made to irrigate (which is the usual case for the Muvumba site), this decision depends on the current state s S , and a valve is opened as action a A , which changes the condition C. The decision depends on the water level sensed in the field and the rain forecast. The T S W γ ( s 1 , a 1 ) is defined as when the water level reaches the desired range between the threshold and the maximum. If the weather forecast indicates impending rainfall, the system immediately tests the condition to check if irrigation can be delayed to take advantage of the rainfall. Whatever the decision, the new condition C is received and the state transits to S. The cumulative T S W γ ( s 1 , a 1 ) value of the state-action pair is updated with the calculated water needed ( C N W ) using Equation (2). This process is repeated until 12 days before harvesting, at which point the field is drained and allowed to dry to enhance conditions for harvest.
C N W = C + T S W γ ( s 1 , a 1 ) T S W ( s , a )
The modeling system keeps a record of calculated water needed, amount of rainfall, and total soil water in the field. After each model step, the value of the current state action pair is added by Equation (2). After each step, all entries of the T S W water to the field are updated according to the Equation (3) with time step α .
T S W ( s , a ) T S W ( s , a ) + C N W α ( s , a )
The fully operational IoT irrigation system proceeding as described above is summarized in Algorithm 1. The algorithm first translates the time step i to 2 days [ j , j + 2 ] . Then, it calculates the irrigation water depth I j for day j according to the current T S W j in Equation (1), the CNW in Equation (2) using a function Irrigation Amount(mm), records the field condition using Equation (3), and takes action A depending on stage of the rice as in Table 1.
Algorithm 1 Generating daily TSW and record function
 1:
Generate daily TSW and irrigation record function C a l T S W ( i , a )
 2:
j = 2 × ( i 1 ) + 1
 3:
CNW Irrigation Amount
 4:
Case: s ( 1 , 2 , 3 , 4 & 5 )
 5:
if   i j > T h r e s h o l d   then
 6:
 Take action a ( 1 )
 7:
else if   i j = T h r e s h o l d   then
 8:
 Take action a ( 0 )
 9:
else if   i j < T h r e s h o l d   then
10:
  Take action a ( 1 )
11:
end if
12:
for k = j + 1 , k + + , while k < j + 3 do T W S k C a l T S W ( T S W k 1 , I k 1 , E T k 1 , C k 1 ) do
13:
    Return T S W j + 2 and I j
14:
     C N W C + T S W γ ( s 1 , a 1 ) T S W ( s , a )
15:
     T S W ( s , a ) T S W ( s , a ) + C N W α ( s , a )
16:
end for
Depending on the stage of the rice crop, there will be minimum and maximum water levels above the soil to produce T S W values for the following 2 days. The system will assess current TSW, CNW, and rainfall. Total soil water at a certain level ( T S W k ) will be determined and when the water is found to be above the maximum level due to heavy rainfall, water can be extracted from field ( T S W k 1 ) by opening the valve and allowing water to flow from field to the tank then to the dam to minimize water waste. The 2-day time step is not fixed, if the water requirement is high, the system will provide water on a daily basis. If the water requirement is low, the system will allow days without irrigation. The condition will indicate a need for more irrigation by analysis of real time data from sensor.

2.3. Modeling in the Context of a System Fault

When there is an interruption of irrigation because of a technical problem (a fault in the IoT system), the farmers will be notified and reminded to perform daily TSW monitoring. To provide the farmer with recommended actions during the fault condition, the system reverts to a reinforcement learning technique called SARSA [24,25]. SARSA is a temporal difference learning algorithm and uses a state-action pair tuple which maps the action to be taken at each state and the control method chooses the action for each state during learning, by following Markov decision process rules applied at every time step, and by letting the agent transition from one state-action pair to another. A factor λ will be initialized to the last valid values of T S W ( s , a ) when the MCP stopped. Later C N W ( s , a ) are updated according to the relevance of the previous state-action pair.
C N W ( s , a ) λ C N W γ ( s , a )
This approach will allow information flow to the farmer to continue when the system that uses the Markov chain process is not working normally.
Algorithm 2 provides a complete description of the learning process when the IoT system fails to operate normally from some fault. Every rice crop stage is considered as an episode, consisting of n time steps. The program is initialized with the last valid T S W value from MCP. At each time step, the agent takes an action and runs the function C N W ( m m ) from Equation (2) and obtains the T S W and the irrigation record for the current time step with Equation (3). The condition function is assigned such that all the immediate conditions are 0, except for the last one.
Algorithm 2 System using SARSA during irrigation.
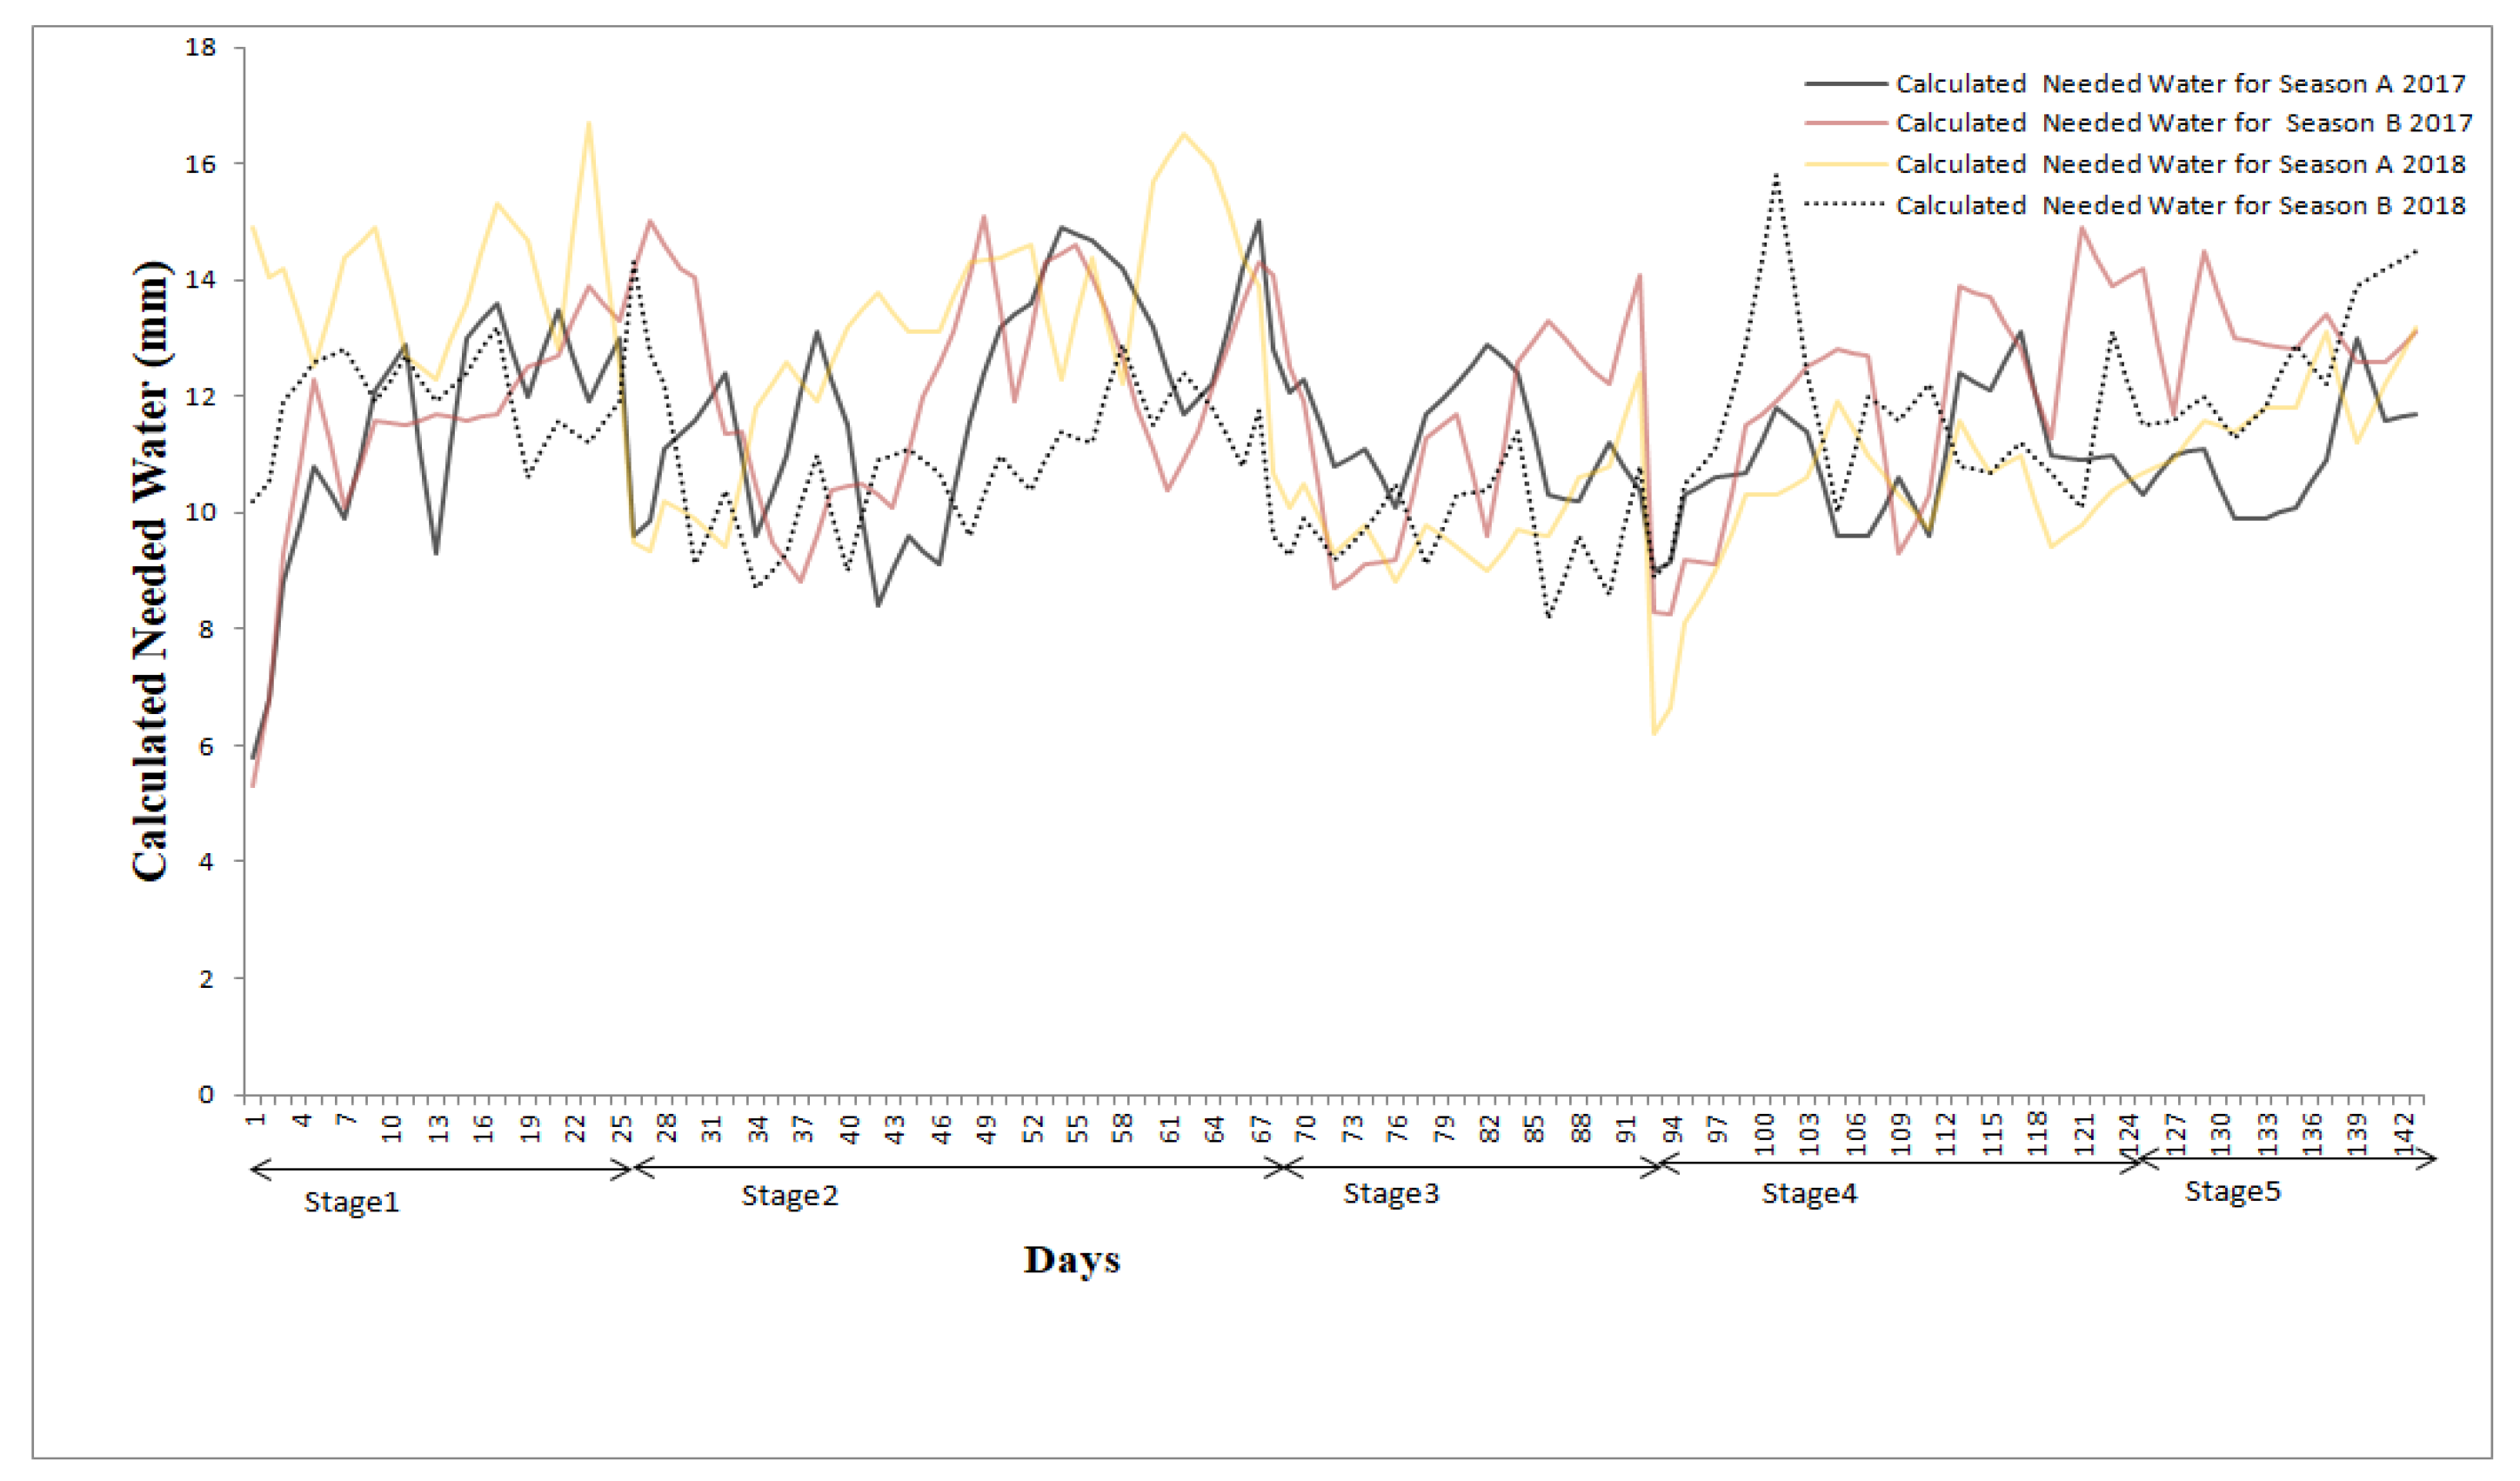
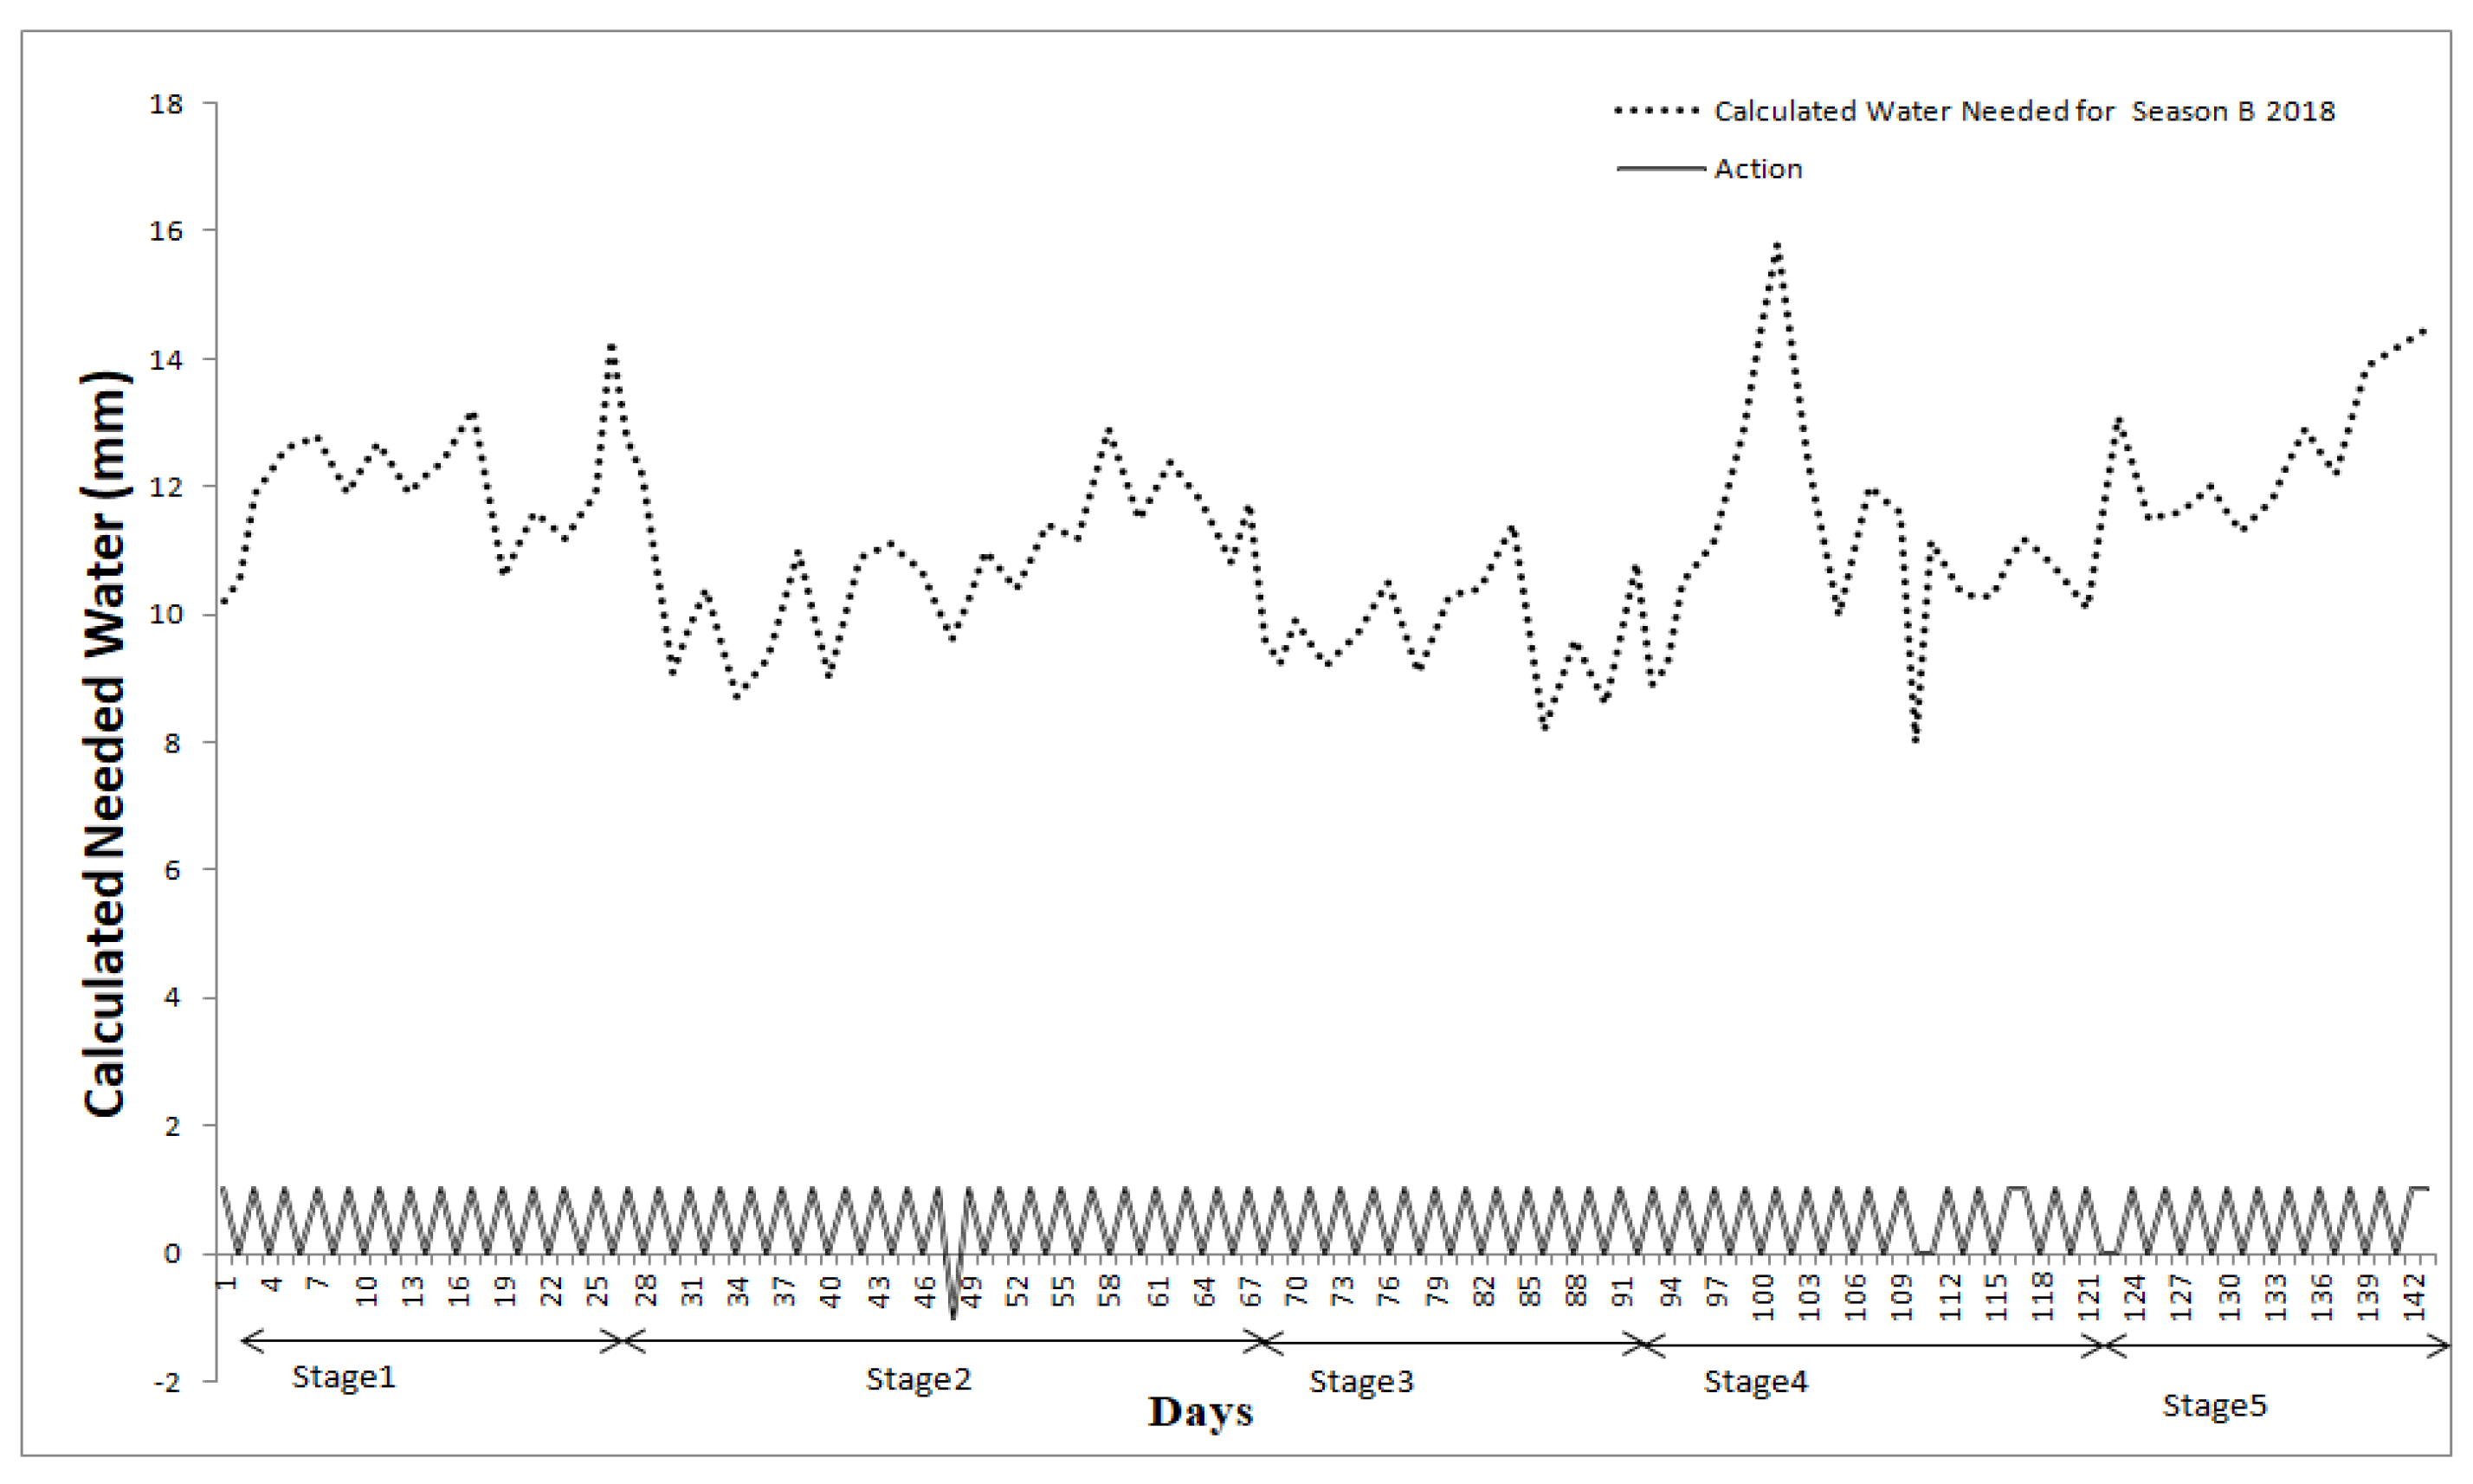
 1:
Initialize T S W ( s , a ) based on last valid MCP output.
 2:
for All C N W ( s , a ) do
 3:
     C N W ( s , a ) 0
 4:
    for   i = 1 , i + + while i < n + 1 do s State ( i , T S W i ) do
 5:
  Take action a
 6:
    [ T S W i + 1 , I i ] C a l T S W ( i , a ) S 1 S t a t e ( i , T S W i )
 7:
    a 1 g r e e d y ( T S W , S i + 1 )
 8:
     C N W C + T S W γ ( s , a ) T S W ( s 1 , a 1 )
 9:
  for All s & a do
10:
   T S W ( s , a ) T S W ( s , a ) + C N W ( s , a )
11:
   C N W ( s , a ) λ C N W γ ( s , a )
12:
   end for
13:
   end for
14:
end for
15:
Until T S W ( s , a ) policy sufficiently stabilized

3. Results

To evaluate the effectiveness of the proposed decision modeling system, we used historical data from Meteo Rwanda of rainfall and evaporation from March 2017 to January 2019 for four seasons. Figure 3 is a plot of rainfall and evaporation for Season B from September 2018 to January 2019. Data for the other seasons are provided as supplementary materials. These data are from the Nyagatare weather station in Eastern province of Rwanda adjacent to the Muvumba Rice Plantation and provide us the E T and E R F values for Equation (1). The S P value is taken from [29].

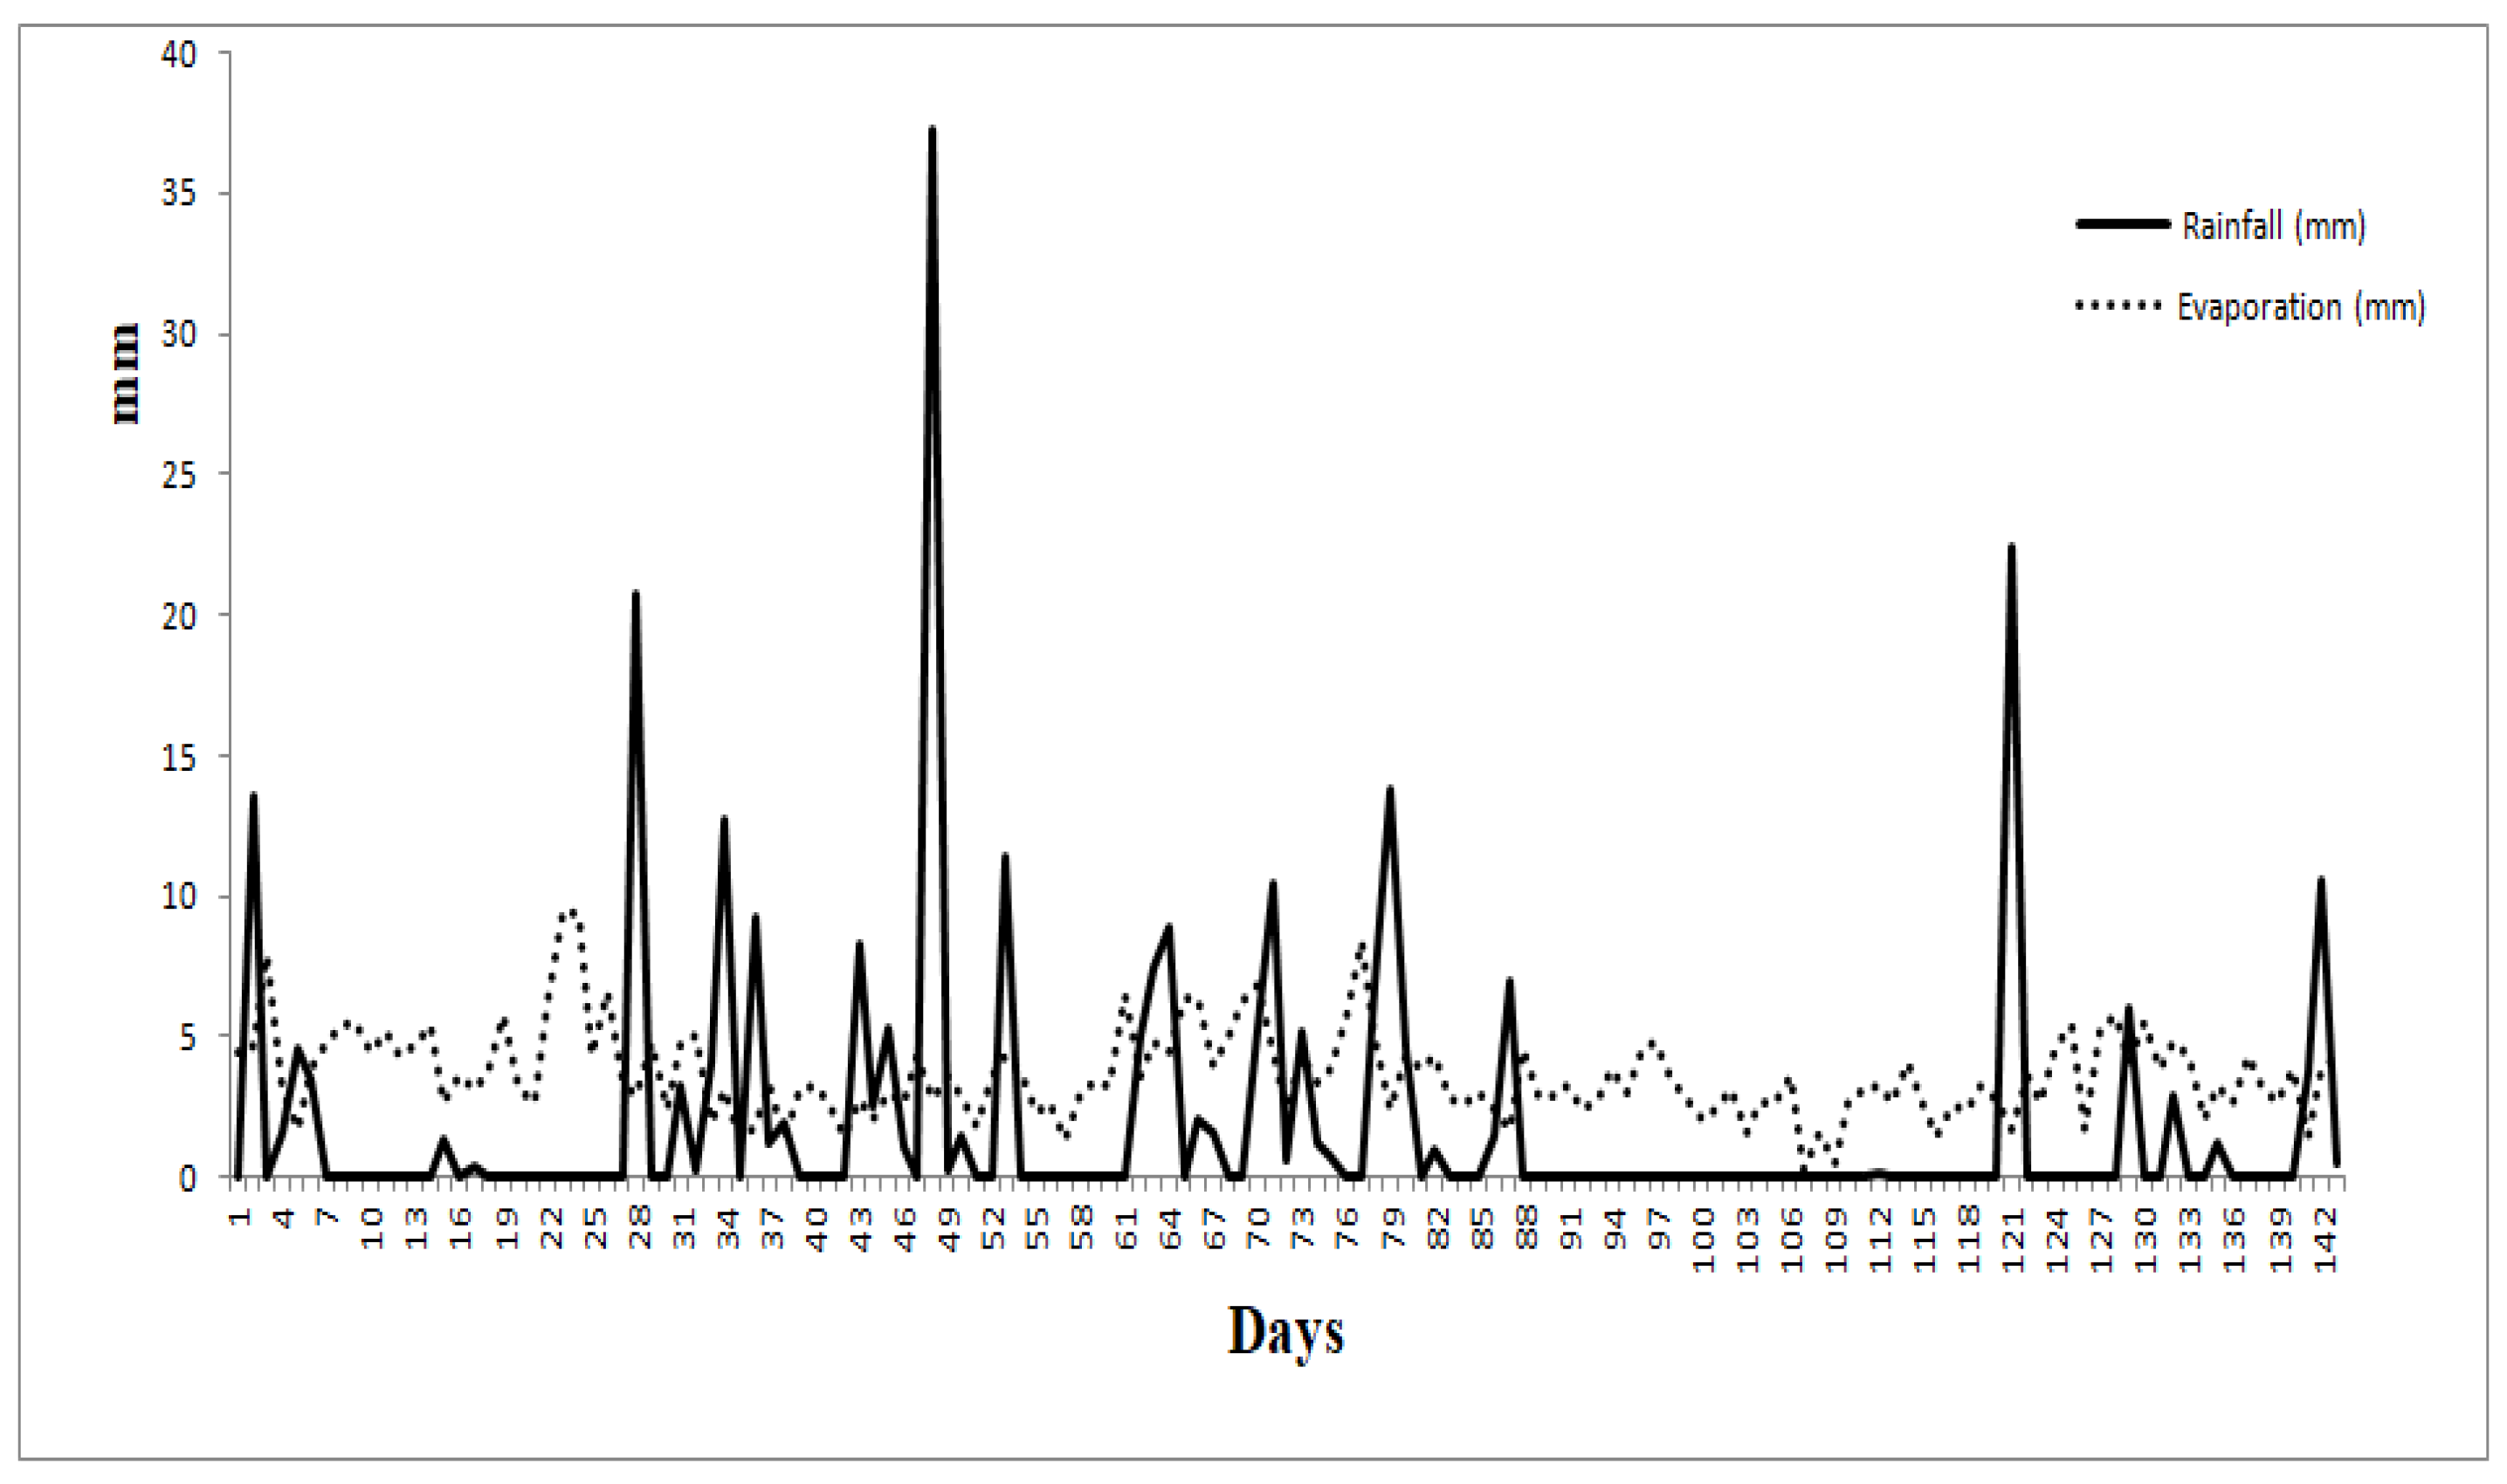
3.1. System Simulation

Figure 4 shows a notional system architecture. The architecture has components for field sensors and Web data, actuators, the system state modeling, and the user interface. The system will take action depending on the information from the state modeling system either to irrigate (1), not irrigate (0), or extract water from field (−1). The display system used to communicate the rice field status to the farmer through the smartphone app or short message service (SMS) using GSM protocols.
The weather station provides daily rainfall and evaporation and other weather variables and sends them to the cloud database, while the weather forecast can be obtained from the Web. Hardware such as the Raspberry pi Compute 3 lite can be used as the controller and processing unit. Water level sensors in the field help monitor irrigation needs and solenoid valves and pumps will allow water to flow from storage tanks to the rice field under control of the Raspberry Pi. The farmer can check the irrigation status of the field using a smartphone app. If the farmer does not have a smartphone, their phone number can be registered to receive the notification for changes made to their field via SMS. The flow meter sensor will measure the volume of water used for irrigation at every irrigation time step and all the sensed data will be collected to take action based on the decision algorithms embedded on the Raspberry Pi.

3.2. System Simulation Result

The simulated output for the fully operational system for four fields with weather data from different seasons from March 2017 to January 2019 are shown in Figure 5. The timing of the five rice growth stages as indicated in Table 1 are shown at the bottom of the figure.
The simulation results for the fully functioning automatic system show the calculated needed water (CNW) is maintained at a steady level by the system during the four different seasons with variable rainfall and relatively steady evaporation (Figure 3). The simulation of a fault is done for the Season B 2018 data except with the assumption of a fault in the system from day 110 to day 116 during stage 4 (Figure 6). This simulation shows the SARSA simulation filling in where the MCP left off providing the farmer with suggested irrigation values. The SARSA process retains knowledge of the stage water depth requirement and in this case fills in for missing predicted rainfall from the historical evaporation and rainfall. Comparison of Figure 3 and Figure 6 also demonstrates the system reacting to heavy rain on Day 48 by extracting water from the field on Day 49, skipping irrigation on Day 111 due to negligible evaporation on Day 109, and skipping irrigation on Day 123 due to heavy rain on Day 121.

4. Discussion

These system simulations demonstrate the capability of the decision modeling to precisely monitor and take irrigation actions incorporating weather predictions and to have fault tolerance. The modeling components of the IoT system include the irrigation decision process that is ultimately presented to the farmer. The farmer can receive the decision information, assess the reliability of the information, and remotely interact with irrigation controls based on their own expert knowledge combined with the system data. The system has a level of fault tolerance to prevent crop loss by adaptively switching modeling modes. The system demonstrated here could be adapted to other crops by adjusting IoT sensor types and prediction models. The system has promise to minimize the human effort for manual operations, reduce water use, and potentially increase return on investment by precision control of irrigation with fault tolerance. Furthermore, data collected over time can be used for long-term analysis and inform policy makers in better decision making and efficient resource utilization. While this simulation was done for flood irrigation, the system has potential to be applied in the Alternate Wetting and Drying irrigation method used to reduce water use in rice production by close control of irrigation while monitoring crop condition.

5. Conclusions

In this study, we have described adapting the MCP and SARSA models relevant to rice production within a low cost and appropriate technology version of an IoT system to manage rice irrigation in Rwanda. Modeling the irrigation process using MCP and SARSA algorithms will allow advanced field specific variable rate irrigation at sites such as Muvumba Valley Rice Plantation. Future improvements for this IoT system include integrating data from remote sensing platforms to follow crop growth and linking real time economic data such as power costs and market prices in seeking to maximize profit while meeting production demands.

Author Contributions

Conceptualization, P.B. and A.V. (Anthony Vodacek); supervision, A.V. (Anthony Vodacek), A.V. (Andras Valko), and S.R.N.; writing—original draft, P.B.; writing—review and editing, P.B. and A.V. (Anthony Vodacek). All authors have read and agreed to the published version of the manuscript.

Funding

This study received funding from ACEIoT https://aceiot.ur.ac.rw.

Conflicts of Interest

The authors declare no conflict of interest.

References

  1. Boutouta, A. Agriculture Mechanization Strategy for Rwanda. Kigali: Irrigation and Mechanization Task Force; Ministry of Agriculture and Animal Resources: Kigali, Rwanda, 2013.
  2. Dusabimana, T. Irrigation Practices and Water Management in Rugeramigozi Marshland: A Case Study of Surface Irrigation in Rugeramigozi Marshland, Rwanda. 2012. Available online: http://edepot.wur.nl/222565 (accessed on 18 June 2020).
  3. NISR. Seasonal Agricultural Survey 2019 Annual Report, December 2019. National Institute of Statistics of Rwanda. 2019. Available online: http://www.statistics.gov.rw/publication/seasonal-agricultural-survey-2019-annual-report (accessed on 18 June 2020).
  4. Zawawi, M.A.M.; Mustapha, S.; Puasa, Z. Determination of water requirement in a paddy field at Seberang Perak rice cultivation area. IEM J. 2010, 17, 32–41. [Google Scholar]
  5. MINAGRI. National Rice Development Strategy (2011–2018); Ministry of Agriculture and Animal Resources: Kigali, Rwanda, 2013.
  6. NISR. Seasonal Agricultural Survey 2018 Annual Report; National Institute of Statistics of Rwanda: Kigali, Rwanda, 2018. [Google Scholar]
  7. Ghins, L.; Pauw, K. The impact of markets and policy on incentives for rice production in Rwanda. In FAO Agricultural Development Economics Working Paper 18-02; FAO: Rome, Italy, 2018. [Google Scholar]
  8. RDB. Invest in Rice Production and Processing to Take Advantage of Rwanda’s Excellent Growing Conditions and Serve a Growing and Under-Served Middle Class in the EAC; Rwanda Development Board: Kigali, Rwanda, 2012. [Google Scholar]
  9. Perumal, T.; Sulaiman, M.N.; Leong, C.Y. Internet of Things (IoT) Enabled Water Monitoring System. In Proceedings of the 2015 IEEE 4th Global Conference on Consumer Electronics, Osaka, Japan, 27–30 October 2015. [Google Scholar] [CrossRef]
  10. Sivaiah, N.; Sowmya, K.P.S.; Susmitha, K.; Sai, N.A.; Suma, N. Internet of Things (IoT) Enabled Water Monitoring System. Iconic Res. Eng. J. 2018, 1, 40–43. [Google Scholar]
  11. Mohd Annuar, K.A.; Hadi, N.A.A.; Saadon, I.M.; Harun, M.H. Design and Construction of Liquid Level Measurement System. J. Adv. Res. Appl. Mech. 2015, 12, 8–15. [Google Scholar]
  12. Saraswati, M.; Kuantama, E.; Mardjoko, P. Design and Construction of Water Level Measurement System Accessible through SMS. In Proceedings of the Sixth UKSim/AMSS European Symposium on Computer Modeling and Simulation, Valetta, Malta, 14–16 November 2012. [Google Scholar] [CrossRef]
  13. Stacheder, M.; Koeniger, F.; Schuhmann, R. New Dielectric Sensors and Sensing Techniques for Soil and Snow Moisture Measurements. Sensors 2009, 9, 2951–2967. [Google Scholar] [CrossRef] [Green Version]
  14. Gondchawar, N.; Kawitkar, R.S. IoT Based Smart Agriculture. Int. J. Adv. Res. Comput. Commun. Eng. 2016, 5, 838–842. [Google Scholar]
  15. Fernandez-Ahumada, L.M.; Ramirez-Faz, J.; Torres-Romero, M.; Lopez-Luque, R. Proposal for the Design of Monitoring and Operating Irrigation Networks Based on IoT, Cloud Computing and Free Hardware Technologies. Sensors 2019, 19, 2318. [Google Scholar]
  16. Villarrubia, G.; Paz, J.F.D.; Iglesia, D.H.D.L.; Bajo, J. Combining Multi-Agent Systems and Wireless Sensor Networks for Monitoring Crop Irrigation. Sensors 2017, 17, 1775. [Google Scholar]
  17. Monaco, F.; Sali, G.; Hassen, M.B.; Facchi, A.; Romani, M.; Vale, G. Water Management Options for Rice Cultivation in a Temperate Area: A Multi-Objective Model to Explore Economic and Water Saving Results. Water 2016, 8, 336. [Google Scholar]
  18. Ahmed, N.; De, D.; Hussain, I. Internet of Things (IoT) for Smart Precision Agriculture and Farming in Rural Areas. IEEE Internet Things J. 2018, 5, 4890–4899. [Google Scholar] [CrossRef]
  19. Xiao, K.; Xiao, D.; Luo, X. Smart water-saving irrigation system in precision agriculture based on wireless sensor network. Trans. Chin. Soc. Agric. Eng. 2010, 26, 170–175. [Google Scholar]
  20. Dholu, M.; Ghodinde, K.A. Internet of Things (IoT) for Precision Agriculture Application. In Proceedings of the 2018 2nd International Conference on Trends in Electronics and Informatics (ICOEI), Tirunelveli, India, 11–12 May 2018; pp. 339–342. [Google Scholar] [CrossRef]
  21. Cambra Baseca, C.; Sendra, S.; Lloret, J.; Tomas, J. A Smart Decision System for Digital Farming. Agronomy 2019, 9, 216. [Google Scholar] [CrossRef] [Green Version]
  22. Řezník, T.; Charvát, K.; Lukas, V.; Charvát, K., Jr.; Horáková, Š. Open data model approach for precision agriculture: Integration of geographic information from LPIS to farmer’s data. Adv. Comput. Sci. Res. 2017. [Google Scholar] [CrossRef] [Green Version]
  23. Matis, J.H.; Saito, T.; Grant, W.E. A Markov Chain Approach to Crop Yield Forecasting. Agric. Syst. 1985, 18, 171–187. [Google Scholar]
  24. Sutton, R.S.; Barto, A.G. Reinforcement Learning. In An Introduction, 1st ed.; The MIT Press: Cambridge, MA, USA, 1998. [Google Scholar]
  25. Bednorz, W. Greedy Algorithms. IntechOpen 2008. [Google Scholar] [CrossRef]
  26. Alvarez-Herrera, J.G.; Pinzon-Gomez, L.P.; Velez, J.E. Growth and production of rice (Oryza Sativa L.) under different fertilization plans with silicon. Ing. Investig. 2017, 37, 7–15. [Google Scholar] [CrossRef]
  27. FAO. Determination of the Irrigation Schedule for Paddy Rice. 2015. Available online: http://www.fao.org/3/t7202e/t7202e07.htm (accessed on 10 June 2020).
  28. Allen, R.G.; Pereira, L.S.; Raes, D.; Smith, M. Crop Evapotranspiration-Guidelines for Computing Crop Water Requirements; FAO Irrigation and Drainage Paper 56; FAO: Rome, Italy, 1998. [Google Scholar]
  29. Niyonkuru, R.; Sankaranarayanan, R.; Pande, S.K.; Das, D. Application of FAO-CROPWAT software for modeling irrigation schedule of rice in Rwanda. Rwanda J. Agric. Sci. 2019, 1, 1. [Google Scholar]
Figure 1. Rice fields and irrigation canals at Muvumba Valley Rice Plantation in Nyagatare, Rwanda.
Agriculture 10 00431 g001
Figure 2. Flowchart of the irrigation optimization system. The white components are the actions of the fully functioning automatic system using a Markov chain process and the gray components are the path when the system operation has a failure and the SARSA approach is followed.
Agriculture 10 00431 g002
Figure 3. Evaporation and rainfall data from a Meteo Rwanda weather station in Nyagatare, Rwanda during Season B, September 2018 to January 2019.
Agriculture 10 00431 g003
Figure 4. System architecture that shows the complete irrigation system.
Agriculture 10 00431 g004
Figure 5. Results for Matlab simulation of four seasons using the Markov chain process (MCP).
Agriculture 10 00431 g005
Figure 6. Calculated needed water output by the system for Season B 2018 using the Markov chain process and SARSA. The simulated fault when the model switched to SARSA is Days 110 to 116. The irrigation action taken each day is indicated with values of irrigate (1), not irrigate (0), and extract water (−1).
Agriculture 10 00431 g006
Table 1. Rice growth stages and typical water requirements for depth and total soil water.
Stage Number12345
Stage NameSeedlingTilleringPanicle growthFloweringRipening
Length of the stage in days2542253021
The depth of the threshold (mm)1002020100100
Cumulative total soil water (mm)50–60200–250400–550400–450100–150

