Article

Neural Visual Detection of Grain Weevil (Sitophilus granarius L.)

1
Institute of Biosystems Engineering, Poznan University of Life Sciences, Wojska Polskiego 50, 60-625 Poznan, Poland
2
Faculty of Production Engineering, Lublin University of Life Sciences, 20-950 Lublin, Poland
*
Author to whom correspondence should be addressed.
Agriculture 2020, 10(1), 25; https://doi.org/10.3390/agriculture10010025
Submission received: 23 November 2019 / Revised: 4 January 2020 / Accepted: 14 January 2020 / Published: 20 January 2020
(This article belongs to the Special Issue Artificial Neural Networks in Agriculture)

Abstract

:
A significant part of cereal production is intended for agri-food processing, which implies a necessity to search for and implement modern storage systems for this product. Stored grain is exposed to many unfavorable factors, particularly caryopsis macro-damage caused mainly by grain weevil (Sitophilus granarius L.). This triggers a substantial decrease in the value of the stored material, thus resulting in serious economic losses. Due to this fact, it is necessary to take steps to effectively detect this pest’s presence when grain is delivered to storage facilities. The purpose of this work was to identify the representative physical characteristics of wheat caryopsis affected by grain weevil. An automated visual system was developed to ease the detection of damaged kernels and adult weevils. In order to obtain the empirical data, a decision was made to take advance of SKCS 4100 (the Perten Single Kernel Characterization System). The measurements obtained were used to build the training sets necessary in the process of ANN (artificial neural network) learning with digital neural classifiers. Next, a set of identifying neural models was created and verified, and then the optimal topology was selected. The utilitarian goal of the research was to support the decision-making process taking place during grain storage.

1. Introduction

Cereal grain storage is mainly conditioned by ambient temperature and humidity, which constitute crucial parameters affecting the quality of stored grain. The presence of living organisms that cause direct losses resulting from their infestation is also important. There are also notable indirect losses in the stored material resulting from contamination with excretions and secretions, as well as from moistening and heating. Stored grain may be infested by many different organisms, such as bacteria, fungi, mites, and insects. One of the most damaging grain pest species in Europe is the grain weevil (Sitophilus granarius L.) [1]. It can cause up to 5% of losses in stored crops. This pest is often a cleverly hidden grain destroyer. Although its beetles can be easily detected during sieving, unfortunately, the identification of eggs, larvae, and pupae is difficult and requires appropriate laboratory tests. Weevil feeding on grains significantly reduces the germination capacity of grain from 93% to 7%. Its presence and development cause an increase in humidity and temperature of the stored mass. These conditions foster the development of fungi, as a result of which grain mold appears, which in turn causes a drastic decrease in grain quality and consequently its value.
An important task for managers of any grain storage facility is to prevent the establishment and development of grain weevil in stored crops. The identification and recognition of pests should therefore take place before the grain is taken to silos. This procedure must be quick, efficient, and precise, which implies a necessity to automate this identification process [2,3,4,5,6].
An effective identification of the effects of grain weevil feeding on stored grain entailed the designing, manufacturing, and verification of the new, original classification model [7,8,9,10,11]. The commonly recognized separation properties, such as those represented by artificial neural networks, imply the legitimacy of using them in the process of identifying grain damage caused by grain weevil [12]. It ought to be emphasized that the source literature provides no examples of any effective use of neural modeling in the process of identifying internal macro-damage to wheat caryopsis caused by pests feeding on them. Moreover, there is no scientific knowledge concerning the determination of the type and level of significance of the representative properties of the infected wheat grain, which would enable the identification of the negative effects of this pest [13,14,15].

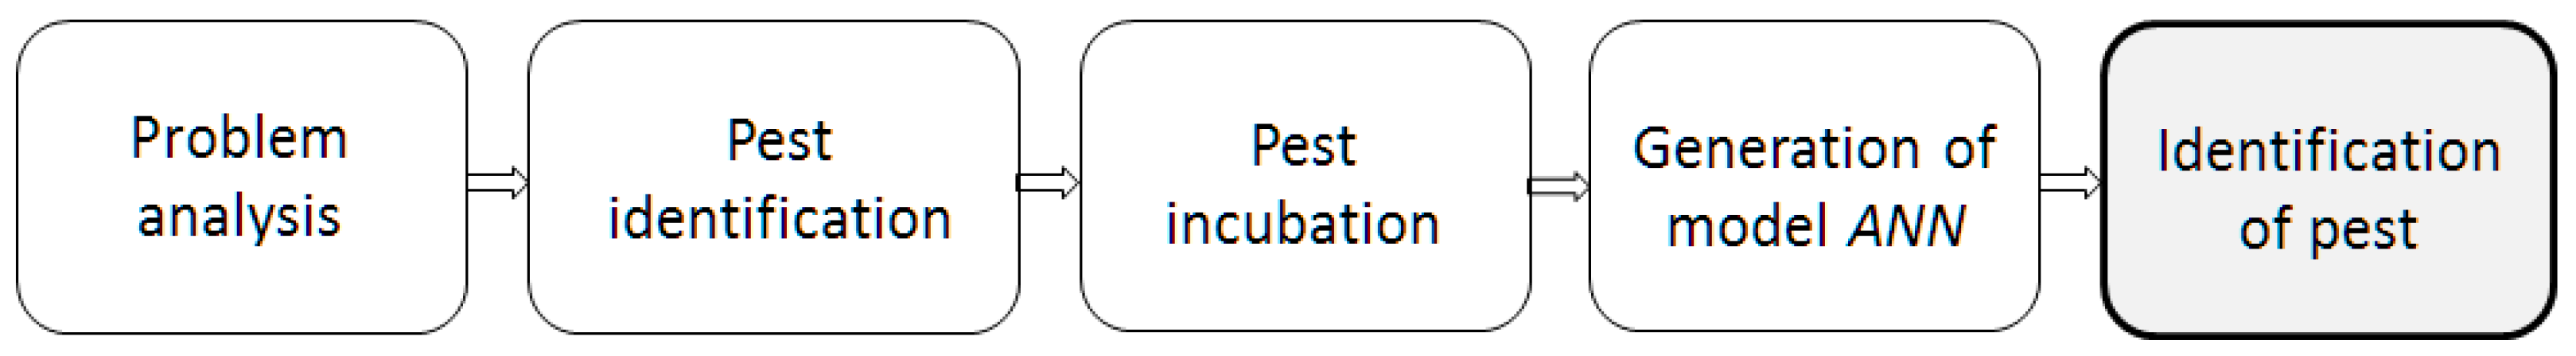
2. Materials and Methods

2.1. Materials

Grain weevil (Sitophilus granarius L.) (Figure 1) is a winged cosmopolitan beetle from the Curculionidae family. Although it belongs to the subclass of the winged insects, it is deprived of volatile wings. It belongs to the group of the most damaging storage pests. Depending on the age of the individual, the grain weevil’s color ranges from light-brown to black.
Young individuals are light-brown, whereas adults are dark. The body length of grain weevils ranges from 2 to 5 mm. Most often grain weevils hide in small cracks and avoid sunlight. Grain weevils are characterized by their high resistance to hunger. At a temperature of about 12 °C, a grain weevil can survive 115 days without food. A female grain weevil makes a hole in grain and deposits her egg inside, and then covers it with an adhesive/a viscous substance mixed with starch coming from grain. The sealed hole made by the pest is not visible with the naked eye. Grain weevils are characterized by their high fertility. During one day, a female can lay from one to nine eggs, and during its life, can lay about 150 eggs. Usually a typical female lays one egg in one grain, thus providing the right amount of food for its offspring. A grain weevil egg has an oval shape, with a pointed edge, with a size of 0.65–0.30 mm. The intensity of grain weevil procreation depends on the following factors:
  • the air temperature,
  • the air humidity,
  • the amount of available food.
Becoming a member state of the European Union, Poland was obliged to adopt the mandatory standards related to food products as well as the requirements set out by institutions accepting and purchasing cereals. These standards also define the methods of assessing the quality of the material provided. All these standards can be found in the Commission Regulation No. 687/2008 [RK (EC) 687/2008], and they clearly state that the goods delivered to storage facilities should be free of any storage pests. In the regulation (Official Journal No. 29 item 189) issued in 2007, there is a statement that the presence of a storage pest disqualifies a given product as being seed that is sellable to markets. It is due to the fact (among others) that one of the criteria for assessing the seed quality is the minimum germination capacity, which is 85% for wheat. In case of grain weevil infestation, this capacity decreases to as low as 7%.
The research conducted in this study involved four varieties of spring wheat showing signs of damage caused by grain weevil (Sitophilus granarius L.), namely the following varieties: Torka, Narwa, Banti, and Symfonia. The empirical material was obtained from two selected plant breeding stations: (Plant Breeding Strzelce Ltd. 99-307 Strzelce, Poland) and (Agricultural Plant Breeding–Kobierzyce Seeds Ltd. 55-040 Kobierzyce, Poland) The samples were selected randomly. The characteristics of the above varieties were prepared on the basis of the data published on the producer’s website (www.hr-strzelce.pl):
Torka—This kind of wheat belongs to the elite group of wheat that possesses very good flour baking value. It is characterized by a large 1000 grain mass (45–52 g), good resistance to lodging, average protein content, good to very good flour yield, very good wholesomeness, and average to good prolificacy.
Narwa—This variety is characterized by very good baking value, very high protein and gluten content, 1000 grain mass over 50 g, good shattering and fouling resistance, good wholesomeness, and early maturation.
Banti—This variety is characterized by high protein content, good baking value, tendency to ear-sprouting, and average 1000 grain mass.
Symfonia—This variety has a 1000 grain mass of approx. 45 g, as well as high fouling and shatter resistance (8 in the 9-point scale). Additionally, it is resistant to powdery mildew, blight, leaf and chaff septaria, and stem base diseases. It is recommended for cultivation all over the country and in the areas where it is necessary to grow varieties with very good winter hardiness (6.5 in the 9-point scale).
The empirical studies were conducted in the specialist laboratory of the Department of Entomology of the Plant Protection Institute—the National Research Institute in Poznan (IOR–PIB Poznan). For the experiments, an appropriate number of beetles were prepared via special breeding. Then, using a stereoscopic microscope, the males were separated from the females on the basis of the morphological differences in the structure of the snout and abdomen. The study used 50 polypropylene containers (height 65 mm, diameter 38 mm, capacity 60 mL), which had a suitable construction enabling air inlet but prevented the tested pests from getting out of the container. Four hundred randomly selected caryopses were put into each container, and then 20 pairs of grain weevil beetles were placed inside (20 males and 20 females). The period of time when the beetles were kept in particular containers was 5, 10, 15, and 20 days. During that time, all the grain weevil individuals were feeding, copulating, and laying eggs, which in turn developed into larvae. The containers were placed in an incubator in order to make it possible to take measurements and obtain empirical data at the same time. After the incubation period of the grain weevils feeding on the caryopses, the samples were cleared of the beetles and other pollutants. Four hundred caryopses were randomly selected from each sample and placed in a SKCS 4100 (Single-Kernel Characterization System) Perten Instruments, Sweden appliance. The scheme of obtaining empirical data is presented in Figure 2:
The experimental data were saved on the hard drive of the SKCS 4100 appliance, and then collected and organized/segregated into Microsoft Corporation Excel spreadsheets (in the form of .csv files). The empirical data obtained was converted to the training set relevant to the ANN (artificial neural network) simulator implemented in the commercial package from Statistica v. 10- StatSoft Polska. The generated training set, essential in the neural modeling process, was then used to generate the ANN file.

2.2. Method

In order to create the optimal neural model, the following scheme of procedure was put in place (Figure 3).
In order to create the classification neural models, a neural network simulator implemented in Statistica v. 10 package was used [1,18,19,20]. The most important stage of the ANN generation was the preparation of the training files containing encoded selected representative properties, constituting the empirical basis for the classification [20,21,22,23]. For this purpose, four numerical input variables and one nominal output variable were determined, which resulted from the nature of the formulated scientific problem and represented the characteristic parameters of the process examined. As the input variables, the following four descriptors were adopted and used, which constituted the basic physical characteristics of the stored caryopses:
mass (mg),
equivalent diameter (mm),
humidity (%),
hardness (according to the selected hardness scale).
The values of all the aforementioned physical properties were obtained from 400 caryopses randomly selected from each sample. The tests were repeated in the following time intervals: 0 day (control—a combination without pests), and 5, 10, 15, and 20 days from the moment the pest came into contact with the grain. The data collected and classified in this way was converted to a form of training set, which was necessary to generate the ANN. The set of the neural models was created in the Statistica v. 10 program with a simulator implemented in the “Neural Networks” module [20,24,25,26,27].
The output variable was encoded in the form of a dichotomous binary nominal variable. The training set consisted of 1800 randomly selected data, and it was divided proportionally 2:1:1 into training, validation, and test sets. These tests included, respectively, 900, 450, and 450 training files. According to the procedure adopted, the test set was not used in the network training process, therefore it was important in the final assessment of the optimal neural model. The structure of the training file is presented in Table 1.

3. Results and Discussion

A set of 100 different neural topologies was generated. The selection of the neural network typology at the initial phase was conducted with an automatic designer, which did the experiments on its own with different network architectures with the use of different learning processes for a given network. Next, two different types of neural networks were tested for each kind of dataset. It was the parameters of the given neural network, such as correlation, coefficient of total determination, and quotient of standard deviations, that determined the selection of the best neural network. Following the selection of the given network, the process of learning the network was implemented. During this process, based on the selected algorithm, special attention was put on its ability of approximation and generalization, based on quality measurements with the lowest root mean square (RMS) error. Also, during this same process of learning/training, an error curve of both the training set and the valuation set was observed. In the event that there was an increase in those errors, the training/learning process was stopped and all the necessary modifications of the network architecture were made by adding or removing neurons or hidden layers. A change of learning algorithms was also applied. Those actions are aimed at eliminating the phenomenon of network “overlearning”. Otherwise, the network will not come up to the expected results. RBF (radial basis function) topology with structure 4:10:1 turned out to be the best ANN topology generated. Nowadays, RBF networks belong to the category of basic types of neural networks. These types of networks are most commonly applied in the non-linear approximation of numerical variables. Additionally, they are applied in cases concerning classification (Bishop [1], Nabney [4]), where they reconstruct the density function of the distribution of informing variables. The redial neuron is defined by its core and the parameter called “radius”. The point in n-dimensional space is defined with N numbers, which precisely corresponds to the number of weighs in the linear neuron; on this account, the core of the radial neuron is stored in the set of parameters determined in the software Statistica, also as “weighs” (though when determining common “weigh” activation, only the distance between the weigh vector and the input signal vector is determined). Radius (or, in other words, deviation) is stored in the neuron as the so-called threshold [28]. The input layer was composed of four neurons with a PSP (postsynaptic function), a linear function, and a linear activation function. The hidden layer was composed of four radial neurons with a radial PSP function and an exponential activation function. The network output consisted of one neuron with a linear PSP function and a linear (saturated) activation function, representing a two-state nominal variable [29,30]. The generated neural model was trained using optimization algorithms implemented in Statistica v. 10 package. The centers were determined with the k-means method, whereas the deviations were determined with the k-nearest neighbors method. The output layer was optimized with the pseudo-inverse technique. The structure of the generated RBF network is presented in Figure 4. Where:
  • A—input layer: PSP function: linear, activation function: linear saturated function;
  • B—hidden layer: PSP function: radial activation function–Gauss function;
  • C—output layer: PSP function: linear saturated function, activation function: linear saturated function;
  • PSP—postsynaptic potential.
The basic properties of RBF networks are as follows:
RBFs are one-direction networks;
RBFs are trained with a “no teacher” technique;
they have a three-layer architecture: there is an input, hidden (radial) layer, and output layer,
the declared connections in the network allow only communication between the neurons from the neighboring layers;
the input neuron activation functions are of linear nature, the hidden neuron functions are of nonlinear (radial) nature, and the output neurons are fully linear.
RBF networks are characterized by one hidden layer, a short training process, and a small size (Figure 4).
A hidden neuron in these networks performs a function that is changing radially around the selected center and the assuming non-zero values only in the vicinity of this center. The mathematical basis for RBF network functioning is T. Cover’s theorem on separability of patterns, which posits that a complex classification problem cast non-linearly into the high-dimensional space is more likely to be linearly separable than in the projection into a low-dimensional space.
A standard measure of the quality of the generated neural model is the RMS (root mean square) error, which is defined in the following way [28,31,32]:
RMSE = i = 1 n ( y i z i ) 2 n   ,  
where
n—number of cases;
yi—real values;
zi—values set with network.
The RMS error values for the generated neural model were as follows:
0.2322 for the training file;
0.2462 for the validation file;
0.2502 for the test file.
The estimation of the level of significance of the ANN input parameters is usually identified by means of the procedure of the analyzing the neural model’s sensitivity to the input variables. This procedure is used to assess to what extent a selected input signal affects the identification process of the input variable. In this way, the information on the rank of the input signal is obtained in the form of error increase quotient [33,34]. If the error increase quotient is below 1, it means that a given property has no influence on the grain weevil identification process. In the described case, all input signals had an error quotient above one. Therefore, it can be concluded that each of the properties did take part in the identification process of the output signal of the optimal ANN, albeit, each of them with a different rank. Humidity was in the first place in the ranking of the input signals of the neural model, obtaining the highest level of the error increase quotient. Such a high rank may prove that the occurrence of pests causes observable changes in the level of water that a caryopsis contains. The following ranks (from highest to lowest) are, respectively, mass, equivalent diameter, and hardness (Table 2).

4. Conclusions

The generated RBF-type ANN topology of the 4:10:1 structure was verified in terms of the quality of the identification process and the possibility of its application to solve the problem of identifying grain weevil in stored wheat grain. By applying RBF (instead of Multi-Layer Perceptron MLP), it was observed that the neural network finds approximation that is better suited to the local features of the dataset but with worse extrapolation. Neural networks with radial base functions were applied to deal with classification issues, approximation of functions with numerous variables, and in issues concerning predictions. In those areas of application where sigmoid functions have an established position, the implementation of the generated ANN model will enable automation of the process involving recognition of grain weevil occurrence, which will allow to undertake appropriate measures to protect the stored grain from further losses caused by this pest.
The conclusions resulting from the analysis conducted are as follows:
  • The results of the study demonstrated that artificial neural networks can be used as effective tools supporting the process of identifying pests feeding on stored wheat grain.
  • The generated RBF-type neural model with the structure 4:10:1 proved to be optimal in the process of solving problems of grain weevil identification, based on four selected physical properties of the caryopses.
  • The analysis of the sensitivity of the generated neural model to the input variables demonstrated the existence of various ranks for individual representative signals. The fact that humidity ranked the highest indicates a high degree of significance of this variable. The subsequent parameters are mass, equivalent diameter, and hardness (in this order).
  • The results of the study indicate the possibility of supporting the decision-making processes taking place during agricultural products storage. In particular, the generated RBF-type (4:10:1) neural model may constitute the kernel of the IT system supporting the process of identification of the degree the stored grain is infected by grain weevil.

Author Contributions

Conceptualization: K.Ś. and P.B.; methodology: P.B. and K.K.; software: K.Ś.; validation: M.Z.; formal analysis: M.Z. and P.B.; investigation: J.P.; resources: J.P.; data curation: K.K.; writing—original draft preparation: K.K. and K.Ś.; writing—review and editing: K.K. and J.S.; visualization: K.K.; supervision: P.B.; project administration: J.S. All authors have read and agreed to the published version of the manuscript.

Funding

The authors are grateful for financial support provided by the Poznań University of Life Sciences, Poland, within the framework of fund no. 506.752.03.00.

Acknowledgments

The authors are grateful for the financial support provided by the Poznań University of Life Sciences, Poland, within the framework of fund no. 508.752.00.0.

Conflicts of Interest

The authors declare no conflict of interest.

References

  1. Boniecki, P.; Piekarska-Boniecka, H.; Świerczyński, K.; Koszela, K.; Zaborowicz, M.; Przybył, J. Detection of the granary weevil based on X-ray images of damaged wheat kernels. J. Stored Prod. Res. 2014, 56, 38–42. [Google Scholar] [CrossRef]
  2. Sun, J.; He, X.; Ge, X.; Wu, X.; Shen, J.; Song, Y. Detection of key organs in tomato based on deep migration learning in a complex background. Agriculture 2018, 8, 196. [Google Scholar] [CrossRef] [Green Version]
  3. Kang, S.H.; Cho, J.H.; Lee, S.H. Identification of butterfly based on their shapes when viewed from different angles using an artificial neural network. J. Asia Pac. Entomol. 2014, 17, 143–149. [Google Scholar] [CrossRef]
  4. Kodogiannis, V.S.; Kontogianni, E.; Lygouras, J.N. Neural network based identification of meat spoilage using Fourier-transform infrared spectra. J. Food Eng. 2014, 142, 118–131. [Google Scholar] [CrossRef]
  5. Zhang, Y.; Wang, S.; Ji, G.; Phillips, P. Fruit classification using computer vision and feedforward neural network. J. Food Eng. 2014, 143, 167–177. [Google Scholar] [CrossRef]
  6. Zaborowicz, M.; Boniecki, P.; Koszela, K.; Przybylak, A.; Przybył, J. Application of neural image analysis in evaluating the quality of greenhouse tomatoes. Sci. Hortic. 2017, 218, 222–229. [Google Scholar] [CrossRef]
  7. Kashaninejad, M.; Dehghani, A.A.; Kashiri, M. Modeling of wheat soaking using two artificial neural networks (MLP and RBF). J. Food Eng. 2009, 91, 602–607. [Google Scholar] [CrossRef]
  8. Przybylak, A.; Ślósarz, P.; Boniecki, P.; Koszela, K.; Zaborowicz, M.; Przybył, K.; Wojcieszak, D.; Szulc, R.; Ludwiczak, A.; Górna, K. Marbling classification of lambs carcasses with the artificial neural image analysis. In Proceedings of the Seventh International Conference on Digital Image Processing (ICDIP 2015), Los Angeles, CA, USA, 6 July 2015. [Google Scholar]
  9. Boniecki, P.; Przybył, J.; Zaborowicz, M.; Górna, K.; Dach, J.; Okoń, P.; Przybył, K.; Mioduszewska, N.; Idziaszek, P. SOFM-type artificial neural network for the non-parametric quality-based classification of potatoes. In Proceedings of the SPIE—The International Society for Optical Engineering, Chengu, China, 29 August 2016; Volume 10033. [Google Scholar]
  10. Przybył, K.; Zaborowicz, M.; Koszela, K.; Boniecki, P.; Mueller, W.; Raba, B.; Lewicki, A. Organoleptic damage classification of potatoes with the use of image analysis in production process. In Proceedings of the SPIE—The International Society for Optical Engineering, Athens, Greece, 16 April 2014; Volume 9159. [Google Scholar]
  11. Boniecki, P.; Koszela, K.; Piekarska-Boniecka, H.; Weres, J.; Zaborowicz, M.; Kujawa, S.; Majewski, A.; Raba, B. Neural identification of selected apple pests. Comput. Electron. Agric. 2015, 110, 9–16. [Google Scholar] [CrossRef]
  12. Piekarska-Boniecka, H.; Kadłubowski, W.; Siatkowski, I. A study of bionomy of the privet sawfly (Macrophya punctumalbum (L.)) (Hymenoptera, Tenthredinidae)—A pest of park plants. Acta Sci. Pol. Hortorum Cult. 2008, 7, 3–11. [Google Scholar]
  13. Riverol, C.; Cooney, J. Estimation of the ester formation during beer fermentation using neural networks. J. Food Eng. 2007, 82, 585–588. [Google Scholar] [CrossRef]
  14. Cheng, H.D.; Jiang, X.H.; Sun, Y.; Wang, J. Color image segmentation: Advances and prospects. Pattern Recognit. 2001, 34, 2259–2281. [Google Scholar] [CrossRef]
  15. Niewiada, A.; Nawrot, J.; Szafranek, J.; Szafranek, B.; Synak, E.; Jeleń, H.; Wąsowicz, E. Some factors affecting egg-laying of the granary weevil (Sitophilus granarius L.). J. Stored Prod. Res. 2005, 41, 544–555. [Google Scholar] [CrossRef]
  16. Olejarski, P.; Horoszkiewicz-Janka, J.; Bocianowski, J. Influence of fungi on feeding and development of granary weevil (Sitophilus granarius L.)/Wpyw grzybów zasiedlajacych ziarno zbóz na zerowanie i rozwój woka zbozowego (Sitophilus granarius L.). Prog. Plant Prot. 2010, 50, 1711–1718. [Google Scholar]
  17. Olejarski, P. Detection of pests in grain stores. Ochr. Rosl. 2005, 50, 12–14. [Google Scholar]
  18. Liu, D.; Ning, X.; Li, Z.; Yang, D.; Li, H.; Gao, L. Discriminating and elimination of damaged soybean seeds based on image characteristics. J. Stored Prod. Res. 2015, 60, 67–74. [Google Scholar] [CrossRef]
  19. Mahesh, S.; Jayas, D.S.; Paliwal, J.; White, N.D.G. Hyperspectral imaging to classify and monitor quality of agricultural materials. J. Stored Prod. Res. 2015, 61, 17–26. [Google Scholar] [CrossRef]
  20. Koszela, K.; Raba, B.; Zaborowicz, M.; Przybył, K.; Wojcieszak, D.; Czekała, W.; Ludwiczak, A.; Przybylak, A.; Boniecki, P.; Przybył, J. Computer image analysis in caryopses quality evaluation as exemplified by malting barley. In Proceedings of the SPIE—The International Society for Optical Engineering, Los Angeles, CA, USA, 6 July 2015; Volume 9631. [Google Scholar]
  21. Przybył, K.; Górna, K.; Wojcieszak, D.; Czekała, W.; Ludwiczak, A.; Przybylak, A.; Boniecki, P.; Koszela, K.; Zaborowicz, M.; Janczak, D.; et al. The recognition of potato varieties using of neural image analysis method. In Proceedings of the SPIE—The International Society for Optical Engineering, Los Angeles, CA, USA, 6 July 2015; Volume 9631. [Google Scholar]
  22. Muñoz, I.; Rubio-Celorio, M.; Garcia-Gil, N.; Guàrdia, M.D.; Fulladosa, E. Computer image analysis as a tool for classifying marbling: A case study in dry-cured ham. J. Food Eng. 2015, 166, 148–155. [Google Scholar] [CrossRef]
  23. Koszela, K.; Łukomski, M.; Mueller, W.; Górna, K.; Okoń, P.; Boniecki, P.; Zaborowicz, M.; Wojcieszak, D. Classification of dried vegetables using computer image analysis and artificial neural networks. In Proceedings of the SPIE—The International Society for Optical Engineering, Hong Kong, China, 21 July 2017; Volume 10420, p. 1042031. [Google Scholar]
  24. Zaborowicz, M.; Boniecki, P.; Koszela, K.; Przybył, J.; Mazur, R.; Kujawa, S.; Pilarski, K. Use of artificial neural networks in the identification and classification of tomatoes. In Proceedings of the SPIE—The International Society for Optical Engineering, Beijing, China, 19 July 2013; Volume 8878. [Google Scholar]
  25. Zaborowicz, M.; Boniecki, P.; Koszela, K.; Przybył, J.; Mazur, R.; Kujawa, S.; Pilarski, K. Computer Image Analysis in Obtaining Characteristics of Images Greenhouse Tomatoes in the Process of Generating Learning Sets of Artificial Neural Networks. In Proceedings of the 6TH International Conference on Digital Image Processing (ICDIP 2014), Athens, Greece, 16 April 2014; Volume 9159. [Google Scholar]
  26. Koszela, K.; Otrząsek, J.; Zaborowicz, M.; Boniecki, P.; Mueller, W.; Raba, B.; Lewicki, A.; Przybył, K. Quality assessment of microwave-vacuum dried material with the use of computer image analysis and neural model. In Proceedings of the SPIE—The International Society for Optical Engineering, Athens, Greece, 16 April 2014; Volume 9159, p. 915913. [Google Scholar]
  27. Raba, B.; Nowakowski, K.; Lewicki, A.; Przybył, K.; Zaborowicz, M.; Koszela, K.; Boniecki, P.; Mueller, W. The non-touching method of the malting barley quality evaluation. In Proceedings of the—The International Society for Optical Engineering, Athens, Greece, 16 April 2014; Volume 9159. [Google Scholar]
  28. Nabney, I.T. Efficient training of RBF networks for classification. Int. J. Neural Syst. 2004, 14, 201–208. [Google Scholar] [CrossRef]
  29. Przybył, K.; Gawałek, J.; Koszela, K.; Wawrzyniak, J.; Gierz, L. Artificial neural networks and electron microscopy to evaluate the quality of fruit and vegetable spray-dried powders. Case study: Strawberry powder. Comput. Electron. Agric. 2018, 155, 314–323. [Google Scholar] [CrossRef]
  30. Mueller, W.; Idziaszek, P.; Boniecki, P.; Zaborowicz, M.; Koszela, K.; Kujawa, S.; Kozłowski, R.J.; Przybył, K.; Niedbała, G. An IT system for the simultaneous management of vector and raster images. In Proceedings of the SPIE—The International Society for Optical Engineering, Chengu, China, 29 August 2016; Volume 10033. [Google Scholar]
  31. Czekała, W.; Dach, J.; Ludwiczak, A.; Przybylak, A.; Boniecki, P.; Koszela, K.; Zaborowicz, M.; Przybył, K.; Wojcieszak, D.; Witaszek, K. The use of image analysis to investigate C: N ratio in the mixture of chicken manure and straw. In Proceedings of the SPIE—The International Society for Optical Engineering, Los Angeles, CA, USA, 6 July 2015; Volume 9631. [Google Scholar]
  32. Jordan, M.I.; Bishop, C.M. Neural networks. In Computer Science Handbook, 2nd ed.; CRC Press: Basingstoke, Hampshire, UK, 2004. [Google Scholar]
  33. Schölkopf, B.; Sung, K.K.; Burges, C.J.; Girosi, F.; Niyogi, P.; Poggio, T.; Vapnik, V. Comparing support vector machines with gaussian kernels to radial basis function classifiers. IEEE Trans. Signal Process. 1997, 45, 2758–2765. [Google Scholar] [CrossRef] [Green Version]
  34. Schwenker, F.; Kestler, H.A.; Palm, G. Three learning phases for radial-basis-function networks. Neural Netw. 2001, 14, 439–458. [Google Scholar] [CrossRef]
Figure 1. Grain weevil (Sitophilus granarius L.) in the context of the grain storage process [16].
Agriculture 10 00025 g001
Figure 2. Scheme for obtaining empirical data [17].
Agriculture 10 00025 g002
Figure 3. Scheme of procedure. ANN: artificial neural network.
Agriculture 10 00025 g003
Figure 4. The structure of the generated ANN (Artificial Neural Network) type radial basis function (RBF).
Agriculture 10 00025 g004
Table 1. Part of a training file.
No.Mass (mg)Equivalent Diameter (mm)Humidity (%)HardnessGrain Weevil (Yes, No)
134.73.014.4118.6yes
234.63.112.869.9yes
334.72.914.381.3no
179934.52.814.360.1no
180034.52.715.386.6yes
Table 2. Sensitivity analysis of the model RBF 4:10:1.
Mass Equivalent Diameter Humidity Hardness
Ratio1.0751.0221.1181.002
Rank2314

