
Alteration of the Respiratory Microbiome in Hospitalized Patients with Asthma–COPD Overlap during and after an Exacerbation
 , , , , ,
Abstract
:1. Introduction
2. Materials and Methods
2.1. Study Design and Clinical Features
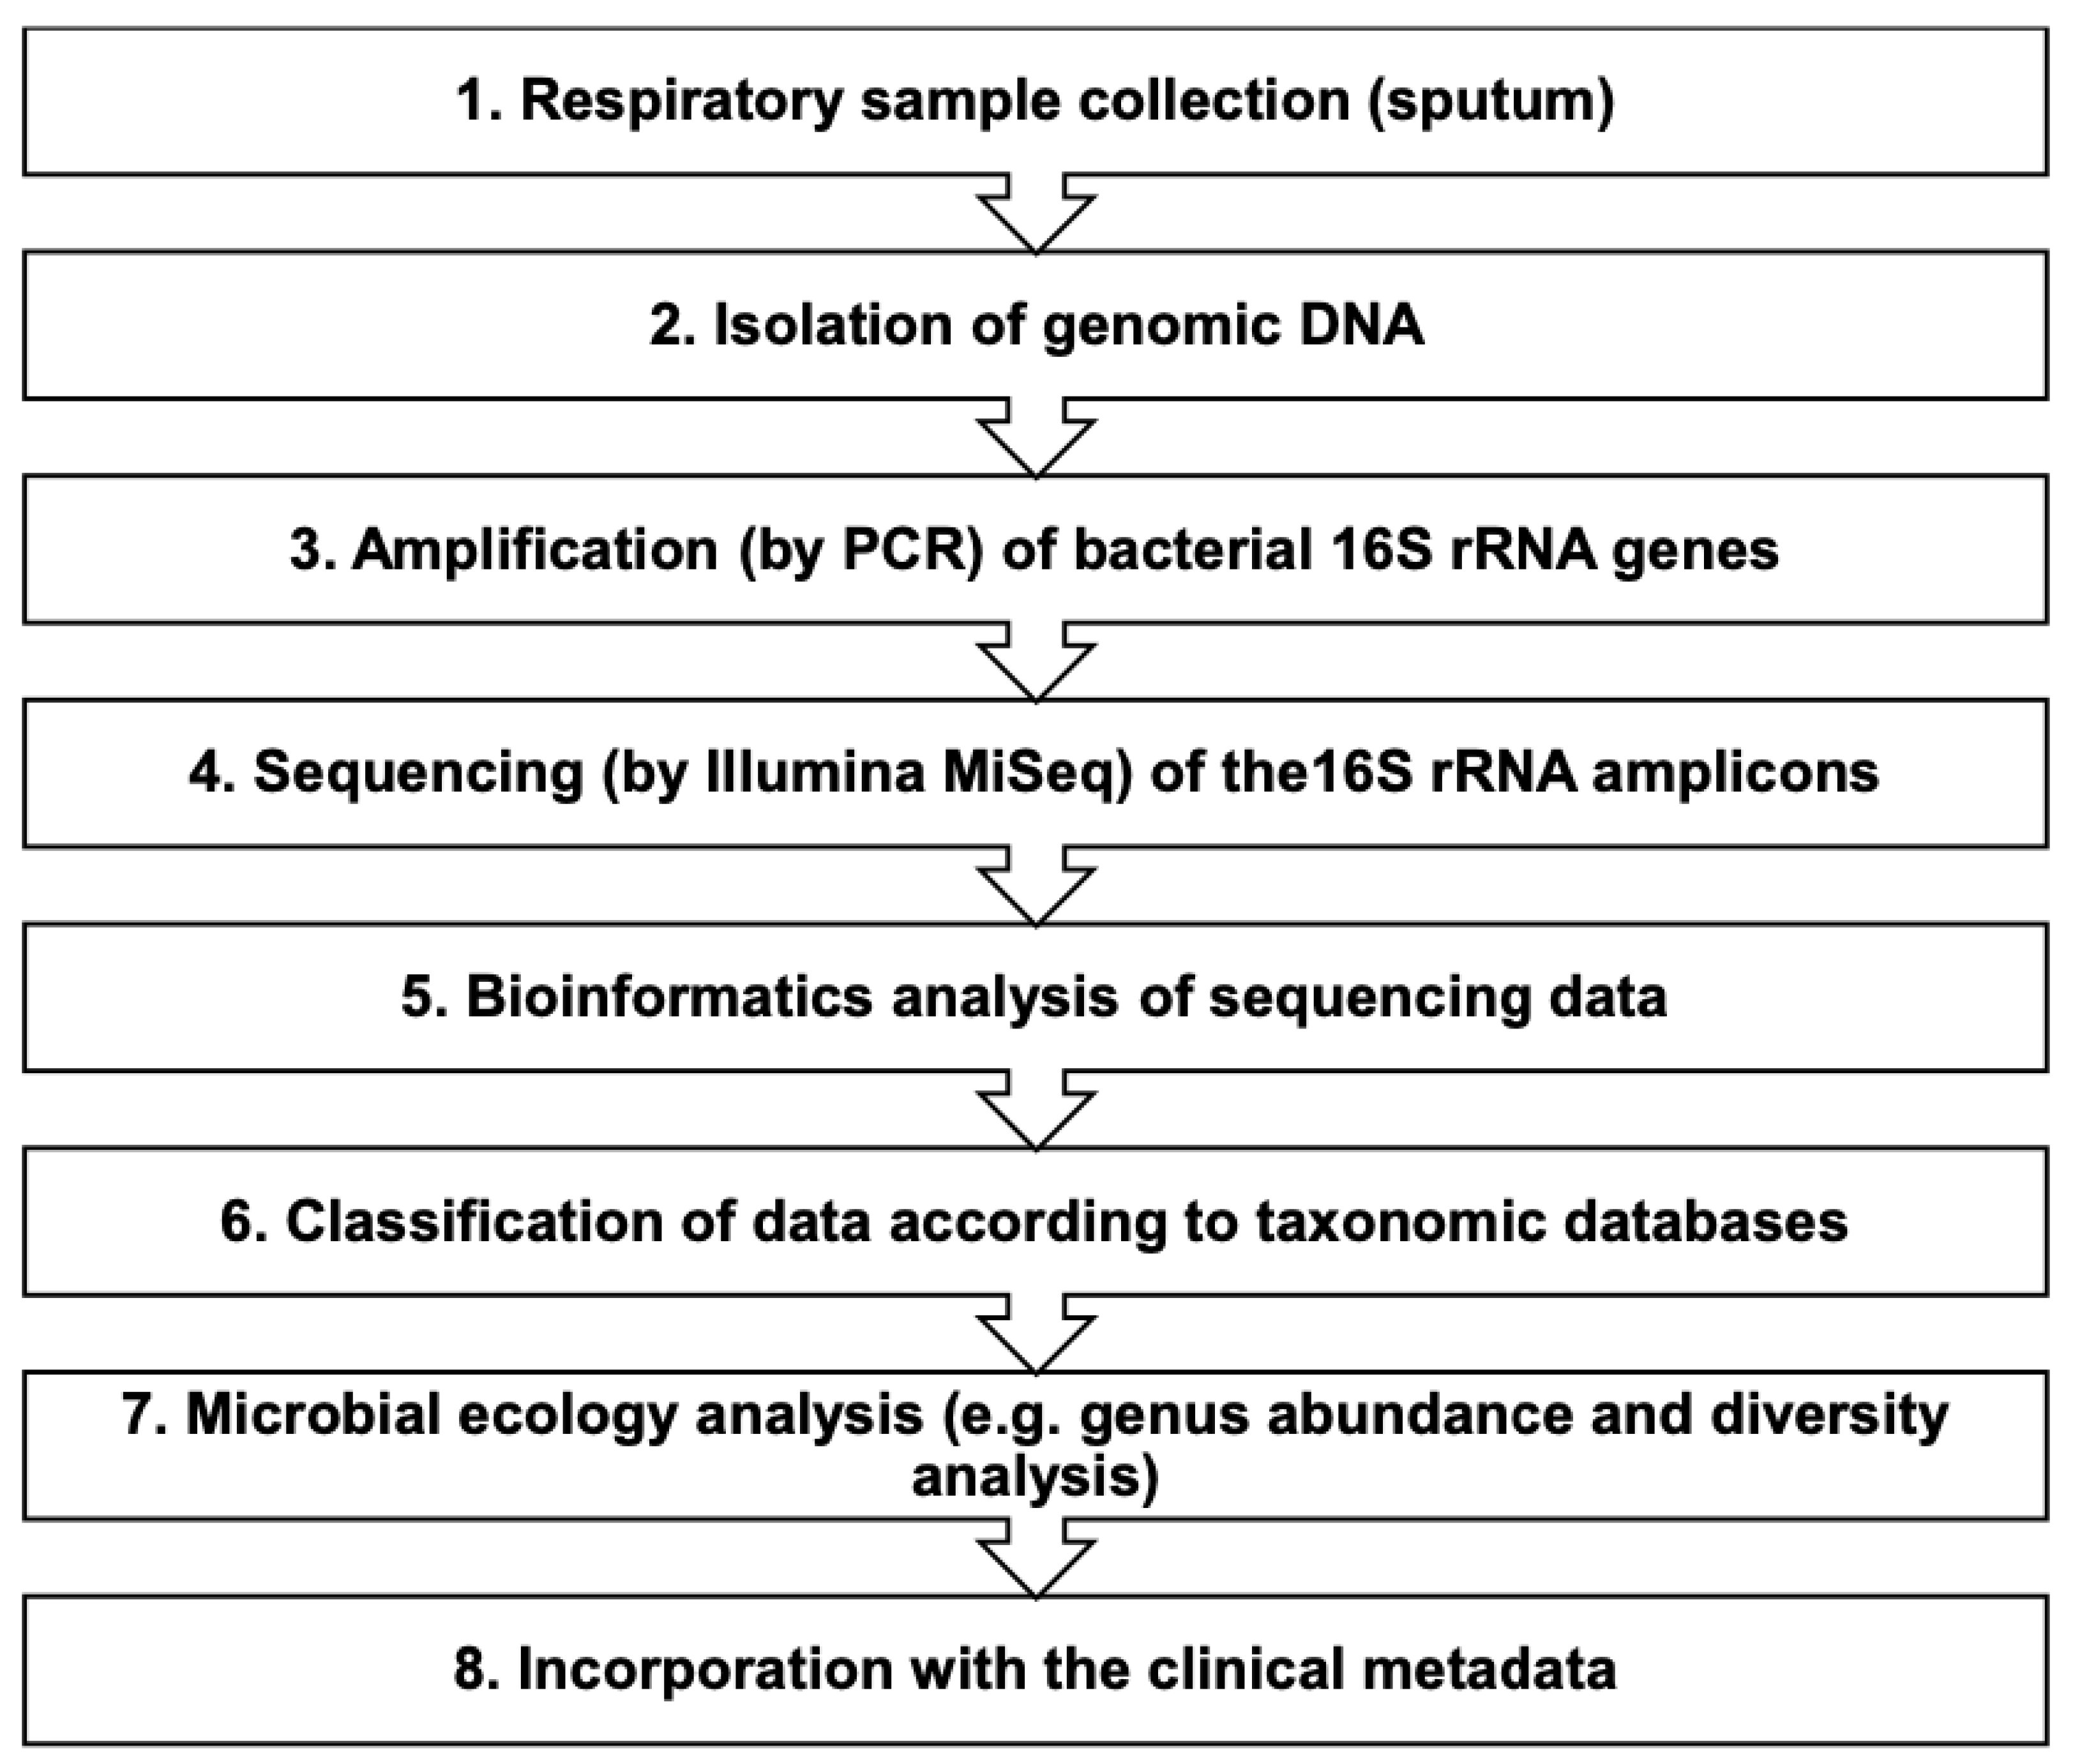
2.2. Sputum Samples and Isolation of Nucleic Acid
2.3. Library Preparation for the Illumina MiSeq
2.3.1. Pre-Amplification of the 16S rRNA Marker Gene Region (PCR 1)
2.3.2. Reverse-Tagging Step (PCR 2)
2.3.3. Forward-Tagging Step (PCR 3)
2.3.4. Nextera-Adapter/Indexing Amplification Step (PCR 4)
2.4. Sequencing on the Illumina MiSeq
2.5. Analysis of Illumina MiSeq Data and Molecular Detection
2.6. Statistical Analysis
3. Results
3.1. Participants and Sputum Samples
3.2. The Association between Clinical Status and the Respiratory Microbiome in ACO
4. Discussion
5. Conclusions
Supplementary Materials
Author Contributions
Funding
Institutional Review Board Statement
Informed Consent Statement
Data Availability Statement
Acknowledgments
Conflicts of Interest
References
- Woodruff, P.G.; van den Berge, M.; Boucher, R.C.; Brightling, C.; Burchard, E.G.; Christenson, S.A.; Han, M.K.; Holtzman, M.J.; Kraft, M.; Lynch, D.A.; et al. American Thoracic Society/National Heart, Lung, and Blood Institute Asthma-Chronic Obstructive Pulmonary Disease Overlap Workshop Report. Am. J. Respir. Crit. Care Med. 2017, 196, 375–381. [Google Scholar] [CrossRef] [PubMed] [Green Version]
- Reddel, H.K.; Bacharier, L.B.; Bateman, E.D.; Brightling, C.E.; Brusselle, G.G.; Buhl, R.; Cruz, A.A.; Duijts, L.; Drazen, J.M.; FitzGerald, J.M.; et al. Global Initiative for Asthma Strategy 2021: Executive summary and rationale for key changes. Eur. Respir. J. 2022, 59, 2102730. [Google Scholar] [CrossRef]
- Leung, J.M.; Sin, D.D. Asthma-COPD overlap syndrome: Pathogenesis, clinical features, and therapeutic targets. BMJ 2017, 358, j3772. [Google Scholar] [CrossRef] [PubMed]
- GOLD. Global Strategy for the Diagnosis, Management, and Prevention of Chronic Obstructive Pulmonary Disease. 2022. Available online: https://goldcopd.org/2022-gold-reports/ (accessed on 1 February 2022).
- Alshabanat, A.; Zafari, Z.; Albanyan, O.; Dairi, M.; FitzGerald, J.M. Asthma and COPD Overlap Syndrome (ACOS): A Systematic Review and Meta Analysis. PLoS ONE 2015, 10, e0136065. [Google Scholar] [CrossRef] [Green Version]
- Wedzicha, J.A.; Seemungal, T.A.R. COPD exacerbations: Defining their cause and prevention. Lancet 2007, 370, 786–796. [Google Scholar] [CrossRef] [PubMed]
- Donaldson, G.C.; Seemungal, T.A.; Bhowmik, A.; Wedzicha, J.A. Relationship between exacerbation frequency and lung function decline in chronic obstructive pulmonary disease. Thorax 2002, 57, 847–852. [Google Scholar] [CrossRef] [PubMed] [Green Version]
- Soler-Cataluna, J.J.; Martinez-Garcia, M.A.; Roman Sanchez, P.; Salcedo, E.; Navarro, M.; Ochando, R. Severe acute exacerbations and mortality in patients with chronic obstructive pulmonary disease. Thorax 2005, 60, 925–931. [Google Scholar] [CrossRef] [PubMed] [Green Version]
- Hilty, M.; Burke, C.; Pedro, H.; Cardenas, P.; Bush, A.; Bossley, C.; Davies, J.; Ervine, A.; Poulter, L.; Pachter, L.; et al. Disordered microbial communities in asthmatic airways. PLoS ONE 2010, 5, e8578. [Google Scholar] [CrossRef] [PubMed] [Green Version]
- Alsayed, A.R.; Abed, A.; Khader, H.A.; Al-Shdifat, L.M.H.; Hasoun, L.; Al-Rshaidat, M.M.D.; Alkhatib, M.; Zihlif, M. Molecular Accounting and Profiling of Human Respiratory Microbial Communities: Toward Precision Medicine by Targeting the Respiratory Microbiome for Disease Diagnosis and Treatment. Int. J. Mol. Sci. 2023, 24, 4086. [Google Scholar] [CrossRef]
- Sethi, S.; Maloney, J.; Grove, L.; Wrona, C.; Berenson, C.S. Airway inflammation and bronchial bacterial colonization in chronic obstructive pulmonary disease. Am. J. Respir. Crit. Care Med. 2006, 173, 991–998. [Google Scholar] [CrossRef]
- Sethi, S.; Murphy, T.F. Infection in the pathogenesis and course of chronic obstructive pulmonary disease. N. Engl. J. Med. 2008, 359, 2355–2365. [Google Scholar] [CrossRef] [PubMed]
- Papi, A.; Bellettato, C.M.; Braccioni, F.; Romagnoli, M.; Casolari, P.; Caramori, G.; Fabbri, L.M.; Johnston, S.L. Infections and airway inflammation in chronic obstructive pulmonary disease severe exacerbations. Am. J. Respir. Crit. Care Med. 2006, 173, 1114–1121. [Google Scholar] [CrossRef] [PubMed] [Green Version]
- Sapey, E.; Stockley, R.A. COPD exacerbations. 2: Aetiology. Thorax 2006, 61, 250–258. [Google Scholar] [CrossRef] [PubMed] [Green Version]
- Mammen, M.J.; Sethi, S. COPD and the microbiome. Respirology 2016, 21, 590–599. [Google Scholar] [CrossRef] [PubMed] [Green Version]
- Barcik, W.; Boutin, R.C.T.; Sokolowska, M.; Finlay, B.B. The Role of Lung and Gut Microbiota in the Pathology of Asthma. Immunity 2020, 52, 241–255. [Google Scholar] [CrossRef] [Green Version]
- Altawalbeh, S.M.; Hijazi, B.; Kufoof, L.; Basheti, I.A. Health expenditures of asthma-COPD overlap in Northern Jordan. PLoS ONE 2021, 16, e0257566. [Google Scholar] [CrossRef]
- GINA. Global Strategy for Asthma Management and Prevention. 2022. Available online: https://ginasthma.org (accessed on 15 January 2022).
- Boulet, L.-P.; Reddel, H.K.; Bateman, E.; Pedersen, S.; FitzGerald, J.M.; O’Byrne, P.M.J.E.R.J. The global initiative for asthma (GINA): 25 years later. Eur. Respir. J. 2019, 54, 1900598. [Google Scholar] [CrossRef]
- Reddel, H.K.; Bacharier, L.B.; Bateman, E.D.; Brightling, C.E.; Brusselle, G.G.; Buhl, R.; Cruz, A.A.; Duijts, L.; Drazen, J.M.; FitzGerald, J.M.J.R. Global Initiative for Asthma Strategy 2021: Executive summary and rationale for key changes. Am. J. Respir. Crit. Care Med. 2022, 27, 14–35. [Google Scholar] [CrossRef]
- Aagaard, K.; Ma, J.; Antony, K.M.; Ganu, R.; Petrosino, J.; Versalovic, J. The placenta harbors a unique microbiome. Sci. Transl. Med. 2014, 6, 237ra65. [Google Scholar] [CrossRef] [Green Version]
- Lu, J.; Carmody, L.A.; Opron, K.; Simon, R.H.; Kalikin, L.M.; Caverly, L.J.; LiPuma, J.J. Parallel Analysis of Cystic Fibrosis Sputum and Saliva Reveals Overlapping Communities and an Opportunity for Sample Decontamination. mSystems 2020, 5, e00296-20. [Google Scholar] [CrossRef]
- Alsayed, A.; Al-Doori, A.; Al-Dulaimi, A.; Alnaseri, A.; Abuhashish, J.; Aliasin, K.; Alfayoumi, I. Influences of bovine colostrum on nasal swab microbiome and viral upper respiratory tract infections—A case report. Respir. Med. Case Rep. 2020, 31, 101189. [Google Scholar] [CrossRef]
- Al-Dulaimi, A.; Alsayed, A.R.; Maqbali, M.A.; Zihlif, M. Investigating the human rhinovirus co-infection in patients with asthma exacerbations and COVID-19. Pharm. Pract. 2022, 20, 2665. [Google Scholar] [CrossRef] [PubMed]
- Alsayed, A.R.; Talib, W.; Al-Dulaimi, A.; Daoud, S.; Al Maqbali, M. The first detection of Pneumocystis jirovecii in asthmatic patients post-COVID-19 in Jordan. Biomol. Biomed. 2022, 22, 784–790. [Google Scholar] [CrossRef] [PubMed]
- Caporaso, J.G.; Kuczynski, J.; Stombaugh, J.; Bittinger, K.; Bushman, F.D.; Costello, E.K.; Fierer, N.; Peña, A.G.; Goodrich, J.K.; Gordon, J.I. QIIME allows analysis of high-throughput community sequencing data. Nat. Methods 2010, 7, 335–336. [Google Scholar] [CrossRef] [PubMed] [Green Version]
- Haas, B.J.; Gevers, D.; Earl, A.M.; Feldgarden, M.; Ward, D.V.; Giannoukos, G.; Ciulla, D.; Tabbaa, D.; Highlander, S.K.; Sodergren, E. Chimeric 16S rRNA sequence formation and detection in Sanger and 454-pyrosequenced PCR amplicons. Genome Res. 2011, 21, 494–504. [Google Scholar] [CrossRef] [Green Version]
- Wang, Q.; Garrity, G.M.; Tiedje, J.M.; Cole, J.R. Naive Bayesian classifier for rapid assignment of rRNA sequences into the new bacterial taxonomy. Appl. Environ. Microbiol. 2007, 73, 5261–5267. [Google Scholar] [CrossRef] [Green Version]
- Çolak, Y.; Nordestgaard, B.G.; Lange, P.; Vestbo, J.; Afzal, S. Prognosis of Patients with Chronic Obstructive Pulmonary Disease Not Eligible for Major Clinical Trials. Am. J. Respir. Crit. Care Med. 2022, 206, 271–280. [Google Scholar] [CrossRef]
- Hardin, M.; Silverman, E.K.; Barr, R.G.; Hansel, N.N.; Schroeder, J.D.; Make, B.J.; Crapo, J.D.; Hersh, C.P. The clinical features of the overlap between COPD and asthma. Respir. Res. 2011, 12, 127. [Google Scholar] [CrossRef] [Green Version]
- Vaz Fragoso, C.A.; Murphy, T.E.; Agogo, G.O.; Allore, H.G.; McAvay, G.J. Asthma-COPD overlap syndrome in the US: A prospective population-based analysis of patient-reported outcomes and health care utilization. Int. J. Chron. Obs. Pulmon. Dis. 2017, 12, 517–527. [Google Scholar] [CrossRef] [Green Version]
- Sethi, S.; Evans, N.; Grant, B.J.B.; Murphy, T.F. New strains of bacteria and exacerbations of chronic obstructive pulmonary disease. N. Engl. J. Med. 2002, 347, 465–471. [Google Scholar] [CrossRef] [Green Version]
- Murphy, T.F.; Brauer, A.L.; Eschberger, K.; Lobbins, P.; Grove, L.; Cai, X.; Sethi, S. Pseudomonas aeruginosa in chronic obstructive pulmonary disease. Am. J. Respir. Crit. Care Med. 2008, 177, 853–860. [Google Scholar] [CrossRef] [PubMed]
- van der Gast, C.J.; Walker, A.W.; Stressmann, F.A.; Rogers, G.B.; Scott, P.; Daniels, T.W.; Carroll, M.P.; Parkhill, J.; Bruce, K.D. Partitioning core and satellite taxa from within cystic fibrosis lung bacterial communities. ISME J. 2011, 5, 780–791. [Google Scholar] [CrossRef] [PubMed] [Green Version]
- Han, M.K.; Huang, Y.J.; Lipuma, J.J.; Boushey, H.A.; Boucher, R.C.; Cookson, W.O.; Curtis, J.L.; Erb-Downward, J.; Lynch, S.V.; Sethi, S.; et al. Significance of the microbiome in obstructive lung disease. Thorax 2012, 67, 456–463. [Google Scholar] [CrossRef] [PubMed] [Green Version]
- Madan, J.C.; Koestler, D.C.; Stanton, B.A.; Davidson, L.; Moulton, L.A.; Housman, M.L.; Moore, J.H.; Guill, M.F.; Morrison, H.G.; Sogin, M.L.; et al. Serial analysis of the gut and respiratory microbiome in cystic fibrosis in infancy: Interaction between intestinal and respiratory tracts and impact of nutritional exposures. mBio 2012, 3, e00251-12. [Google Scholar] [CrossRef] [Green Version]
- Sze, M.A.; Dimitriu, P.A.; Hayashi, S.; Elliott, W.M.; McDonough, J.E.; Gosselink, J.V.; Cooper, J.; Sin, D.D.; Mohn, W.W.; Hogg, J.C. The lung tissue microbiome in chronic obstructive pulmonary disease. Am. J. Respir. Crit. Care Med. 2012, 185, 1073–1080. [Google Scholar] [CrossRef] [Green Version]
- Erb-Downward, J.R.; Thompson, D.L.; Han, M.K.; Freeman, C.M.; McCloskey, L.; Schmidt, L.A.; Young, V.B.; Toews, G.B.; Curtis, J.L.; Sundaram, B. Analysis of the lung microbiome in the “healthy” smoker and in COPD. PLoS ONE 2011, 6, e16384. [Google Scholar] [CrossRef] [Green Version]
- Huang, Y.J.; Kim, E.; Cox, M.J.; Brodie, E.L.; Brown, R.; Wiener-Kronish, J.P.; Lynch, S.V. A persistent and diverse airway microbiota present during chronic obstructive pulmonary disease exacerbations. OMICS A J. Integr. Biol. 2010, 14, 9–59. [Google Scholar] [CrossRef] [Green Version]
- Hirschmann, J.V. Do bacteria cause exacerbations of COPD? CHEST J. 2000, 118, 193–203. [Google Scholar] [CrossRef] [Green Version]
- Pragman, A.A.; Kim, H.B.; Reilly, C.S.; Wendt, C.; Isaacson, R.E. The lung microbiome in moderate and severe chronic obstructive pulmonary disease. PLoS ONE 2012, 7, e47305. [Google Scholar] [CrossRef] [Green Version]
- Worlitzsch, D.; Rintelen, C.; Böhm, K.; Wollschläger, B.; Merkel, N.; Borneff-Lipp, M.; Döring, G. Antibiotic-resistant obligate anaerobes during exacerbations of cystic fibrosis patients. Clin. Microbiol. Infect. 2009, 15, 454–460. [Google Scholar] [CrossRef] [Green Version]
- Goddard, A.F.; Staudinger, B.J.; Dowd, S.E.; Joshi-Datar, A.; Wolcott, R.D.; Aitken, M.L.; Fligner, C.L.; Singh, P.K. Direct sampling of cystic fibrosis lungs indicates that DNA-based analyses of upper-airway specimens can misrepresent lung microbiota. Proc. Natl. Acad. Sci. USA 2012, 109, 13769–13774. [Google Scholar] [CrossRef] [PubMed] [Green Version]
- O’Neill, K.; Bradley, J.M.; Johnston, E.; McGrath, S.; McIlreavey, L.; Rowan, S.; Reid, A.; Bradbury, I.; Einarsson, G.; Elborn, J.S. Reduced bacterial colony count of anaerobic bacteria is associated with a worsening in lung clearance index and inflammation in cystic fibrosis. PLoS ONE 2015, 10, e0126980. [Google Scholar] [CrossRef] [PubMed]
- Hurst, J.R.; Wilkinson, T.M.; Perera, W.R.; Donaldson, G.C.; Wedzicha, J.A. Relationships among bacteria, upper airway, lower airway, and systemic inflammation in COPD. CHEST J. 2005, 127, 1219–1226. [Google Scholar] [CrossRef]
- Rogers, G.; Carroll, M.; Serisier, D.; Hockey, P.; Jones, G.; Kehagia, V.; Connett, G.; Bruce, K. Use of 16S rRNA gene profiling by terminal restriction fragment length polymorphism analysis to compare bacterial communities in sputum and mouthwash samples from patients with cystic fibrosis. J. Clin. Microbiol. 2006, 44, 2601–2604. [Google Scholar] [CrossRef] [PubMed] [Green Version]
- Patel, I.; Seemungal, T.; Wilks, M.; Lloyd-Owen, S.; Donaldson, G.; Wedzicha, J. Relationship between bacterial colonisation and the frequency, character, and severity of COPD exacerbations. Thorax 2002, 57, 759–764. [Google Scholar] [CrossRef] [PubMed] [Green Version]
- Wilkinson, T.M.; Patel, I.S.; Wilks, M.; Donaldson, G.C.; Wedzicha, J.A. Airway bacterial load and FEV1 decline in patients with chronic obstructive pulmonary disease. Am. J. Respir. Crit. Care Med. 2003, 167, 1090–1095. [Google Scholar] [CrossRef]
- Dickson, R.P.; Huffnagle, G.B. The Lung Microbiome: New Principles for Respiratory Bacteriology in Health and Disease. PLoS Pathog. 2015, 11, e1004923. [Google Scholar] [CrossRef]
- Segal, L.N.; Rom, W.N.; Weiden, M.D. Lung microbiome for clinicians. New discoveries about bugs in healthy and diseased lungs. Ann. Am. Thorac. Soc. 2014, 11, 108–116. [Google Scholar] [CrossRef] [Green Version]
- Millares, L.; Ferrari, R.; Gallego, M.; Garcia-Nuñez, M.; Pérez-Brocal, V.; Espasa, M.; Pomares, X.; Monton, C.; Moya, A.; Monsó, E. Bronchial microbiome of severe COPD patients colonised by Pseudomonas aeruginosa. Eur. J. Clin. Microbiol. Infect. Dis. 2014, 33, 1101–1111. [Google Scholar] [CrossRef] [Green Version]


| Variables | N (%), M (±SD), or Range |
|---|---|
| Age | 56.12 (±13.06) |
| Gender | |
| Male | 2 (25.0%) |
| Female | 6 (75.0%) |
| Body mass index (BMI) | 29.77 (±4.20) |
| Education | |
| Below Bachelor’s degree | 5 (62.5%) |
| Bachelor’s degree or higher | 3 (37.5%) |
| Smoking | |
| Current smoker | 0 (0.0%) |
| Previous smoking history | 8 (100.0%) |
| COVID-19 vaccination status | |
| Two doses | 8 (100.0%) |
| Family history of lung disease (asthma, COPD) | 5 (62.5%) |
| Family history of allergic rhinitis | 5 (62.5%) |
| Family history of eczema | 1 (12.5%) |
| Documented history of asthma before age 40 years | 8 (100.0%) |
| No. of exacerbations during the last year | Median = 3 (2 to 5) |
| Typical respiratory symptoms | 8 (100.0%) |
| FEV1/FVC < 0.70 | 8 (100.0%) |
| Peripheral blood eosinophil count (>300 cells/microL) | 5/7 (71.4%) |
| Post-bronchodilator increase in FEV1, range | 7.1 to 11.8% |
| Comorbidities | |
| Diabetes mellitus | 5 (62.5%) |
| Allergic rhinitis | 2 (25.0%) |
| Cardiovascular disease | 7 (87.5%) |
| SABA as needed for symptoms | 7 (87.5%) |
| Maintenance medication | |
| LAMA | 1 (12.5%) |
| ICS/LABA | 2 (25.0%) |
| ICS/LABA/LAMA | 5 (62.5%) |
| Antibiotic during the exacerbation | 8 (100.0%) |
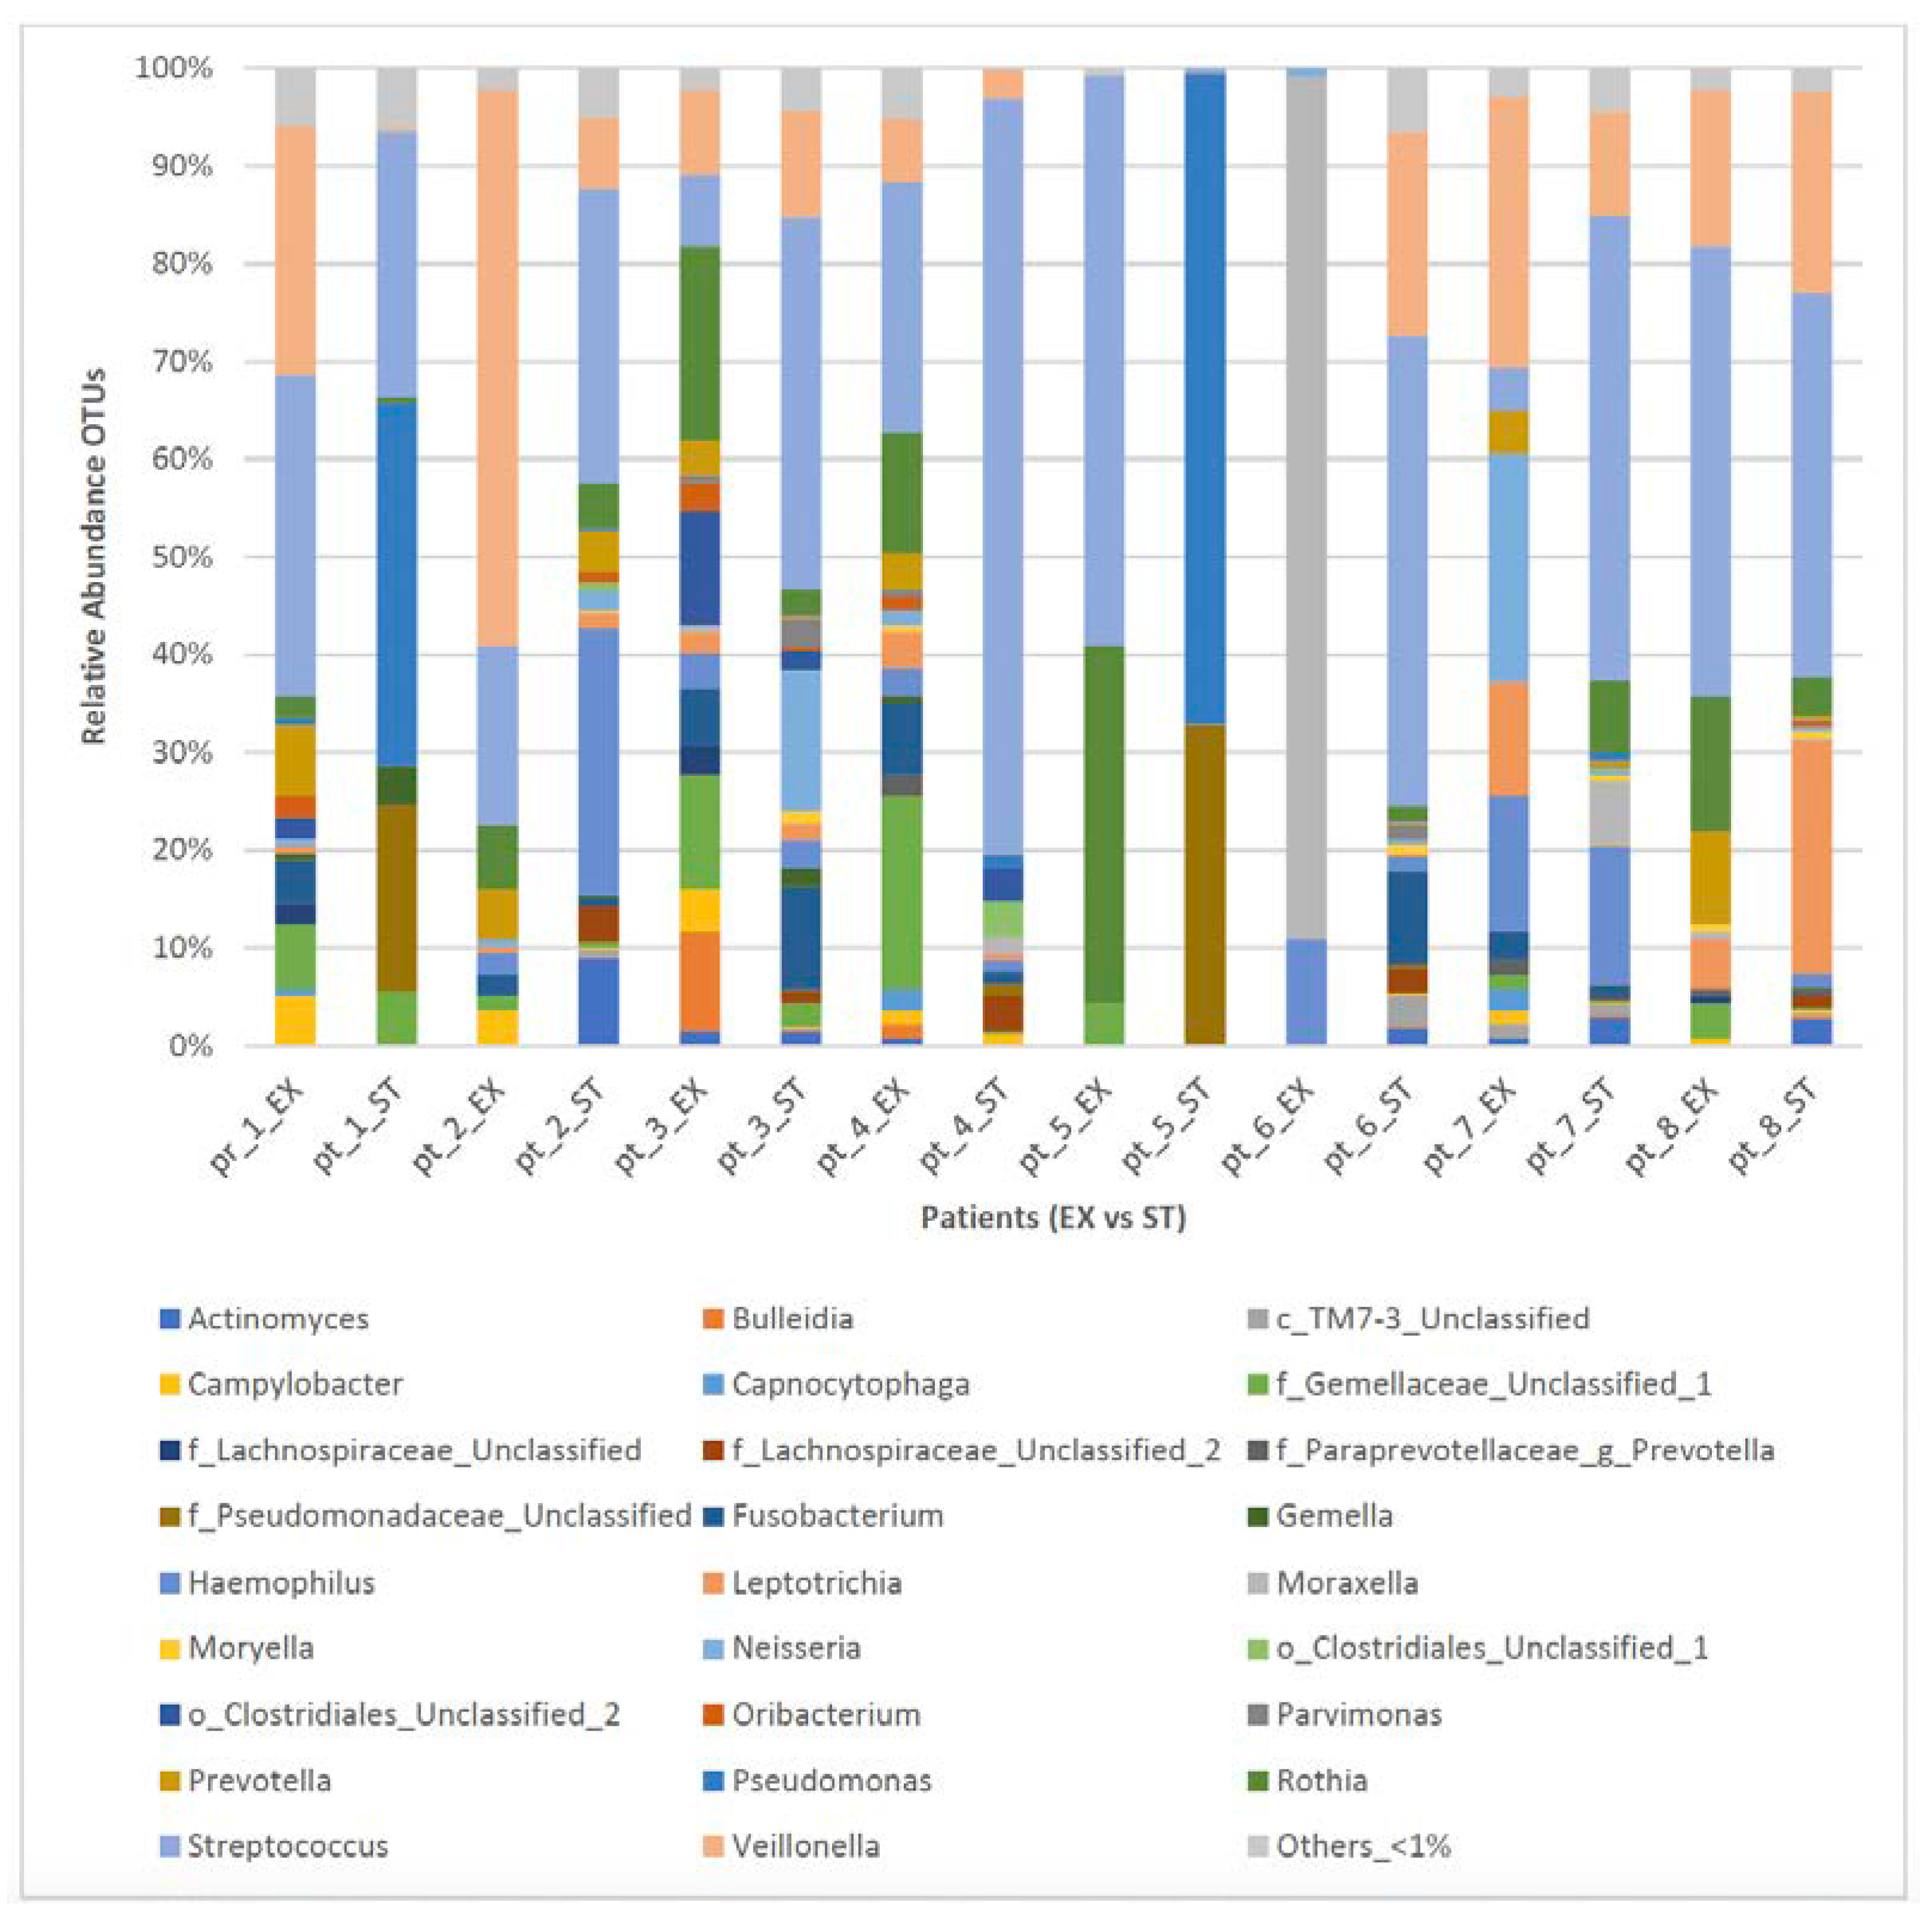
| Sputum Samples during EX States (n = 8) | Sputum Samples during ST State (n = 8) |
|---|---|
| Streptococcus, 24.1% | Streptococcus, 38.5% |
| Veillonella, 17.7% | Pseudomonas, 13.3% |
| Rothia 11.4% | Veillonella, 9.2% |
| Moraxella, 11.2% | other_ < 1%, 7.1% |
| Others_ < 1%, 6.6% | f_Pseudomonadaceae_Unclassified, 6.7% |
| f_Gemellaceae_Unclassified_1, 6.1% | Haemophilus, 6.1% |
| Haemophillus, 4.2% | Leptotrichia, 3.5% |
| Prevotella, 4.2% | Fusobacterium, 2.9% |
| Neisseria, 3.4% | Rothia, 2.6% |
| Leptotrichia, 3.0% | Actinomyces, 2.2% |
| Fusobacterium, 2.8% | Neisseria, 2.2% |
| Campylobacter, 2.1% | f_Lachnospiraceae_Unclassified_2, 1.6% |
| o_Clostridiales_Unclassified_2, 1.7% | f_Gemellaceae_Unclassified_1, 1.1% |
| Bulleidia, 1.5% | Moraxella, 1.1% |
| Genera | Pos. Ranks (EX > ST) | Neg. Ranks (EX < ST) | Equal (EX = ST) | Stat. Test | p-Value | Sig. | |
|---|---|---|---|---|---|---|---|
| 1. | Actinomyces | 1/8 | 6/8 | 1/8 | Sign | 0.125 | - |
| 2. | Bulleidia | 2/8 | 4/8 | 2/8 | Sign | 0.688 | - |
| 3. | Campylobacter | 6/8 | 1/8 | 1/8 | Wilcoxon | 0.028 | EX > ST |
| 4. | f_Gemellaceae_Unclassified_1 | 7/8 | 1/8 | 0/8 | Wilcoxon | 0.017 | EX > ST |
| 5. | f_Lachnospiraceae_Unclassified_2 | 0/8 | 6/8 | 2/8 | Wilcoxon | 0.028 | ST > EX |
| 6. | f_Pseudomonadaceae_Unclassified | 0/8 | 5/8 | 3/8 | Wilcoxon | 0.043 | ST > EX |
| 7. | Fusobacterium | 4/8 | 3/8 | 1/8 | Wilcoxon | 1.000 | - |
| 8. | Haemophillus | 3/8 | 4/8 | 1/8 | Sign | 1.000 | - |
| 9. | Leptotrichia | 4/8 | 3/8 | 1/8 | Wilcoxon | 0.735 | - |
| 10. | Moraxella | 3/8 | 3/8 | 2/8 | Sign | 1.000 | - |
| 11. | Neisseria | 4/8 | 4/8 | 0/8 | Wilcoxon | 0.779 | - |
| 12. | o_Clostridiales_Unclassified_2 | 2/8 | 1/8 | 5/8 | Sign | 1.000 | - |
| 13. | other_ < 1% | 6/8 | 2/8 | 0/8 | Wilcoxon | 0.263 | - |
| 14. | Prevotella | 6/8 | 1/8 | 1/8 | Wilcoxon | 0.028 | EX > ST |
| 15. | Pseudomonas | 0/8 | 7/8 | 1/8 | Sign | 0.016 | ST > EX |
| 16. | Rothia | 6/8 | 2/8 | 0/8 | Sign | 0.289 | - |
| 17. | Streptococcus | 3/8 | 5/8 | 0/8 | Wilcoxon | 0.263 | - |
| 18. | Veillonella | 4/8 | 3/8 | 1/8 | Wilcoxon | 0.310 | - |
| Genera | No. of Patients +ve at EX | No. of Patients +ve at ST | No. of Patients +ve Both at EX and ST | |
|---|---|---|---|---|
| 1. | Actinomyces | 1/8 | 5/8 | 1/8 |
| 2. | Bulleidia | 2/8 | 0/8 | 0/8 |
| 3. | Campylobacter | 5/8 | 1/8 | 1/8 |
| 4. | f_Gemellaceae_Unclassified_1 | 7/8 | 2/8 | 2/8 |
| 5. | f_Lachnospiraceae_Unclassified_2 | 0/8 | 5/8 | 0/8 |
| 6. | f_Pseudomonadaceae_Unclassified | 0/8 | 5/8 | 0/8 |
| 7. | Fusobacterium | 5/8 | 4/8 | 3/8 |
| 8. | Haemophillus | 5/8 | 6/8 | 5/8 |
| 9. | Leptotrichia | 4/8 | 3/8 | 2/8 |
| 10. | Moraxella | 1/8 | 2/8 | 0/8 |
| 11. | Neisseria | 2/8 | 2/8 | 0/8 |
| 12. | o_Clostridiales_Unclassified_2 | 2/8 | 2/8 | 1/8 |
| 13. | other_ < 1% | 7/8 | 7/8 | 6/8 |
| 14. | Prevotella | 6/8 | 1/8 | 1/8 |
| 15. | Pseudomonas | 0/8 | 3/8 | 0/8 |
| 16. | Rothia | 5/8 | 5/8 | 3/8 |
| 17. | Streptococcus | 6/8 | 6/8 | 5/8 |
| 18. | Veillonella | 7/8 | 7/8 | 6/8 |
| Phyla | EX (n = 8) | ST (n = 8) | p-Value | ||
| M | SD | M | SD | ||
| Actinobacteria | 10.3% | 13.1% | 11.9% | 10.7% | 0.674 |
| Bacteroidetes | 6.8% | 6.2% | 1.3% | 2.4% | 0.063 |
| Firmicutes | 53.7% | 25.9% | 68.5% | 31.4% | 0.401 |
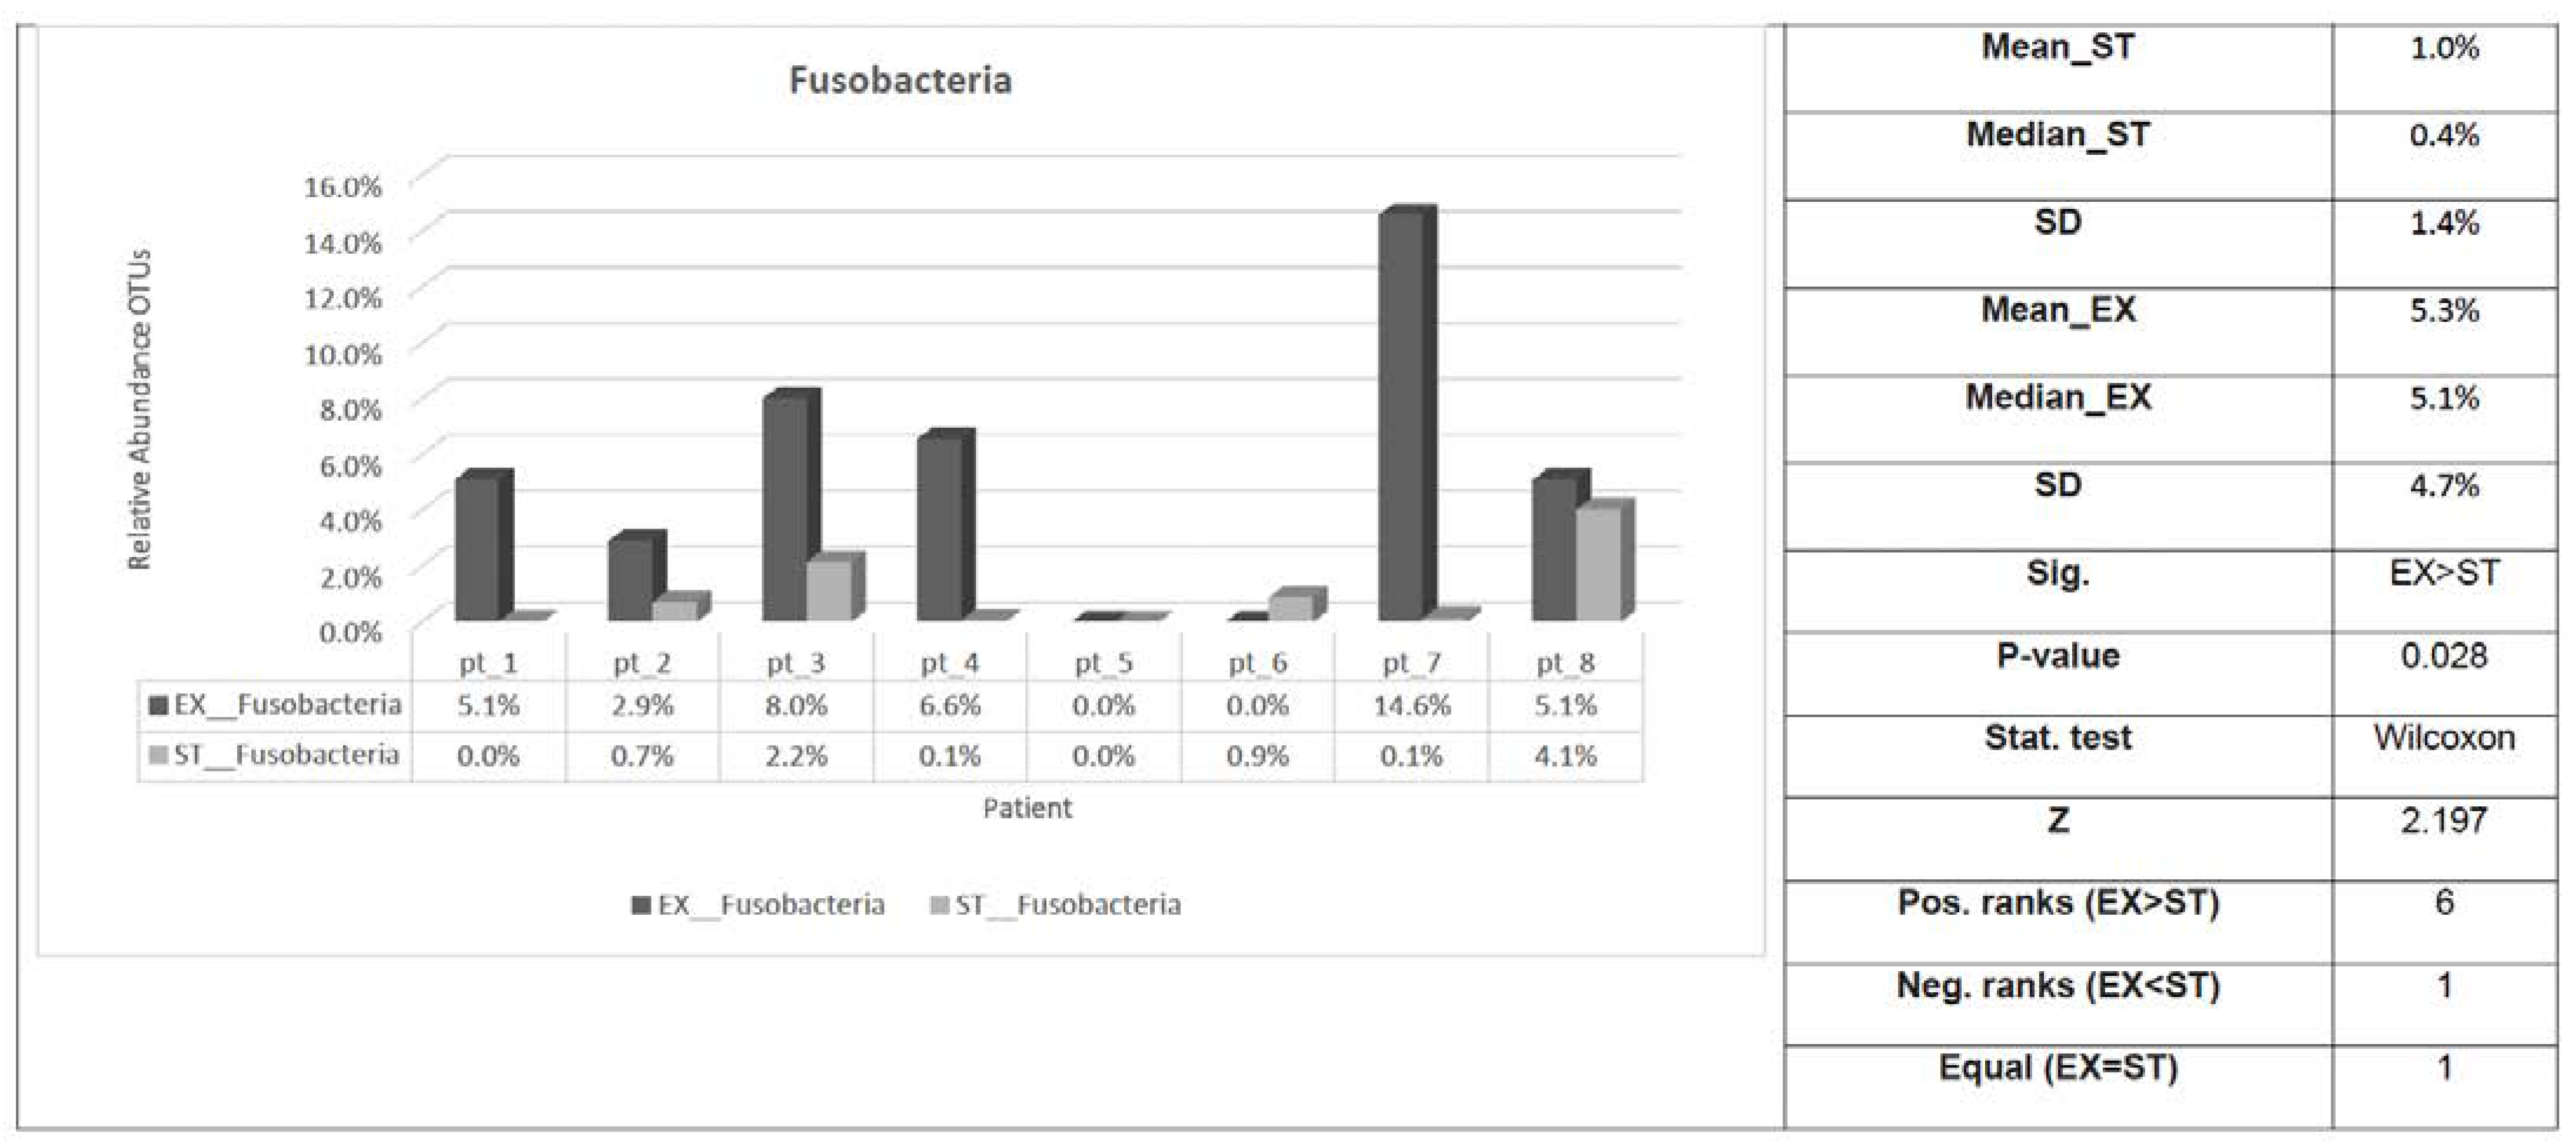
| Fusobacteria | 5.3% | 4.7% | 1.0% | 1.4% | 0.028 * |
| Proteobacteria | 23.7% | 33.5% | 17.2% | 34.1% | 0.484 |
| Spirochaetes | 0.0% | 0.0% | 0.0% | 0.0% | 0.059 |
| Synergistetes | 0.0% | 0.0% | 0.0% | 0.0% | 0.180 |
| TM7 | 0.2% | 0.5% | 0.1% | 0.1% | 0.500 |
| Tenericutes | 0.0% | 0.0% | 0.0% | 0.0% | 1.000 |
Disclaimer/Publisher’s Note: The statements, opinions and data contained in all publications are solely those of the individual author(s) and contributor(s) and not of MDPI and/or the editor(s). MDPI and/or the editor(s) disclaim responsibility for any injury to people or property resulting from any ideas, methods, instructions or products referred to in the content. |
© 2023 by the authors. Licensee MDPI, Basel, Switzerland. This article is an open access article distributed under the terms and conditions of the Creative Commons Attribution (CC BY) license (https://creativecommons.org/licenses/by/4.0/).
Share and Cite
Alsayed, A.R.; Abed, A.; Jarrar, Y.B.; Alshammari, F.; Alshammari, B.; Basheti, I.A.; Zihlif, M. Alteration of the Respiratory Microbiome in Hospitalized Patients with Asthma–COPD Overlap during and after an Exacerbation. J. Clin. Med. 2023, 12, 2118. https://doi.org/10.3390/jcm12062118
Alsayed AR, Abed A, Jarrar YB, Alshammari F, Alshammari B, Basheti IA, Zihlif M. Alteration of the Respiratory Microbiome in Hospitalized Patients with Asthma–COPD Overlap during and after an Exacerbation. Journal of Clinical Medicine. 2023; 12(6):2118. https://doi.org/10.3390/jcm12062118
Chicago/Turabian StyleAlsayed, Ahmad R., Anas Abed, Yazun Bashir Jarrar, Farhan Alshammari, Bushra Alshammari, Iman A. Basheti, and Malek Zihlif. 2023. "Alteration of the Respiratory Microbiome in Hospitalized Patients with Asthma–COPD Overlap during and after an Exacerbation" Journal of Clinical Medicine 12, no. 6: 2118. https://doi.org/10.3390/jcm12062118