
Effect of COVID-19 on Blood Pressure Profile and Oxygen Pulse during and after the Cardiopulmonary Exercise Test in Healthy Adults
 , , , , ,
Abstract
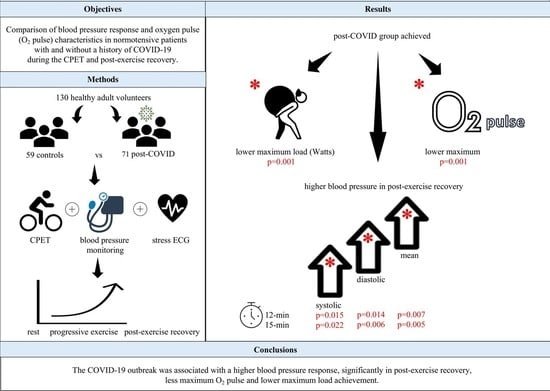
:
1. Introduction
2. Materials and Methods
2.1. Study Design and Test Participants
2.2. Resting Clinical Assessment
2.3. Exercise Testing Equipment
2.4. Exercise Protocol and BP Measurements
2.5. Statistical Analysis
3. Results
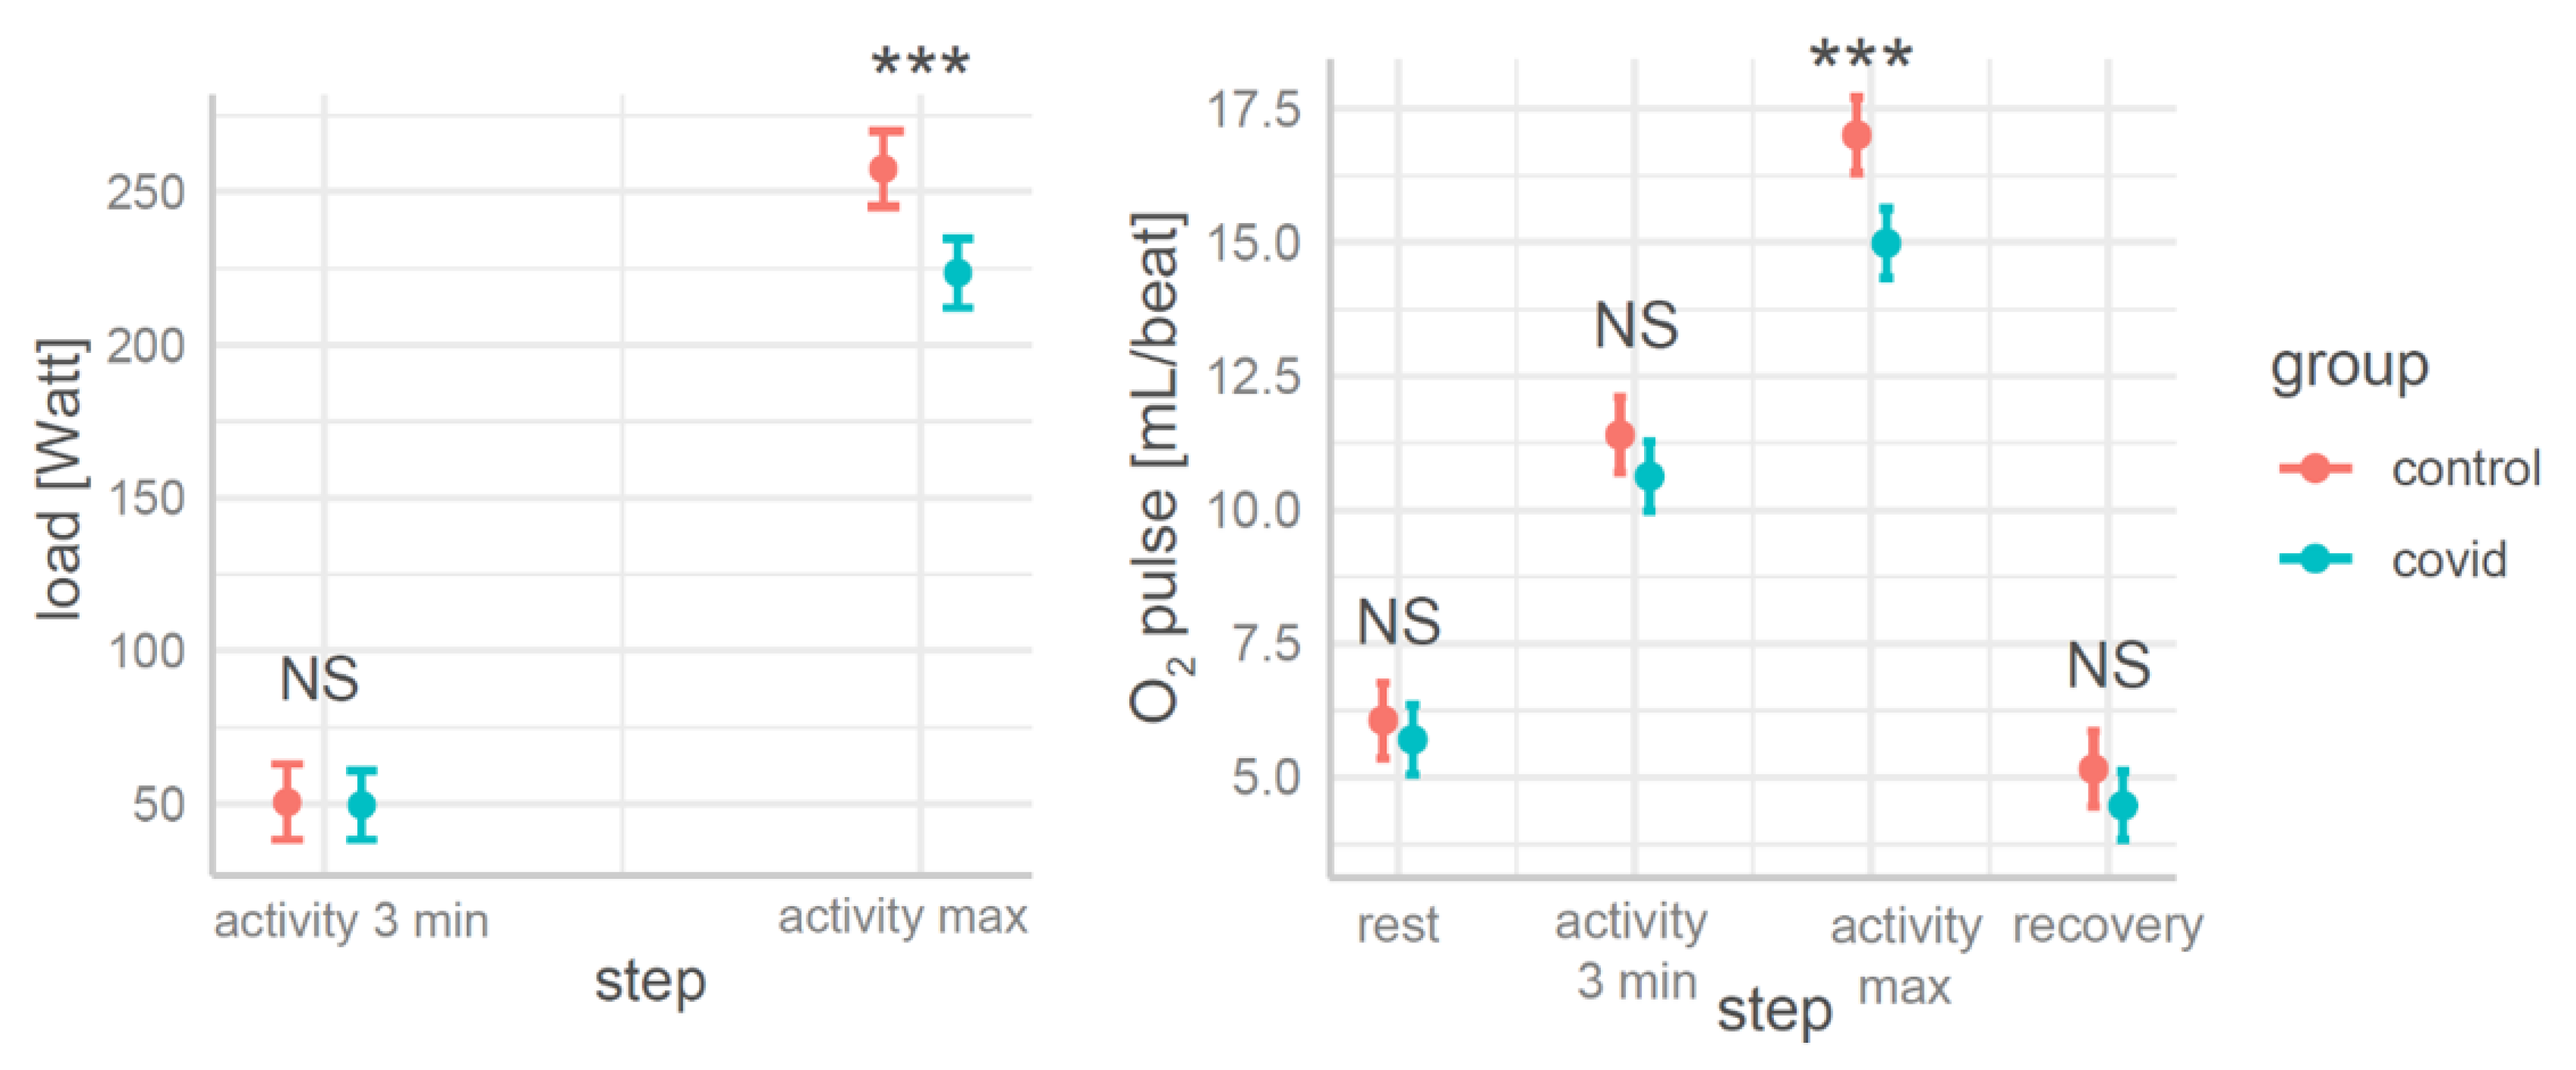
3.1. The Effects of COVID and Exercise Steps on the CPET (Models 1,2)
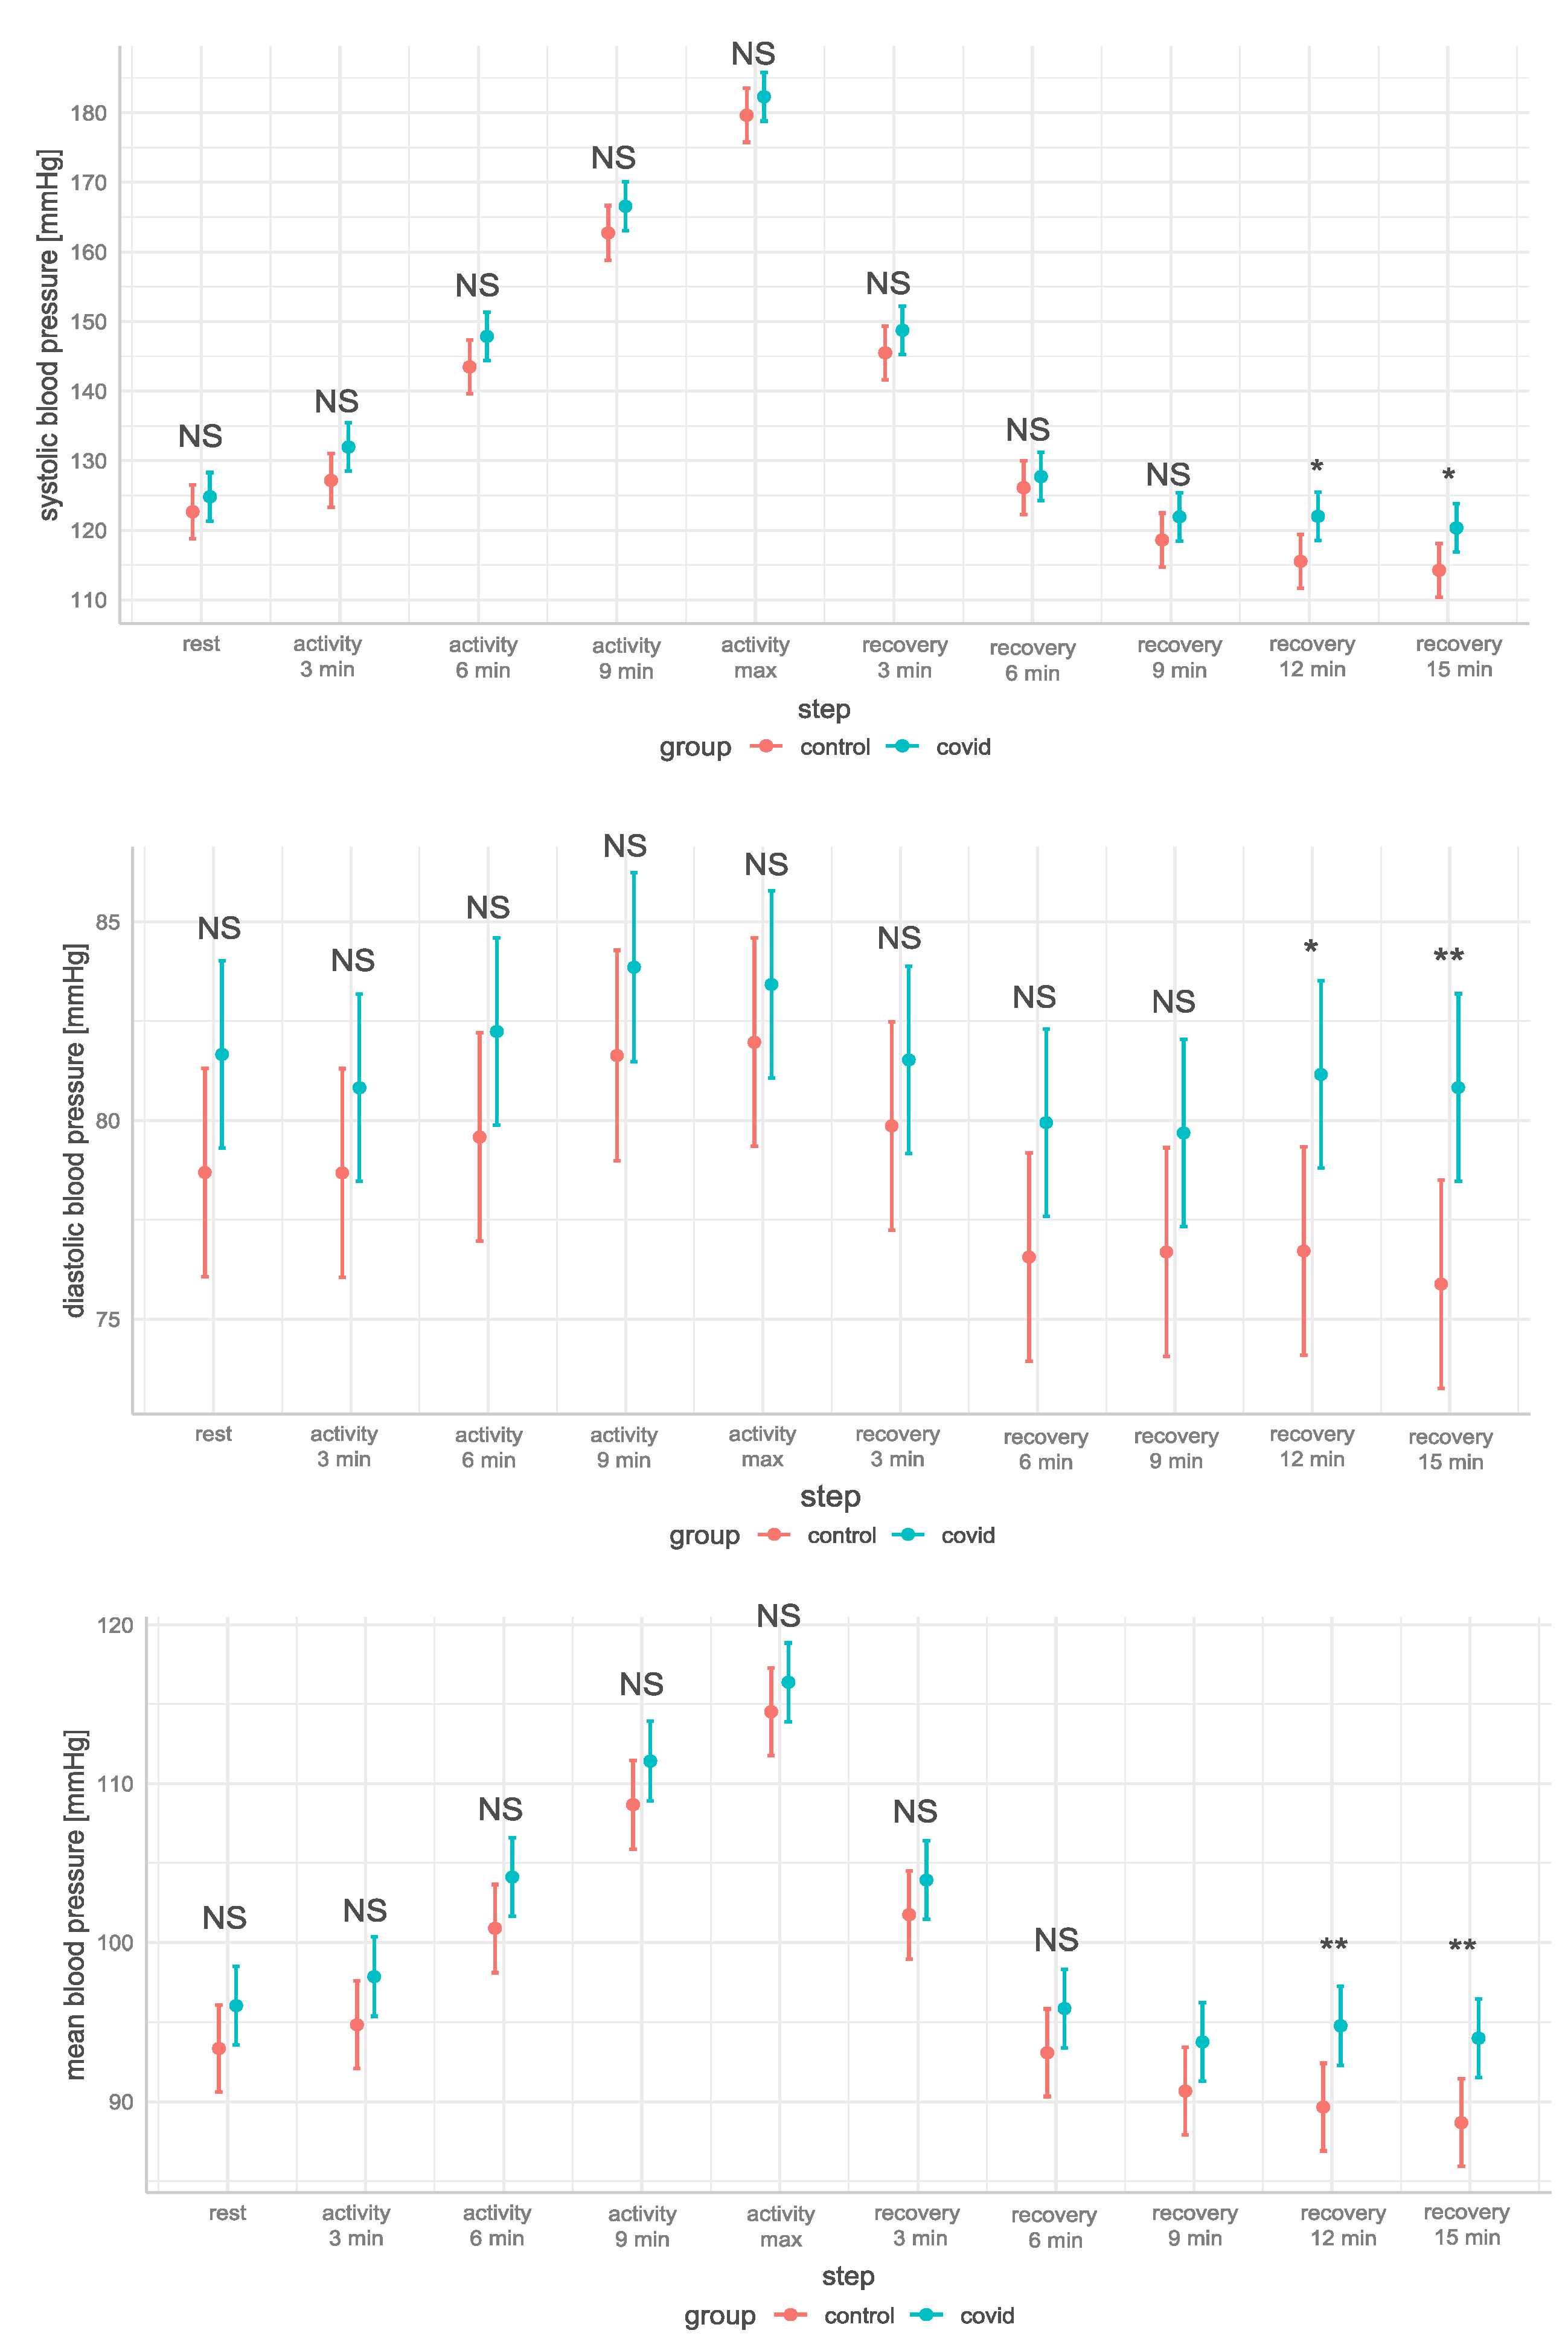
3.2. The Effects of COVID and Exercise Steps on Blood Pressure Parameters (Models 3–8)
4. Discussion
4.1. Limitations
4.2. The Novelty of the Study
5. Conclusions
Author Contributions
Funding
Institutional Review Board Statement
Informed Consent Statement
Data Availability Statement
Conflicts of Interest
Appendix A. Model Specifications
Appendix A.1. Model 1 and 2 Studied the Effects of COVID and Exercise Steps on Performance Parameters at Rest, during Exercise on the Cycloergometer, and in the Recovery Phase
Appendix A.2. Models 3–8 Studied the Effects of COVID, Exercise Steps, and Maximum Load on the Blood Pressure Parameters at Rest, during Exercise on the Cycloergometer and in the Recovery Phase
Appendix B. The Estimated Marginal Means (EMMs) for Step and Group Predictors in a Linear Model for All Models Are Shown in Table A1

| Model | Response Variable | Parameter | Control Group | |||||||||
|---|---|---|---|---|---|---|---|---|---|---|---|---|
| Rest | Activity | Recovery | ||||||||||
| 3 min | 6 min | 9 min | Max | 3 min | 6 min | 9 min | 12 min | 15 min | ||||
| Model 1 | Load [Watt] | EMMs | - | 50.5 | - | - | 257.5 | - | - | - | - | - |
| SE | - | 6.3 | - | - | 6.3 | - | - | - | - | - | ||
| 95% CI | - | [38.1–62.9] | - | - | [245.1–269.9] | - | - | - | - | - | ||
| Model 2 | O2 pulse [mL/beat] | EMMs | 6.07 | 11.4 | - | - | 17.01 | 5.16 | - | - | - | - |
| SE | 0.361 | 0.361 | - | - | 0.361 | 0.361 | - | - | - | - | ||
| 95% CI | [5.36–6.78] | [10.69–12.11] | - | - | [16.30–17.72] | [4.45–5.86] | - | - | - | - | ||
| Model 3 | SBP [mmHg] | EMMs | 123 | 127 | 144 | 163 | 180 | 146 | 126 | 119 | 116 | 114 |
| SE | 1.97 | 1.97 | 1.97 | 1.97 | 1.97 | 1.97 | 1.97 | 1.97 | 1.97 | 1.97 | ||
| 95% CI | [119–127] | [123–131] | [140–147] | [157–167] | [176–184] | [142–149] | [122–130] | [115–123] | [112–119] | [110–118] | ||
| Model 4 | DBP [mmHg] | EMMs | 78.7 | 78.7 | 79.6 | 81.6 | 82 | 79.9 | 76.6 | 76.7 | 76.7 | 75.9 |
| SE | 1.34 | 1.34 | 1.34 | 1.35 | 1.34 | 1.34 | 1.34 | 1.34 | 1.34 | 1.34 | ||
| 95% CI | [76.1–81.3] | [76.1–81.3] | [77.0–82.2] | [79.0–84.3] | [79.3–84.6] | [77.3–82.5] | [73.9–79.2] | [74.1–79.3] | [74.1–79.3] | [73.3–78.5] | ||
| Model 5 | HR [beats/min] | EMMs | 85.1 | 108.8 | 126.9 | 153.5 | 178.9 | 112.4 | 102.2 | 100.6 | 100.7 | 97.5 |
| SE | 1.92 | 1.92 | 1.92 | 1.93 | 1.92 | 1.92 | 1.92 | 1.92 | 1.92 | 1.92 | ||
| 95% CI | [81.4–88.9] | [105.0–112.6] | [123.1–130.6] | [149.7–157.3] | [175.1–182.7] | [108.6–116.2] | [98.4–106.0] | [96.8–104.4] | [97.0–104.5] | [93.7–101.2] | ||
| Model 6 | Saturation [%] | EMMs | 99.38 | 99.25 | 99.29 | 98.94 | 97.45 | 99.38 | 99.3 | 99.23 | 99.17 | 99.14 |
| SE | 0.15 | 0.15 | 0.15 | 0.15 | 0.15 | 0.15 | 0.15 | 0.15 | 0.15 | 0.15 | ||
| 95% CI | [99.09–99.67] | [98.96–99.55] | [99.00–99.58] | [98.64–99.24] | [97.15–97.74] | [99.09–99.68] | [99.00–99.59] | [98.94–99.52] | [98.88–99.47] | [98.85–99.43] | ||
| Model 7 | PP [mmHg] | EMMs | 44 | 48.5 | 63.9 | 81.1 | 97.7 | 65.7 | 49.6 | 42 | 38.9 | 38.4 |
| SE | 1.51 | 1.51 | 1.51 | 1.54 | 1.51 | 1.51 | 1.51 | 1.51 | 1.51 | 1.51 | ||
| 95% CI | [41.0–47.0] | [45.5–51.5] | [60.9–66.9] | [78.1–84.1] | [94.8–100.7] | [62.7–68.7] | [46.6–52.4] | [39.0–44.9] | [35.9–41.8] | [35.4–41.4] | ||
| Model 8 | MBP [mmHg] | EMMs | 93.4 | 94.9 | 100.9 | 108.7 | 114.5 | 101.8 | 93.1 | 90.7 | 89.7 | 88.7 |
| SE | 1.4 | 1.4 | 1.4 | 1.42 | 1.4 | 1.4 | 1.4 | 1.4 | 1.4 | 1.4 | ||
| 95% CI | [90.6–96.1] | [92.1–97.6] | [98.1–103.7] | [105.9–111.5] | [111.8–117.3] | [99.0–104.5] | [90.3–95.9] | [87.9–93.5] | [86.9–92.4] | [85.9–91.5] | ||
| Model | Response Variable | Parameter | COVID Group | |||||||||
| Rest | Activity | Recovery | ||||||||||
| 3 min | 6 min | 9 min | Max | 3 min | 6 min | 9 min | 12 min | 15 min | ||||
| Model 1 | Load [Watt] | EMMs | - | 49.6 | - | - | 223.6 | - | - | - | - | - |
| SE | - | 49.6 | - | - | 223.6 | - | - | - | - | - | ||
| 95% CI | - | [38.3–60.9] | - | - | [212.3–234.9] | - | - | - | - | - | ||
| Model 2 | O2 pulse [mL/beat] | EMMs | 5.71 | 10.63 | - | - | 14.99 | 4.47 | - | - | - | - |
| SE | 0.329 | 0.329 | - | - | 0.329 | 0.329 | - | - | - | - | ||
| 95% CI | [5.06–6.35] | [9.98–11.28] | - | - | [14.34–15.63] | [3.82–5.12] | - | - | - | - | ||
| Model 3 | SBP [mmHg] | EMMs | 125 | 132 | 148 | 167 | 182 | 149 | 128 | 122 | 122 | 120 |
| SE | 1.78 | 1.78 | 1.78 | 1.8 | 1.78 | 1.78 | 1.78 | 1.78 | 1.78 | 1.78 | ||
| 95% CI | [121–128] | [128–135] | [144–151] | [163–170] | [179–186] | [145–152] | [124–131] | [118–125] | [119–126] | [117–124] | ||
| Model 4 | DBP [mmHg] | EMMs | 81.7 | 80.8 | 82.2 | 83.9 | 83.4 | 81.5 | 80 | 79.7 | 81.2 | 80.8 |
| SE | 1.2 | 1.2 | 1.2 | 1.2 | 1.22 | 1.2 | 1.2 | 1.2 | 1.2 | 1.2 | ||
| 95% CI | [79.3–84.1] | [78.5–83.2] | [79.9–84.6] | [81.5–86.2] | [81.1–85.8] | [79.2–83.9] | [77.6–82.3] | [77.3–82.1] | [78.8–83.5] | [78.5–83.2] | ||
| Model 5 | HR [beats/min] | EMMs | 84.9 | 111.6 | 131.6 | 153.5 | 177.5 | 112 | 103.2 | 101.8 | 100.4 | 99.1 |
| SE | 1.73 | 1.73 | 1.73 | 1.74 | 1.73 | 1.73 | 1.73 | 1.73 | 1.73 | 1.73 | ||
| 95% CI | [81.5–88.3] | [108.2–115.0] | [128.2–135.0] | [150.0–156.9] | [174.1–180.9] | [108.6–115.4] | [99.8–106.6] | [98.4–105.2] | [97.0–103.8] | [95.7–102.6] | ||
| Model 6 | Saturation [%] | EMMs | 99.41 | 99.33 | 99.23 | 98.83 | 97.46 | 99.47 | 99.26 | 99.17 | 99.23 | 99.17 |
| SE | 0.13 | 0.13 | 0.13 | 0.13 | 0.13 | 0.13 | 0.13 | 0.13 | 0.13 | 0.13 | ||
| 95% CI | [99.15–99.68] | [99.07–99.60] | [98.96–99.49] | [98.56–99.10] | [97.19–97.72] | [99.20–99.73] | [98.99–99.52] | [98.90–99.43] | [98.96–99.49] | [98.91–99.44] | ||
| Model 7 | PP [mmHg] | EMMs | 43.2 | 51.2 | 65.6 | 82.7 | 98.9 | 67.3 | 47.8 | 43.3 | 40.9 | 39.5 |
| SE | 1.36 | 1.36 | 1.36 | 1.38 | 1.36 | 1.36 | 1.36 | 1.36 | 1.36 | 1.36 | ||
| 95% CI | [40.5–45.9] | [48.5–53.8] | [63.0–68.3] | [80.0–85.4] | [96.3–101.6] | [64.6–69.9] | [45.1–50.5] | [39.6–44.9] | [38.2–43.6] | [36.9–42.2] | ||
| Model 8 | MBP [mmHg] | EMMs | 96.1 | 97.9 | 104.1 | 111.4 | 116.4 | 104 | 95.9 | 93.8 | 94.8 | 94 |
| SE | 1.27 | 1.27 | 1.27 | 1.28 | 1.27 | 1.27 | 1.27 | 1.27 | 1.27 | 1.27 | ||
| 95% CI | [93.6–98.6] | [95.4–100.4] | [101.6–106.6] | [108.9–113.9] | [113.9–118.9] | [101.5–106.5] | [93.4–98.4] | [91.3–96.3] | [92.3–97.3] | [91.5–96.5] | ||
Appendix C. The Results of the Simple Contrasts Used to Estimate the Effects between the Groups within a Marginal Mean Maximum Load = 239 Watts and the Steps Are Shown in Table A2
| Model Nr | Response Variable | Parameter | Contrast Control—COVID | |||||||||
|---|---|---|---|---|---|---|---|---|---|---|---|---|
| Rest | Activity | Recovery | ||||||||||
| 3 min | 6 min | 9 min | Max | 3 min | 6 min | 9 min | 12 min | 15 min | ||||
| Model 1 | Load [Watt] | estimate | - | 0.93 | - | - | 33.96 | - | - | - | - | - |
| t.ratio | - | 0.11 | - | - | 3.99 | - | - | - | - | - | ||
| p | - | 0.913 | - | - | <0.001 | - | - | - | - | - | ||
| Model 2 | O2 pulse [mL/beat] | estimate | 0.36 | 0.77 | - | - | 2.02 | 0.69 | - | - | - | - |
| t.ratio | 0.74 | 1.58 | - | - | 4.14 | 1.4 | - | - | - | - | ||
| p | 0.459 | 0.115 | - | - | <0.001 | 0.161 | - | - | - | - | ||
| Model 3 | SBP [mmHg] | estimate | −2.17 | −4.79 | −4.38 | −3.81 | −2.67 | −3.23 | −1.59 | −3.29 | −6.46 | −6.09 |
| t.ratio | −0.82 | −1.81 | −1.65 | −1.41 | −1.01 | −1.22 | −0.6 | −1.24 | −2.44 | −2.3 | ||
| p | 0.414 | 0.072 | 0.1 | 0.157 | 0.315 | 0.224 | 0.549 | 0.215 | 0.015 | 0.022 | ||
| Model 4 | DBP [mmHg] | estimate | −2.99 | −2.15 | −2.66 | −2.22 | −1.46 | −1.66 | −3.39 | −3.01 | −4.44 | −4.95 |
| t.ratio | −1.66 | −1.19 | −1.48 | −1.22 | −0.81 | −0.92 | −1.88 | −1.67 | −2.47 | −2.75 | ||
| p | 0.097 | 0.233 | 0.141 | 0.222 | 0.418 | 0.356 | 0.061 | 0.096 | 0.014 | 0.006 | ||
| Model 5 | HR [beats/min] | estimate | 0.25 | −2.78 | −4.72 | 0.06 | 1.44 | 0.38 | −1.01 | −1.24 | 0.3 | −1.68 |
| t.ratio | 0.1 | −1.08 | −1.83 | 0.02 | 0.56 | 0.15 | −0.39 | −0.48 | 0.12 | −0.65 | ||
| p | 0.922 | 0.283 | 0.068 | 0.981 | 0.576 | 0.883 | 0.695 | 0.631 | 0.908 | 0.516 | ||
| Model 6 | Saturation [%] | estimate | −0.03 | −0.08 | 0.06 | 0.11 | −0.01 | −0.08 | 0.04 | 0.06 | −0.05 | −0.03 |
| t.ratio | −0.16 | −0.4 | 0.3 | 0.55 | −0.05 | −0.42 | 0.2 | 0.3 | −0.27 | −0.16 | ||
| p | 0.871 | 0.691 | 0.767 | 0.58 | 0.961 | 0.678 | 0.839 | 0.763 | 0.789 | 0.872 | ||
| Model 7 | PP [mmHg] | estimate | 0.82 | −2.64 | −1.72 | −1.5 | −1.21 | −1.57 | 1.79 | −0.29 | −2.02 | −1.14 |
| t.ratio | 0.4 | −1.3 | −0.85 | −0.77 | −0.59 | −0.77 | 0.88 | −0.14 | −0.99 | −0.56 | ||
| p | 0.686 | 0.195 | 0.399 | 0.44 | 0.553 | 0.442 | 0.379 | 0.888 | 0.322 | 0.577 | ||
| Model 8 | MBP [mmHg] | estimate | −2.72 | −3.03 | −3.23 | −2.75 | −1.86 | −2.18 | −2.79 | −3.1 | −5.12 | −5.33 |
| t.ratio | −1.44 | −1.6 | −1.71 | −1.44 | −0.98 | −1.15 | −1.47 | −1.64 | −2.71 | −2.82 | ||
| p | 0.152 | 0.11 | 0.089 | 0.151 | 0.326 | 0.249 | 0.142 | 0.102 | 0.007 | 0.005 | ||
References
- Malik, Y.S.; Kumar, N.; Sircar, S.; Kaushik, R.; Bhatt, S.; Dhama, K.; Gupta, P.; Goyal, K.; Singh, M.P.; Ghoshal, U.; et al. Coronavirus Disease Pandemic (COVID-19): Challenges and a Global Perspective. Pathogens 2020, 9, 519. [Google Scholar] [CrossRef] [PubMed]
- Gorbalenya, A.E.; Baker, S.C.; Baric, R.; Groot, R.J.D.; Drosten, C.; Gulyaeva, A.A.; Haagmans, B.L.; Lauber, C.; Leontovich, A.M.; Neuman, B.W.; et al. Severe acute respiratory syndrome-related coronavirus: The species and its viruses—A statement of the Coronavirus Study Group. bioRxiv 2020. [Google Scholar] [CrossRef]
- Russell, C.D.; Lone, N.I.; Baillie, J.K. Comorbidities, multimorbidity and COVID-19. Nat. Med. 2023, 29, 334–343. [Google Scholar] [CrossRef]
- Chatterjee, S.; Nalla, L.V.; Sharma, M.; Sharma, N.; Singh, A.A.; Malim, F.M.; Ghatage, M.; Mukarram, M.; Pawar, A.; Parihar, N.; et al. Association of COVID-19 with Comorbidities: An Update. ACS Pharmacol. Transl. Sci. 2023, 6, 334–354. [Google Scholar] [CrossRef] [PubMed]
- Carmona-Torre, F.; Mínguez-Olaondo, A.; López-Bravo, A.; Tijero, B.; Grozeva, V.; Walcker, M.; Azkune-Galparsoro, H.; de Munain, A.L.; Alcaide, A.B.; Quiroga, J.; et al. Dysautonomia in COVID-19 Patients: A Narrative Review on Clinical Course, Diagnostic and Therapeutic Strategies. Front. Neurol. 2022, 13, 886609. [Google Scholar] [CrossRef]
- Tenforde, M.W.; Kim, S.S.; Lindsell, C.J.; Rose, E.B.; Shapiro, N.I.; Files, D.C.; Gibbs, K.W.; Erickson, H.L.; Steingrub, J.S.; Smithline, H.A.; et al. Symptom Duration and Risk Factors for Delayed Return to Usual Health Among Outpatients with COVID-19 in a Multistate Health Care Systems Network—United States, March–June 2020. MMWR. Morb. Mortal. Wkly. Rep. 2020, 69, 993–998. [Google Scholar] [CrossRef]
- Townsend, L.; Dowds, J.; O’brien, K.; Martin-Lloeches, I.; Nadarajan, P.; Bannan, C. Reply: The Impact of Acute Illness Severity on Post–COVID-19 Sequelae Remains an Unsettled Question. Ann. Am. Thorac. Soc. 2021, 18, 1754. [Google Scholar] [CrossRef]
- Lopez-Leon, S.; Wegman-Ostrosky, T.; Perelman, C.; Sepulveda, R.; Rebolledo, P.A.; Cuapio, A.; Villapol, S. More than 50 long-term effects of COVID-19: A systematic review and meta-analysis. Sci. Rep. 2021, 11, 16144. [Google Scholar] [CrossRef]
- Guazzi, M.; Adams, V.; Conraads, V.; Halle, M.; Mezzani, A.; Vanhees, L.; Arena, R.; Fletcher, G.F.; Forman, D.E.; Kitzman, D.W.; et al. Clinical Recommendations for Cardiopulmonary Exercise Testing Data Assessment in Specific Patient Populations. Circulation 2012, 126, 2261–2274. [Google Scholar] [CrossRef]
- Barbagelata, L.; Masson, W.; Iglesias, D.; Lillo, E.; Migone, J.F.; Orazi, M.L.; Furcada, J.M. Cardiopulmonary Exercise Testing in Patients with Post-COVID-19 Syndrome. Med. Clín. 2022, 159, 6–11. [Google Scholar] [CrossRef]
- Peng, M.; He, J.; Xue, Y.; Yang, X.; Liu, S.; Gong, Z. Role of Hypertension on the Severity of COVID-19: A Review. J. Cardiovasc. Pharmacol. 2021, 78, e648–e655. [Google Scholar] [CrossRef]
- Lippi, G.; Wong, J.; Henry, B.M. Hypertension and its severity or mortality in Coronavirus Disease 2019 (COVID-19): A pooled analysis. Pol. Arch. Intern. Med. 2020, 130, 304–309. [Google Scholar] [CrossRef]
- Clark, C.E.; McDonagh, S.T.J.; McManus, R.J.; Martin, U. COVID-19 and hypertension: Risks and management. A scientific statement on behalf of the British and Irish Hypertension Society. J. Hum. Hypertens. 2021, 35, 304–307. [Google Scholar] [CrossRef]
- Guo, T.; Fan, Y.; Chen, M.; Wu, X.; Zhang, L.; He, T.; Wang, H.; Wan, J.; Wang, X.; Lu, Z. Cardiovascular Implications of Fatal Outcomes of Patients With Coronavirus Disease 2019 (COVID-19). JAMA Cardiol. 2020, 5, 811–818. [Google Scholar] [CrossRef]
- Lewington, S.; Clarke, R.; Qizilbash, N.; Peto, R.; Collins, R.; Prospective Studies Collaboration. Age-Specific Relevance of Usual Blood Pressure to Vascular Mortality: A Meta-Analysis of Individual Data for One Million Adults in 61 Prospective Studies. Lancet 2002, 360, 1903–1913. [Google Scholar]
- Chiacchio Sieira, M.; Omar Ricart, A.; Suau Estrany, R. Blood Pressure Response to Exercise Testing. Apunts Sports Med. 2010, 45, 191–200. [Google Scholar]
- Glaab, T.; Taube, C. Practical guide to cardiopulmonary exercise testing in adults. Respir. Res. 2022, 23, 9. [Google Scholar] [CrossRef]
- Mezzani, A. Cardiopulmonary Exercise Testing: Basics of Methodology and Measurements. Ann. Am. Thorac. Soc. 2017, 14 (Suppl. 1), S3–S11. [Google Scholar] [CrossRef]
- Sawicka-Gutaj, N.; Gruszczyński, D.; Guzik, P.; Mostowska, A.; Walkowiak, J. Publication ethics of human studies in the light of the Declaration of Helsinki—A mini-review. J. Med. Sci. 2022, 91, e700. [Google Scholar] [CrossRef]
- Pritchard, A.; Burns, P.; Correia, J.; Jamieson, P.; Moxon, P.; Purvis, J.; Thomas, M.; Tighe, H.; Sylvester, K.P. ARTP statement on cardiopulmonary exercise testing 2021. BMJ Open Respir. Res. 2021, 8, e001121. [Google Scholar] [CrossRef]
- Smarż, K.; Jaxa-Chamiec, T.; Chwyczko, T.; Główczyńska, R.; Jegier, A.; Niedoszytko, P.; Piotrowicz, E.; Rybicki, J.; Straburzyńska-Migaj, E.; Szalewska, D.; et al. Cardiopulmonary exercise testing in adult cardiology: Expert opinion of the Working Group of Cardiac Rehabilitation and Exercise Physiology of the Polish Cardiac Society. Kardiologia Polska 2019, 77, 730–756. [Google Scholar] [CrossRef] [PubMed]
- Herdy, A.H.; Ritt, L.E.F.; Stein, R.; Araújo, C.G.S.D.; Milani, M.; Meneghelo, R.S.; Ferraz, A.S.; Hossri, C.; De Almeida, A.E.M.; Fernandes-Silva, M.M.; et al. Cardiopulmonary Exercise Test: Fundamentals, Applicability and Interpretation. Arq. Bras. Cardiol. 2016, 107, 467–481. [Google Scholar] [CrossRef] [PubMed]
- Cassar, M.P.; Tunnicliffe, E.M.; Petousi, N.; Lewandowski, A.J.; Xie, C.; Mahmod, M.; Samat, A.H.A.; Evans, R.A.; Brightling, C.E.; Ho, L.-P.; et al. Symptom Persistence Despite Improvement in Cardiopulmonary Health—Insights from longitudinal CMR, CPET and lung function testing post-COVID-19. eClinicalMedicine 2021, 41, 101159. [Google Scholar] [CrossRef] [PubMed]
- Kersten, J.; Hoyo, L.; Wolf, A.; Hüll, E.; Nunn, S.; Tadic, M.; Scharnbeck, D.; Rottbauer, W.; Buckert, D. Cardiopulmonary Exercise Testing Distinguishes between Post-COVID-19 as a Dysfunctional Syndrome and Organ Pathologies. Int. J. Environ. Res. Public Health 2022, 19, 11421. [Google Scholar] [CrossRef]
- Xiao, K.; Yang, H.; Liu, B.; Pang, X.; Du, J.; Liu, M.; Liu, Y.; Jing, X.; Chen, J.; Deng, S.; et al. Antibodies Can Last for More Than 1 Year After SARS-CoV-2 Infection: A Follow-Up Study From Survivors of COVID-19. Front. Med. 2021, 8, 684864. [Google Scholar] [CrossRef]
- Paap, D.; Takken, T. Reference values for cardiopulmonary exercise testing in healthy adults: A systematic review. Expert Rev. Cardiovasc. Ther. 2014, 12, 1439–1453. [Google Scholar] [CrossRef]
- Frizzelli, A.; Di Spigno, F.; Moderato, L.; Halasz, G.; Aiello, M.; Tzani, P.; Manari, G.; Calzetta, L.; Pisi, R.; Pelà, G.; et al. An Impairment in Resting and Exertional Breathing Pattern May Occur in Long-COVID Patients with Normal Spirometry and Unexplained Dyspnoea. J. Clin. Med. 2022, 11, 7388. [Google Scholar] [CrossRef]
- Evers, G.; Schulze, A.B.; Osiaevi, I.; Harmening, K.; Vollenberg, R.; Wiewrodt, R.; Pistulli, R.; Boentert, M.; Tepasse, P.-R.; Sindermann, J.R.; et al. Sustained Impairment in Cardiopulmonary Exercise Capacity Testing in Patients after COVID-19: A Single Center Experience. Can. Respir. J. 2022, 2022, e2466789. [Google Scholar] [CrossRef]
- Back, G.; Oliveira, M.; Camargo, P.; Goulart, C.; Oliveira, C.; Wende, K.; Junior, J.B.; Arbex, R.; Caruso, F.; Arena, R.; et al. Mild-to-moderate COVID-19 impact on the cardiorespiratory fitness in young and middle-aged populations. Braz. J. Med. Biol. Res. 2022, 55, e12118. [Google Scholar] [CrossRef]
- Kim, D.; Ha, J.-W. Hypertensive response to exercise: Mechanisms and clinical implication. Clin. Hypertens. 2016, 22, 17. [Google Scholar] [CrossRef]
- Miętkiewska-Szwacka, K.; Kujawska-Łuczak, M.; Piorunek, T.; Cofta, S.; Hoffmann, K.; Grabańska-Martyńska, K.; Roszak, M.; Wysocka, E.; Cymerys, M. The effects of submaximal exercise on a treadmill on the recovery of the stiffness index and reflection index in men with untreated hypertension. J. Med. Sci. 2021, 90, e504. [Google Scholar] [CrossRef]
- Chan, J.; Senior, H.; Homitz, J.; Cashin, N.; Guers, J.J. Individuals with a previous symptomatic COVID-19 infection have altered heart rate and blood pressure variability during acute exercise. Front. Physiol. 2023, 14, 1052369. [Google Scholar] [CrossRef]
- Akpek, M. Does COVID-19 Cause Hypertension? Angiology 2021, 73, 682–687. [Google Scholar] [CrossRef]
- Dimkpa, U.; Ugwu, A.C. Independent Multiple Correlates of Post-Exercise Systolic Blood Pressure Recovery in Healthy Adults. Int. J. Exerc. Sci. 2010, 3, 25–35. [Google Scholar]
- Hashimoto, M.; Okamoto, M.; Yamagata, T.; Yamane, T.; Watanabe, M.; Tsuchioka, Y.; Matsuura, H.; Kajiyama, G. Abnormal systolic blood pressure response during exercise recovery in patients with angina pectoris. J. Am. Coll. Cardiol. 1993, 22, 659–664. [Google Scholar] [CrossRef]
- McHam, S.A.; Marwick, T.H.; Pashkow, F.J.; Lauer, M.S. Delayed systolic blood pressure recovery after graded exercise: An independent correlate of angiographic coronary disease. J. Am. Coll. Cardiol. 1999, 34, 754–759. [Google Scholar] [CrossRef]
- Laukkanen, J.A.; Kurl, S.; Salonen, R.; Lakka, T.A.; Rauramaa, R.; Salonen, J.T. Systolic Blood Pressure During Recovery From Exercise and the Risk of Acute Myocardial Infarction in Middle-Aged Men. Hypertension 2004, 44, 820–825. [Google Scholar] [CrossRef]
- Singh, J.P.; Larson, M.G.; Manolio, T.A.; O’donnell, C.J.; Lauer, M.; Evans, J.C.; Levy, D. Blood Pressure Response During Treadmill Testing as a Risk Factor for New-Onset Hypertension. Circulation 1999, 99, 1831–1836. [Google Scholar] [CrossRef]
- Saeed, S.; Tadic, M.; Larsen, T.H.; Grassi, G.; Mancia, G. Coronavirus disease 2019 and cardiovascular complications: Focused clinical review. J. Hypertens. 2021, 39, 1282–1292. [Google Scholar] [CrossRef]
- Zuin, M.; Rigatelli, G.; Bilato, C.; Pasquetto, G.; Mazza, A. Risk of Incident New-Onset Arterial Hypertension After COVID-19 Recovery: A Systematic Review and Meta-analysis. High Blood Press. Cardiovasc. Prev. 2023, 30, 227–233. [Google Scholar] [CrossRef]


| Characteristic | Control, n = 59 1 | COVID, n = 71 1 | p-Value 2 |
|---|---|---|---|
| sex | 0.098 | ||
| female | 23 (39.0%) | 38 (53.5%) | |
| male | 36 (61%) | 33 (46.5%) | |
| age | 31.0 (29.0, 38.5) | 40.0 (30.5, 45.0) | 0.002 |
| height, meters | 1.76 (1.69, 1.82) | 1.70 (1.68, 1.80) | 0.216 |
| weight, kg | 76.0 (64.5, 86.0) | 74.0 (63.5, 82.0) | 0.568 |
| BMI, kg/m2 | 24.22 (23.15, 25.89) | 24.39 (22.46, 26.37) | 0.983 |
| smoking | 0.568 | ||
| yes | 7 (12.0%) | 6 (8.5%) | |
| no | 52 (88.0%) | 65 (91.5%) | |
| vaccination | 0.953 | ||
| yes | 53.0 (89.8%) | 64.0 (90.1%) | |
| no | 6.0 (10.2%) | 7 (9.9%) | |
| Time from COVID to CPET [years] | - | 0.85 (0.50, 1.00) | - |
Disclaimer/Publisher’s Note: The statements, opinions and data contained in all publications are solely those of the individual author(s) and contributor(s) and not of MDPI and/or the editor(s). MDPI and/or the editor(s) disclaim responsibility for any injury to people or property resulting from any ideas, methods, instructions or products referred to in the content. |
© 2023 by the authors. Licensee MDPI, Basel, Switzerland. This article is an open access article distributed under the terms and conditions of the Creative Commons Attribution (CC BY) license (https://creativecommons.org/licenses/by/4.0/).
Share and Cite
Miętkiewska-Szwacka, K.; Domin, R.; Kwissa, M.; Żołyński, M.; Niziński, J.; Turska, E.; Cymerys, M. Effect of COVID-19 on Blood Pressure Profile and Oxygen Pulse during and after the Cardiopulmonary Exercise Test in Healthy Adults. J. Clin. Med. 2023, 12, 4483. https://doi.org/10.3390/jcm12134483
Miętkiewska-Szwacka K, Domin R, Kwissa M, Żołyński M, Niziński J, Turska E, Cymerys M. Effect of COVID-19 on Blood Pressure Profile and Oxygen Pulse during and after the Cardiopulmonary Exercise Test in Healthy Adults. Journal of Clinical Medicine. 2023; 12(13):4483. https://doi.org/10.3390/jcm12134483
Chicago/Turabian StyleMiętkiewska-Szwacka, Kamila, Remigiusz Domin, Małgorzata Kwissa, Mikołaj Żołyński, Jan Niziński, Elżbieta Turska, and Maciej Cymerys. 2023. "Effect of COVID-19 on Blood Pressure Profile and Oxygen Pulse during and after the Cardiopulmonary Exercise Test in Healthy Adults" Journal of Clinical Medicine 12, no. 13: 4483. https://doi.org/10.3390/jcm12134483