
Combined Effect of Genetic Variants on Long-Term Weight Response after Bariatric Surgery
 , , and
Abstract
:1. Introduction
2. Materials and Methods
2.1. Selection of Candidate SNPs
2.2. DNA Extraction and Genotyping of Samples
2.3. Statistical Analyses
3. Results
3.1. Association Study with Weight Response
3.2. Clustered Risk and Weight Response
4. Discussion
Supplementary Materials
Author Contributions
Funding
Institutional Review Board Statement
Informed Consent Statement
Data Availability Statement
Conflicts of Interest
References
- Chang, S.-H.; Stoll, C.R.T.; Song, J.; Varela, J.E.; Eagon, C.J.; Colditz, G.A. The effectiveness and risks of bariatric surgery: An updated systematic review and meta-analysis, 2003–2012. JAMA Surg. 2014, 149, 275–287. [Google Scholar] [CrossRef] [Green Version]
- Sheng, B.; Truong, K.; Spitler, H.; Zhang, L.; Tong, X.; Chen, L. The Long-Term Effects of Bariatric Surgery on Type 2 Diabetes Remission, Microvascular and Macrovascular Complications, and Mortality: A Systematic Review and Meta-Analysis. Obes. Surg. 2017, 27, 2724–2732. [Google Scholar] [CrossRef] [PubMed]
- O’Brien, P.E.; Hindle, A.; Brennan, L.; Skinner, S.; Burton, P.; Smith, A.; Crosthwaite, G.; Brown, W. Long-Term Outcomes After Bariatric Surgery: A Systematic Review and Meta-analysis of Weight Loss at 10 or More Years for All Bariatric Procedures and a Single-Centre Review of 20-Year Outcomes After Adjustable Gastric Banding. Obes. Surg. 2019, 29, 3–14. [Google Scholar] [CrossRef] [PubMed] [Green Version]
- Junquera Bañares, S.; Ramírez Real, L.; Camuñas Segovia, J.; Martín García-Almenta, M.; Llanos Egüez, K.; Álvarez Hernández, J. Evaluación de la calidad de vida, pérdida de peso y evolución de comorbilidades a los 6 años de la cirugía bariátrica. Endocrinol. Diabetes Nutr. 2021, 68, 501–508. [Google Scholar] [CrossRef]
- Maggard, M.A.; Shugarman, L.R.; Suttorp, M.; Maglione, M.; Sugarman, H.J.; Livingston, E.H.; Nguyen, N.T.; Li, Z.; Mojica, W.A.; Hilton, L.; et al. Meta-analysis: Surgical treatment of obesity. Ann. Intern. Med. 2005, 142, 547–559. [Google Scholar] [CrossRef] [PubMed] [Green Version]
- Courcoulas, A.P.; Christian, N.J.; Belle, S.H.; Berk, P.D.; Flum, D.R.; Garcia, L.; Horlick, M.; Kalarchian, M.A.; King, W.C.; Mitchell, J.E.; et al. Weight change and health outcomes at 3 years after bariatric surgery among individuals with severe obesity. JAMA 2013, 310, 2416–2425. [Google Scholar] [CrossRef] [Green Version]
- Capoccia, D.; Guida, A.; Coccia, F.; Guarisco, G.; Testa, M.; Leonetti, F.; Silecchia, G. Weight Regain and Diabetes Evolution After Sleeve Gastrectomy: A Cohort Study with over 5 Years of Follow-Up. Obes. Surg. 2020, 30, 1046–1051. [Google Scholar] [CrossRef]
- Busetto, L.; Dicker, D.; Azran, C. Practical recommendations of the obesity management task force of the European Association for the Study of obesity for the post-bariatric surgery medical management. Obes. Facts 2018, 10, 597–632. [Google Scholar] [CrossRef]
- Nicoletti, C.F.; Cortes-Oliveira, C.; Pinhel, M.A.S.; Nonino, C.B. Bariatric surgery and precision nutrition. Nutrients 2017, 9, 974. [Google Scholar] [CrossRef] [Green Version]
- Boswell, L.; Jiménez, A.; Ortega, E.; Pané, A.; Hollanda, A.D.; Moizé, V.; Andreu, A.; Ibarzabal, A.; Flores, L.; Vidal, J. Genetic background influences weight-loss trajectories on the mid-term after bariatric surgery. Int. J. Obes. 2019, 43, 1869–1874. [Google Scholar] [CrossRef]
- Loos, R.J. The genetics of adiposity. Curr. Opin. Genet. Dev. 2018, 50, 86–95. [Google Scholar] [CrossRef] [PubMed]
- Locke, A.E.; Kahali, B.; Berndt, S.I.; Justice, A.E.; Pers, T.H.; Day, F.R.; Powell, C.; Vedantam, S.; Buchkovich, M.L.; Yang, J.; et al. Genetic studies of body mass index yield new insights for obesity biology. Nature 2015, 518, 197–206. [Google Scholar] [CrossRef] [PubMed] [Green Version]
- Goodarzi, M.O. Genetics of obesity: What genetic association studies have taught us about the biology of obesity and its complications. Lancet Diabetes Endocrinol. 2018, 6, 223–236. [Google Scholar] [CrossRef] [PubMed]
- Still, C.D.; Wood, G.C.; Chu, X.; Erdman, R.; Manney, C.H.; Benotti, P.N.; Petrick, A.T.; Strodel, W.E.; Mirshahi, U.L.; Mirshahi, T.; et al. High allelic burden of four obesity SNPs is associated with poorer weight loss outcomes following gastric bypass surgery. Obesity 2011, 19, 1676–1683. [Google Scholar] [CrossRef]
- Bandstein, M.; Voisin, S.; Nilsson, E.K.; Schultes, B.; Ernst, B.; Thurnheer, M.; Benedict, C.; Mwinyi, J.; Schiöth, H.B. A Genetic Risk Score Is Associated with Weight Loss Following Roux-en Y Gastric Bypass Surgery. Obes. Surg. 2016, 26, 2183–2189. [Google Scholar] [CrossRef] [Green Version]
- Käkelä, P.; Jääskeläinen, T.; Torpström, J.; Ilves, I.; Venesmaa, S.; Pääkkönen, M.; Gylling, H.; Paajanen, H.; Uusitupa, M.; Pihlajamäki, J. Genetic Risk Score Does Not Predict the Outcome of Obesity Surgery. Obes. Surg. 2014, 24, 128–133. [Google Scholar] [CrossRef]
- Aasbrenn, M.; Schnurr, T.M.; Have, C.T.; Svendstrup, M.; Hansen, D.L.; Worm, D.; Balslev-Harder, M.; Hollensted, M.; Grarup, N.; Burgdorf, K.S.; et al. Genetic Determinants of Weight Loss After Bariatric Surgery. Obes. Surg. 2019, 29, 2554–2561. [Google Scholar] [CrossRef]
- Holzer, P.; Reichmann, F.; Farzi, A. Neuropeptide Y, peptide YY and pancreatic polypeptide in the gut-brain axis. Neuropeptides 2012, 46, 261–274. [Google Scholar] [CrossRef] [Green Version]
- Suzuki, K.; Simpson, K.A.; Minnion, J.S.; Shillito, J.C.; Bloom, S.R. The role of gut hormones and the hypothalamus in appetite regulation. Endocr. J. 2010, 57, 359–372. [Google Scholar] [CrossRef] [Green Version]
- Torrego-Ellacuría, M.; Barabash, A.; Larrad-Sainz, A.; Hernández-Nuñez, G.M.; Matía-Martín, P.; Pérez-Ferre, N.; Marcuello, C.; Sánchez-Pernaute, A.; Torres, A.J.; Calle-Pascual, A.L.; et al. Weight Regain Outcomes After Bariatric Surgery in the Long-term Follow-up: Role of Preoperative Factors. Obes. Surg. 2021, 31, 3947–3955. [Google Scholar] [CrossRef]
- King, W.C.; Hinerman, A.S.; Belle, S.H.; Wahed, A.S.; Courcoulas, A.P. Comparison of the Performance of Common Measures of Weight Regain after Bariatric Surgery for Association with Clinical Outcomes. JAMA 2018, 320, 1560–1569. [Google Scholar] [CrossRef] [PubMed] [Green Version]
- Torrego-Ellacuría, M.; Barabash, A.; Matía-Martín, P.; Sánchez-Pernaute, A.; Torres, A.J.; Calle-Pascual, A.L.; Rubio-Herrera, M.A. Influence of CLOCK Gene Variants on Weight Response after Bariatric Surgery. Nutrients 2022, 14, 3472. [Google Scholar] [CrossRef] [PubMed]
- HapMap International Public Project, n.d. Available online: https://www.internationalgenome.org/ (accessed on 1 January 2023).
- dbSNP, NCBI n.d. Available online: https://www.ncbi.nlm.nih.gov/snp (accessed on 1 January 2023).
- Ensembl Project, n.d. Available online: http://www.ensembl.org/Homo_sapiens/ (accessed on 1 January 2023).
- Solé, X.; Guinó, E.; Valls, J.; Iniesta, R.; Moreno, V. SNPStats: A web tool for the analysis of association studies. Bioinformatics 2006, 22, 1928–1929. [Google Scholar] [CrossRef] [PubMed] [Green Version]
- Bonouvrie, D.S.; Uittenbogaart, M.; Luijten, A.A.P.M.; van Dielen, F.M.H.; Leclercq, W.K.G. Lack of Standard Definitions of Primary and Secondary (Non)responders After Primary Gastric Bypass and Gastric Sleeve: A Systematic Review. Obes. Surg. 2019, 29, 691–697. [Google Scholar] [CrossRef]
- Hosseini-Esfahani, F.; Koochakpoor, G.; Mirmiran, P.; Daneshpour, M.S.; Azizi, F. Dietary patterns modify the association between fat mass and obesity-associated genetic variants and changes in obesity phenotypes. Br. J. Nutr. 2019, 121, 1247–1254. [Google Scholar] [CrossRef] [PubMed]
- Jiménez, A.; Ibarzabal, A.; Moizé, V.; Pané, A.; Andreu, A.; Molero, J.; de Hollanda, A.; Flores, L.; Ortega, E.; Lacy, A.; et al. Ten-year outcomes after Roux-en-Y gastric bypass and sleeve gastrectomy: An observational nonrandomized cohort study. Surg. Obes. Relat. Dis. 2019, 15, 382–388. [Google Scholar] [CrossRef]
- Arterburn, D.E.; Johnson, E.; Coleman, K.J.; Herrinton, L.J.; Courcoulas, A.P.; Fisher, D.; Li, R.A.; Theis, M.K.; Liu, L.; Fraser, J.R.; et al. Weight Outcomes of Sleeve Gastrectomy and Gastric Bypass Compared to Nonsurgical Treatment. Ann. Surg. 2021, 274, e1269–e1276. [Google Scholar] [CrossRef]
- Sánchez-Pernaute, A.; Herrera, M.Á.R.; Ferré, N.P.; Rodríguez, C.S.; Marcuello, C.; Pañella, C.; Antoñanzas, L.L.; Torres, A.; Pérez-Aguirre, E. Long-Term Results of Single-Anastomosis Duodeno-ileal Bypass with Sleeve Gastrectomy (SADI-S). Obes. Surg. 2022, 32, 682–689. [Google Scholar] [CrossRef]
- Brethauer, S.A.; Kim, J.; el Chaar, M.; Papasavas, P.; Eisenberg, D.; Rogers, A.; Ballem, N.; Kligman, M.; Kothari, S.; ASMBS Clinical Issues Committee. Standardized outcomes reporting in metabolic and bariatric surgery. Surg. Obes. Relat. Dis. 2015, 11, 489–506. [Google Scholar] [CrossRef]
- Gupta, S.R.; Zhou, Y.; Wadden, T.A.; Berkowitz, R.I.; Chao, A.M. A Systematic Review of Genetic Correlates of Weight Loss After Bariatric Surgery. Obes. Surg. 2021, 31, 4612–4623. [Google Scholar] [CrossRef]
- Ciudin, A.; Fidilio, E.; Ortiz, A.; Pich, S.; Salas, E.; Mesa, J.; Hernández, C.; Simó-Servat, O.; Lecube, A.; Simó, R. Genetic Testing to Predict Weight Loss and Diabetes Remission and Long-Term Sustainability after Bariatric Surgery: A Pilot Study. J. Clin. Med. 2019, 8, 964. [Google Scholar] [CrossRef] [PubMed] [Green Version]
- de Toro-Martín, J.; Guénard, F.; Tchernof, A.; Pérusse, L.; Marceau, S.; Vohl, M.C. Polygenic risk score for predicting weight loss after bariatric surgery. JCI Insight 2018, 3, 1–12. [Google Scholar] [CrossRef] [PubMed] [Green Version]
- Fairbrother, U.; Kidd, E.; Malagamuwa, T.; Walley, A. Genetics of Severe Obesity. Curr. Diabetes Rep. 2018, 18, 85. [Google Scholar] [CrossRef] [PubMed] [Green Version]
- Rinella, E.S.; Still, C.; Shao, Y.; Wood, G.C.; Chu, X.; Salerno, B.; Gerhard, G.S.; Ostrer, H. Genome-wide association of single-nucleotide polymorphisms with weight loss outcomes after Roux-en-Y gastric bypass surgery. J. Clin. Endocrinol. Metab. 2013, 98, 1131–1136. [Google Scholar] [CrossRef]
- Ciudin, A.; Fidilio, E.; Gutiérrez-Carrasquilla, L.; Caixàs, A.; Vilarrasa, N.; Pellitero, S.; Simó-Servat, A.; Vilallonga, R.; Ruiz, A.; de la Fuente, M.; et al. A Clinical-Genetic Score for Predicting Weight Loss after Bariatric Surgery: The OBEGEN Study. J. Pers. Med. 2021, 11, 1040. [Google Scholar] [CrossRef]
- Cooper, T.C.; Simmons, E.B.; Webb, K.; Burns, J.L.; Kushner, R.F. Trends in Weight Regain Following Roux-en-Y Gastric Bypass (RYGB) Bariatric Surgery. Obes. Surg. 2015, 25, 1474–1481. [Google Scholar] [CrossRef]
- de Vries, L.; Van den Broecke, C.; Decruyeneare, A.; Van Nieuwenhove, Y. A SIMPLE Performance Assessment of Bariatric Procedures and Post-operative Weight Regain. J. Gastrointest. Surg. 2022, 26, 542–549. [Google Scholar] [CrossRef]
- Belle, S.H.; Berk, P.D.; Courcoulas, A.P.; Engel, S.; Flum, D.R.; Gourash, W.; Horlick, M.; Hsu, J.Y.; Khandelwal, S.; Mitchell, J.E.; et al. Reporting weight change: Standardized reporting accounting for baseline weight. Surg. Obes. Relat. Dis. 2013, 9, 782–789. [Google Scholar] [CrossRef] [Green Version]
- Hameed, S.; Dhillo, W.S.; Bloom, S.R. Gut hormones and appetite control. Oral. Dis. 2009, 15, 18–26. [Google Scholar] [CrossRef]
- Holzer, P.; Farzi, A. Neuropeptides and the microbiota- Gut-brain axis. Adv. Exp. Med. Biol. 2014, 817, 196–219. [Google Scholar] [CrossRef] [Green Version]
- Murphy, K.G.; Dhillo, W.S.; Bloom, S.R. Gut peptides in the regulation of food intake and energy homeostasis. Endocr. Rev. 2006, 27, 719–727. [Google Scholar] [CrossRef] [PubMed] [Green Version]
- Casimiro, I.; Sam, S.; Brady, M.J. Endocrine implications of bariatric surgery: A review on the intersection between incretins, bone, and sex hormones. Physiol. Rep. 2019, 7, e14111. [Google Scholar] [CrossRef] [PubMed] [Green Version]


| Candidate Gen | SNP | Reference Allele | Assay ID |
|---|---|---|---|
| GHSR | rs572169 | C | C___1079489_20 |
| WFS1 | rs10010131 | A | C__30473796_10 |
| BDNF | rs6265 | C | C__11592758_10 |
| MC4R | rs17782313 | T | C__32667060_10 |
| GIPR | rs10423928 | T | C__30103605_10 |
| DPPIV | rs17759529 | C | C__34245343_10 |
| DPPIV | rs2389643 | C | C__15784426_10 |
| DPPIV | rs2268889 | C | C__15875589_10 |
| DPPIV | rs12995983 | T | C___2789708_20 |
| DPPIV | rs3788979 | C | C___2789710_10 |
| DPPIV | rs741529 | G | C___2789719_10 |
| DPPIV | rs12469968 | G | C___2789726_10 |
| DPPIV | rs1861975 | A | C___2789730_10 |
| NPY2R | rs6849115 | T | C__30852111_10 |
| NPY2R | rs11099992 | A | C_____44829_10 |
| NPY2R | rs6857715 | C | C__29013142_10 |
| NPY2R | rs1047214 | C | C___7427258_20 |
| NPY2R | rs17304901 | G | C__32705343_10 |
| NPY2R | rs11728843 | G | C__30852113_10 |
| NPY1R | rs9764 | T | C___8788046_10 |
| NPY1R | rs7687423 | A | C___8066900_10 |
| NPY1R | rs11100489 | T | C__31208177_10 |
| NPY5R | rs11100493 | T | C_____74249_10 |
| NPY5R | rs4632602 | C | C__29684077_20 |
| NPY5R | rs11724320 | T | C_____74248_10 |
| NPY5R | rs7678265 | C | C_____74246_30 |
| CLOCK | rs3749474 | C | C__26405955_10 |
| CLOCK | rs1801260 | A | C___8746719_20 |
| CLOCK | rs4580704 | G | C__28028791_10 |
| GLP1R | rs10305439 | C | C___2491169_10 |
| GLP1R | rs2143734 | A | C__16072581_20 |
| GLP1R | rs877446 | A | C__11607361_10 |
| GLP1R | rs6923761 | G | C__25615272_20 |
| GLP1R | rs932443 | T | C___2491141_10 |
| GLP1R | rs2300612 | T | C__15755173_10 |
| GLP1R | rs2268640 | G | C___2491124_10 |
| TCF7L2 | rs7903146 | C | C__29347861_10 |
| TCF7L2 | rs12255372 | G | C____291484_20 |
| KCNJ11 | rs5215 | C | C___2991148_10 |
| KCNJ11 | rs5218 | G | C___2991149_20 |
| KCNJ11 | rs5219 | T | C__11654065_10 |
| KCNJ11 | rs886288 | A | C___9686373_10 |
| FTO | rs9939609 | T | C__30090620_10 |
| FTO | rs9939973 | G | C__11776771_10 |
| PYY | rs2700831 | T | C___2964503_10 |
| PYY | rs9890045 | G | C__30502516_20 |
| PYY | rs1684668 | T | C__11887233_10 |
| PYY | rs1618809 | A | C__27061985_10 |
| Variable | Value |
|---|---|
| Age, in years | 44.79 ± 11.99 |
| Female gender, n (%) | 259 (69) |
| %TWL_nadir, | 38.79 ± 9.84 |
| %EWL_nadir, | 91.19 ± 23.69 |
| %TWL_6y | 31.67 ± 11.62 |
| %EWL_6y | 74.08 ± 26.89 |
| %EWL6y > 50%, n (%) | 311 (82.93) |
| %WR_MWL, median (IQR) | 15.76 (7.99–28.69) |
| %WR_MWL > 20%, n (%) | 154 (41.1) |
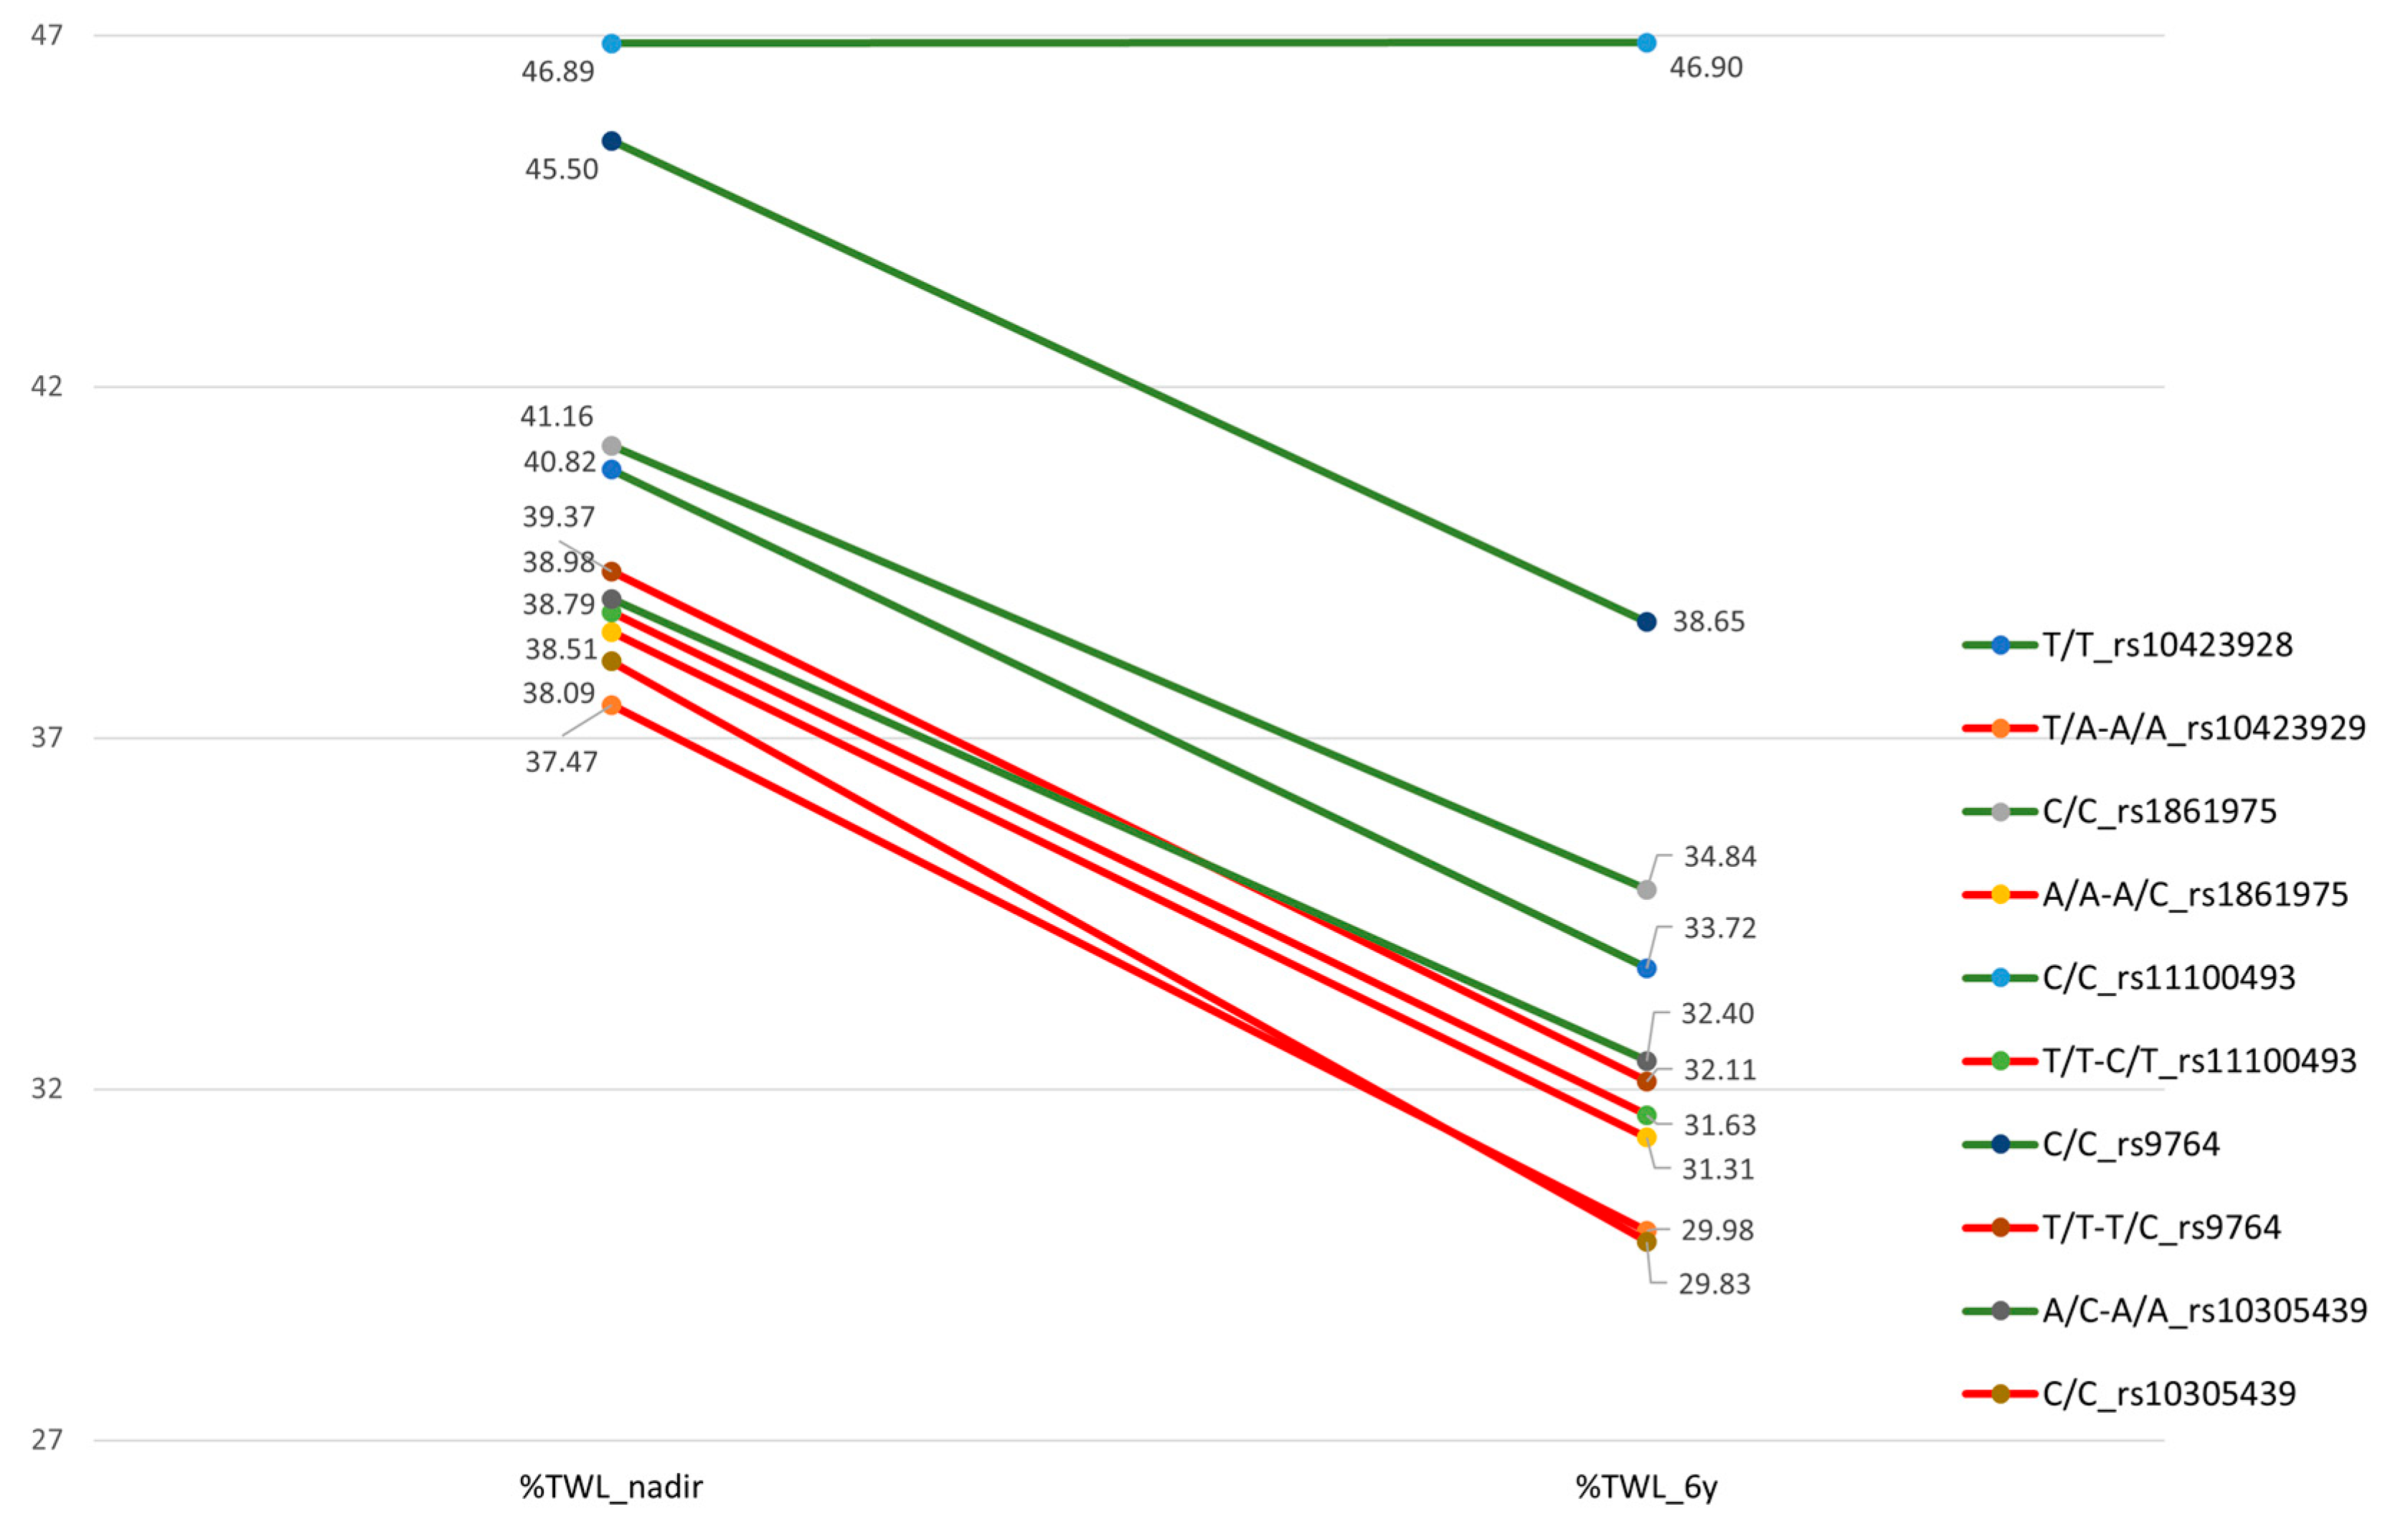
| Gene | SNP | %TWL_nadir | %TWL_6y | %WR_MWL | Risk Allele |
|---|---|---|---|---|---|
| GIPR | 10423928 | −3.32 (−5.53–−1.11); 0.0036 | −3.55 (−6.33–−0.77); 0.013 | A | |
| DPPIV | 1861975 | 2.92 (−0.11–5.72); 0.042 | 3.92 (0.47–7.36); 0.026 | A | |
| NPY1R | 9764 | 4.61 (0.09–9.13); 0.047 | T | ||
| NPY5R | 11100493 | 22.20 (2.19–42.20); 0.03 | T | ||
| CLOCK | 1801260 | 1.85 (0.07–3.62); 0.042 | −3.27 (−6.42–−0.12); 0.042 | A | |
| GLP1R | 10305439 | 2,71 (0.41–5.01); 0.022 | −4.88 (−8.84–−0.92); 0.016 | C | |
| GLP1R | 2143734 | −1.76 (−3.46–−0.05); 0.039 | G | ||
| GLP1R | 877446 | −5.03 (−9.72–0.34); 0.036 | A |
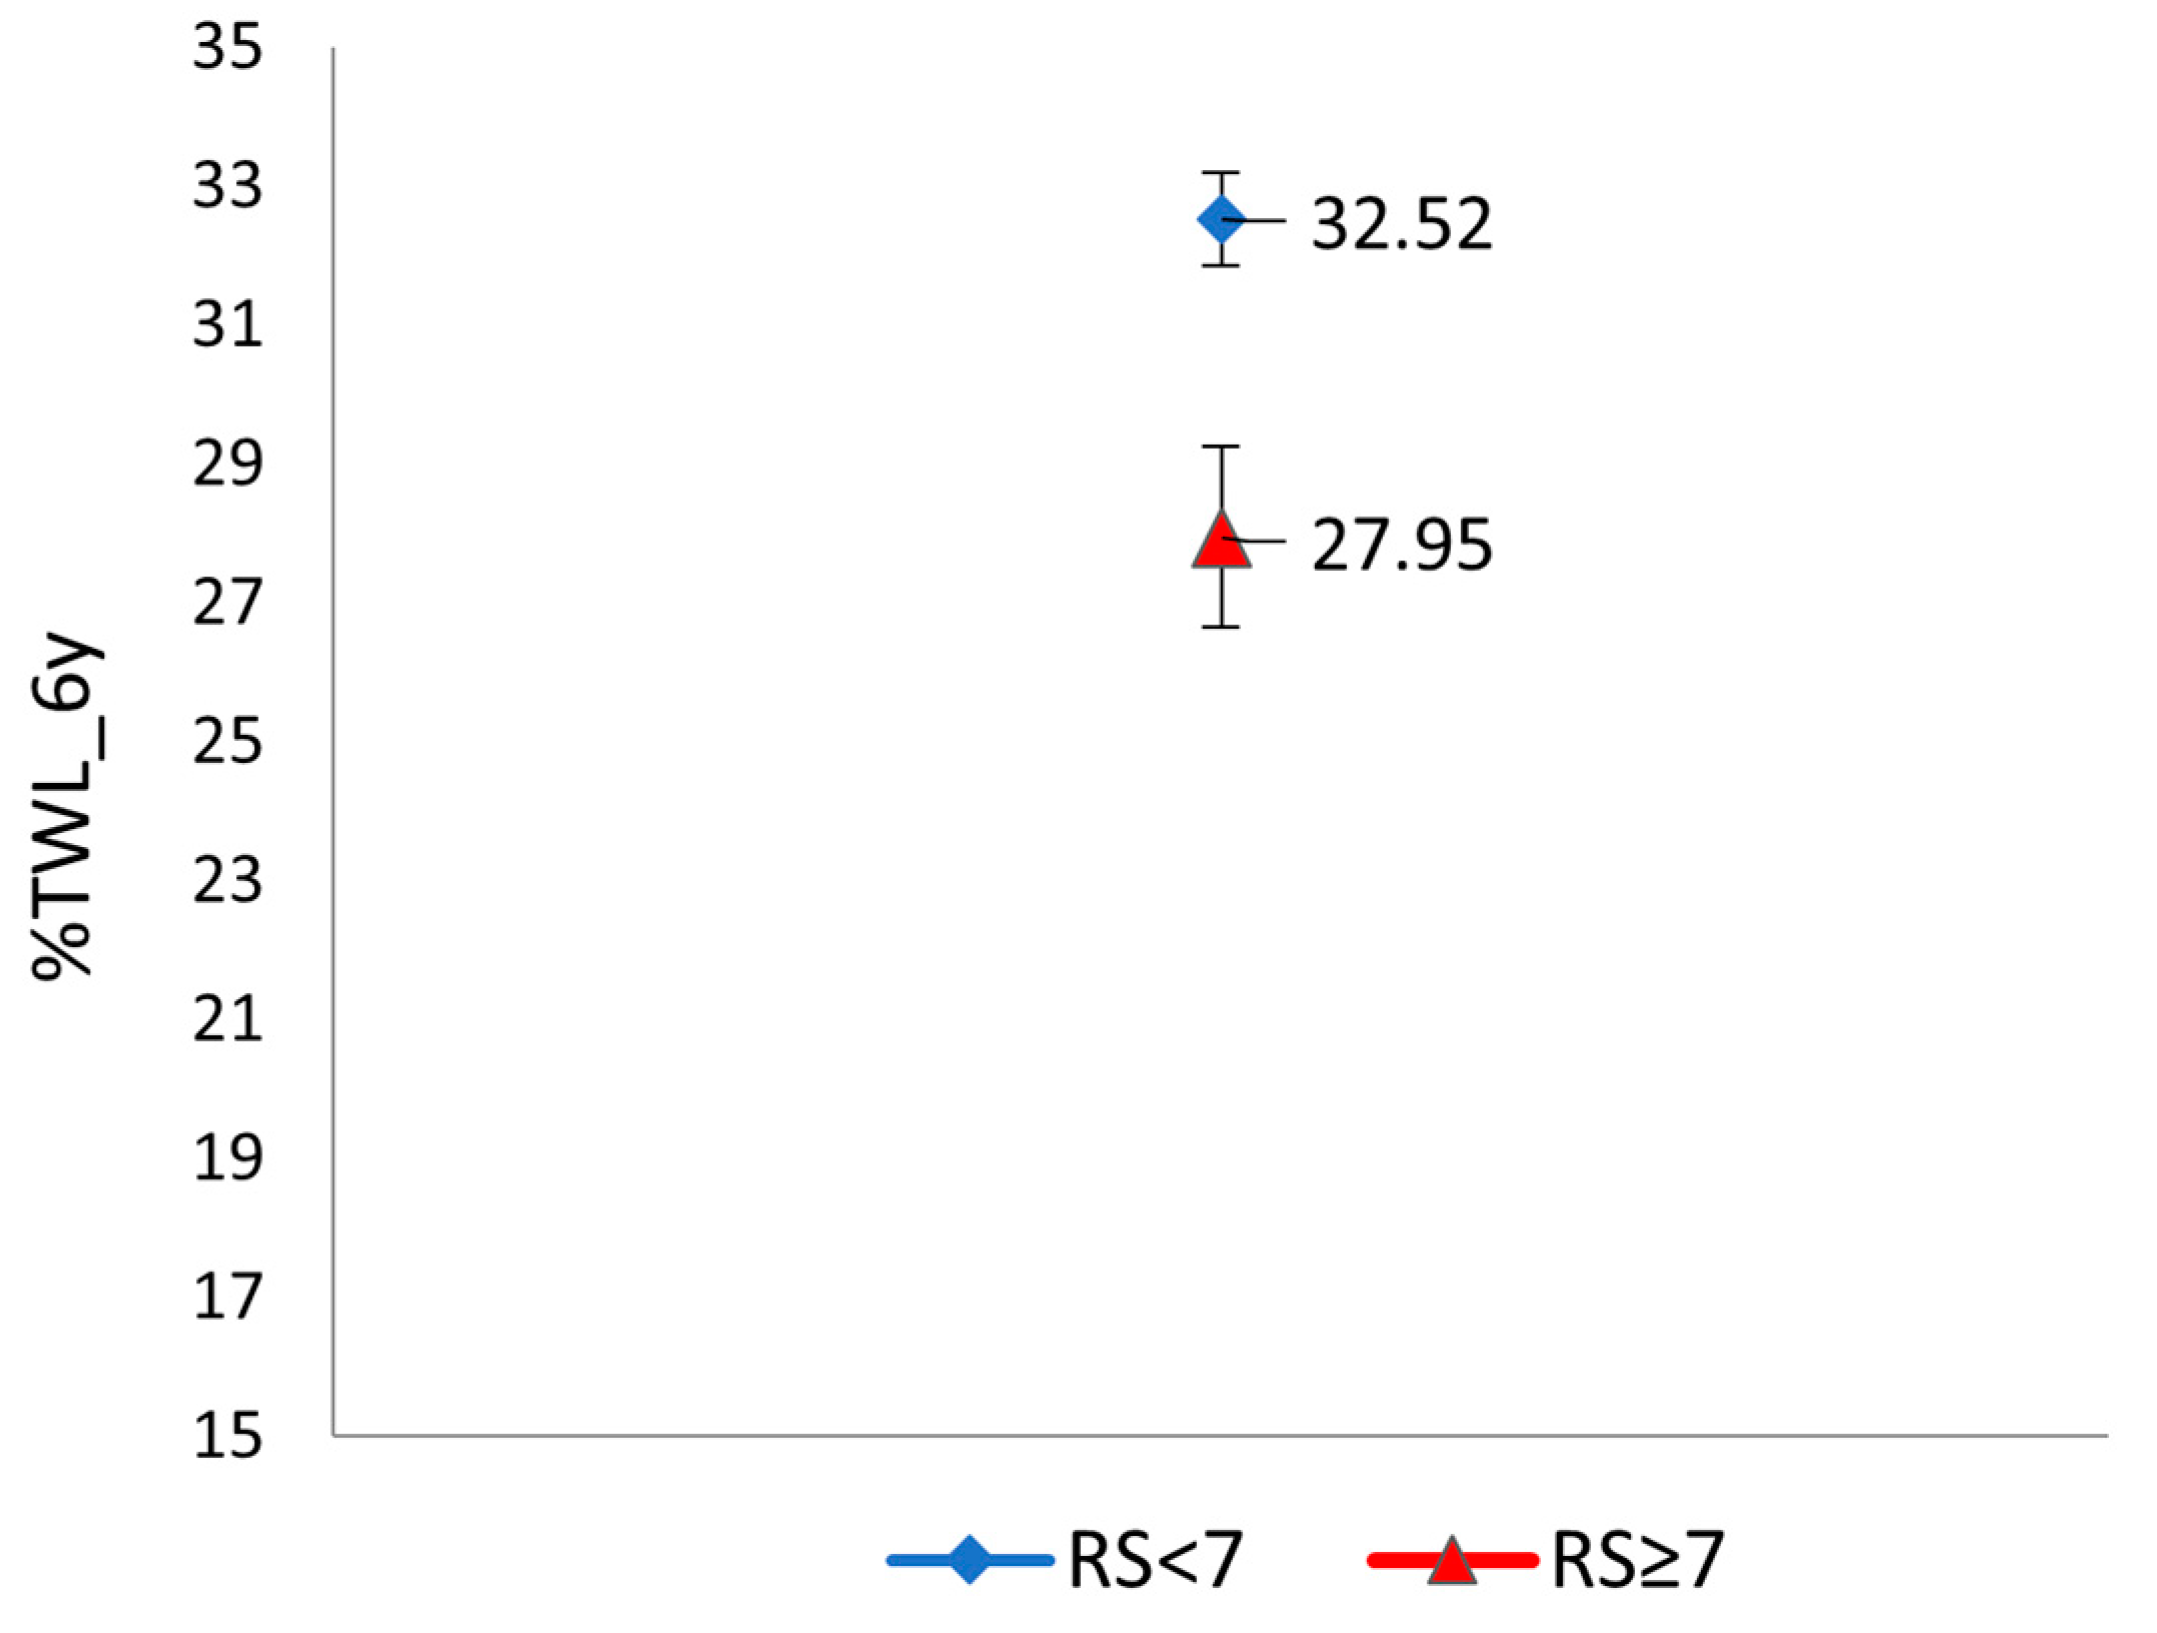
| RS_%TWL_6y Categories | |||
|---|---|---|---|
| Variable | RS < 7 N = 306 | RS ≥ 7 N = 70 | p |
| BMI_00, kg/m2 | 44.65 (6.50) | 45.77 (6.98) | 0.225 |
| Age, in years | 44.79 (12.25) | 44.77 (10.86) | 0.988 |
| Female gender, n (%) | 212 (69.51) | 47 (67.1) | 0.73 |
| T2D, n (%) | 108 (35.4) | 26 (37.1) | 0.77 |
| HTN, n (%) | 141 (46.22) | 41 (58.57) | 0.06 |
| Restrictive n (%) | 52 (17.05) | 8 (11.42) | 0.25 |
| Mixed, n (%) | 164 (53.77) | 41 (58.57) | 0.45 |
| Malabsorptive, n (%) | 89 (29.18) | 21 (30) | 0.87 |
Disclaimer/Publisher’s Note: The statements, opinions and data contained in all publications are solely those of the individual author(s) and contributor(s) and not of MDPI and/or the editor(s). MDPI and/or the editor(s) disclaim responsibility for any injury to people or property resulting from any ideas, methods, instructions or products referred to in the content. |
© 2023 by the authors. Licensee MDPI, Basel, Switzerland. This article is an open access article distributed under the terms and conditions of the Creative Commons Attribution (CC BY) license (https://creativecommons.org/licenses/by/4.0/).
Share and Cite
Torrego-Ellacuría, M.; Barabash, A.; Matía-Martín, P.; Sánchez-Pernaute, A.; Torres, A.J.; Calle-Pascual, A.L.; Rubio-Herrera, M.A. Combined Effect of Genetic Variants on Long-Term Weight Response after Bariatric Surgery. J. Clin. Med. 2023, 12, 4288. https://doi.org/10.3390/jcm12134288
Torrego-Ellacuría M, Barabash A, Matía-Martín P, Sánchez-Pernaute A, Torres AJ, Calle-Pascual AL, Rubio-Herrera MA. Combined Effect of Genetic Variants on Long-Term Weight Response after Bariatric Surgery. Journal of Clinical Medicine. 2023; 12(13):4288. https://doi.org/10.3390/jcm12134288
Chicago/Turabian StyleTorrego-Ellacuría, Macarena, Ana Barabash, Pilar Matía-Martín, Andrés Sánchez-Pernaute, Antonio J. Torres, Alfonso L. Calle-Pascual, and Miguel A. Rubio-Herrera. 2023. "Combined Effect of Genetic Variants on Long-Term Weight Response after Bariatric Surgery" Journal of Clinical Medicine 12, no. 13: 4288. https://doi.org/10.3390/jcm12134288