
Body Composition and Serum Concentration of Thyroid Hormones in Euthyroid Men and Women from General Population

 , , , and
Abstract
:1. Introduction
2. Materials and Methods
2.1. Subjects
2.2. Study Protocol
2.3. Biochemical Analyses
2.4. Body Composition Analysis
2.5. Calculations
2.6. Statistical Analysis
3. Results
4. Discussion
5. Conclusions
Author Contributions
Funding
Institutional Review Board Statement
Informed Consent Statement
Data Availability Statement
Conflicts of Interest
References
- Mili, N.; Paschou, S.A.; Goulis, D.G.; Dimopoulos, M.A.; Lambrinoudaki, I.; Psaltopoulou, T. Obesity, metabolic syndrome, and cancer: Pathophysiological and therapeutic associations. Endocrine 2021, 74, 479–497. [Google Scholar] [CrossRef] [PubMed]
- Wajchenberg, B.L. Subcutaneous and visceral adipose tissue: Their relation to the metabolic syndrome. Endocr. Rev. 2000, 21, 697–738. [Google Scholar] [CrossRef] [PubMed]
- Chlabicz, M.; Dubatówka, M.; Jamiołkowski, J.; Sowa, P.; Łapińska, M.; Raczkowski, A.; Łaguna, W.; Moniuszko-Malinowska, A.M.; Waszkiewicz, N.; Kowalska, I.; et al. Subjective well-being in non-obese individuals depends strongly on body composition. Sci. Rep. 2021, 11, 21797. [Google Scholar] [CrossRef] [PubMed]
- Taylor, P.N.; Razvi, S.; Pearce, S.H.; Dayan, C.M. Clinical review: A review of the clinical consequences of variation in thyroid function within the reference range. J. Clin. Endocrinol. Metab. 2013, 98, 3562–3571. [Google Scholar] [CrossRef] [PubMed] [Green Version]
- McAninch, E.A.; Bianco, A.C. Thyroid hormone signaling in energy homeostasis and energy metabolism. Ann. N. Y. Acad. Sci. 2014, 1311, 77–87. [Google Scholar] [CrossRef] [Green Version]
- Knudsen, N.; Laurberg, P.; Rasmussen, L.B.; Bülow, I.; Perrild, H.; Ovesen, L.; Jørgensen, T. Small differences in thyroid function may be important for body mass index and the occurrence of obesity in the population. J. Clin. Endocrinol. Metab. 2005, 90, 4019–4024. [Google Scholar] [CrossRef] [PubMed]
- Fox, C.S.; Pencina, M.J.; D’Agostino, R.B.; Murabito, J.M.; Seely, E.W.; Pearce, E.N.; Vasan, R.S. Relations of thyroid function to body weight: Cross-sectional and longitudinal observations in a community-based sample. Arch. Intern. Med. 2008, 168, 587–592. [Google Scholar] [CrossRef] [Green Version]
- Tiller, D.; Ittermann, T.; Greiser, K.H.; Meisinger, C.; Agger, C.; Hofman, A.; Thuesen, B.; Linneberg, A.; Peeters, R.; Franco, O.; et al. Association of Serum Thyrotropin with Anthropometric Markers of Obesity in the General Population. Thyroid 2016, 26, 1205–1214. [Google Scholar] [CrossRef]
- Kitahara, C.M.; Platz, E.A.; Ladenson, P.W.; Mondul, A.M.; Menke, A.; Berrington de González, A. Body fatness and markers of thyroid function among U.S. men and women. PLoS ONE. 2012, 7, e34979. [Google Scholar] [CrossRef] [Green Version]
- Reinehr, T. Obesity and thyroid function. Mol. Cell. Endocrinol. 2010, 316, 165–171. [Google Scholar] [CrossRef]
- Manji, N.; Boelaert, K.; Sheppard, M.C.; Holder, R.L.; Gough, S.C.; Franklyn, J.A. Lack of association between serum TSH or free T4 and body mass index in euthyroid subjects. Clin. Endocrinol. 2006, 64, 125–128. [Google Scholar] [CrossRef] [PubMed]
- Pinkney, J.H.; Goodrick, S.J.; Katz, J.; Johnson, A.B.; Lightman, S.L.; Coppack, S.W.; Mohamed-Ali, V. Leptin and the pituitary-thyroid axis: A comparative study in lean, obese, hypothyroid and hyperthyroid subjects. Clin. Endocrinol. 1998, 49, 583–588. [Google Scholar] [CrossRef] [PubMed]
- Chikunguwo, S.; Brethauer, S.; Nirujogi, V.; Pitt, T.; Udomsawaengsup, S.; Chand, B.; Schauer, P. Influence of obesity and surgical weight loss on thyroid hormone levels. Surg. Obes. Relat. Dis. 2007, 3, 631–635. [Google Scholar] [CrossRef] [PubMed]
- Kaenkumchorn, T.K.; Merritt, M.A.; Lim, U.; Le Marchand, L.; Boushey, C.J.; Shepherd, J.A.; Wilkens, L.R.; Ernst, T.; Lampe, J.W. Diet and Liver Adiposity in Older Adults: The Multiethnic Cohort Adiposity Phenotype Study. J. Nutr. 2021, 151, 3579–3587. [Google Scholar] [CrossRef] [PubMed]
- Prado, C.M.; Siervo, M.; Mire, E.; Heymsfield, S.B.; Stephan, B.C.; Broyles, S.; Smith, S.R.; Wells, J.C.; Katzmarzyk, P.T. A population-based approach to define body-composition phenotypes. Am. J. Clin. Nutr. 2014, 99, 1369–1377. [Google Scholar] [CrossRef] [PubMed] [Green Version]
- Matthews, D.R.; Hosker, J.P.; Rudenski, A.S.; Naylor, B.A.; Treacher, D.F.; Turner, R.C. Homeostasis model assessment: Insulin resistance and beta-cell function from fasting plasma glucose and insulin concentrations in man. Diabetologia 1985, 28, 412–419. [Google Scholar] [CrossRef] [Green Version]
- Proces, S.; Delgrange, E.; Vander Borght, T.V.; Jamart, J.; Donckier, J.E. Minor alterations in thyroid-function tests associated with diabetes mellitus and obesity in outpatients without known thyroid illness. Acta Clin. Belg. 2001, 56, 86–90. [Google Scholar] [CrossRef]
- Mauvais-Jarvis, F.; Clegg, D.J.; Hevener, A.L. The role of estrogens in control of energy balance and glucose homeostasis. Endocr. Rev. 2013, 34, 309–338. [Google Scholar] [CrossRef] [Green Version]
- Ren, R.; Jiang, X.; Zhang, X.; Guan, Q.; Yu, C.; Li, Y.; Gao, L.; Zhang, H.; Zhao, J. Association between thyroid hormones and body fat in euthyroid subjects. Clin. Endocrinol. 2014, 80, 585–590. [Google Scholar] [CrossRef]
- Michalaki, M.A.; Vagenakis, A.G.; Leonardou, A.S.; Argentou, M.N.; Habeos, I.G.; Makri, M.G.; Psyrogiannis, A.I.; Kalfarentzos, F.E.; Kyriazopoulou, V.E. Thyroid function in humans with morbid obesity. Thyroid 2006, 16, 73–78. [Google Scholar] [CrossRef]
- Kowalska, I.; Straczkowski, M.; Kinalska, I. Levels of leptin in plasma of patients with type 2 diabetes. Pol. Arch. Med. Wewn. 1998, 99, 470–476. [Google Scholar] [PubMed]
- Ortega, F.J.; Jílková, Z.M.; Moreno-Navarrete, J.M.; Pavelka, S.; Rodriguez-Hermosa, J.I.; Kopeck Ygrave, J.; Fernández-Real, J.M. Type I iodothyronine 5’-deiodinase mRNA and activity is increased in adipose tissue of obese subjects. Int. J. Obes. 2012, 36, 320–324. [Google Scholar] [CrossRef] [PubMed] [Green Version]
- Straczkowski, M.; Dzienis-Straczkowska, S.; Szelachowska, M.; Kowalska, I.; Stepień, A.; Kinalska, I. Insulin resistance in obese subjects with impaired glucose tolerance. Studies with hyperinsulinemic euglycemic clamp technique. Pol. Arch. Med. Wewn. 2003, 109, 359–364. [Google Scholar] [PubMed]
- Martinez-deMena, R.; Obregón, M.J. Insulin increases the adrenergic stimulation of 5’ deiodinase activity and mRNA expression in rat brown adipocytes; role of MAPK and PI3K. J. Mol. Endocrinol. 2005, 34, 139–151. [Google Scholar] [CrossRef] [PubMed] [Green Version]
- Mentuccia, D.; Thomas, M.J.; Coppotelli, G.; Reinhart, L.J.; Mitchell, B.D.; Shuldiner, A.R.; Celi, F.S. The Thr92Ala deiodinase type 2 (DIO2) variant is not associated with type 2 diabetes or indices of insulin resistance in the old order of Amish. Thyroid 2005, 15, 1223–1227. [Google Scholar] [CrossRef] [PubMed]
- Samuels, M.H.; Kolobova, I.; Antosik, M.; Niederhausen, M.; Purnell, J.Q.; Schuff, K.G. Thyroid Function Variation in the Normal Range, Energy Expenditure, and Body Composition in L-T4-Treated Subjects. J. Clin. Endocrinol. Metab. 2017, 102, 2533–2542. [Google Scholar] [CrossRef]
- Muscogiuri, G.; Sorice, G.P.; Mezza, T.; Prioletta, A.; Lassandro, A.P.; Pirronti, T.; Della Casa, S.; Pontecorvi, A.; Giaccari, A. High-normal TSH values in obesity: Is it insulin resistance or adipose tissue’s guilt? Obesity (Silver Spring) 2013, 21, 101–106. [Google Scholar] [CrossRef]
- Witte, T.; Völzke, H.; Lerch, M.M.; Hegenscheid, K.; Friedrich, N.; Ittermann, T.; Batsis, J.A. Association between Serum Thyroid-Stimulating Hormone Levels and Visceral Adipose Tissue: A Population-Based Study in Northeast Germany. Eur. Thyroid J. 2017, 6, 12–19. [Google Scholar] [CrossRef] [Green Version]


| Lean Women (n = 160) | Overweight/Obese Women (n = 156) | p | |
|---|---|---|---|
| Age (years) | 44.5 (36.5–59) | 52 (42–60) | 0.01 |
| BMI (kg/m2) | 22.3 (20.4–23.4) | 28.9 (26.8–32.3) | <0.01 |
| WHR | 0.78 (0.75–0.83) | 0.83 (0.8–0.88) | <0.01 |
| Total cholesterol (mg/dL) | 187 (161–210) | 193 (173–222) | 0.04 |
| HDL cholesterol (mg/dL) | 72 (61–80) | 61 (53–71) | <0.01 |
| LDL cholesterol (mg/dL) | 115 (95–139) | 128 (104–153) | <0.01 |
| Triglycerides (mg/dL) | 74 (58–97) | 102 (72–139) | <0.01 |
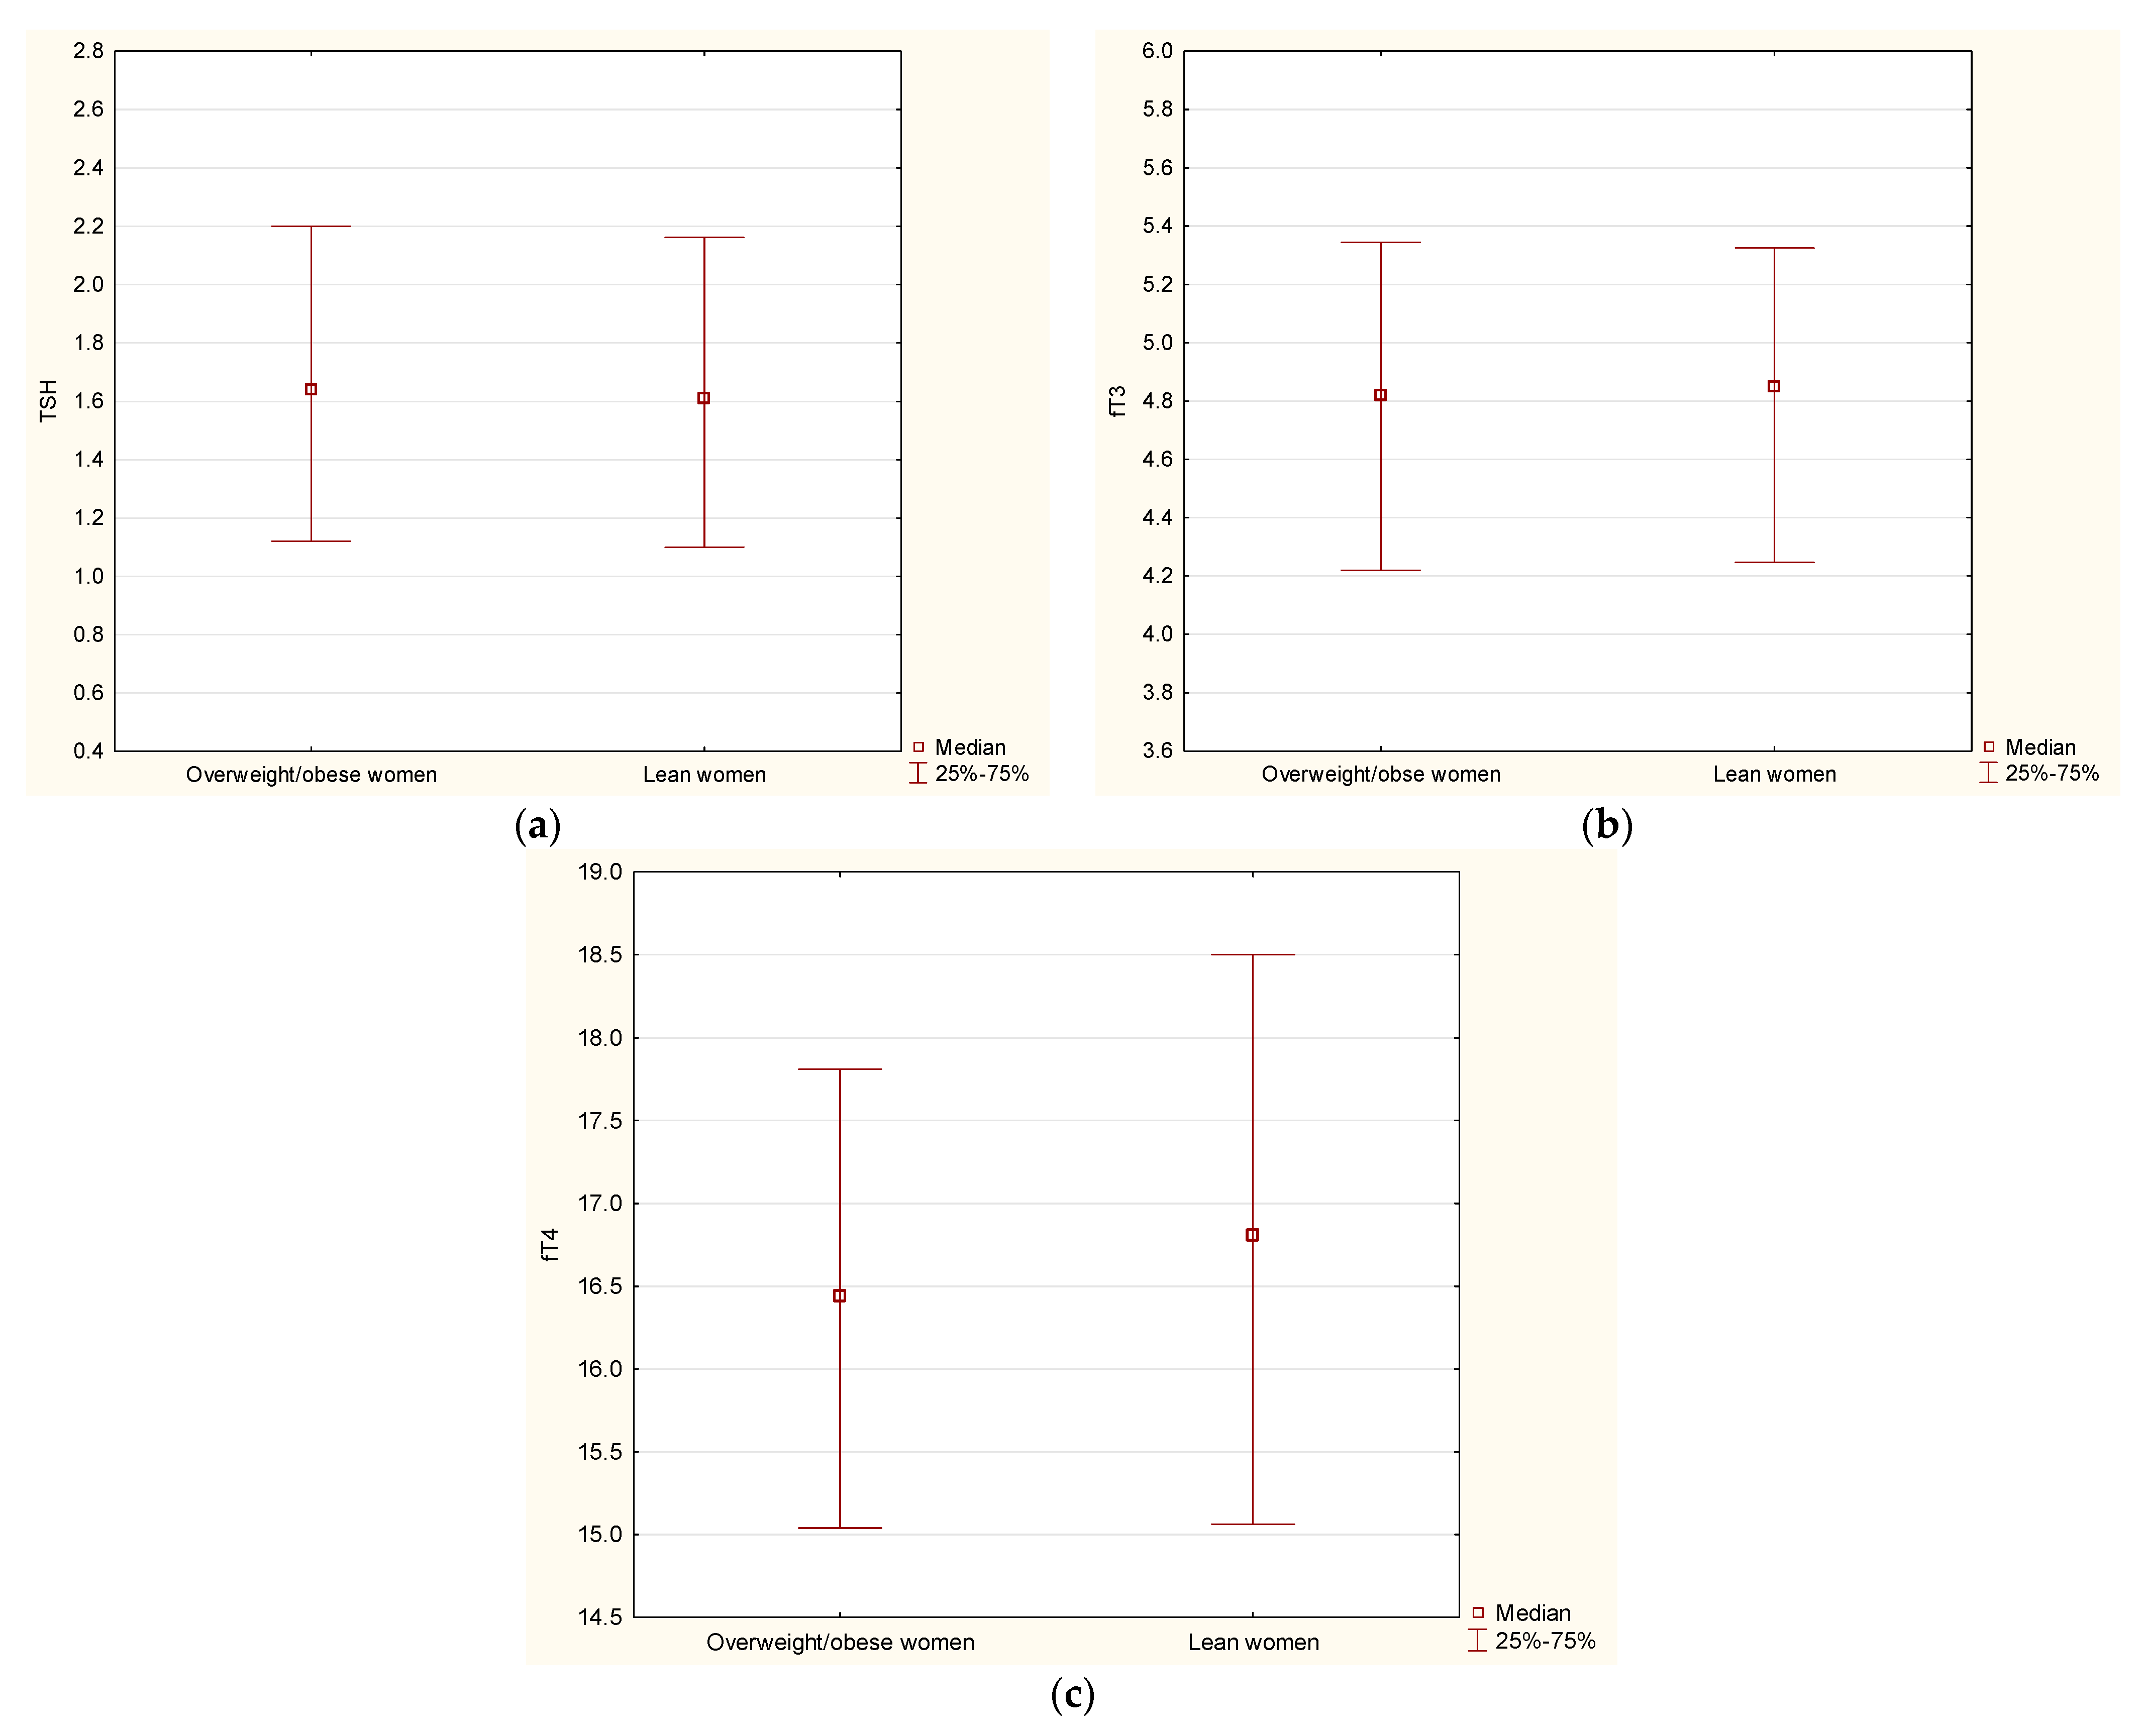
| TSH (uIU/mL) | 1.61 (1.1–2.16) | 1.63 (1.09–2.21) | 0.89 |
| fT4 (pmol/L) | 16.8 (15.1–18.5) | 16.6 (15.1–17.9) | 0.19 |
| fT3 (pg/mL) | 4.85 (4.25–5.33) | 4.84 (4.24–5.35) | 0.92 |
| Total fat mass (kg) | 19.5 (16.2–21.6) | 31.3 (27.8–37.7) | <0.01 |
| Gynoid fat mass (kg) | 3.4 (2.9–3.9) | 5.2 (4.6–6.1) | <0.01 |
| Android fat mass (kg) | 1.3 (0.9–1.7) | 2.8 (2.3–3.5) | <0.01 |
| Total lean mass (kg) | 38.5 (36.2–41.2) | 43 (41–47) | <0.01 |
| Android lean mass (kg) | 2.7 (2.5–2.9) | 3.0 (2.8–3.3) | <0.01 |
| Gynoid lean mass (kg) | 3.4 (3.0–3.9) | 6.5 (6.1–7.1) | <0.01 |
| VAT mass (g) | 302 (182–500) | 1187 (703–1594) | <0.01 |
| HOMA-IR | 1.74 (1.39–2.34) | 2.96 (2.17–4.02) | <0.01 |
| Lean Men (n = 84) | Overweight/Obese Men (n = 182) | p | |
|---|---|---|---|
| Age (years) | 38.5 (30–57) | 45.5 (36–59) | 0.02 |
| BMI (kg/m2) | 22.9 (21.6–24.2) | 28.7 (26.6–30.9) | <0.01 |
| WHR | 0.88 (0.85–0.92) | 0.96 (0.92–1) | <0.01 |
| Total cholesterol (mg/dL) | 180 (154–206) | 188 (167–218) | 0.05 |
| HDL cholesterol (mg/dL) | 59 (52–69) | 49 (42–59) | <0.01 |
| LDL cholesterol (mg/dL) | 115 (92–141) | 128 (108–149) | <0.01 |
| Triglycerides (mg/dL) | 86 (58–100) | 118 (80–166) | <0.01 |
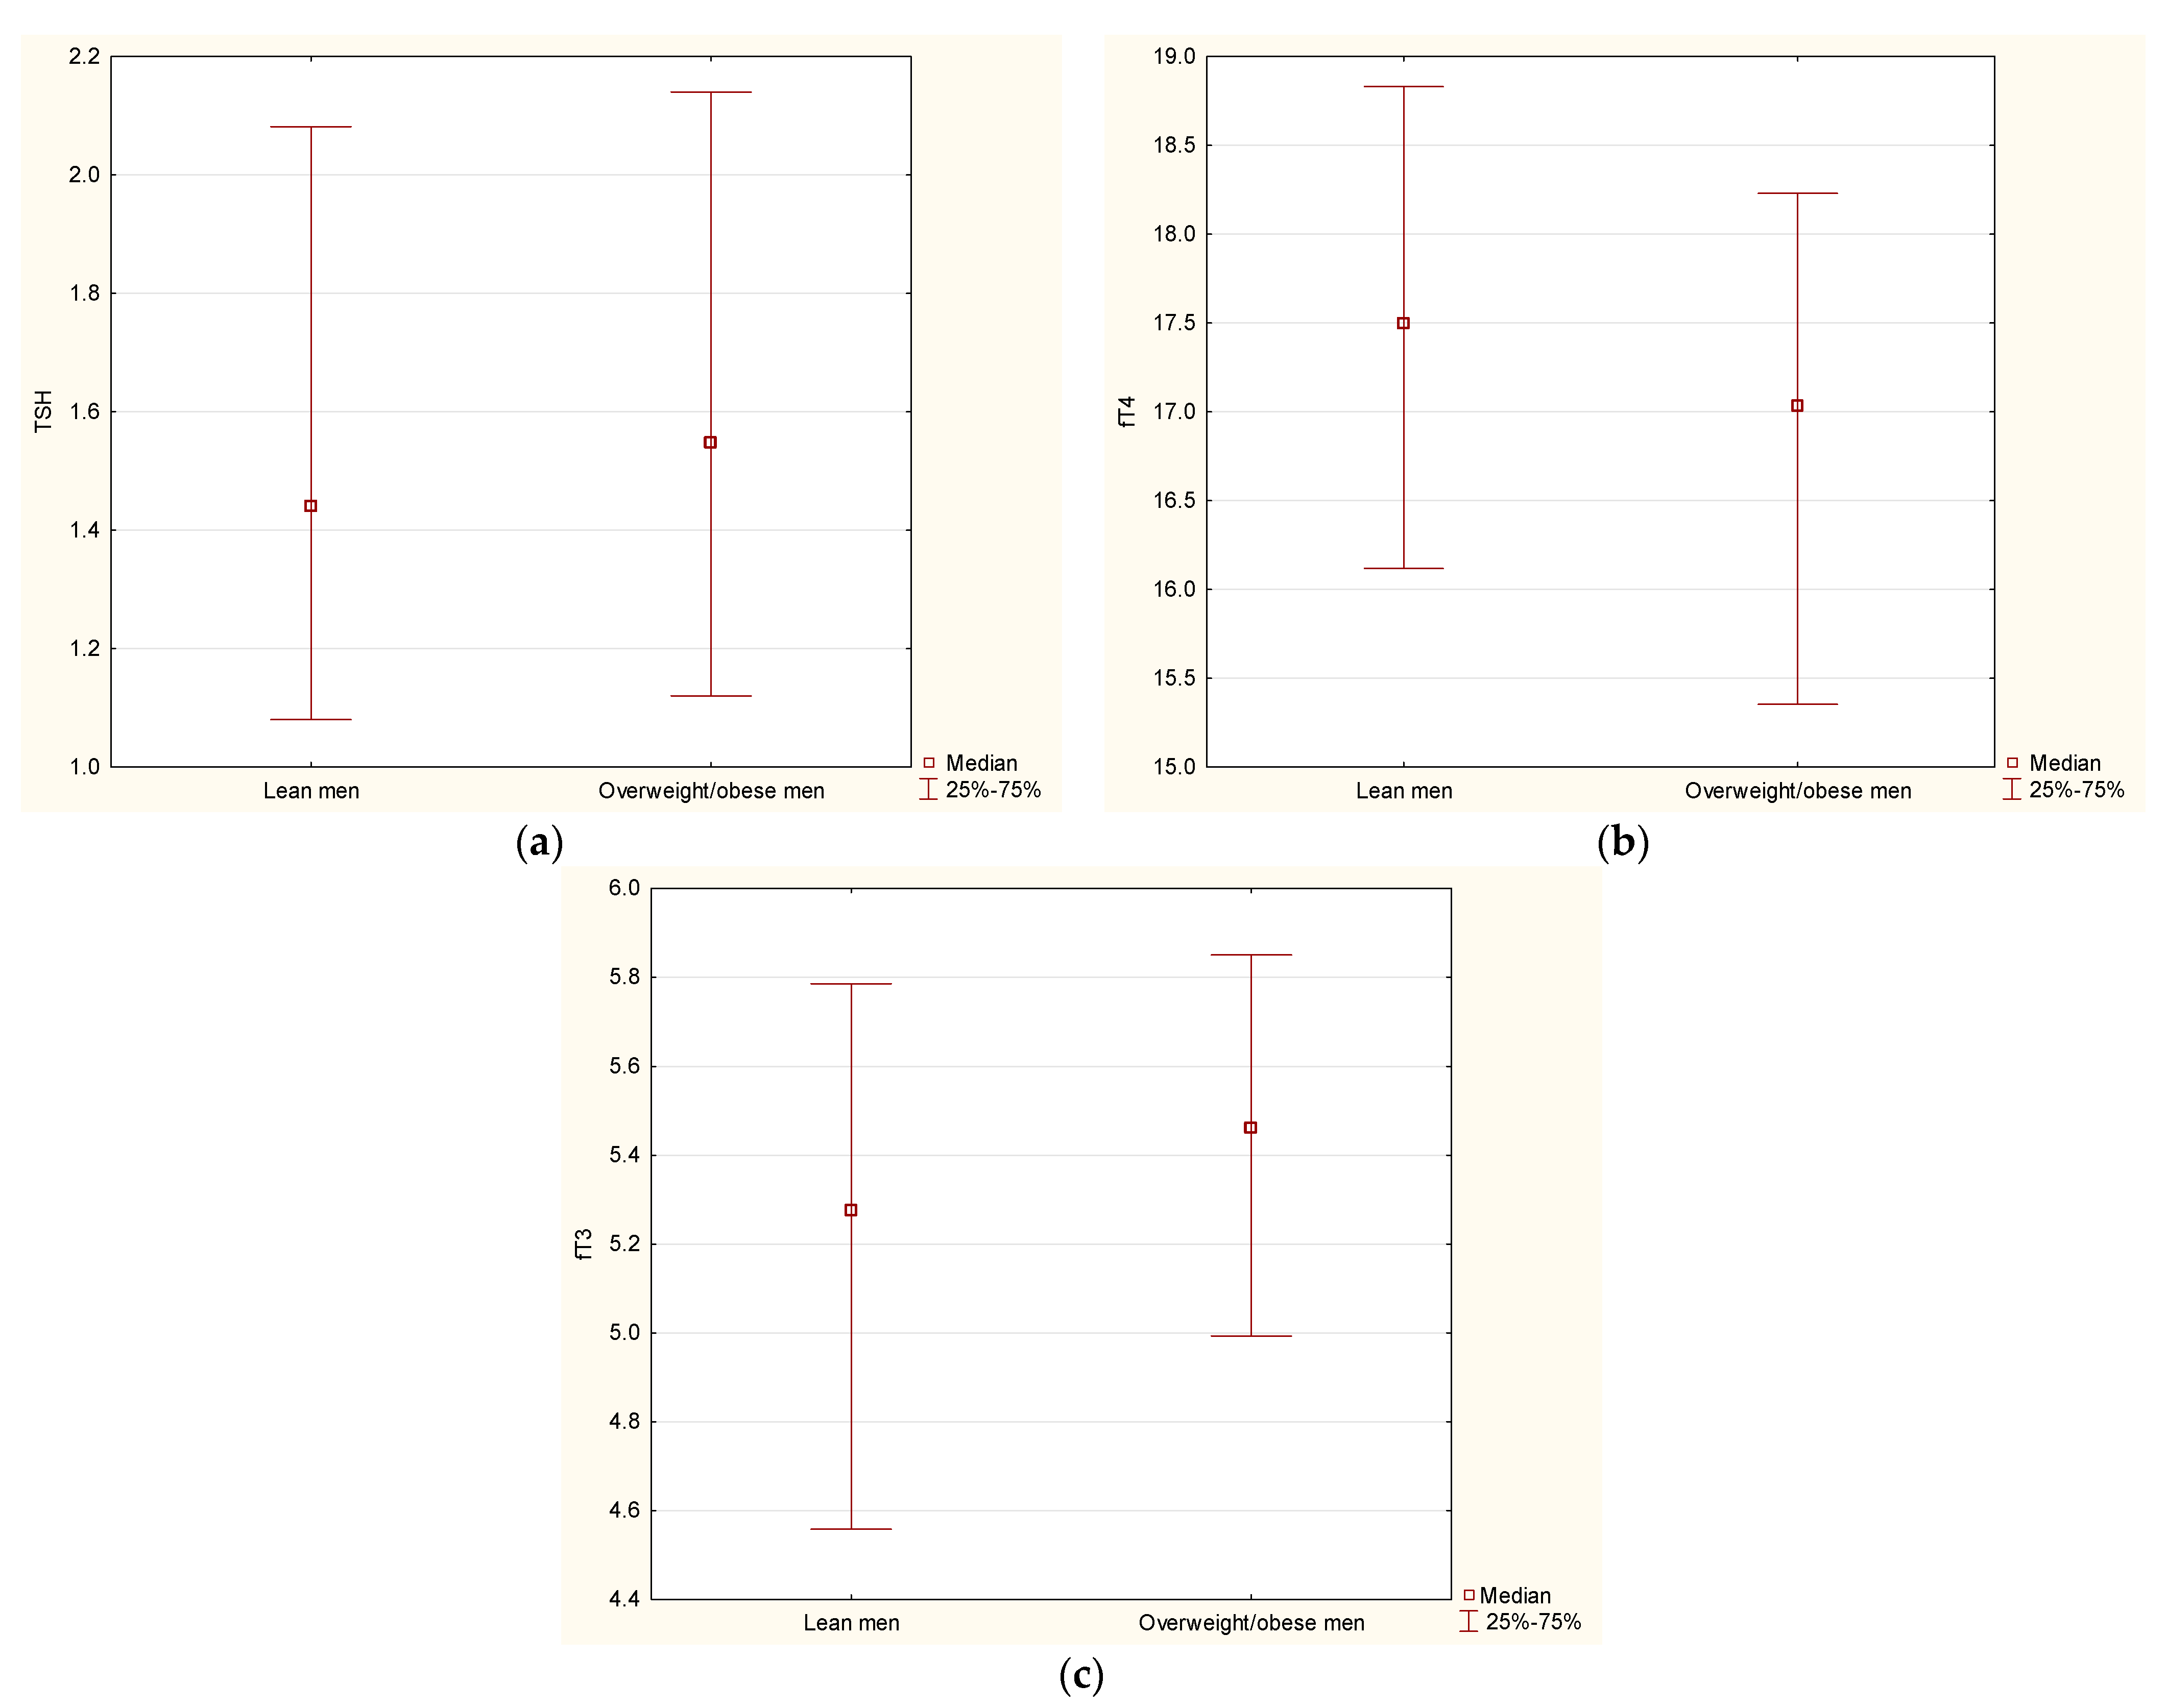
| TSH (uIU/mL) | 1.44 (1.08–2.08) | 1.54 (1.12–2.13) | 0.38 |
| fT4 (pmol/L) | 17.49 (16.12–18.83) | 16.98 (15.35–18.21) | 0.03 |
| fT3 (pg/mL) | 5.28 (4.56–5.79) | 5.42 (4.98–5.82) | 0.04 |
| Total fat mass (kg) | 16.1 (12.4–19.4) | 27.9 (23.4–33.1) | <0.01 |
| Gynoid fat mass (kg) | 2.4 (1.9–2.9) | 3.8 (3.1–4.5) | <0.01 |
| Android fat mass (kg) | 1.2 (0.8–1.8) | 3.1 (2.3–3.9) | <0.01 |
| Total lean mass (kg) | 52.5 (49–58.9) | 60.5 (56–65.2) | <0.01 |
| Android lean mass (kg) | 3.6 (3.3–3.9) | 4.0 (3.8–4.4) | <0.01 |
| Gynoid lean mass (kg) | 7.8 (7.2–8.6) | 9.0 (8.3–9.8) | <0.01 |
| VAT mass (g) | 619 (330–1024) | 1922 (1314–2646) | <0.01 |
| HOMA-IR | 1.76 (1.29–2.27) | 3.33 (2.22–5.04) | <0.01 |
| Lean Women (n = 160) | Overweight/Obese Women (n = 156) | |||||
|---|---|---|---|---|---|---|
| TSH | fT3 | fT4 | TSH | fT4 | fT3 | |
| Total fat mass (kg) | r = −0.01, p = 0.8 | r = −0.11, p = 0.16 | r = 0.1, p = 0.19 | r = 0.04, p = 0.5 | r = −0.09, p = 0.22 | r = −0.04, p = 0.54 |
| Gynoid fat mass (kg) | r = −0.02, p = 0.7 | r = −0.09, p = 0.22 | r = 0.03, p = 0.62 | r = 0.05, p = 0.5 | r = −0.12, p = 0.11 | r = −0.02, p = 0.77 |
| Android fat mass (kg) | r = 0.01, p = 0.8 | r = −0.08, p = 0.28 | r = 0.11, p = 0.14 | r = −0.02, p = 0.7 | r = −0.05, p = 0.50 | r = −0.08, p = 0.29 |
| VAT mass (g) | r = −0.03, p = 0.6 | r < 0.01, p = 0.92 | r = 0.1, p = 0.19 | r = −0.07, p = 0.3 | r < −0.01, p = 0.96 | r = 0.01, p = 0.83 |
| Lean Men (n = 84) | Overweight/Obese Men (n = 182) | |||||
|---|---|---|---|---|---|---|
| TSH | fT3 | fT4 | TSH | fT3 | fT4 | |
| Total fat mass (kg) | r = −0.09, p = 0.37 | r = 0.01, p = 0.88 | r = 0.09, p = 0.3 | r = 0.05, p = 0.42 | r = 0.16, p = 0.02 | r = −0.04, p = 0.5 |
| Gynoid fat mass (kg) | r = 0.01, p = 0.91 | r < 0.01, p = 0.97 | r = 0.2, p = 0.05 | r = 0.12, p = 0.08 | r = 0.17, p = 0.01 | r = −0.04, p = 0.5 |
| Android fat mass (kg) | r = −0.20, p = 0.06 | r = 0.02, p = 0.85 | r = 0.07, p = 0.4 | r = 0.02, p = 0.70 | r = 0.15, p = 0.03 | r = −0.05, p = 0.4 |
| VAT mass (g) | r = −0.24, p = 0.02 | r < −0.01, p = 0.98 | r = 0.03, p = 0.7 | r = −0.08, p = 0.26 | r = 0.03, p = 0.63 | r = −0.09, p = 0.2 |
Publisher’s Note: MDPI stays neutral with regard to jurisdictional claims in published maps and institutional affiliations. |
© 2022 by the authors. Licensee MDPI, Basel, Switzerland. This article is an open access article distributed under the terms and conditions of the Creative Commons Attribution (CC BY) license (https://creativecommons.org/licenses/by/4.0/).
Share and Cite
Adamska, A.; Raczkowski, A.; Stachurska, Z.; Kondraciuk, M.; Krętowski, A.J.; Adamski, M.; Kowalska, I.; Kamiński, K.A. Body Composition and Serum Concentration of Thyroid Hormones in Euthyroid Men and Women from General Population. J. Clin. Med. 2022, 11, 2118. https://doi.org/10.3390/jcm11082118
Adamska A, Raczkowski A, Stachurska Z, Kondraciuk M, Krętowski AJ, Adamski M, Kowalska I, Kamiński KA. Body Composition and Serum Concentration of Thyroid Hormones in Euthyroid Men and Women from General Population. Journal of Clinical Medicine. 2022; 11(8):2118. https://doi.org/10.3390/jcm11082118
Chicago/Turabian StyleAdamska, Agnieszka, Andrzej Raczkowski, Zofia Stachurska, Marcin Kondraciuk, Adam Jacek Krętowski, Marcin Adamski, Irina Kowalska, and Karol Adam Kamiński. 2022. "Body Composition and Serum Concentration of Thyroid Hormones in Euthyroid Men and Women from General Population" Journal of Clinical Medicine 11, no. 8: 2118. https://doi.org/10.3390/jcm11082118