
Quantification of Bacteria in Mouth-Rinsing Solution for the Diagnosis of Periodontal Disease

 , and
, and
Abstract
:1. Introduction
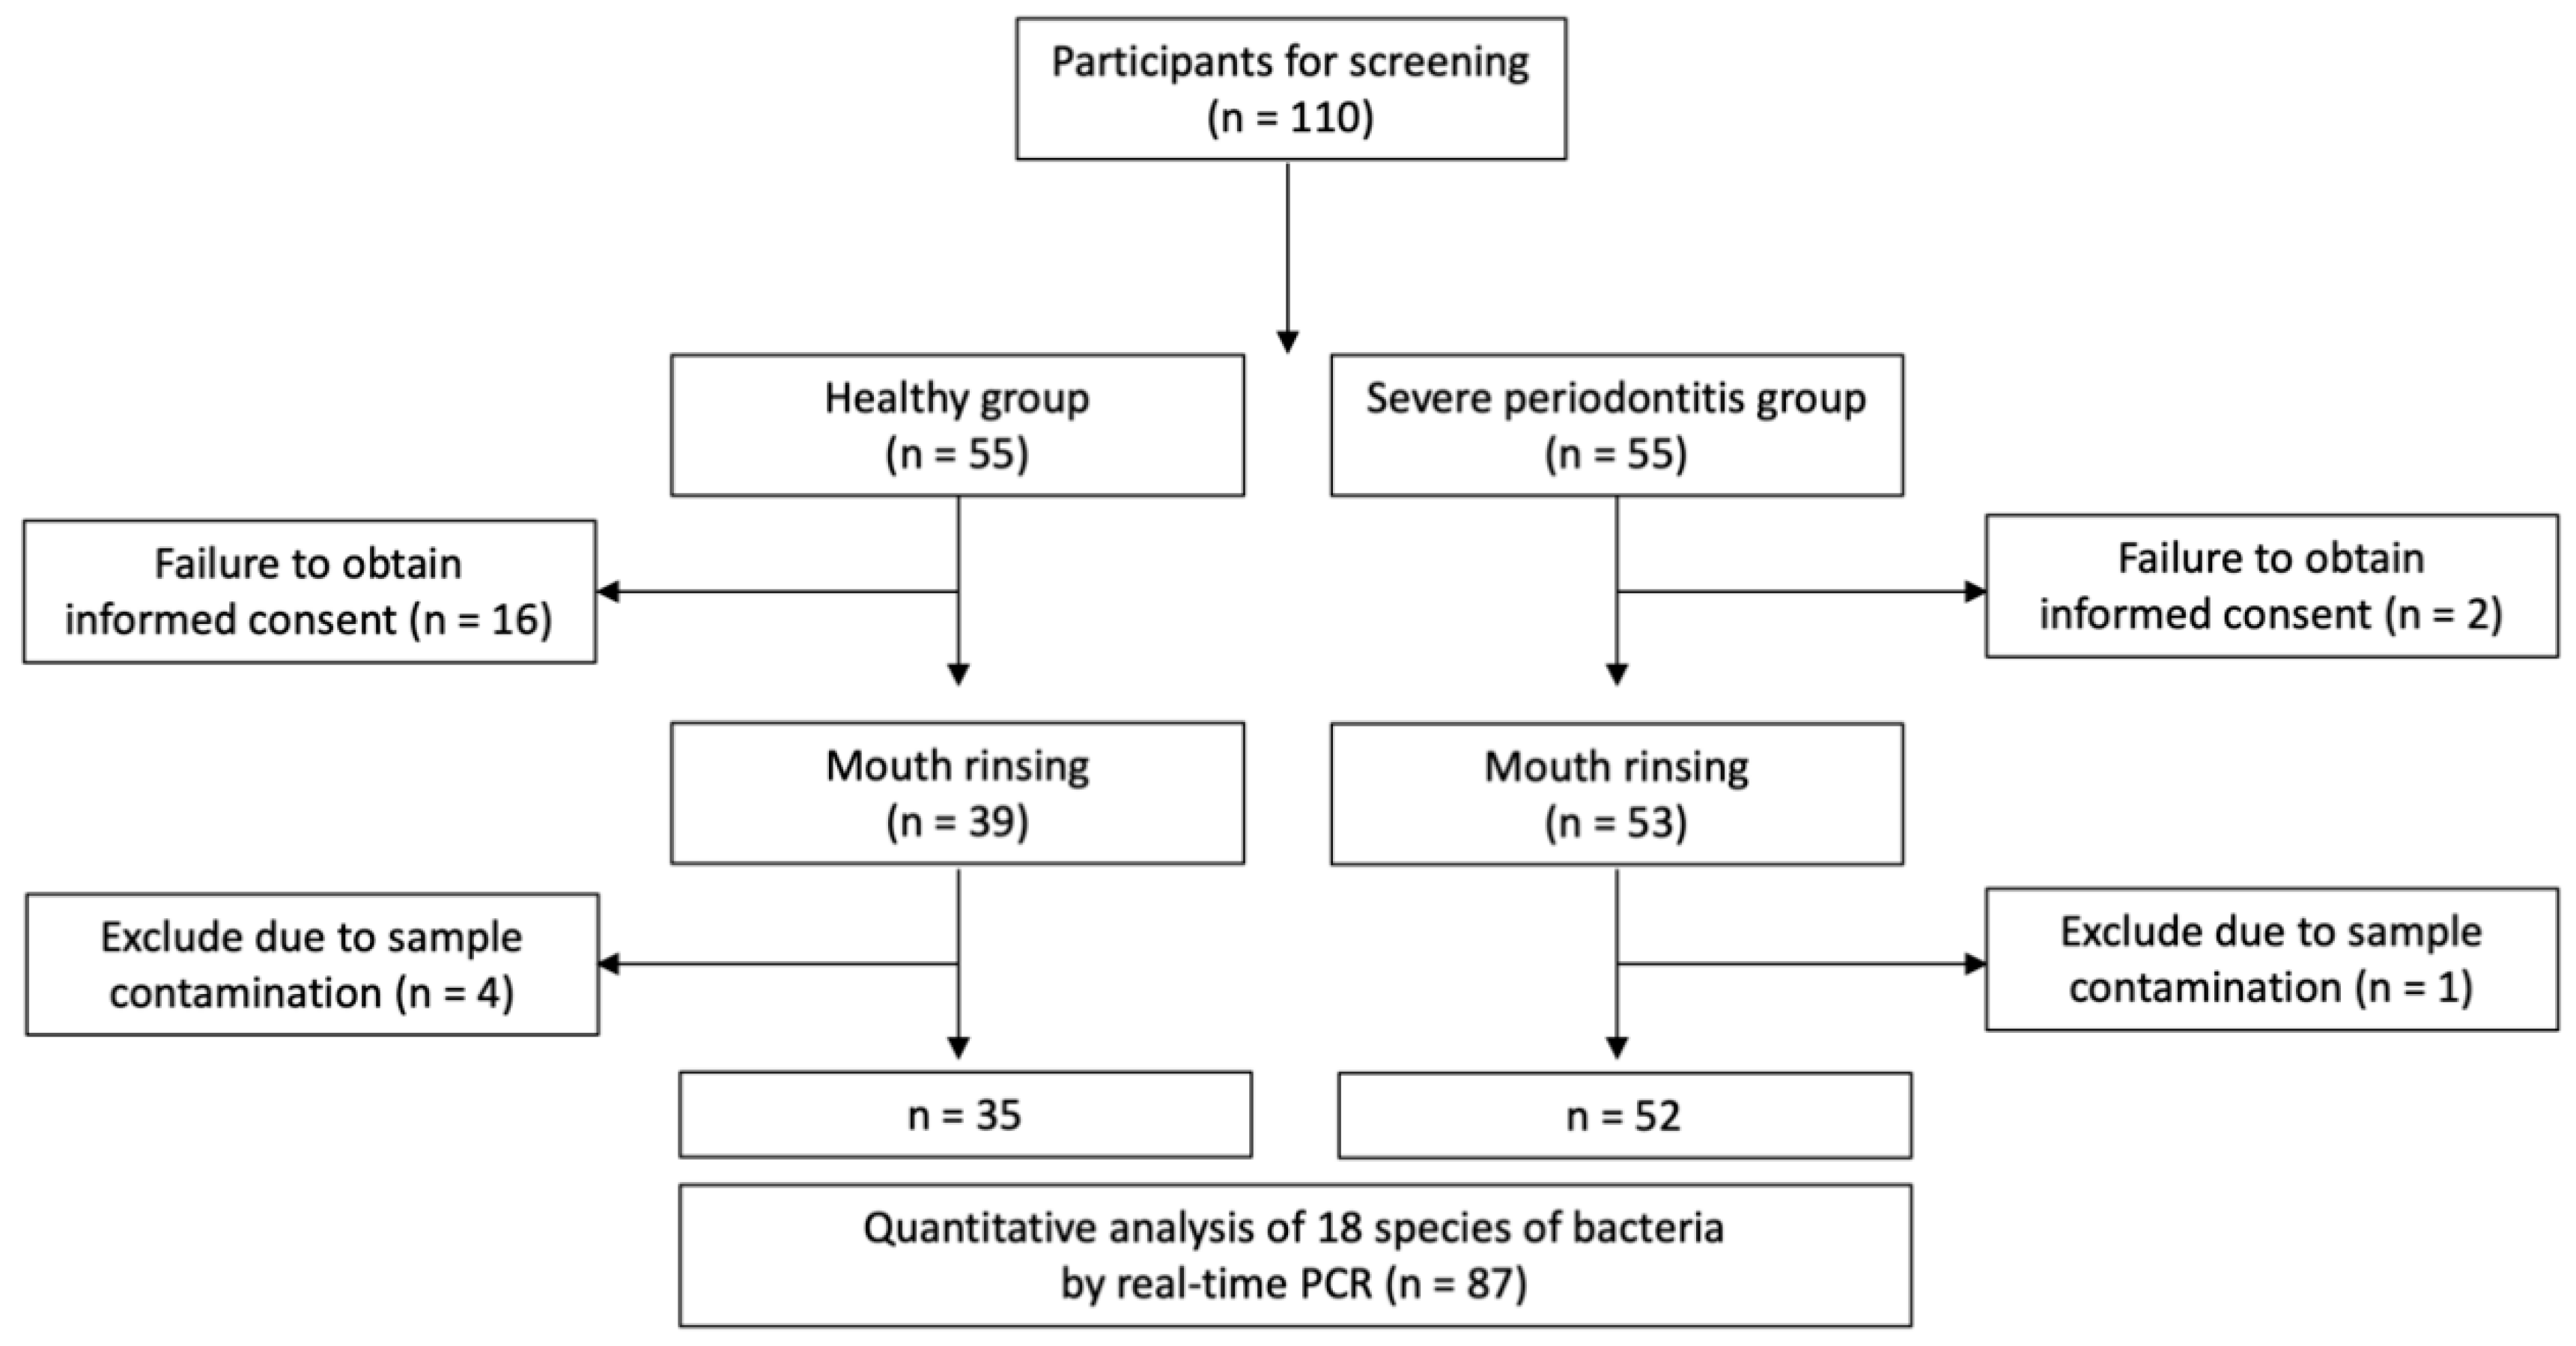
2. Materials and Methods
2.1. Patient Selection
2.2. Sample Size Determination
2.3. Periodontal Examination
2.4. Sample Collection and DNA Extraction
2.5. Multiplex Quantitative RT-PCR (qPCR)
2.6. Bacterial Quantification
2.7. Statistical Analysis
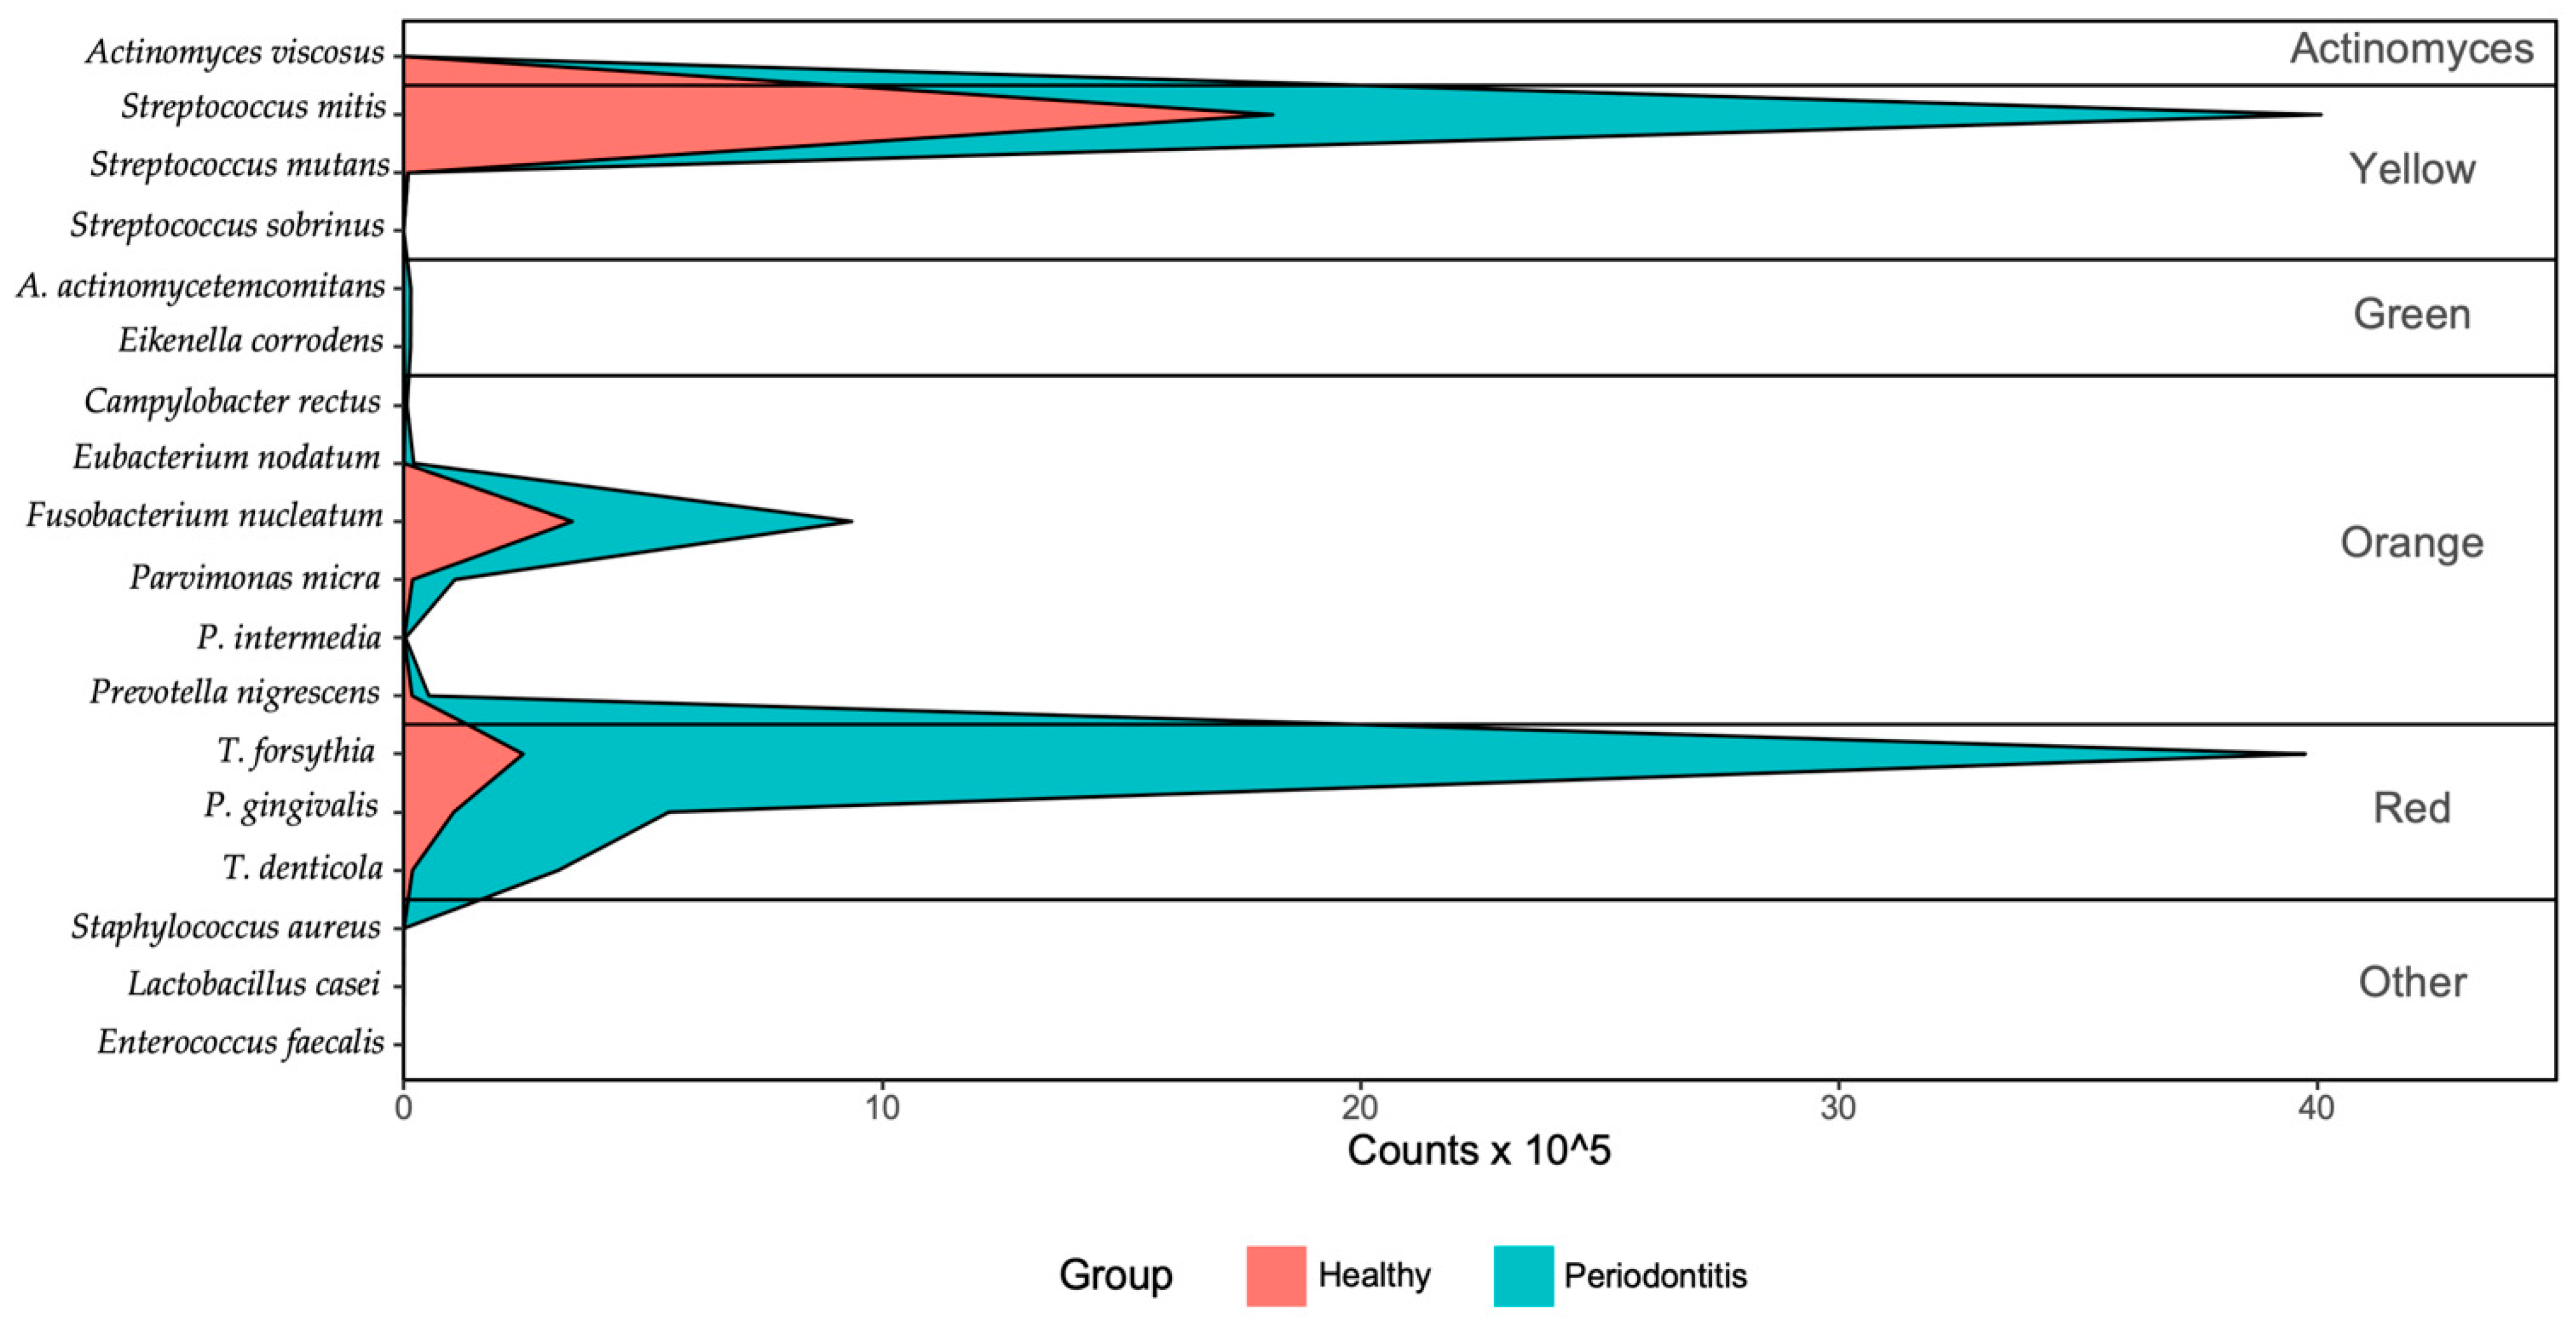
3. Results
4. Discussion
Author Contributions
Funding
Institutional Review Board Statement
Informed Consent Statement
Data Availability Statement
Conflicts of Interest
References
- Socransky, S.S.; Haffajee, A.D.; Cugini, M.A.; Smith, C.; Kent, R.L., Jr. Microbial complexes in subgingival plaque. J. Clin. Periodontol. 1998, 25, 134–144. [Google Scholar] [CrossRef]
- Papapanou, P.N.; Teanpaisan, R.; Obiechina, N.S.; Pithpornchaiyakul, W.; Pongpaisal, S.; Pisuithanakan, S.; Baelum, V.; Fejerskov, O.; Dahlen, G. Periodontal microbiota and clinical periodontal status in a rural sample in southern Thailand. Eur. J. Oral Sci. 2002, 110, 345–352. [Google Scholar] [CrossRef]
- Pradhan-Palikhe, P.; Mäntylä, P.; Paju, S.; Buhlin, K.; Persson, G.R.; Nieminen, M.S.; Sinisalo, J.; Pussinen, P.J. Subgingival Bacterial Burden in Relation to Clinical and Radiographic Periodontal Parameters. J. Periodontol. 2013, 84, 1809–1817. [Google Scholar] [CrossRef]
- Hyvärinen, K.; Laitinen, S.; Paju, S.; Hakala, A.; Suominen-Taipale, L.; Skurnik, M.; Könönen, E.; Pussinen, P.J. Detection and quantification of five major periodontal pathogens by single copy gene-based real-time PCR. Innate Immun. 2009, 15, 195–204. [Google Scholar] [CrossRef] [Green Version]
- Paju, S.; Pussinen, P.J.; Suominen-Taipale, L.; Hyvönen, M.; Knuuttila, M.; Könönen, E. Detection of Multiple Pathogenic Species in Saliva is Associated with Periodontal Infection in Adults. J. Clin. Microbiol. 2008, 47, 235–238. [Google Scholar] [CrossRef] [PubMed] [Green Version]
- Mineoka, T.; Awano, S.; Rikimaru, T.; Kurata, H.; Yoshida, A.; Ansai, T.; Takehara, T. Site-Specific Development of Periodontal Disease is Associated with Increased Levels of Porphyromonas gingivalis, Treponema denticola, and Tannerella forsythiain Subgingival Plaque. J. Periodontol. 2008, 79, 670–676. [Google Scholar] [CrossRef] [PubMed]
- Torrungruang, K.; Jitpakdeebordin, S.; Charatkulangkun, O.; Gleebbua, Y. Porphyromonas gingivalis, Aggregatibacter actinomycetemcomitans, and Treponema denticola/Prevotella intermedia Co-Infection are Associated with Severe Periodontitis in a Thai Population. PLoS ONE 2015, 10, e0136646. [Google Scholar] [CrossRef]
- Yoshizawa, J.M.; Schafer, C.A.; Schafer, J.J.; Farrell, J.J.; Paster, B.J.; Wong, D.T.W. Salivary Biomarkers: Toward Future Clinical and Diagnostic Utilities. Clin. Microbiol. Rev. 2013, 26, 781–791. [Google Scholar] [CrossRef] [PubMed] [Green Version]
- Aguirre, A.; Testa-Weintraub, L.; Banderas, J.; Haraszthy, G.; Reddy, M.; Levine, M. Sialochemistry: A Diagnostic Tool? Crit. Rev. Oral Biol. Med. 1993, 4, 343–350. [Google Scholar] [CrossRef]
- Liguori, G.; Lucariello, A.; Colella, G.; de Luca, A.; Marinelli, P. Rapid identification of Candida species in oral rinse solutions by PCR. J. Clin. Pathol. 2006, 60, 1035–1039. [Google Scholar] [CrossRef]
- Faul, F.; Erdfelder, E.; Buchner, A.; Lang, A.-G. Statistical power analyses using G*Power 3.1: Tests for correlation and regression analyses. Behav. Res. Methods 2009, 41, 1149–1160. [Google Scholar] [CrossRef] [Green Version]
- Eke, P.I.; Page, R.C.; Wei, L.; Thornton-Evans, G.; Genco, R.J. Update of the Case Definitions for Population-Based Surveillance of Periodontitis. J. Periodontol. 2012, 83, 1449–1454. [Google Scholar] [CrossRef] [PubMed]
- Kim, E.-H.; Joo, J.-Y.; Lee, Y.J.; Koh, J.-K.; Choi, J.-H.; Shin, Y.; Cho, J.; Park, E.; Kang, J.; Lee, K.; et al. Grading system for periodontitis by analyzing levels of periodontal pathogens in saliva. PLoS ONE 2018, 13, e0200900. [Google Scholar] [CrossRef] [PubMed]
- Rodríguez, A.; Rodríguez, M.; Córdoba, J.J.; Andrade, M.J. Design of primers and probes for quantitative real-time PCR methods. In PCR Primer Design; Humana Press: New York, NY, USA, 2015; Volume 1275, pp. 31–56. [Google Scholar]
- Boutaga, K.; van Winkelhoff, A.J.; Vandenbroucke-Grauls, C.M.J.E.; Savelkoul, P.H.M. Periodontal pathogens: A quantitative comparison of anaerobic culture and real-time PCR. FEMS Immunol. Med. Microbiol. 2005, 45, 191–199. [Google Scholar] [CrossRef] [Green Version]
- Elkaïm, R.; Dahan, M.; Kocgozlu, L.; Werner, S.; Kanter, D.; Kretz, J.G.; Tenenbaum, H. Prevalence of periodontal pathogens in subgingival lesions, atherosclerotic plaques and healthy blood vessels: A preliminary study. J. Periodontal Res. 2007, 43, 224–231. [Google Scholar] [CrossRef]
- Boutaga, K.; van Winkelhoff, A.J.; Vandenbroucke-Grauls, C.M.J.E.; Savelkoul, P.H.M. Comparison of real-time PCR and culture for detection of Porphyromonas gingivalis in subgingival plaque samples. J. Clin. Microbiol. 2003, 41, 4950–4954. [Google Scholar] [CrossRef] [PubMed] [Green Version]
- Suzuki, N.; Yoshida, A.; Saito, T.; Kawada, M.; Nakano, Y. Quantitative Microbiological Study of Subgingival Plaque by Real-Time PCR Shows Correlation between Levels of Tannerella forsythensis and Fusobacterium spp. J. Clin. Microbiol. 2004, 42, 2255–2257. [Google Scholar] [CrossRef] [Green Version]
- Suzuki, N.; Nakano, Y.; Yoshida, A.; Yamashita, Y.; Kiyoura, Y. Real-Time TaqMan PCR for Quantifying Oral Bacteria during Biofilm Formation. J. Clin. Microbiol. 2004, 42, 3827–3830. [Google Scholar] [CrossRef] [PubMed] [Green Version]
- Asai, Y.; Jinno, T.; Igarashi, H.; Ohyama, Y.; Ogawa, T. Detection and Quantification of Oral Treponemes in Subgingival Plaque by Real-Time PCR. J. Clin. Microbiol. 2002, 40, 3334–3340. [Google Scholar] [CrossRef] [Green Version]
- Rawashdeh, R.Y.; Malkawi, H.I.; Al-Hiyasat, A.S.; Hammad, M.M. A fast and sensitive molecular detection of Streptococcus mutans and Actinomyces viscosus from dental plaques. Jordan J. Biol. Sci. 2008, 1, 135–139. [Google Scholar]
- Yun, J.-H.; Park, J.-E.; Kim, D.-I.; Lee, S.-I.; Choi, S.-H.; Cho, K.-S.; Lee, D.-S. Identification of putative periodontal pathogens in Korean chronic periodontitis patients. J. Korean Acad. Periodontol. 2008, 38, 143–152. [Google Scholar] [CrossRef] [Green Version]
- Yoshida, A.; Suzuki, N.; Nakano, Y.; Kawada, M.; Oho, T.; Koga, T. Development of a 5′ Nuclease-Based Real-Time PCR Assay for Quantitative Detection of Cariogenic Dental Pathogens Streptococcus mutans and Streptococcus sobrinus. J. Clin. Microbiol. 2003, 41, 4438–4441. [Google Scholar] [CrossRef] [Green Version]
- Haarman, M.; Knol, J. Quantitative Real-Time PCR Analysis of Fecal Lactobacillus Species in Infants Receiving a Prebiotic Infant Formula. Appl. Environ. Microbiol. 2006, 72, 2359–2365. [Google Scholar] [CrossRef] [PubMed] [Green Version]
- Sakai, H.; Procop, G.W.; Kobayashi, N.; Togawa, D.; Wilson, D.A.; Borden, L.; Krebs, V.; Bauer, T.W. Simultaneous Detection of Staphylococcus aureus and Coagulase-Negative Staphylococci in Positive Blood Cultures by Real-Time PCR with Two Fluorescence Resonance Energy Transfer Probe Sets. J. Clin. Microbiol. 2004, 42, 5739–5744. [Google Scholar] [CrossRef] [PubMed] [Green Version]
- Granger, K.; Rundell, M.S.; Pingle, M.R.; Shatsky, R.; Larone, D.H.; Golightly, L.M.; Barany, F.; Spitzer, E.D. Multiplex PCR-Ligation Detection Reaction Assay for Simultaneous Detection of Drug Resistance and Toxin Genes from Staphylococcus aureus, Enterococcus faecalis, and Enterococcus faecium. J. Clin. Microbiol. 2009, 48, 277–280. [Google Scholar] [CrossRef] [PubMed] [Green Version]
- Firth, D. Bias Reduction of Maximum Likelihood Estimates. Biometrika 1993, 80, 27. [Google Scholar] [CrossRef]
- Heinze, G.; Schemper, M. A solution to the problem of separation in logistic regression. Stat. Med. 2002, 21, 2409–2419. [Google Scholar] [CrossRef]
- Tonetti, M.S.; Greenwell, H.; Kornman, K.S. Staging and grading of periodontitis: Framework and proposal of a new classification and case definition. J. Periodontol. 2018, 89, S159–S172. [Google Scholar] [CrossRef] [Green Version]
- Park, N.J.; Zhou, X.; Yu, T.; Brinkman, B.M.; Zimmermann, B.G.; Palanisamy, V.; Wong, D.T. Characterization of salivary RNA by cDNA library analysis. Arch. Oral Biol. 2007, 52, 30–35. [Google Scholar] [CrossRef] [Green Version]
- Papapanou, P.N.; Baelum, V.; Luan, W.-M.; Madianos, P.N.; Chen, X.; Fejerskov, O.; Dahlén, G. Subgingival Microbiota in Adult Chinese: Prevalence and Relation to Periodontal Disease Progression. J. Periodontol. 1997, 68, 651–666. [Google Scholar] [CrossRef]
- Kuboniwa, M.; Amano, A.; Kimura, K.R.; Sekine, S.; Kato, S.; Yamamoto, Y.; Okahashi, N.; Iida, T.; Shizukuishi, S. Quantitative detection of periodontal pathogens using real-time polymerase chain reaction with TaqMan probes. Oral Microbiol. Immunol. 2004, 19, 168–176. [Google Scholar] [CrossRef] [PubMed]
- He, J.; Huang, W.; Pan, Z.; Cui, H.; Qi, G.; Zhou, X.; Chen, H. Quantitative analysis of microbiota in saliva, supragingival, and subgingival plaque of Chinese adults with chronic periodontitis. Clin. Oral Investig. 2011, 16, 1579–1588. [Google Scholar] [CrossRef]
- Slots, J. Subgingival microflora and periodontal disease. J. Clin. Periodontol. 1979, 6, 351–382. [Google Scholar] [CrossRef]
- Haubek, D.; Ennibi, O.-K.; Poulsen, K.; Vaeth, M.; Poulsen, S.; Kilian, M. Risk of aggressive periodontitis in adolescent carriers of the JP2 clone of Aggregatibacter (Actinobacillus) actinomycetemcomitans in Morocco: A prospective longitudinal cohort study. Lancet 2008, 371, 237–242. [Google Scholar] [CrossRef]
- Papapanou, P.N.; Neiderud, A.M.; Disick, E.; Lalla, E.; Miller, G.C.; Dahlén, G. Longitudinal stability of serum immunoglobulin G responses to periodontal bacteria. J. Clin. Periodontol. 2004, 31, 985–990. [Google Scholar] [CrossRef]
- Van Winkelhoff, A.J.; Loos, B.G.; van der Reijden, W.A.; van der Velden, U. Porphyromonas gingivalis, Bacteroides forsythus and other putative periodontal pathogens in subjects with and without periodontal destruction. J. Clin. Periodontol. 2002, 29, 1023–1028. [Google Scholar] [CrossRef] [PubMed]
- Kolenbrander, P.E.; Palmer, R.J.; Periasamy, S.; Jakubovics, N.S. Oral multispecies biofilm development and the key role of cell–cell distance. Nat. Rev. Microbiol. 2010, 8, 471–480. [Google Scholar] [CrossRef] [PubMed]
- Socransky, S.S.; Haffajee, A.D. The Bacterial Etiology of Destructive Periodontal Disease: Current Concepts. J. Periodontol. 1992, 63, 322–331. [Google Scholar] [CrossRef] [PubMed]
- Aas, J.A.; Paster, B.J.; Stokes, L.N.; Olsen, I.; Dewhirst, F.E. Defining the Normal Bacterial Flora of the Oral Cavity. J. Clin. Microbiol. 2005, 43, 5721–5732. [Google Scholar] [CrossRef] [Green Version]
- Genco, R.; Kornman, K.; Williams, R.; Offenbacher, S.; Zambon, J.J.; Ishikawa, I.; Listgarten, M.; Michalowicz, B.; Page, R.; Schenkein, H.; et al. Periodontal Diseases: Pathogenesis and Microbial Factors. J. Am. Dent. Assoc. 1998, 129, 58S–62S. [Google Scholar] [CrossRef]
- Kawada, M.; Yoshida, A.; Suzuki, N.; Nakano, Y.; Saito, T.; Oho, T.; Koga, T. Prevalence of Porphyromonas gingivalis in relation to periodontal status assessed by real-time PCR. Oral Microbiol. Immunol. 2004, 19, 289–292. [Google Scholar] [CrossRef] [PubMed]
- Klein, M.I.; Gonçalves, R.B. Detection ofTannerella forsythensis(Bacteroides forsythus) and Porphyromonas gingivalisby Polymerase Chain Reaction in Subjects with Different Periodontal Status. J. Periodontol. 2003, 74, 798–802. [Google Scholar] [CrossRef] [PubMed]
- Lee, N.-H.; Lee, E.; Kim, Y.-S.; Kim, W.-K.; Lee, Y.-K.; Kim, S.-H. Differential expression of microRNAs in the saliva of patients with aggressive periodontitis: A pilot study of potential biomarkers for aggressive periodontitis. J. Periodontal Implant. Sci. 2020, 50, 281–290. [Google Scholar] [CrossRef] [PubMed]


| Bacteria | Target Gene | Primer/ Probe | Sequence (5′-3′) | Ref. | Bacteria | Target Gene | Primer/ Probe | Sequence (5′-3′) | Ref. |
|---|---|---|---|---|---|---|---|---|---|
| Aggregatibacter actinomycetemcomitans | leukotoxin | Forward | CG**********GA | [15] | Eubacterium nodatum | hypothetical protein | Forward | TG**********GA | [16] |
| Reverse | AT**********CA | Reverse | AA**********AT | ||||||
| Probe | [FAM]GG**********CC[BHQ1] | Probe | [TR]TT**********GG[BHQ2] | ||||||
| Porphyromonas gingivalis | hemagglutinin | Forward | AC**********GC | [17] | Eikenella corrodens | prolineiminopeptidase | Forward | GC**********TG | [16] |
| Reverse | GC**********CT | Reverse | GC**********TT | ||||||
| Probe | [HEX]CG**********GA[BHQ1] | Probe | [Cy5]AC**********AT[BHQ2] | ||||||
| Tannerella forsythia | karilysin protease | Forward | TG**********CC | [18] | Streptococcus mitis | 16S ribosomal RNA | Forward | GT**********CG | [19] |
| Reverse | TT**********CA | Reverse | TA**********AT | ||||||
| Probe | [TR]CC**********GG[BHQ2] | Probe | [FAM]TA**********CC[BHQ1] | ||||||
| Treponema denticola | OpdB | Forward | AG**********AG | [20] | Streptococcus mutans | PTS EII | Forward | CA**********CA | [21] |
| Reverse | GC**********AT | Reverse | TG**********CC | ||||||
| Probe | [Cy5]CG**********TC[BHQ2] | Probe | [HEX]TG**********GG[BHQ1] | ||||||
| Fusobacterium nucleatum | 16S ribosomal RNA | Forward | GG**********TC | [22] | Streptococcus sobrinus | Ftsk | Forward | GG**********CC | [23] |
| Reverse | CT**********GC | Reverse | AC**********GG | ||||||
| Probe | [FAM]AA**********CG[BHQ1] | Probe | [TR]AG**********GC[BHQ2] | ||||||
| Prevotella intermedia | hemagglutinin | Forward | CA**********AC | [15] | Lactobacillus casei | att | Forward | CA**********GT | [24] |
| Reverse | CA**********TC | Reverse | AC**********CC | ||||||
| Probe | [HEX]CC**********AC[BHQ1] | Probe | [Cy5]TG**********GT[BHQ2] | ||||||
| Prevotella nigrescens | gyrase subunit B | Forward | AG**********CT | [16] | Staphylococcus aureus | clumping factor A | Forward | GC**********AA | [25] |
| Reverse | GC**********CT | Reverse | GA**********TT | ||||||
| Probe | [TR]GC**********AA[BHQ2] | Probe | [FAM]TG**********CA[BHQ1] | ||||||
| Parvimonas micra | 16S ribosomal RNA | Forward | GA**********AG | [15] | Enterococcus faecalis | gelE-sprE operon | Forward | GA**********TT | [26] |
| Reverse | GG**********CC | Reverse | CG**********AC | ||||||
| Probe | [FAM]GG**********CA[BHQ1] | Probe | [HEX]GC**********GA[BHQ1] | ||||||
| Campylobacter rectus | GroEL | Forward | AA**********GG | [16] | Actinomyces viscosus | nanH | Forward | GC**********CG | [21] |
| Reverse | TC**********GA | Reverse | GA**********CA | ||||||
| Probe | [HEX]GG**********GT[BHQ1] | Probe | [TR]GA**********AA[BHQ2] |
| Characteristic | Healthy Group (n = 35) | Severe Periodontitis Group (n = 52) | |
|---|---|---|---|
| Age (Years, mean ± SD) | 39.0 ± 17.9 | 56.2 ± 15.2 | |
| Sex | Male | 29 (83%) | 44 (85%) |
| Female | 6 (17%) | 8 (15%) | |
| Smoking | Non-smokers | 31 (89%) | 46 (88%) |
| Current smokers | 4 (11%) | 6 (12%) | |
| Bacteria | Healthy Group (n = 35) | Severe Periodontitis Group (n = 52) |
|---|---|---|
| Aggregatibacter actinomycetemcomitans | ||
| Prevalence, n (%) a | 1 (2.9) | 7 (13.5) |
| Median bacterial cells proportion (%) (IQR) | 0.46 (0.46–0.46) | 0.75 (0.46–1.07) |
| Porphyromonas gingivalis | ||
| Prevalence, n (%) | 16 (45.7) | 47 (90.4) |
| Median bacterial cells proportion (%) (IQR) | 3.43 (1.74–5.86) | 3.83 (2.27–8.28) |
| Tannerella forsythia | ||
| Prevalence, n (%) | 26 (74.3) | 38 (73.1) |
| Median bacterial cells proportion (%) (IQR) | 3.07 (0.65–7.74) | 26.07 (4.49–50.82) |
| Treponema denticola | ||
| Prevalence, n (%) a | 15 (42.9) | 36 (69.2) |
| Median bacterial cells proportion (%) (IQR) | 0.59 (0.18–2.34) | 2.91 (1.36–5.39) |
| Fusobacterium nucleatum | ||
| Prevalence, n (%) | 35 (100.0) | 52 (100.0) |
| Median bacterial cells proportion (%) (IQR) | 18.73 (13.31–23.15) | 12.89 (7.23–20.02) |
| Prevotella intermedia | ||
| Prevalence, n (%) | 8 (22.9) | 15 (28.8) |
| Median bacterial cells proportion (%) (IQR) | 0.22 (0.05–0.46) | 0.11 (0.05–0.19) |
| Prevotella nigrescens | ||
| Prevalence, n (%) a | 28 (80.0) | 43 (82.7) |
| Median bacterial cells proportion (%) (IQR) | 0.73 (0.4–1.94) | 0.47 (0.14–1.23) |
| Parvimonas micra | ||
| Prevalence, n (%) | 35 (100.0) | 52 (100.0) |
| Median bacterial cells proportion (%) (IQR) | 0.5 (0.29–0.82) | 0.99 (0.45–1.81) |
| Campylobacter rectus | ||
| Prevalence, n (%) | 28 (80.0) | 45 (86.5) |
| Median bacterial cells proportion (%) (IQR) | 0.11 (0.06–0.18) | 0.08 (0.04–0.13) |
| Eubacterium nodatum | ||
| Prevalence, n (%) | 3 (8.6) | 14 (26.9) |
| Median bacterial cells proportion (%) (IQR) | 0.21 (0.12–0.27) | 0.71 (0.3–1.34) |
| Eikenella corrodens | ||
| Prevalence, n (%) | 4 (11.4) | 15 (28.8) |
| Median bacterial cells proportion (%) (IQR) | 0.07 (0.04–0.45) | 0.28 (0.15–0.71) |
| Streptococcus mitis | ||
| Prevalence, n (%) | 35 (100.0) | 52 (100.0) |
| Median bacterial cells proportion (%) (IQR) | 73.72 (63.61–79.49) | 59.13 (37.87–70.34) |
| Streptococcus mutans | ||
| Prevalence, n (%) | 23 (65.7) | 35 (67.3) |
| Median bacterial cells proportion (%) (IQR) | 0.03 (0.02–0.1) | 0.03 (0.01–0.15) |
| Streptococcus sobrinus | ||
| Prevalence, n (%) | 1 (2.9) | 5 (9.6) |
| Median bacterial cells proportion (%) (IQR) | 0.06 (0.06–0.06) | 0 (0–0.01) |
| Lactobacillus casei | ||
| Prevalence, n (%) | 6 (17.1) | 18 (34.6) |
| Median bacterial cells proportion (%) (IQR) | 0.01 (0–0.04) | 0 (0–0.01) |
| Staphylococcus aureus | ||
| Prevalence, n (%) | 15 (42.9) | 4 (7.7) |
| Median bacterial cells proportion (%) (IQR) | 0.02 (0.01–0.14) | 0.03 (0–0.07) |
| Enterococcus faecalis | ||
| Prevalence, n (%) | 0 (0.0) | 0 (0.0) |
| Median bacterial cells proportion (%) (IQR) | NA (NA–NA) | NA (NA–NA) |
| Actinomyces viscosus | ||
| Prevalence, n (%) | 0 (0.0) | 0 (0.0) |
| Median bacterial cells proportion (%) (IQR) | NA (NA–NA) | NA (NA–NA) |
| Total number of cellsPrevalence, n (%) | 35 (100.0) | 52 (100.0) |
| Median bacterial cells (IQR) | 36,126,518 (16,199,034–92,716,204) | 108524910 (69,243,624.5–177,393,988.25) |
| Aa | Pg | Tf | Td | Fn | Pi | Pn | Pm | Cr | En | Ec | Sm | Smu | Ss | Lc | Sa | Total | |
|---|---|---|---|---|---|---|---|---|---|---|---|---|---|---|---|---|---|
| Aa | 0.96 * | −0.49 | 0.3 | 0.38 | 0.98 * | 0.91 * | 0.57 | 0.07 | −0.26 | ||||||||
| Pg | −0.04 | 0.25 | −0.01 | −0.06 | 0.16 | 0.23 | −0.02 | 0.57 * | −0.3 | −0.34 * | 0.16 | 0.5 | −0.05 | −0.27 | −0.06 | ||
| Tf | 0.19 | −0.56 * | −0.21 | −0.28 * | 0.03 | −0.02 | 0.1 | −0.37 | −0.87 * | −0.22 | −0.54 | −0.2 | −0.21 | 0.14 | |||
| Td | −0.17 | 0.53 * | 0.05 | 0.61 * | −0.08 | 0.8 * | −0.24 | −0.42 * | −0.02 | −0.17 | 0.34 | −0.4 | −0.07 | ||||
| Fn | 0.21 | 0.25 * | −0.15 | 0.18 | −0.17 | 0.07 | 0.25 * | 0.02 | 0.9 * | 0.52 * | 0.02 | −0.13 | |||||
| Pi | 0.53 * | 0.14 | 0.51 * | 0.51 | 0.09 | −0.09 | 0.43 | 0.32 | |||||||||
| Pn | 0.15 | 0.23 | −0.16 | −0.13 | 0.07 | −0.18 | 0.75 | −0.03 | −0.32 | −0.21 | |||||||
| Pm | 0.18 | 0.13 | −0.27 | −0.23 * | 0 | 0.17 | −0.02 | −0.23 | −0.02 | ||||||||
| Cr | −0.31 | −0.24 | 0.03 | −0.15 | 0.88 * | 0.06 | −0.24 | −0.16 | |||||||||
| En | −0.13 | 0.35 | 0.3 | 0.42 | |||||||||||||
| Ec | 0.24 | 0.19 | −0.17 | −0.16 | |||||||||||||
| Sm | 0.12 | 0.33 | 0.04 | 0.23 | −0.03 | ||||||||||||
| Smu | −0.12 | −0.13 | −0.15 | −0.09 | |||||||||||||
| Ss | −0.62 | ||||||||||||||||
| Lc | −0.16 | ||||||||||||||||
| Sa | −0.21 | ||||||||||||||||
| Total |
| Aa | Pg | Tf | Td | Fn | Pi | Pn | Pm | Cr | En | Ec | Sm | Smu | Ss | Lc | Sa | Total | |
|---|---|---|---|---|---|---|---|---|---|---|---|---|---|---|---|---|---|
| Aa | 0.96 * | −0.81 | 0.24 | 0.55 | 0.98 * | 0.92 * | 0.56 | 0.18 | −0.34 | ||||||||
| Pg | −0.03 | 0.22 | 0.02 | −0.04 | 0.12 | 0.22 | 0 | 0.57 * | −0.32 | −0.3 * | 0.14 | 0.71 | −0.05 | −0.07 | |||
| Tf | 0.11 | −0.67 * | −0.13 | −0.34 | −0.12 | −0.13 | 0.05 | −0.49 | −0.88 * | −0.29 | 0.11 | −0.31 | 0.05 | ||||
| Td | −0.12 | 0.55 | 0.07 | 0.62 * | −0.09 | 0.78 * | −0.34 | −0.33 * | −0.08 | −0.17 | 0.4 | −0.16 | |||||
| Fn | 0.26 | 0.33 * | −0.1 | 0.24 | −0.12 | 0.28 | 0.43 * | 0.38 * | 0.33 | 0.19 | 0.01 | ||||||
| Pi | 0.75 * | 0.21 | 0.56 * | 0.58 | 0.15 | −0.16 | 0.36 | ||||||||||
| Pn | 0.23 | 0.4 * | −0.22 | −0.14 | 0.15 | −0.15 | −0.26 | −0.17 | −0.23 | ||||||||
| Pm | 0.22 | −0.09 | −0.32 | −0.11 | −0.08 | −0.37 | 0.11 | −0.12 | |||||||||
| Cr | −0.32 | −0.22 | 0.12 | −0.18 | 0.95 * | 0.22 | −0.14 | ||||||||||
| En | −0.13 | 0.31 | 0.3 | 0.45 | |||||||||||||
| Ec | 0.2 | 0.18 | −0.23 | −0.24 | |||||||||||||
| Sm | 0.12 | −0.2 | 0.24 | 0.04 | |||||||||||||
| Smu | 0.01 | −0.23 | |||||||||||||||
| Ss | −0.49 | ||||||||||||||||
| Lc | −0.12 | ||||||||||||||||
| Sa | |||||||||||||||||
| Total |
| Levels | No. of Subjects | No. (%) with Severe Periodontitis | Crude OR (95% CI) | p Value | Adjusted OR (95% CI) | p Value | |
|---|---|---|---|---|---|---|---|
| Aa | |||||||
| 0 | 79 | 45 (57.0) | 1 | 1 | |||
| 1 | 4 | 3 (75.0) | 1.8 (0.3–18.9) | 0.557 | 13.7 (0.9–389.2) | 0.059 | |
| 2 | 4 | 4 (100.0) | 6.8 (0.7–915.8) | 0.111 | 1.6 (0.1–232.1) | 0.750 | |
| Pg | |||||||
| 0 | 24 | 5 (20.8) | 1 | - | 1 | - | |
| 1 | 31 | 23 (74.2) | 10.9 (3.1–39.0) | <0.001 | 3.3 (0.4–26.6) | 0.271 | |
| 2 | 32 | 24 (75.0) | 11.4 (3.2–40.6) | <0.001 | 1.1 (0.1–8.7) | 0.942 | |
| Tf | |||||||
| 0 | 23 | 14 (60.9) | 1 | - | 1 | - | |
| 1 | 32 | 13 (40.6) | 0.4 (0.1–1.3) | 0.141 | 0.1 (0.0–1.1) | 0.059 | |
| 2 | 32 | 25 (78.1) | 2.3 (0.7–7.5) | 0.169 | 3.7 (0.3–48.1) | 0.319 | |
| Td | |||||||
| 0 | 36 | 16 (44.4) | 1 | - | 1 | - | |
| 1 | 25 | 14 (56.0) | 1.6 (0.6–4.4) | 0.375 | 5.3 (0.6–44.8) | 0.129 | |
| 2 | 26 | 22 (84.6) | 6.9 (2.0–24.0) | 0.002 | 7.3 (1.1–47.4) | 0.035 | |
| Fn | |||||||
| 1 | 43 | 30 (69.8) | 1 | - | 1 | - | |
| 2 | 44 | 22 (50.0) | 0.4 (0.2–1.0) | 0.062 | 1.0 (0.2–4.3) | 0.969 | |
| Pi | |||||||
| 0 | 64 | 37 (57.8) | 1 | - | 1 | - | |
| 1 | 11 | 7 (63.6) | 1.3 (0.3–4.8) | 0.717 | 0.7 (0.1–7.6) | 0.762 | |
| 2 | 12 | 8 (66.7) | 1.5 (0.4–5.3) | 0.568 | 0.5 (0.1–3.4) | 0.504 | |
| Pn | |||||||
| 0 | 16 | 9 (56.2) | 1 | - | 1 | - | |
| 1 | 35 | 25 (71.4) | 1.9 (0.6–6.7) | 0.289 | 120.4 (5.3–2725.4) | 0.002 | |
| 2 | 36 | 18 (50.0) | 0.8 (0.2–2.5) | 0.677 | 22.5 (2.0–260.6) | 0.012 | |
| Pm | |||||||
| 1 | 43 | 19 (44.2) | 1 | - | 1 | - | |
| 2 | 44 | 33 (75.0) | 3.8 (1.5–9.4) | 0.004 | 4.4 (1.0–20.1) | 0.057 | |
| Cr | |||||||
| 0 | 14 | 7 (50.0) | 1 | - | 1 | - | |
| 1 | 36 | 25 (69.4) | 2.3 (0.6–8.1) | 0.203 | 3.5 (0.5–27.3) | 0.226 | |
| 2 | 37 | 20 (54.1) | 1.2 (0.3–4.0) | 0.795 | 1.6 (0.2–11.0) | 0.628 | |
| En | |||||||
| 0 | 70 | 38 (54.3) | 1 | - | 1 | - | |
| 1 | 8 | 5 (62.5) | 1.3 (0.3–6.1) | 0.694 | 0.3 (0.1–2.0) | 0.227 | |
| 2 | 9 | 9 (100.0) | 16.0 (1.9–2097.0) | 0.006 | 4.3 (0.4–609.5) | 0.280 | |
| Ec | |||||||
| 0 | 68 | 37 (54.4) | 1 | - | 1 | - | |
| 1 | 9 | 6 (66.7) | 1.7 (0.4–7.3) | 0.490 | 2.6 (0.2–30.9) | 0.441 | |
| 2 | 10 | 9 (90.0) | 7.5 (0.9–62.8) | 0.061 | 13.6 (0.5–380.9) | 0.124 | |
| Sm | |||||||
| 1 | 43 | 33 (76.7) | 1 | - | 1 | - | |
| 2 | 44 | 19 (43.2) | 0.2 (0.1–0.6) | 0.001 | 0.1 (0.0–0.8) | 0.024 | |
| Smu | |||||||
| 0 | 29 | 17 (58.6) | 1 | - | 1 | - | |
| 1 | 29 | 18 (62.1) | 1.2 (0.4–3.3) | 0.788 | 2.5 (0.4–18.3) | 0.354 | |
| 2 | 29 | 17 (58.6) | 1.0 (0.4–2.8) | 1 | 0.4 (0.1–2.5) | 0.316 | |
| Ss | |||||||
| 0 | 81 | 47 (58.0) | 1 | 1 | |||
| 1 | 3 | 3 (100.0) | 5.1 (0.5–692.1) | 0.205 | 1.6 (0.1–244.0) | 0.755 | |
| 2 | 3 | 2 (66.7) | 1.2 (0.2–13.7) | 0.856 | 1.4 (0.1–193.5) | 0.873 | |
| Lc | |||||||
| 0 | 63 | 34 (54.0) | 1 | - | 1 | - | |
| 1 | 12 | 11 (91.7) | 9.4 (1.1–77.0) | 0.037 | 1.4 (0.1–14.1) | 0.795 | |
| 2 | 12 | 7 (58.3) | 1.2 (0.3– 4.2) | 0.780 | 0.3 (0.0–1.9) | 0.192 | |
| Sa | |||||||
| 0 | 68 | 48 (70.6) | 1 | - | 1 | - | |
| 1 | 9 | 2 (22.2) | 0.1 (0.0–0.6) | 0.011 | 0.2 (0.0–2.0) | 0.162 | |
| 2 | 10 | 2 (20.0) | 0.1 (0.0–0.5) | 0.006 | 0.4 (0.0–7.4) | 0.525 | |
| Total | |||||||
| 1 | 43 | 18 (41.9) | 1 | - | 1 | - | |
| 2 | 44 | 34 (77.3) | 4.7 (1.9–12.0) | 0.001 | 1.4 (0.3–5.8) | 0.673 |
Publisher’s Note: MDPI stays neutral with regard to jurisdictional claims in published maps and institutional affiliations. |
© 2021 by the authors. Licensee MDPI, Basel, Switzerland. This article is an open access article distributed under the terms and conditions of the Creative Commons Attribution (CC BY) license (http://creativecommons.org/licenses/by/4.0/).
Share and Cite
Kim, J.-H.; Oh, J.-W.; Lee, Y.; Yun, J.-H.; Choi, S.-H.; Lee, D.-W. Quantification of Bacteria in Mouth-Rinsing Solution for the Diagnosis of Periodontal Disease. J. Clin. Med. 2021, 10, 891. https://doi.org/10.3390/jcm10040891
Kim J-H, Oh J-W, Lee Y, Yun J-H, Choi S-H, Lee D-W. Quantification of Bacteria in Mouth-Rinsing Solution for the Diagnosis of Periodontal Disease. Journal of Clinical Medicine. 2021; 10(4):891. https://doi.org/10.3390/jcm10040891
Chicago/Turabian StyleKim, Jeong-Hwa, Jae-Woon Oh, Young Lee, Jeong-Ho Yun, Seong-Ho Choi, and Dong-Woon Lee. 2021. "Quantification of Bacteria in Mouth-Rinsing Solution for the Diagnosis of Periodontal Disease" Journal of Clinical Medicine 10, no. 4: 891. https://doi.org/10.3390/jcm10040891