Solvent-Free and Scalable Procedure to Prepare PYR13TFSI/LiTFSI/PVDF–HFP Thermoplastic Electrolytes with Controlled Phase Separation and Enhanced Li Ion Diffusion


Abstract
:1. Introduction
2. Materials and Methods
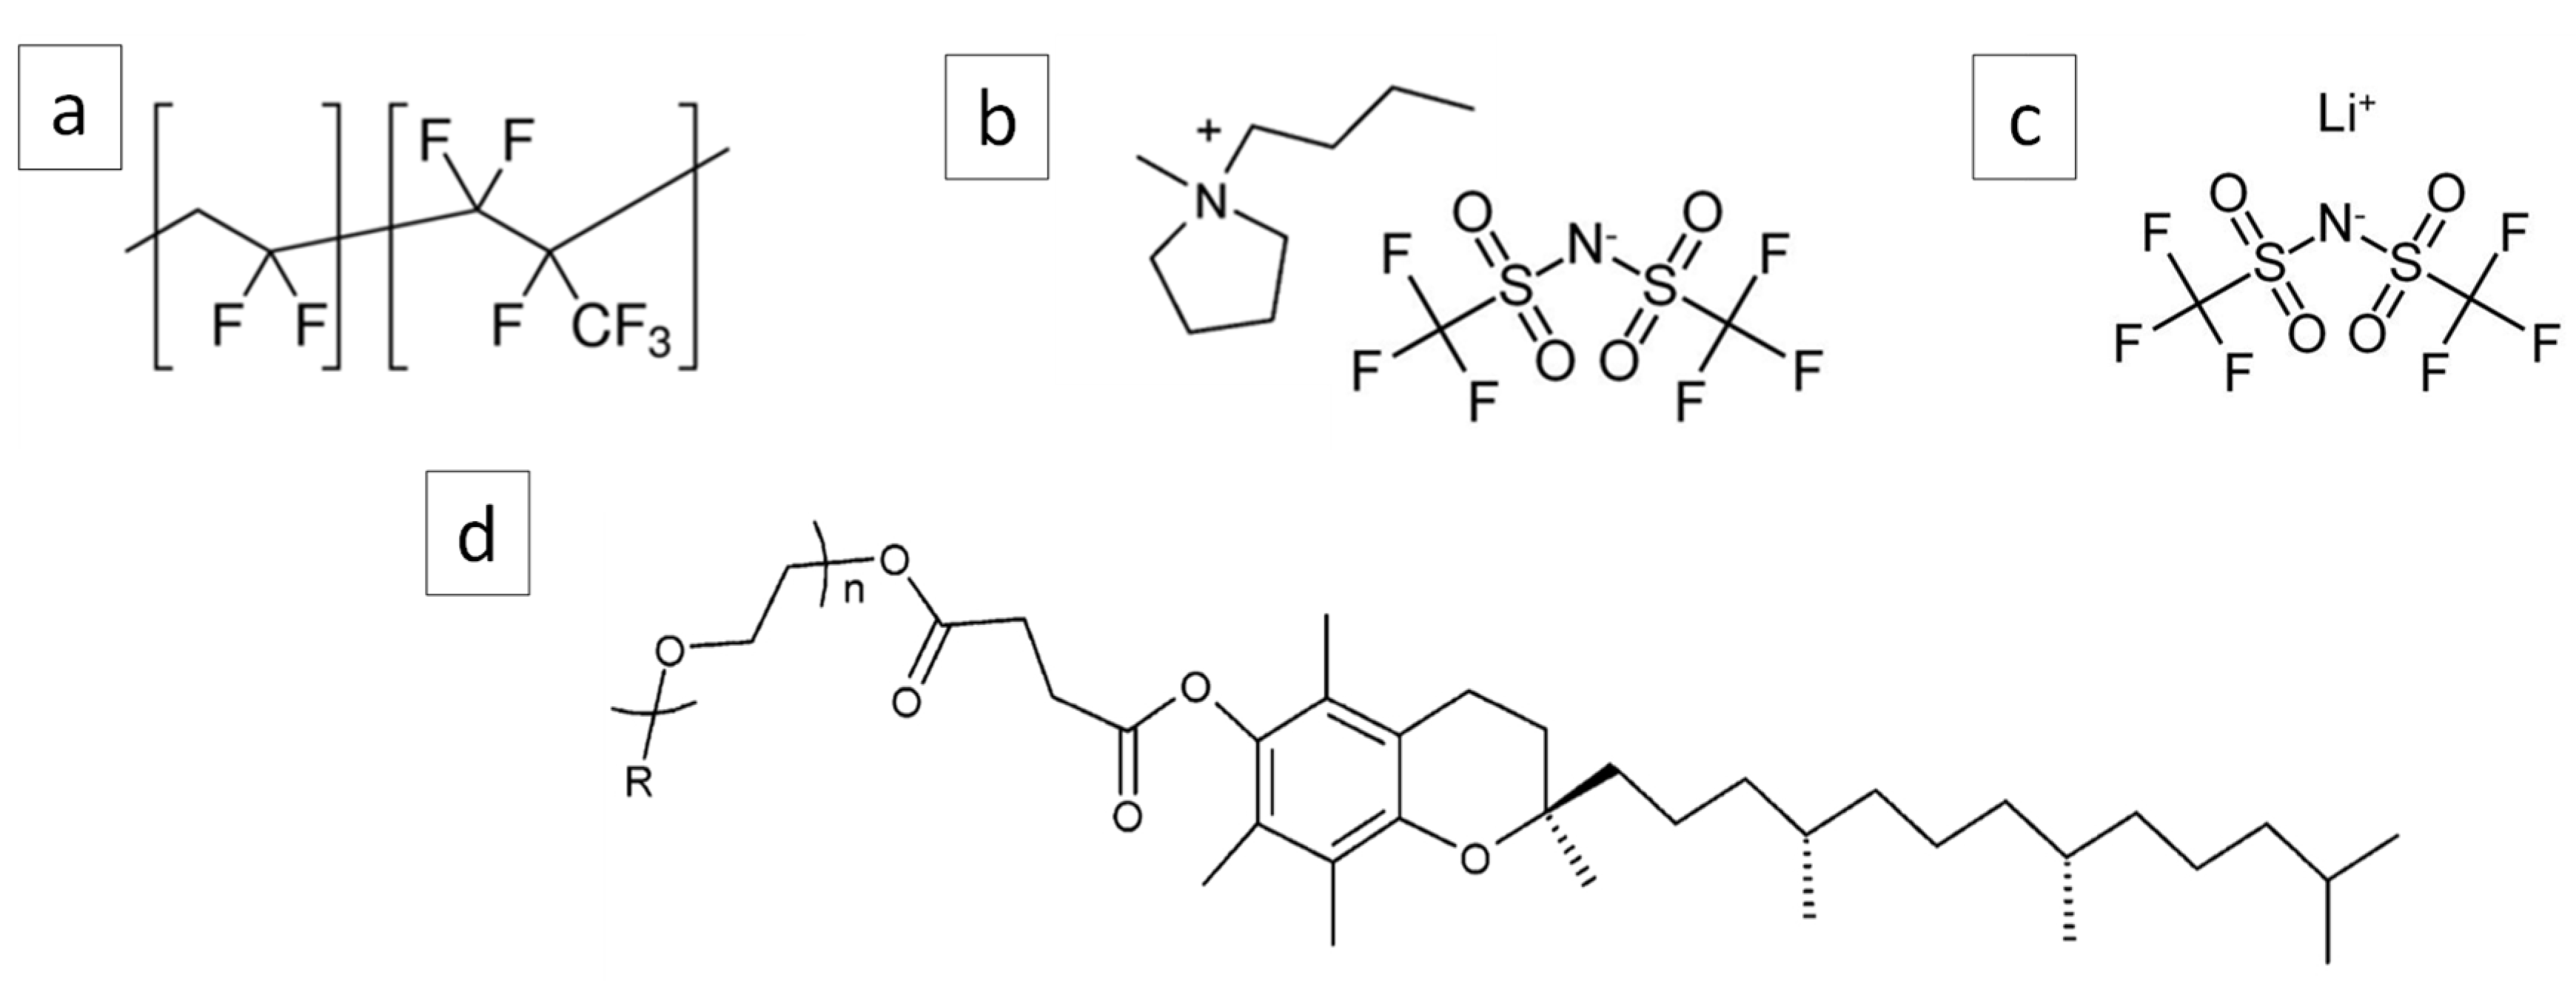
2.1. Materials
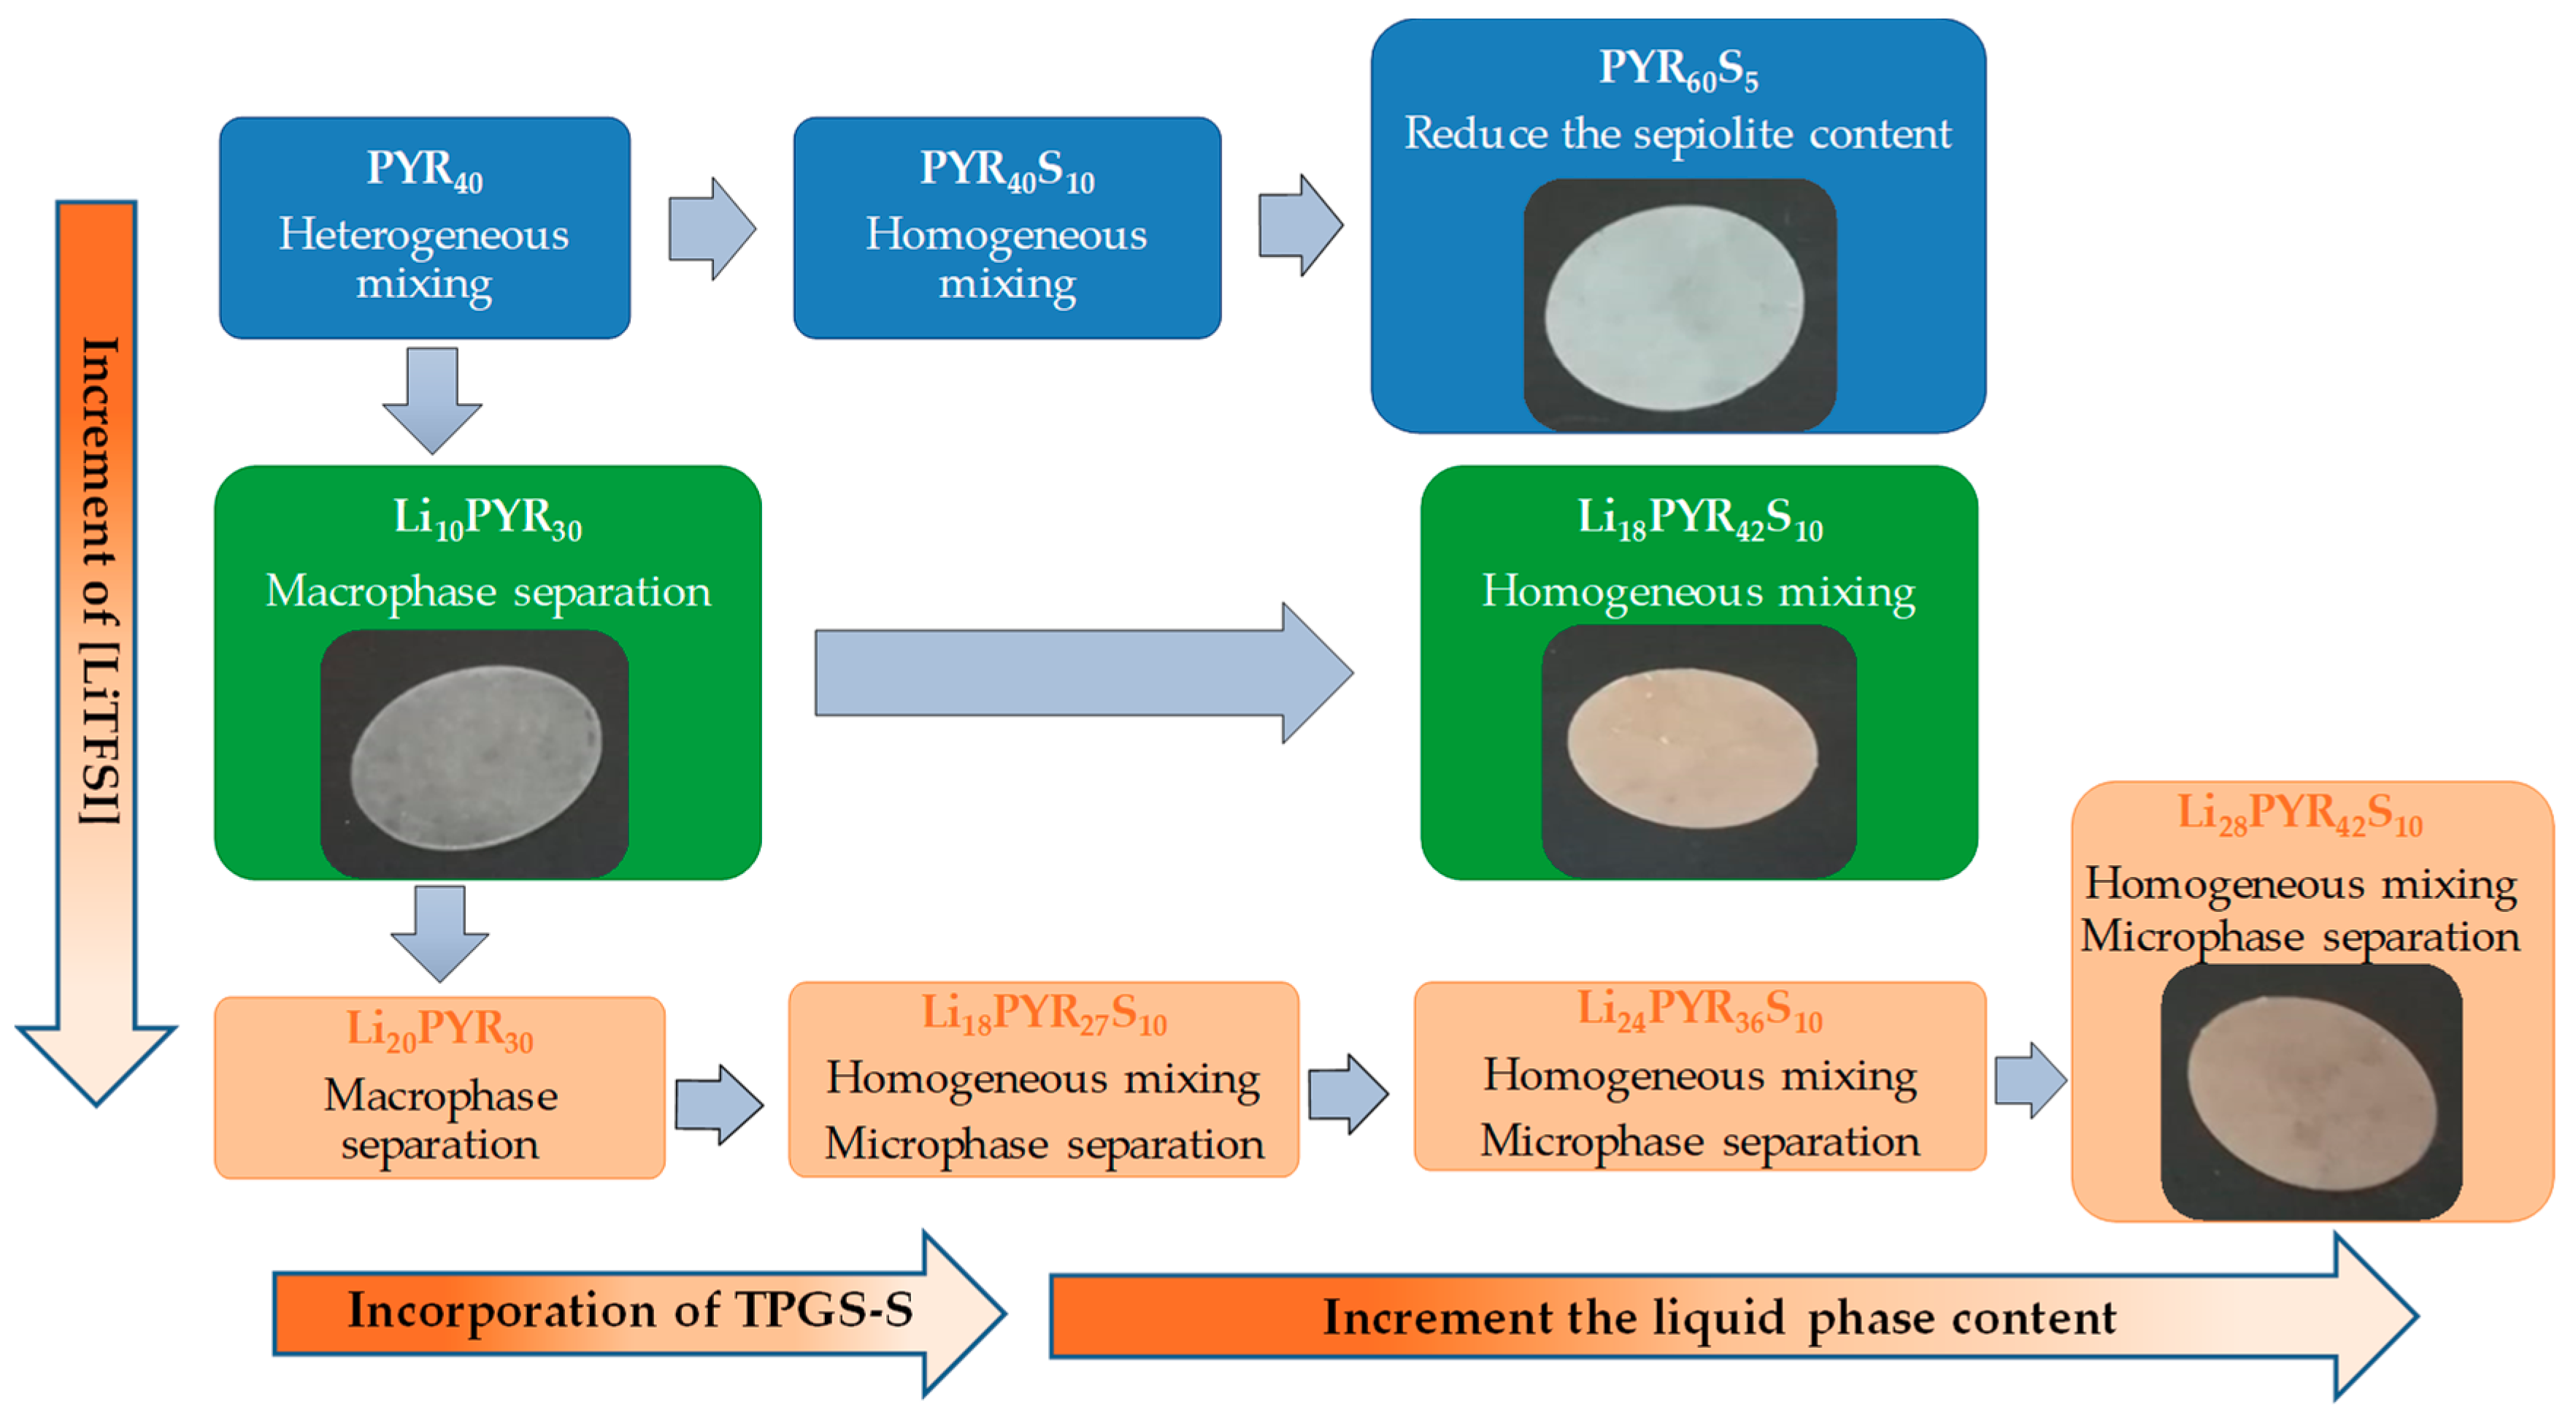
2.2. Processing
2.3. Characterization
3. Results and Discussion
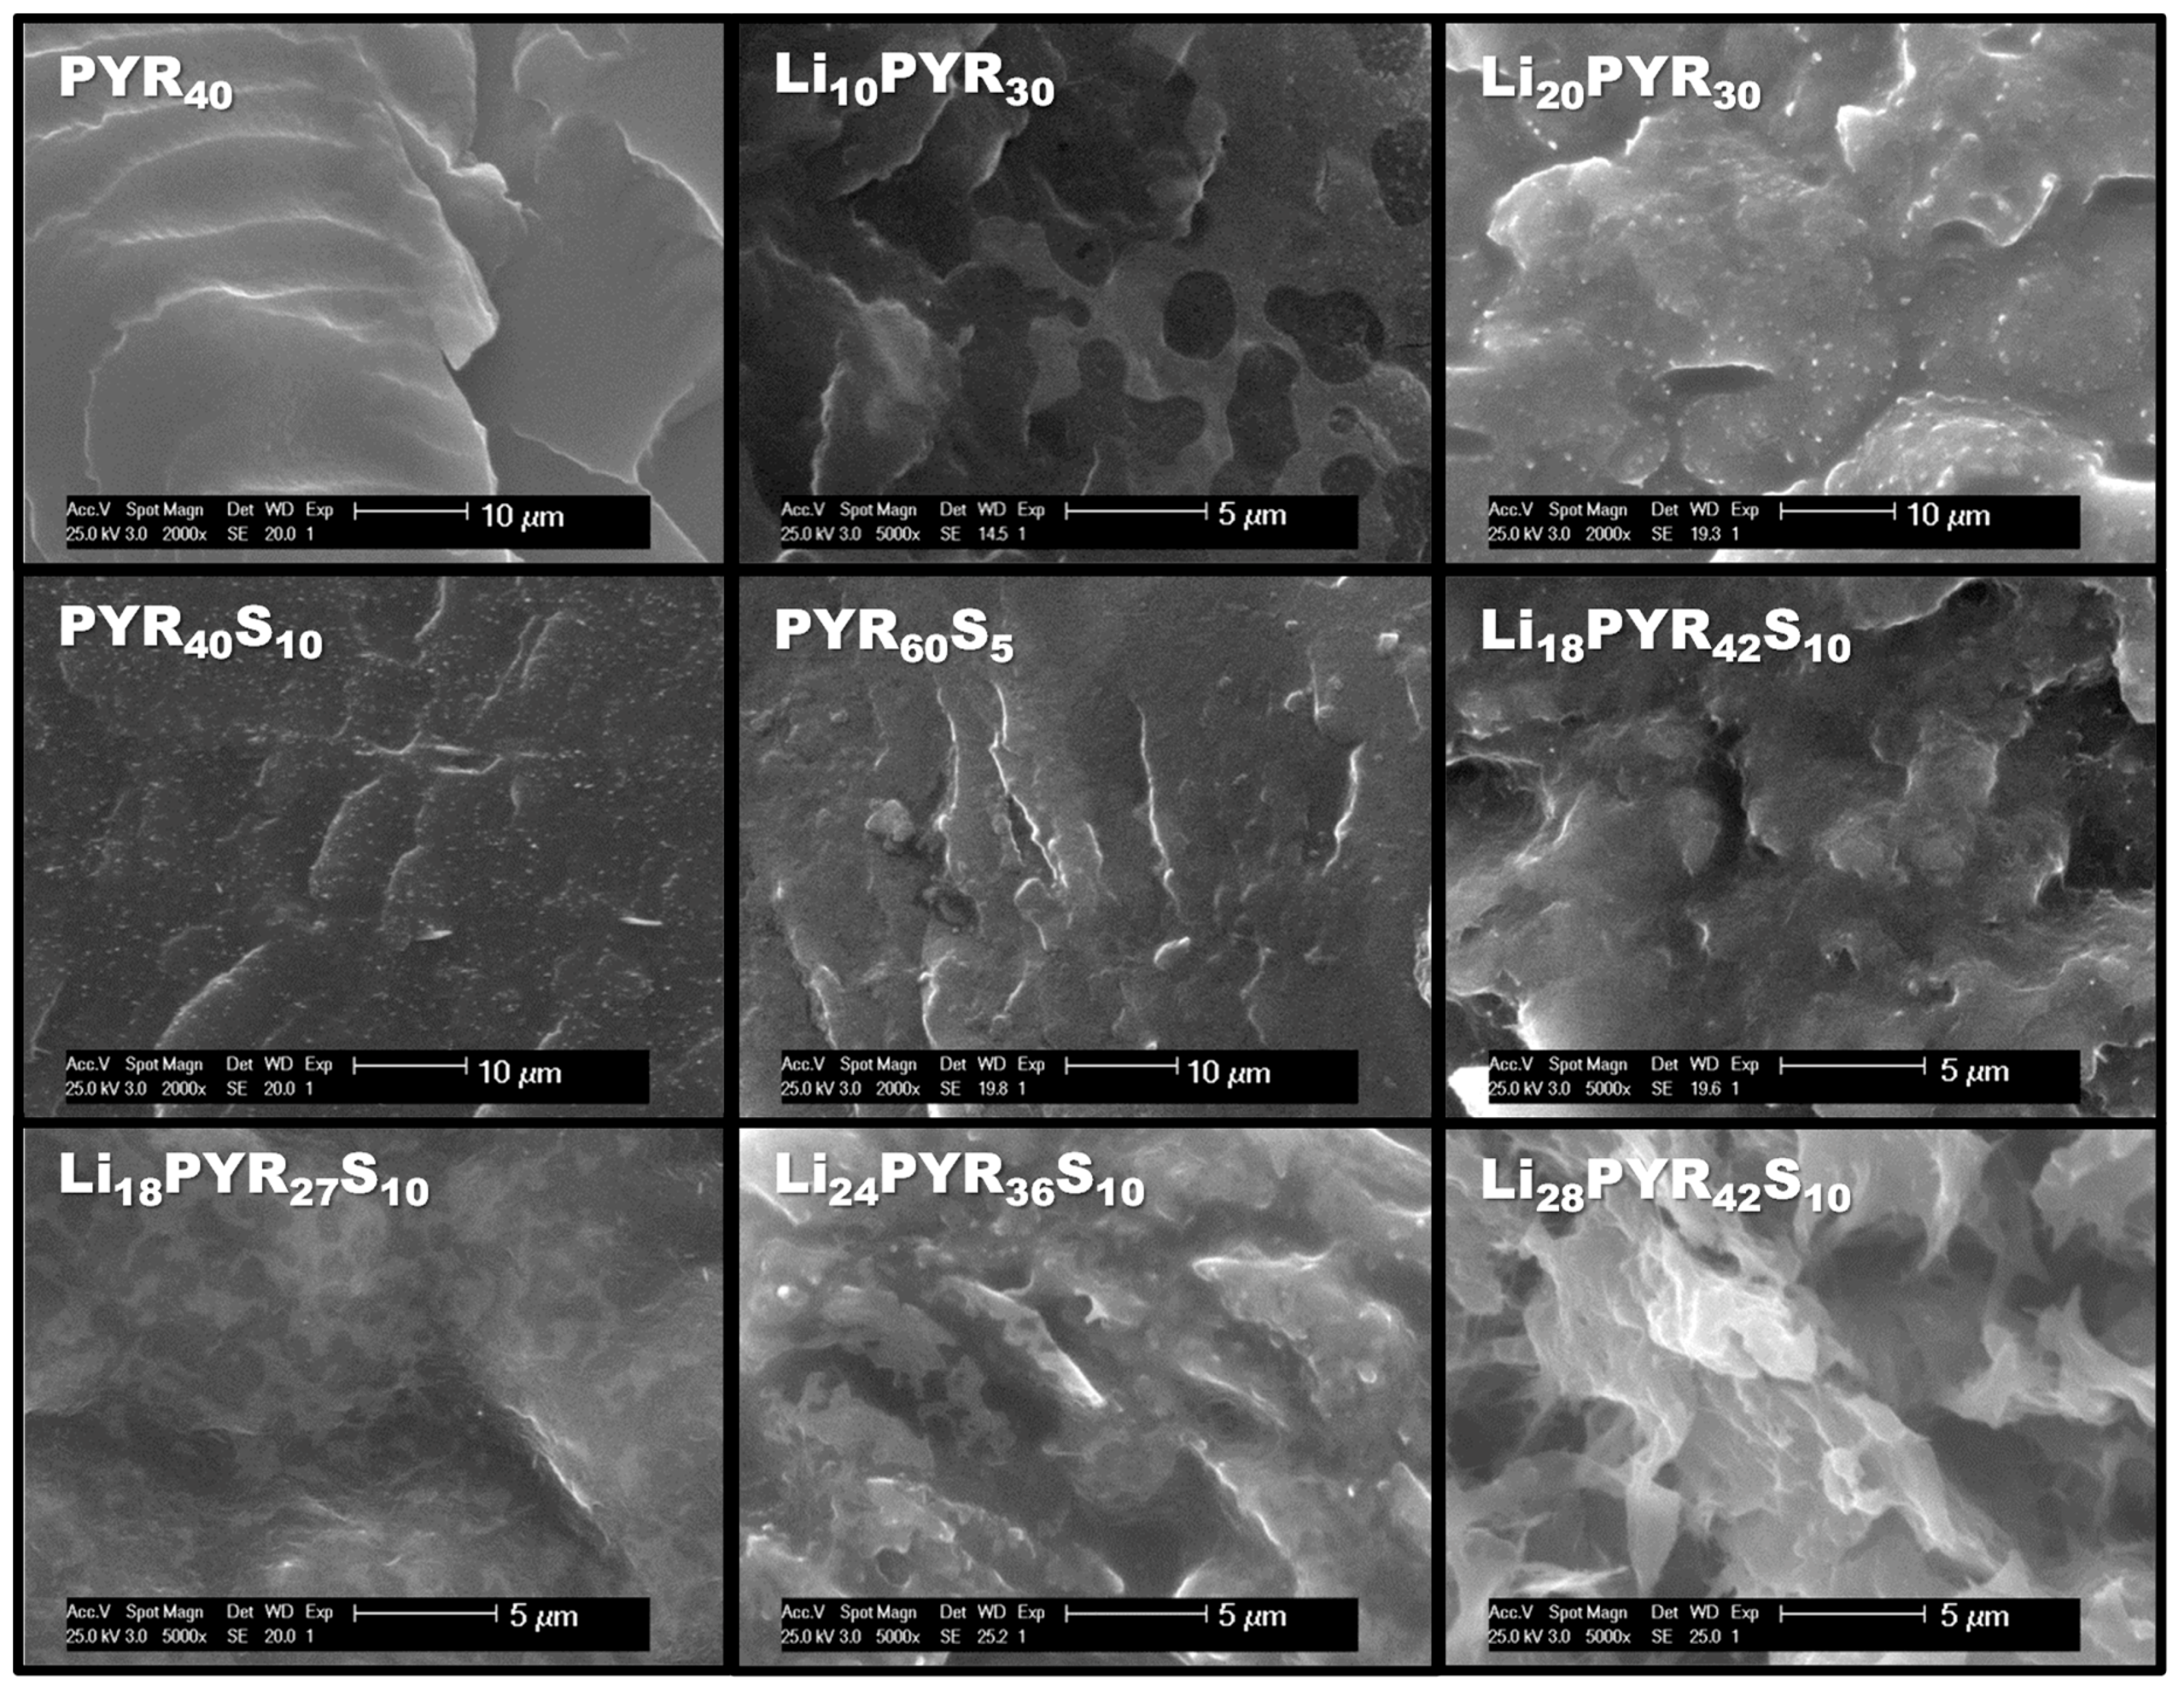
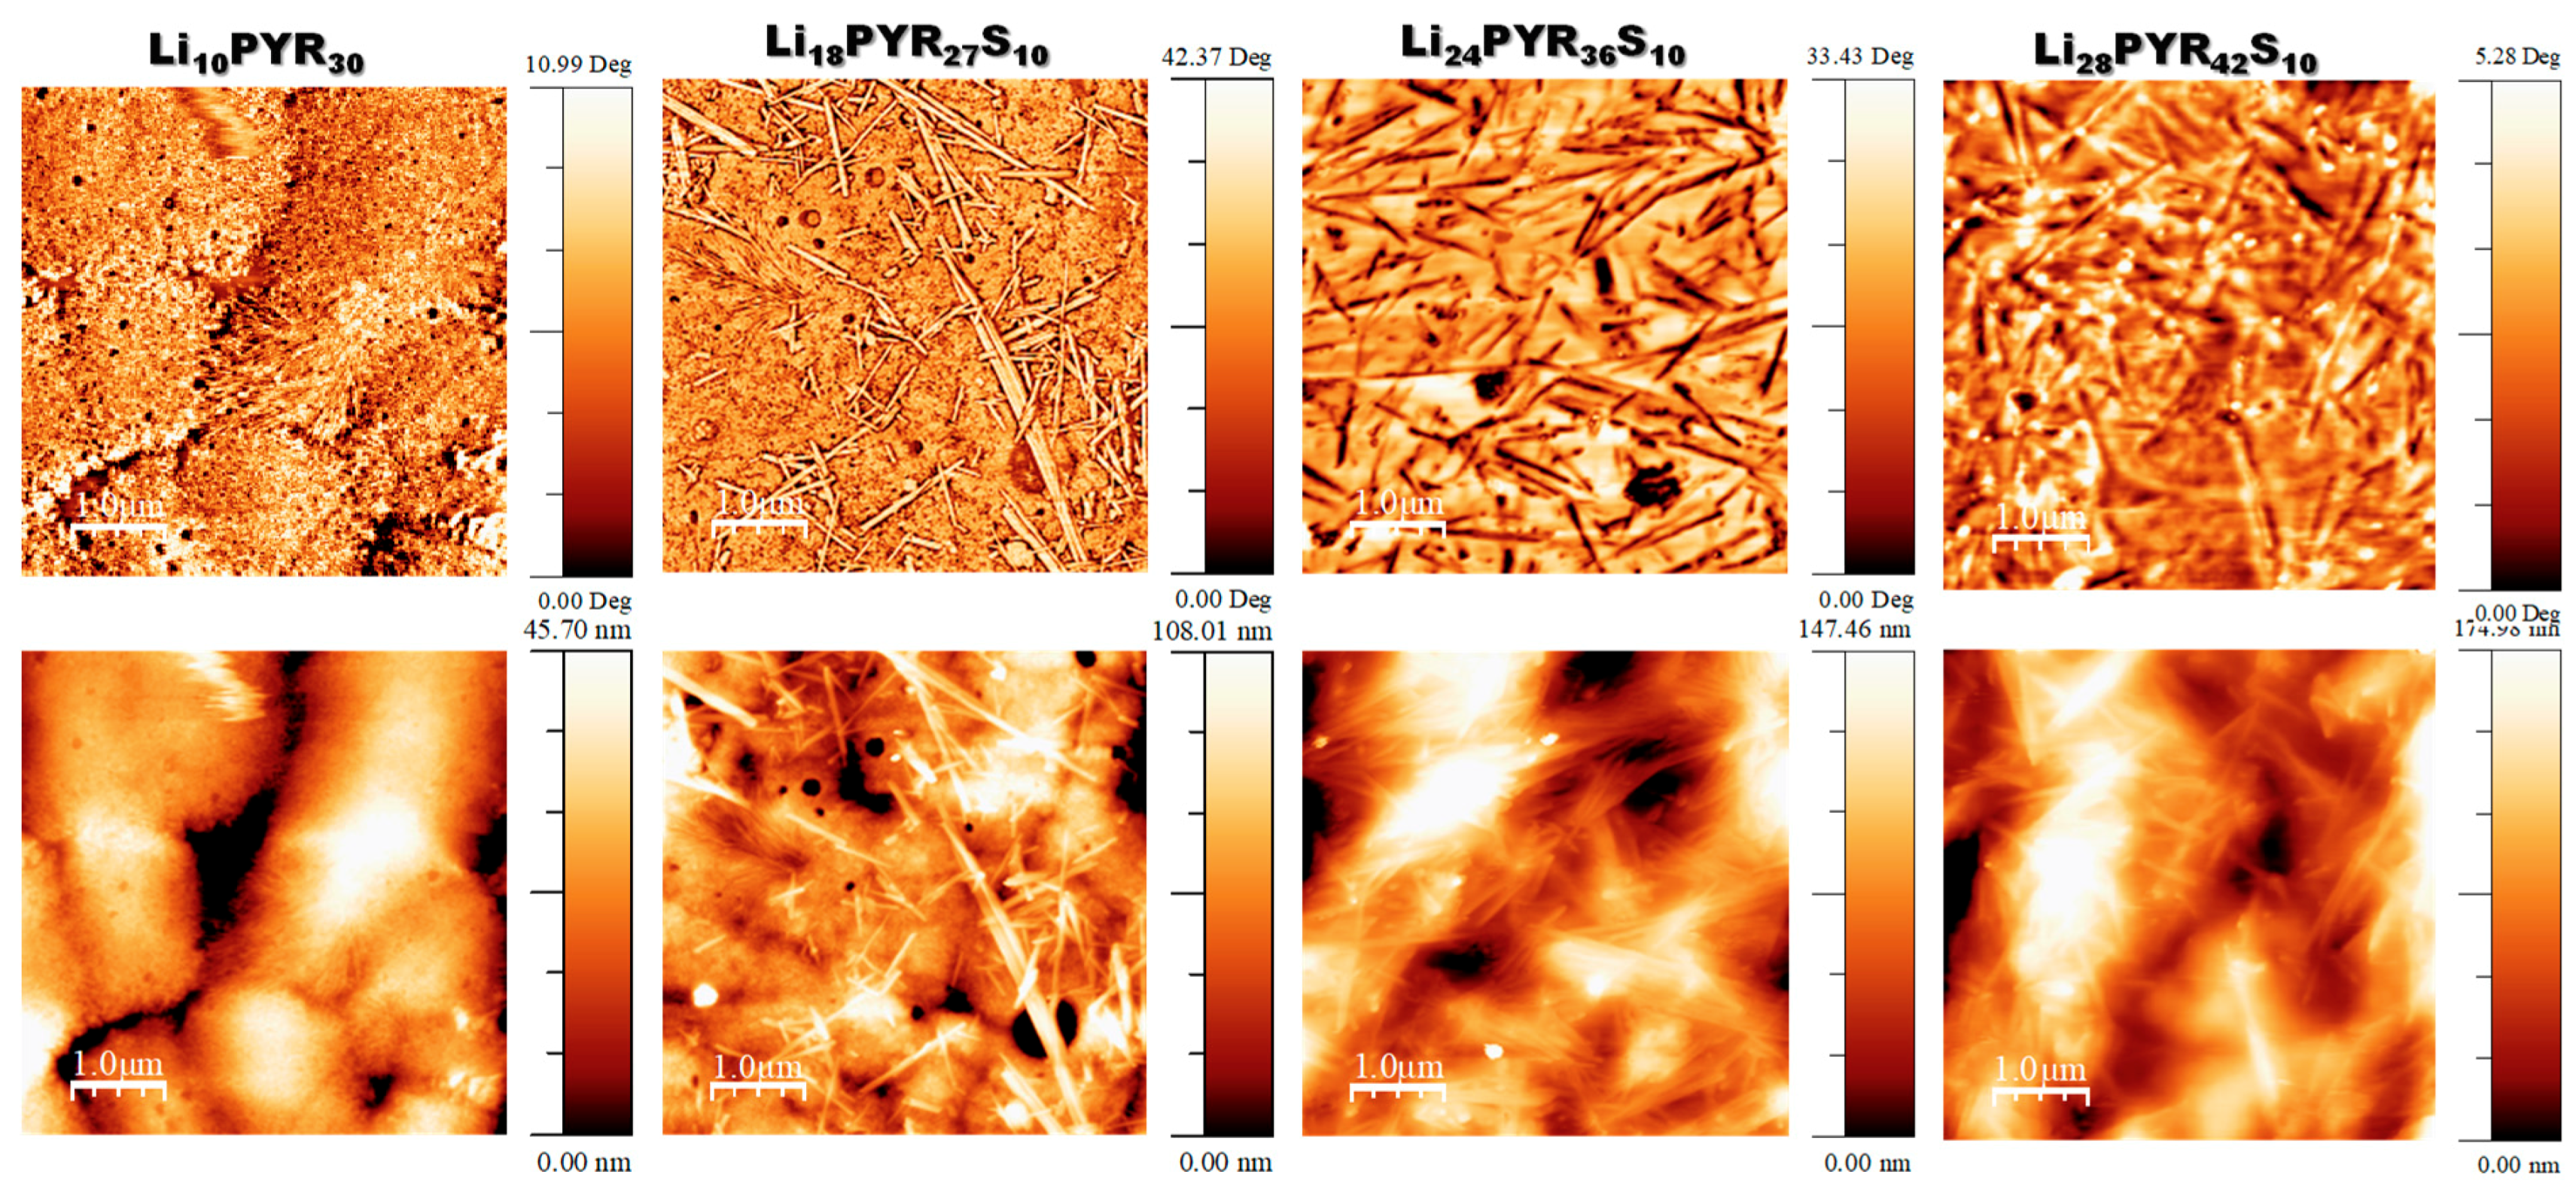
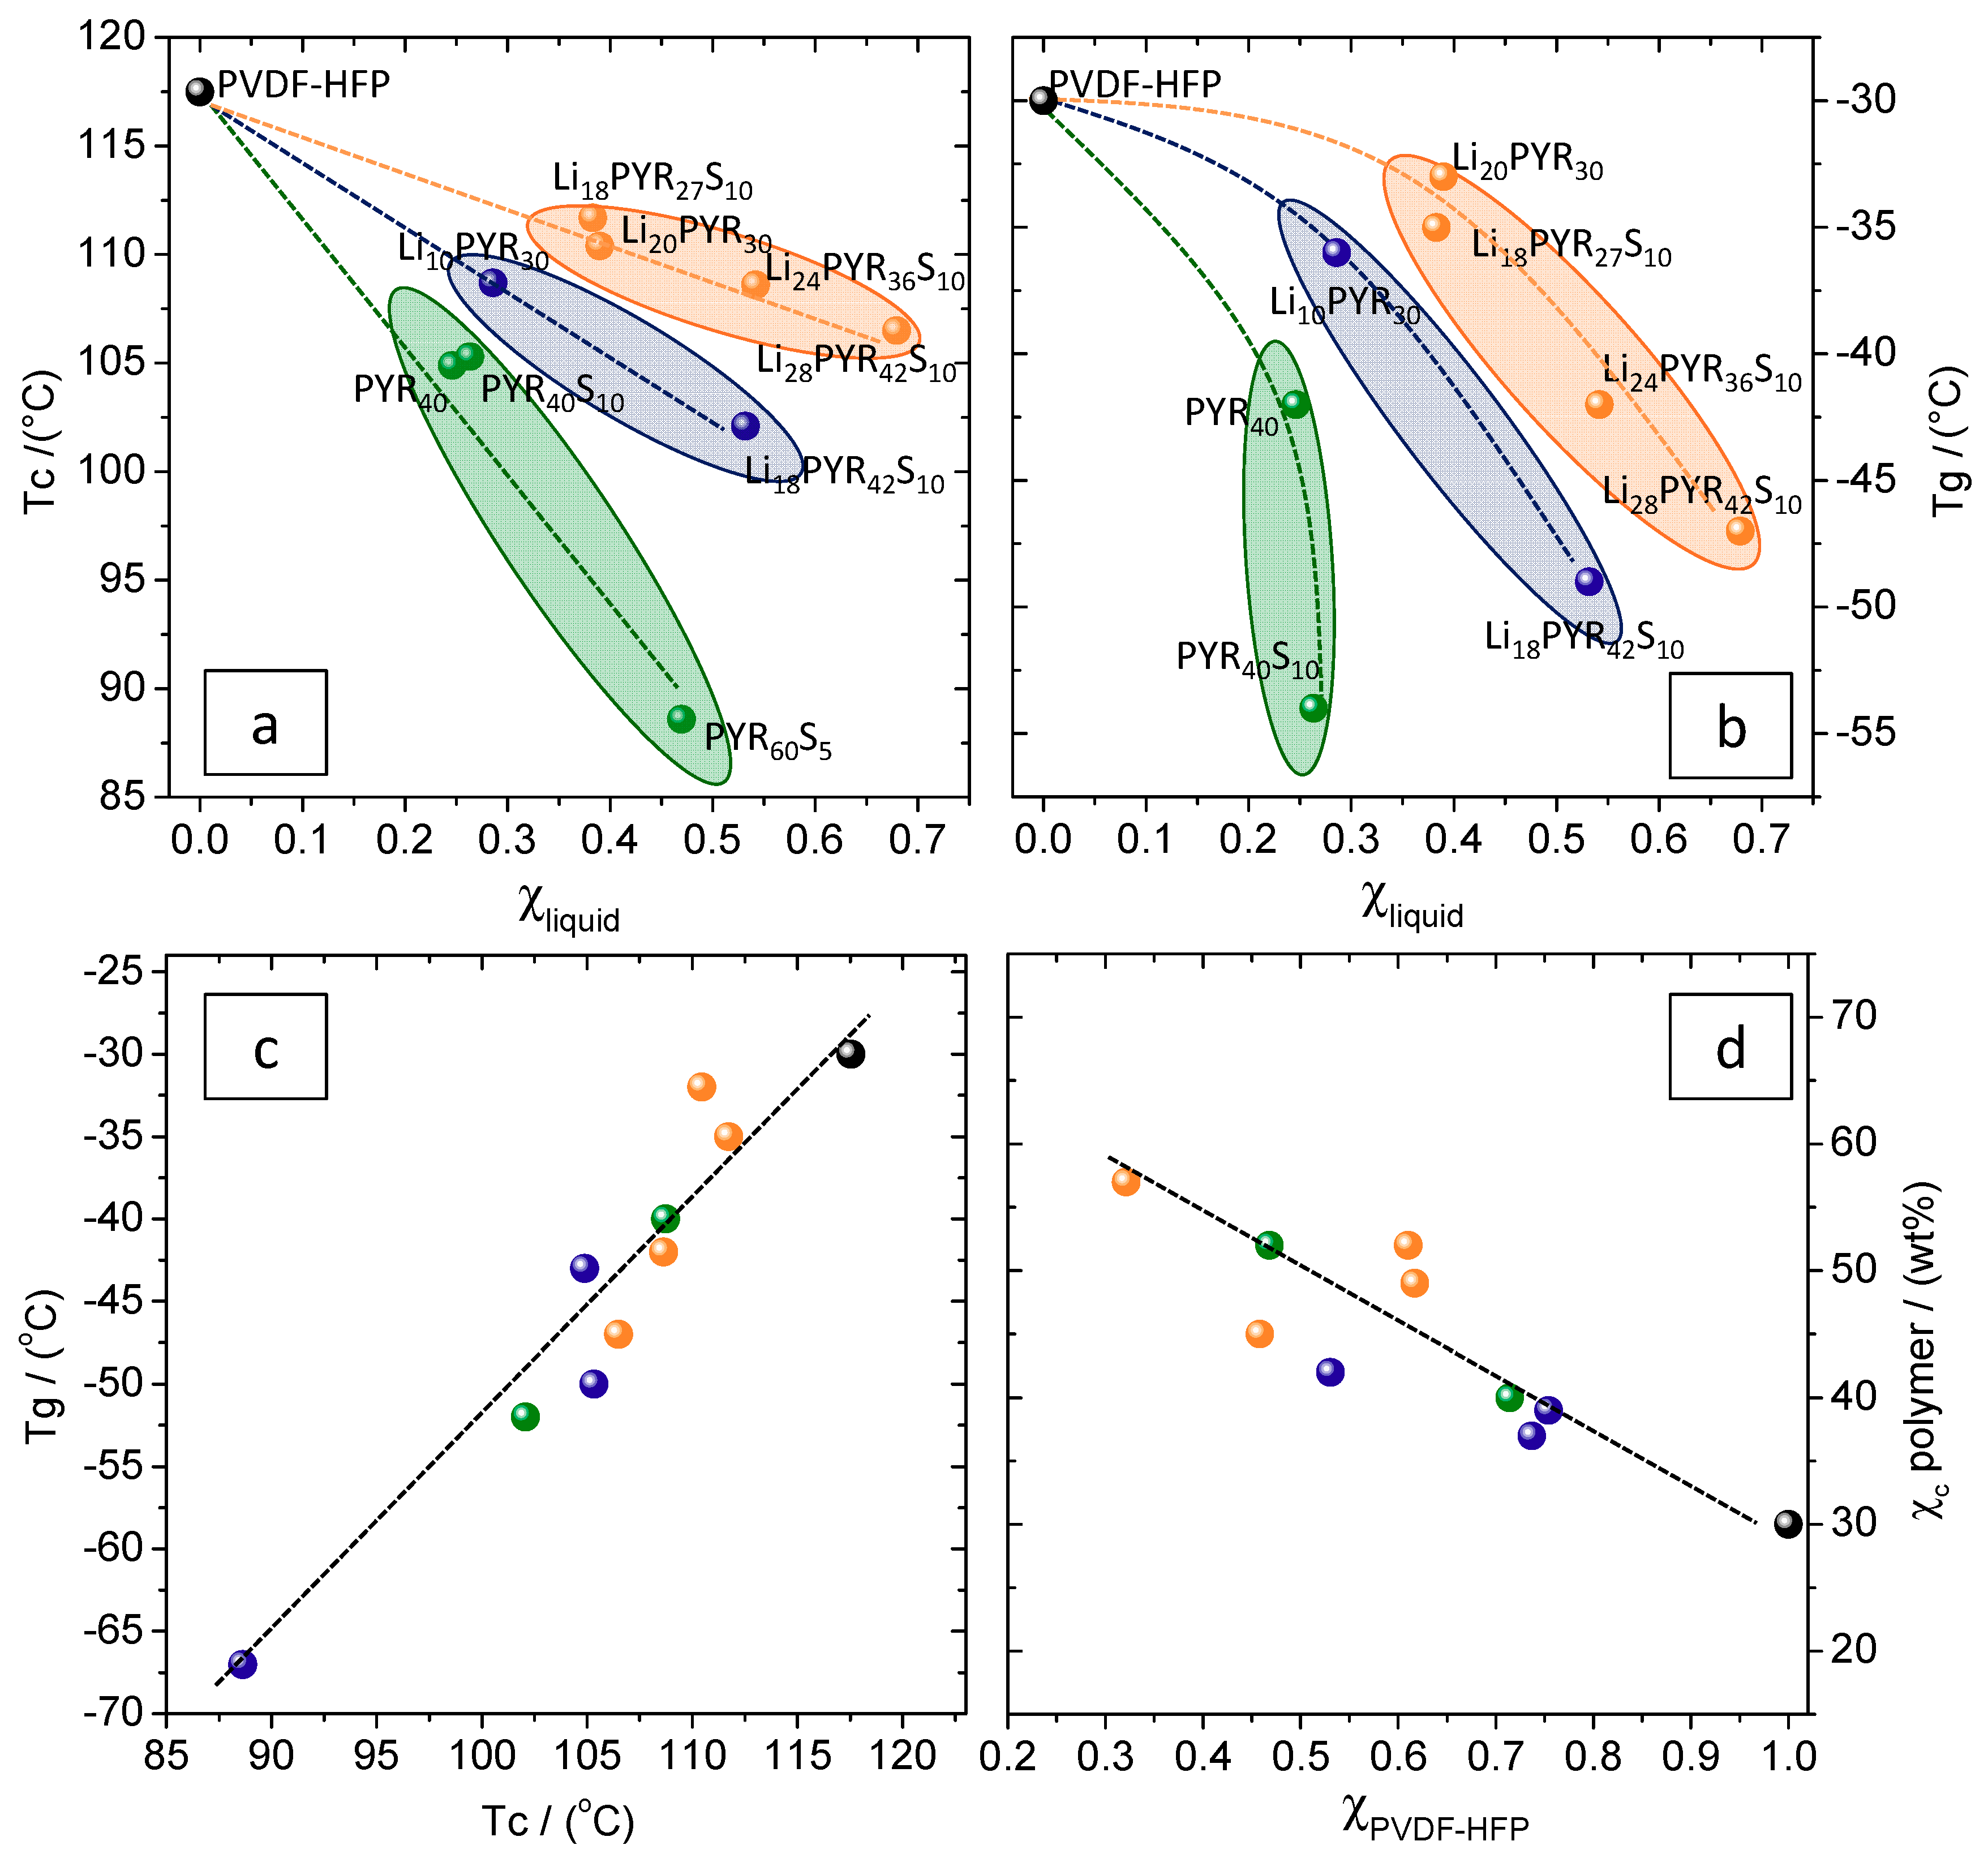
3.1. Miscibility/Compatibility of PVDF–HFP with PYR13TFSI and LiTFSI/PYR13TFSI: Phase Separation into Polymer Rich and Polymer Poor Phases as Seen by AFM and DSC
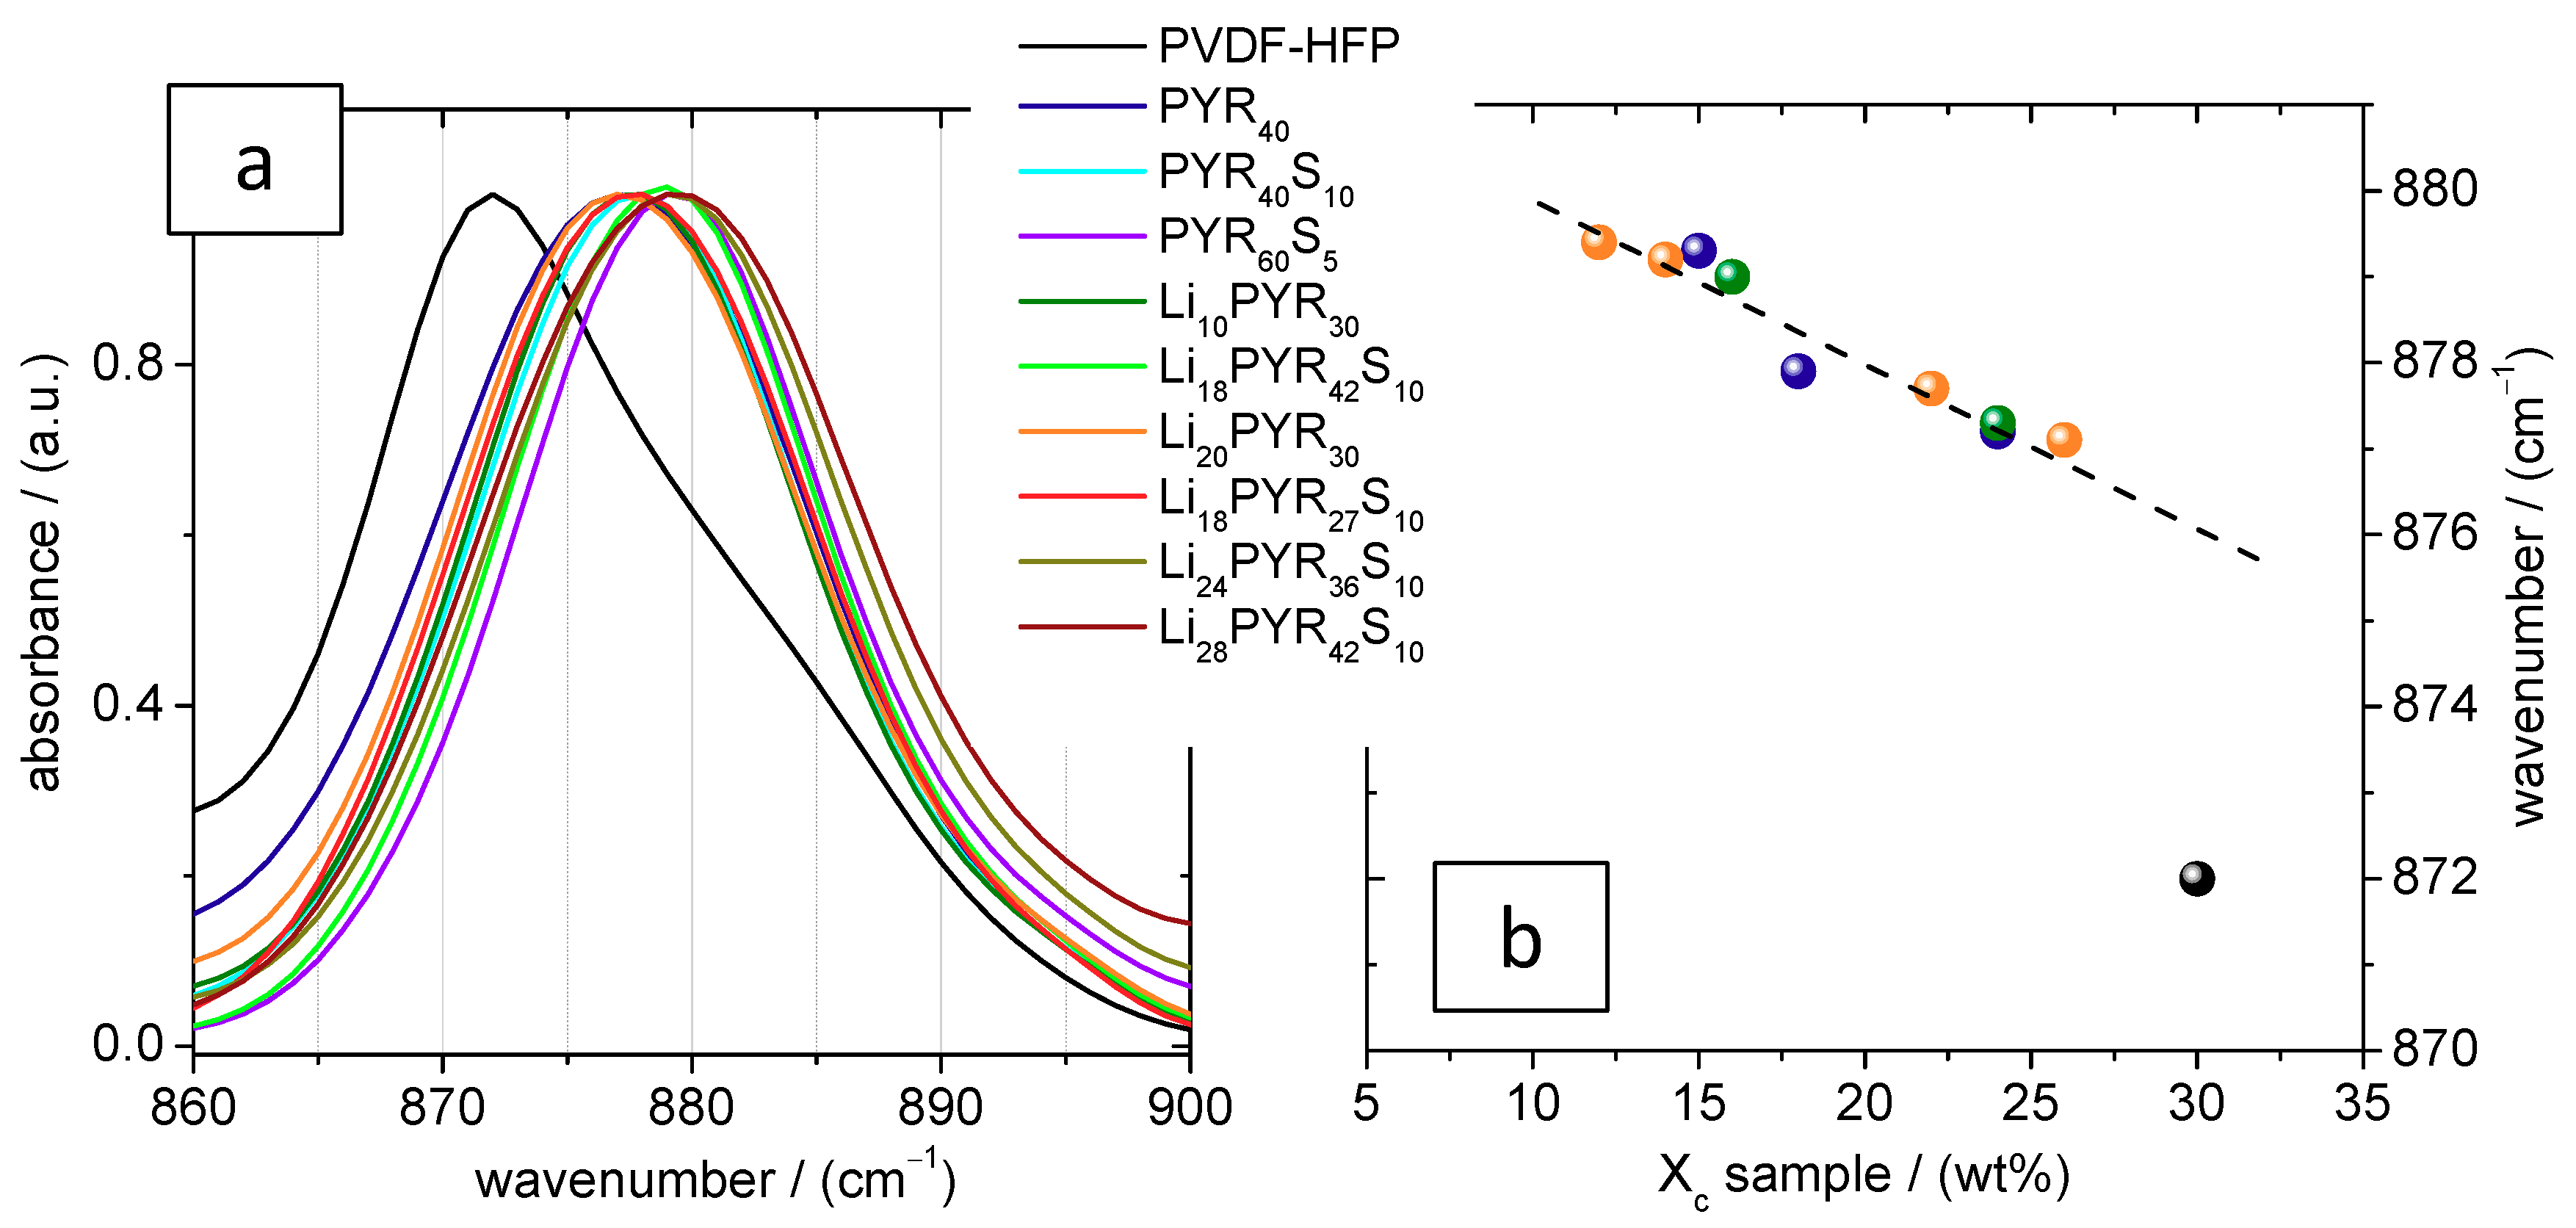
3.2. Crystalline Phase of PVDF–HFP in the Electrolytes
3.3. Mechanical Properties
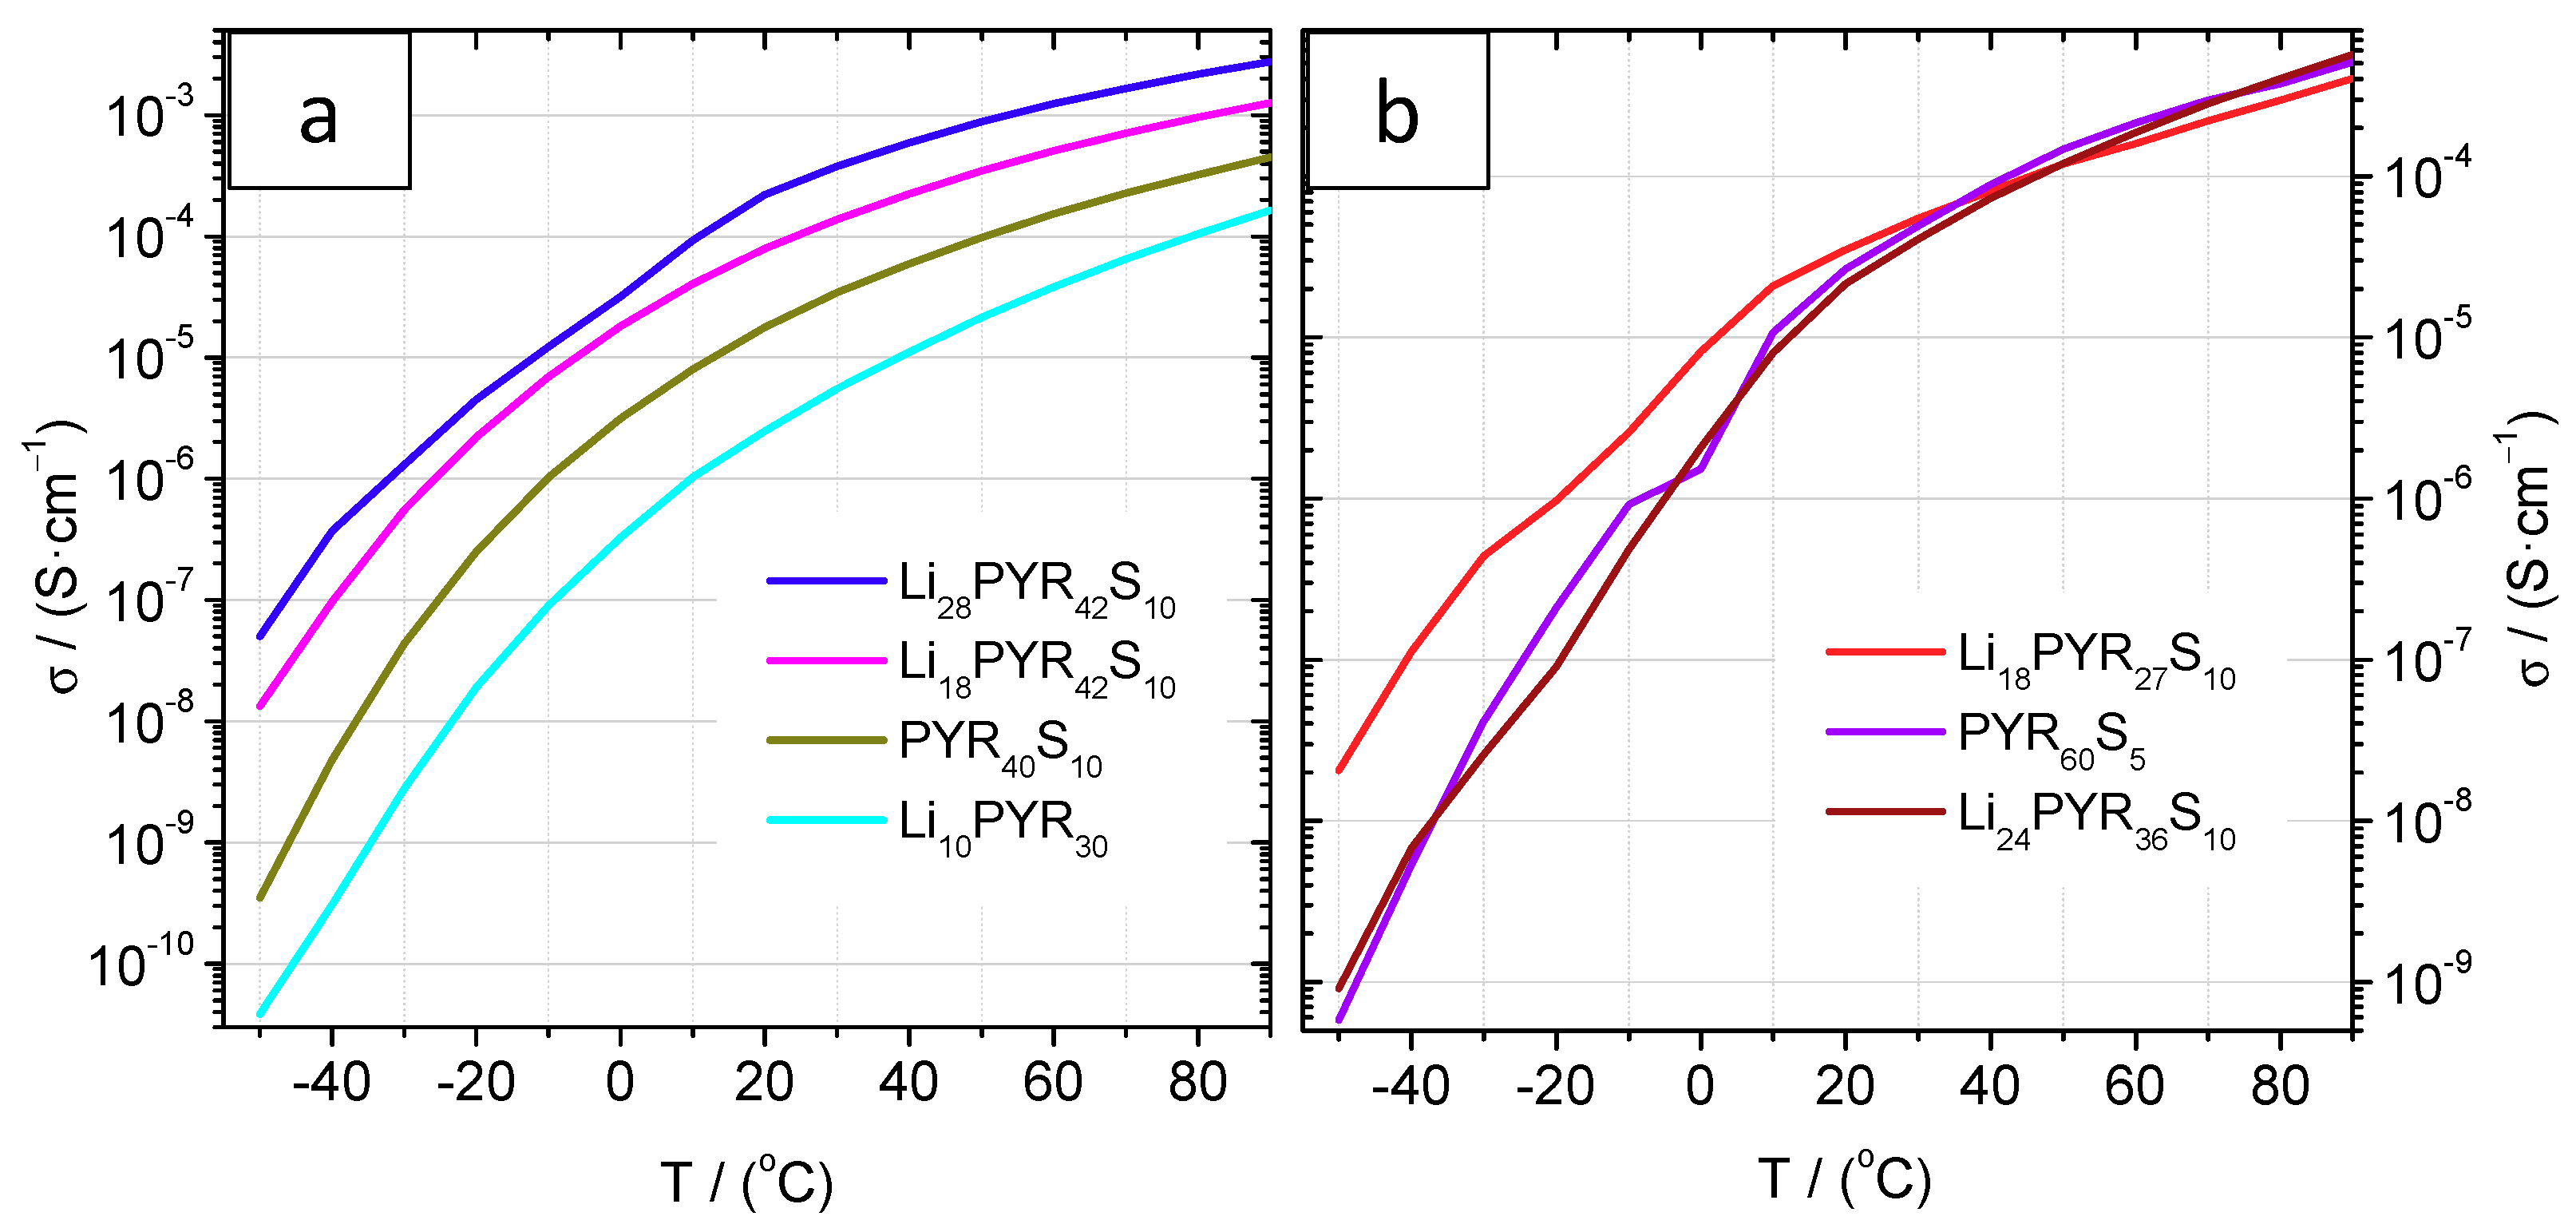
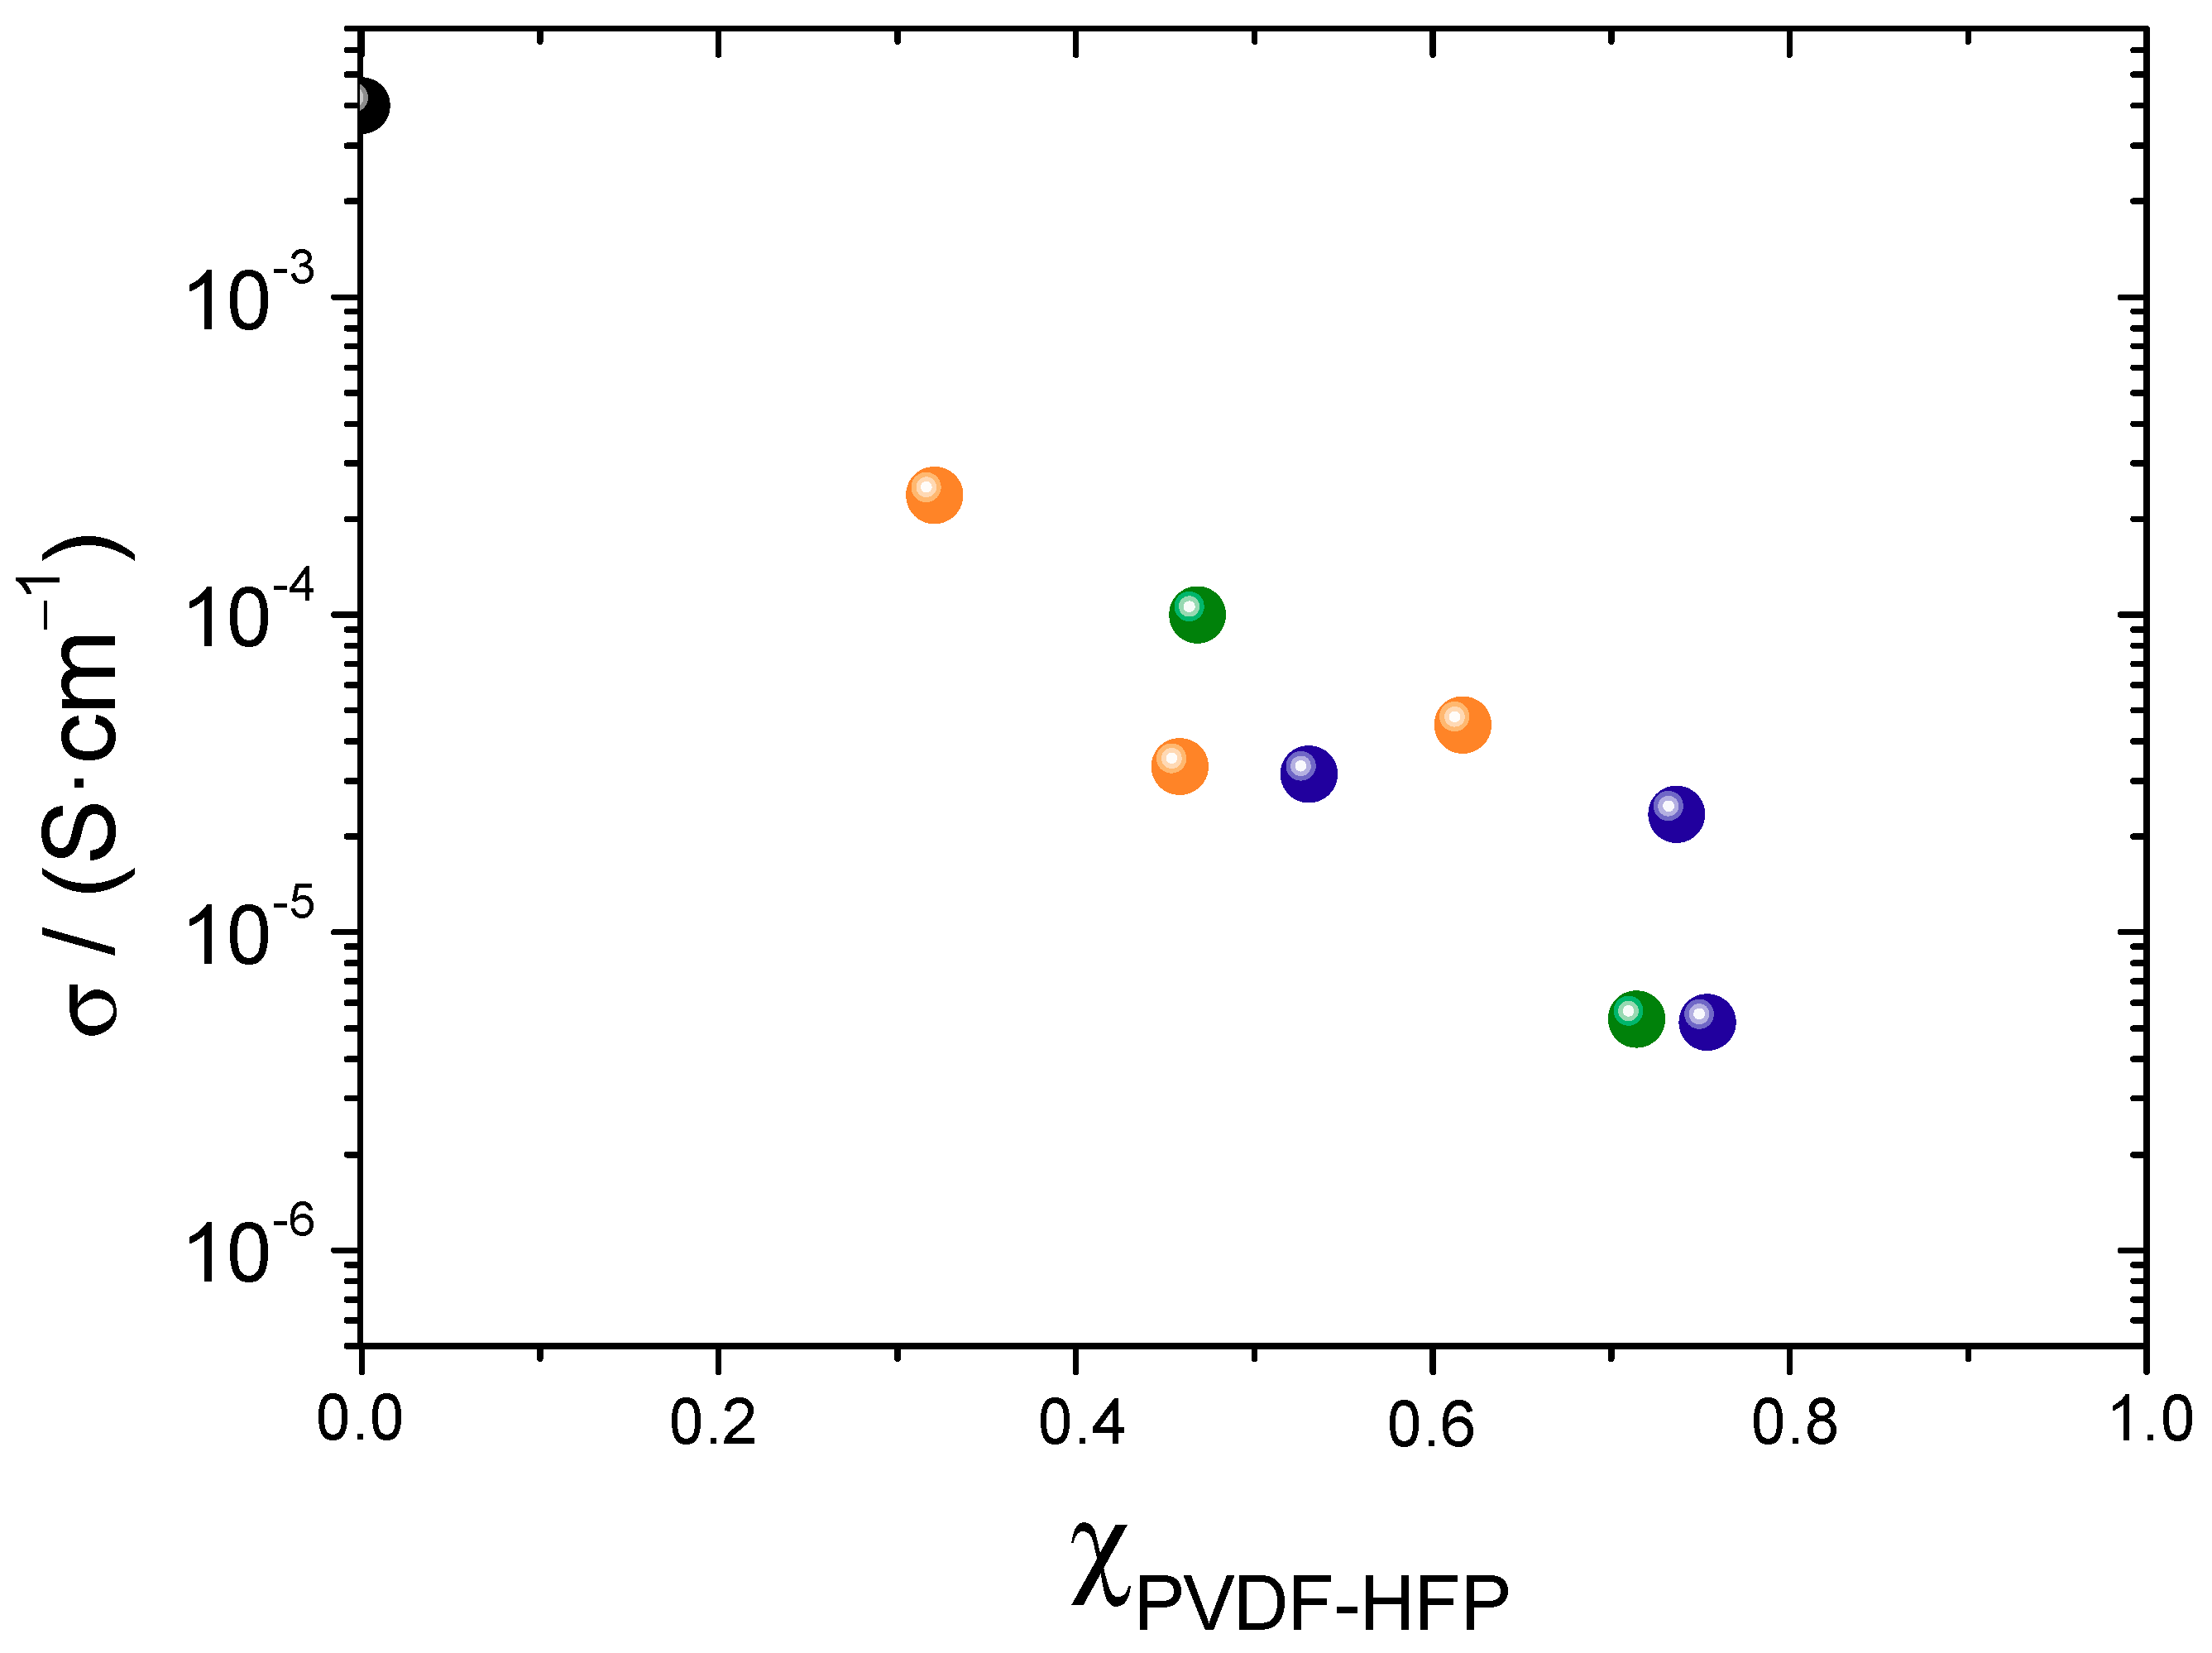
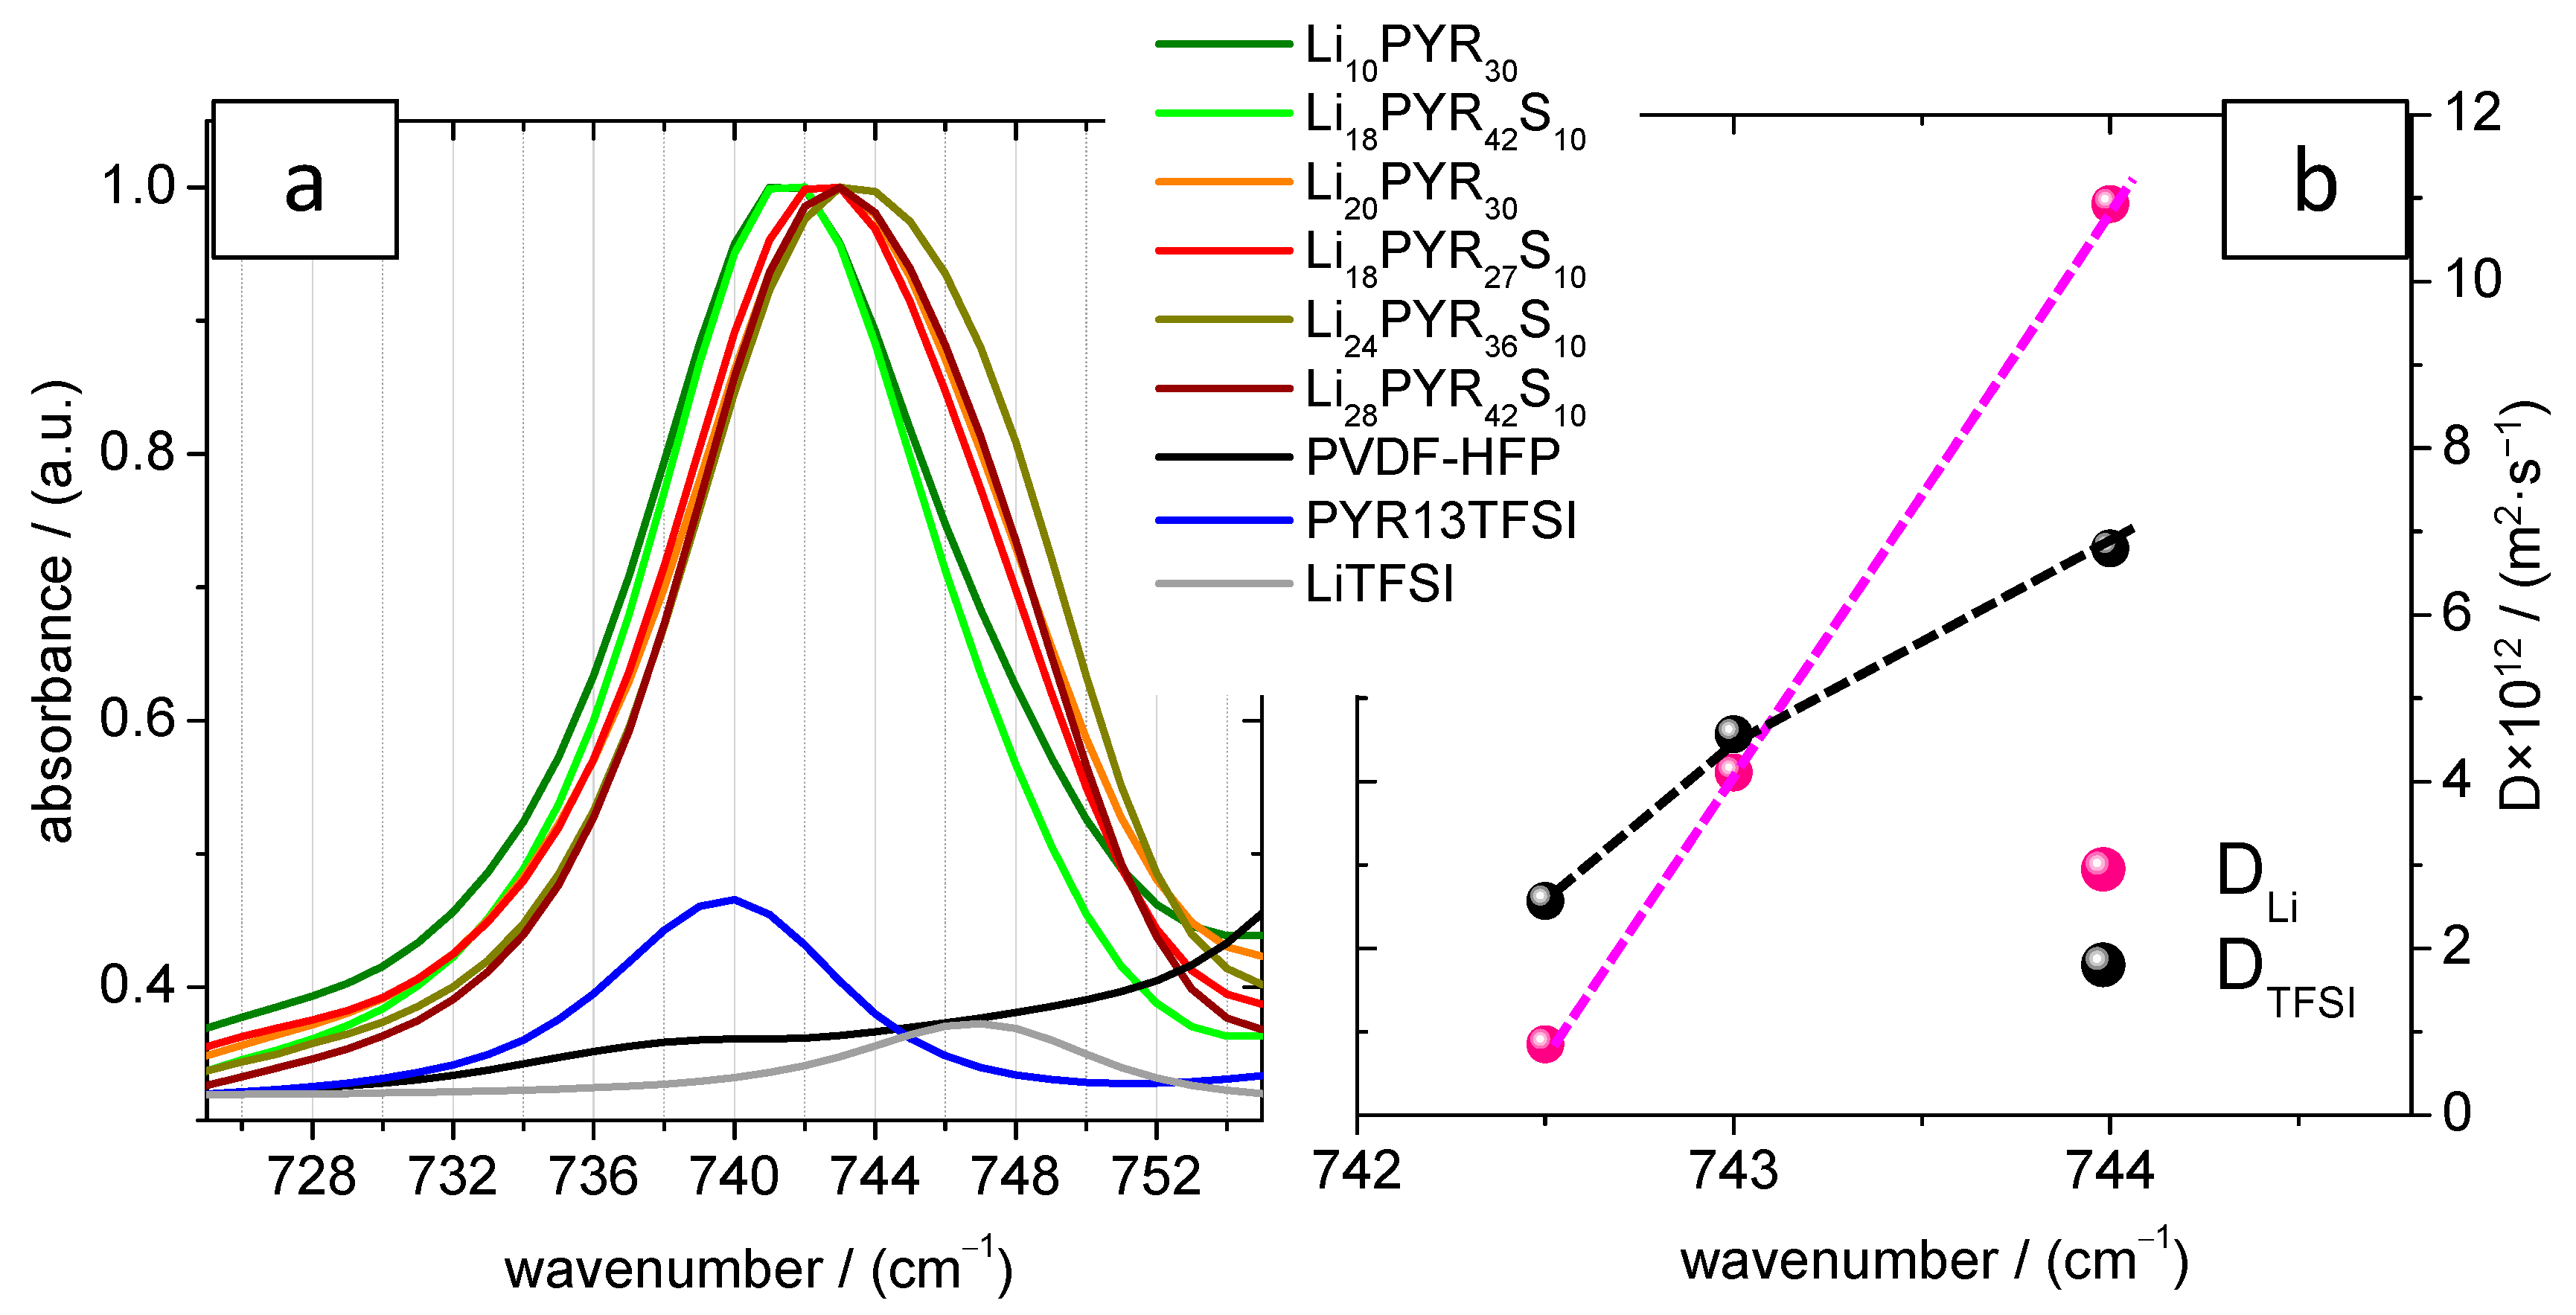
3.4. Conductivity and Ion Diffusivity
4. Conclusions
Supplementary Materials
Author Contributions
Funding
Acknowledgments
Conflicts of Interest
References
- Zhang, W.; Tu, Z.; Qian, J.; Choudhury, S.; Archer, L.A.; Lu, Y. Design principles of functional polymer separators for high-energy, metal-based batteries. Small 2018, 14, 1703001. [Google Scholar] [CrossRef]
- Wang, Q.; Jiang, L.; Yu, Y.; Sun, J. Progress of enhancing the safety of lithium ion battery from the electrolyte aspect. Nano Energy 2019, 55, 93–114. [Google Scholar] [CrossRef]
- Monroe, C.; Newman, J. The impact of elastic deformation on deposition kinetics at lithium/polymer interfaces. J. Electrochem. Soc. 2005, 152, A396–A404. [Google Scholar] [CrossRef]
- Barai, P.; Higa, K.; Srinivasan, V. Lithium dendrite growth mechanisms in polymer electrolytes and prevention strategies. Phys. Chem. Chem. Phys. 2017, 19, 20493–20505. [Google Scholar] [CrossRef]
- Ding, M.S.; Diemant, T.; Behm, R.J.; Passerini, S.; Giffin, G.A. Dendrite growth in mg metal cells containing mg(tfsi)2/glyme electrolytes. J. Electrochem. Soc. 2018, 165, A1983–A1990. [Google Scholar] [CrossRef]
- Wang, K.; Pei, P.; Ma, Z.; Chen, H.; Xu, H.; Chen, D.; Wang, X. Dendrite growth in the recharging process of zinc-air batteries. J. Mater. Chem. A 2015, 3, 22648–22655. [Google Scholar] [CrossRef]
- Azhagurajan, M.; Nakata, A.; Arai, H.; Ogumi, Z.; Kajita, T.; Itoh, T.; Itaya, K. Effect of vanillin to prevent the dendrite growth of zn in zinc-based secondary batteries. J. Electrochem. Soc. 2017, 164, A2407–A2417. [Google Scholar] [CrossRef]
- Mejía, A.; García, N.; Guzmán, J.; Tiemblo, P. Thermoplastic and solid-like electrolytes with liquid-like ionic conductivity based on poly(ethylene oxide) nanocomposites. Solid State Ionics 2014, 261, 74–80. [Google Scholar] [CrossRef] [Green Version]
- Mejía, A.; García, N.; Guzmán, J.; Tiemblo, P. Extrusion processed polymer electrolytes based on poly(ethylene oxide) and modified sepiolite nanofibers: Effect of composition and filler nature on rheology and conductivity. Electrochim. Acta 2014, 137, 526–534. [Google Scholar] [CrossRef]
- Mejía, A.; Benito, E.; Guzmán, J.; Garrido, L.; García, N.; Hoyos, M.; Tiemblo, P. Polymer/ionic liquid thermoplastic electrolytes for energy storage processed by solvent free procedures. ACS Sustain. Chem. Eng. 2016, 4, 2114–2121. [Google Scholar] [CrossRef]
- González, F.; Gregorio, V.; Rubio, A.; Garrido, L.; García, N.; Tiemblo, P. Ionic liquid-based thermoplastic solid electrolytes processed by solvent-free procedures. Polymers 2018, 10, 124. [Google Scholar] [CrossRef]
- Mejía, A.; Devaraj, S.; Guzmán, J.; Lopez Del Amo, J.M.; García, N.; Rojo, T.; Armand, M.; Tiemblo, P. Scalable plasticized polymer electrolytes reinforced with surface-modified sepiolite fillers—A feasibility study in lithium metal polymer batteries. J. Power Sources 2016, 306, 772–778. [Google Scholar] [CrossRef]
- González, F.; Tiemblo, P.; García, N.; Garcia-Calvo, O.; Fedeli, E.; Kvasha, A.; Urdampilleta, I. High performance polymer/ionic liquid thermoplastic solid electrolyte prepared by solvent free processing for solid state lithium metal batteries. Membranes 2018, 8, 55. [Google Scholar] [CrossRef]
- Goodenough, J.B.; Park, K.S. The li-ion rechargeable battery: A perspective. J. Am. Chem. Soc. 2013, 135, 1167–1176. [Google Scholar] [CrossRef]
- Subramania, A.; Kalyana Sundaram, N.T.; Sathiya Priya, A.R.; Vijaya Kumar, G. Preparation of a novel composite micro-porous polymer electrolyte membrane for high performance li-ion battery. J. Membr. Sci. 2007, 294, 8–15. [Google Scholar] [CrossRef]
- Barbosa, J.C.; Dias, J.P.; Lanceros-Méndez, S.; Costa, C.M. Recent advances in poly(vinylidene fluoride) and its copolymers for lithium-ion battery separators. Membranes 2018, 8, 45. [Google Scholar] [CrossRef] [PubMed]
- Fuller, J.; Breda, A.C.; Carlin, R.T. Ionic liquid-polymer gel electrolytes. J. Electrochem. Soc. 1997, 144, L67–L70. [Google Scholar] [CrossRef]
- Costa, C.M.; Gomez Ribelles, J.L.; Lanceros-Méndez, S.; Appetecchi, G.B.; Scrosati, B. Poly(vinylidene fluoride)-based, co-polymer separator electrolyte membranes for lithium-ion battery systems. J. Power Sources 2014, 245, 779–786. [Google Scholar] [CrossRef]
- Ferrari, S.; Quartarone, E.; Mustarelli, P.; Magistris, A.; Fagnoni, M.; Protti, S.; Gerbaldi, C.; Spinella, A. Lithium ion conducting pvdf-hfp composite gel electrolytes based on n-methoxyethyl-n-methylpyrrolidinium bis(trifluoromethanesulfonyl)-imide ionic liquid. J. Power Sources 2010, 195, 559–566. [Google Scholar] [CrossRef]
- Pan, X.; Liu, T.; Kautz, D.J.; Mu, L.; Tian, C.; Long, T.E.; Yang, P.; Lin, F. High-performance n-methyl-n-propylpiperidinium bis(trifluoromethanesulfonyl)imide/poly(vinylidene fluoride-hexafluoropropylene) gel polymer electrolytes for lithium metal batteries. J. Power Sources 2018, 403, 127–136. [Google Scholar] [CrossRef]
- Heo, J.; Choi, Y.; Chung, K.Y.; Park, J.H. Controlled pore evolution during phase inversion from the combinatorial non-solvent approach: Application to battery separators. J. Mater. Chem. A 2016, 4, 9496–9501. [Google Scholar] [CrossRef]
- Gsaiz, P.; Lopes, A.C.; Eizagirre Barker, S.; Fernández de Luis, R.; Arriortua, M.I. Ionic liquids for the control of the morphology in poly(vinylidene fluoride-co-hexafluoropropylene) membranes. Mater. Des. 2018, 155, 325–333. [Google Scholar] [CrossRef]
- Kim, J.K.; Niedzicki, L.; Scheers, J.; Shin, C.R.; Lim, D.H.; Wieczorek, W.; Johansson, P.; Ahn, J.H.; Matic, A.; Jacobsson, P. Characterization of n-butyl-n-methyl-pyrrolidinium bis(trifluoromethanesulfonyl)imide-based polymer electrolytes for high safety lithium batteries. J. Power Sources 2013, 224, 93–98. [Google Scholar] [CrossRef]
- Pitawala, J.; Navarra, M.A.; Scrosati, B.; Jacobsson, P.; Matic, A. Structure and properties of li-ion conducting polymer gel electrolytes based on ionic liquids of the pyrrolidinium cation and the bis(trifluoromethanesulfonyl)imide anion. J. Power Sources 2014, 245, 830–835. [Google Scholar] [CrossRef]
- Mejía, A.; García, N.; Guzmán, J.; Tiemblo, P. Surface modification of sepiolite nanofibers with peg based compounds to prepare polymer electrolytes. Appl. Clay Sci. 2014, 95, 265–274. [Google Scholar] [CrossRef]
- Cai, X.; Lei, T.; Sun, D.; Lin, L. A critical analysis of the α, β and γ phases in poly(vinylidene fluoride) using ftir. RSC Adv. 2017, 7, 15382–15389. [Google Scholar] [CrossRef]
- Savitsky, A.V.; Gorshkova, I.A.; Frolova, I.L.; Shmikk, G.N.; Ioffe, A.F. The model of polymer orientation strengthening and production of ultra-high strength fibers. Polym. Bull. 1984, 12, 195–202. [Google Scholar] [CrossRef]
- Borodin, O.; Smith, G.D.; Henderson, W. Li+ cation environment, transport, and mechanical properties of the litfsi doped n-methyl-n-alkylpyrrolidinium+tfsi- ionic liquids. J. Phys. Chem. B 2006, 110, 16879–16886. [Google Scholar] [CrossRef]
- Pablos, J.L.; García, N.; Garrido, L.; Catalina, F.; Corrales, T.; Tiemblo, P. Polycationic scaffolds for li-ion anion exchange transport in ion gel polyelectrolytes. J. Mater. Chem. A 2018, 6, 11215–11225. [Google Scholar] [CrossRef]
- Pablos, J.L.; García, N.; Garrido, L.; Guzmán, J.; Catalina, F.; Corrales, T.; Tiemblo, P. Highly efficient mixed li+ transport in ion gel polycationic electrolytes. J. Membr. Sci. 2018, 545, 133–139. [Google Scholar] [CrossRef]
- Lassegues, J.C.; Grondin, J.; Talaga, D. Lithium solvation in bis(trifluoromethanesulfonyl)imide-based ionic liquids. Phys. Chem. Chem. Phys. 2006, 8, 5629–5632. [Google Scholar] [CrossRef] [PubMed]


| Sample | PVDF–HFP (mol m−3) | PYR13TFSI (mol m−3) | TPGS-S (wt %) | LiTFSI (mol m−3) | Xc (wt %) Sample | Xc (wt %) Polymer | Tc (°C) | Tg (°C) | E (Mpa) | Elongation at Break (%) |
|---|---|---|---|---|---|---|---|---|---|---|
| PVDF–HFP | 30 | 30 | 117.5 | −30 | 398.5 | 344.7 | ||||
| PYR40 | 4600 | 1500 | 0 | 0,0 | 24 | 39 | 104.9 | −43 | 19.6 | 556.4 |
| Li10PYR30 | 4500 | 1200 | 0 | 600 | 24 | 40 | 108.7 | −39 | 128.2 | 677.2 |
| Li 20PYR30 | 3600 | 1200 | 0 | 1100 | 26 | 52 | 110.4 | −32 | 187.1 | 595.1 |
| PYR40S10 | 4200 | 1500 | 10 | 0 | 18 | 37 | 105.3 | −50 | 71.1 | 530.2 |
| PYR60S5 | 2600 | 2300 | 5 | 0 | 15 | 42 | 88.6 | - | 57 | 21.5 |
| Li18PYR27S10 | 2900 | 900 | 10 | 900 | 22 | 49 | 111.7 | −35 | 107.5 | 404.6 |
| Li18PYR42S10 | 2200 | 1600 | 10 | 900 | 16 | 52 | 102.1 | −52 | 39.7 | 46.4 |
| Li24PYR36S10 | 2200 | 1300 | 10 | 1300 | 14 | 45 | 108.6 | −42 | 67.4 | 13.0 |
| Li28PYR42S10 | 1390 | 1470 | 10 | 1470 | 12 | 57 | 106.5 | −47 | 49.3 | 34.9 |
| Sample | σ (mS·cm−1) | Diffusion (25 °C) 1012 (m2·s−1) | σNE (mS·cm−1) | α | |||
|---|---|---|---|---|---|---|---|
| σ (25 °C) | σ (75 °C) | DLi | DTFSI | Global | Li | ||
| PYR40 | 5 × 10⁻³ | - | - | - | - | - | - |
| Li10PYR30 | 5 × 10⁻³ | 0.09 | - | - | - | - | - |
| Li20PYR30 | 7 × 10⁻⁴ | - | - | - | - | - | - |
| PYR40S10 | 0.02 | 0.28 | - | - | - | - | - |
| PYR60S10 | 0.03 | 0.34 | - | - | - | - | - |
| Li18PYR27S10 | 0.05 | 0.26 | 0.8 | 2.6 | 0.29 | 0.03 | 0.16 |
| Li18PYR42S10 | 0.10 | 0.82 | - | - | - | - | - |
| Li24PYR36S10 | 0.03 | 0.35 | 10.9 | 6.8 | 1.52 | 0.52 | 0.02 |
| Li28PYR42S10 | 0.24 | 1.81 | 4.1 | 4.6 | 0.98 | 0.22 | 0.24 |
© 2019 by the authors. Licensee MDPI, Basel, Switzerland. This article is an open access article distributed under the terms and conditions of the Creative Commons Attribution (CC BY) license (http://creativecommons.org/licenses/by/4.0/).
Share and Cite
Gregorio, V.; García, N.; Tiemblo, P. Solvent-Free and Scalable Procedure to Prepare PYR13TFSI/LiTFSI/PVDF–HFP Thermoplastic Electrolytes with Controlled Phase Separation and Enhanced Li Ion Diffusion. Membranes 2019, 9, 50. https://doi.org/10.3390/membranes9040050
Gregorio V, García N, Tiemblo P. Solvent-Free and Scalable Procedure to Prepare PYR13TFSI/LiTFSI/PVDF–HFP Thermoplastic Electrolytes with Controlled Phase Separation and Enhanced Li Ion Diffusion. Membranes. 2019; 9(4):50. https://doi.org/10.3390/membranes9040050
Chicago/Turabian StyleGregorio, Víctor, Nuria García, and Pilar Tiemblo. 2019. "Solvent-Free and Scalable Procedure to Prepare PYR13TFSI/LiTFSI/PVDF–HFP Thermoplastic Electrolytes with Controlled Phase Separation and Enhanced Li Ion Diffusion" Membranes 9, no. 4: 50. https://doi.org/10.3390/membranes9040050