Article

Enhancing Polysulfone Mixed-Matrix Membranes with Amine-Functionalized Graphene Oxide for Air Dehumidification and Water Treatment

1
Chemical Engineering Program, Texas A&M University at Qatar, Doha 23874, Qatar
2
Gulf Organisation for Research & Development (GORD), Qatar Science & Technology Park, Tech1 Bldg, Suite 203, Doha 210162, Qatar
*
Author to whom correspondence should be addressed.
Membranes 2023, 13(7), 678; https://doi.org/10.3390/membranes13070678
Submission received: 17 May 2023 / Revised: 11 July 2023 / Accepted: 13 July 2023 / Published: 19 July 2023
(This article belongs to the Special Issue Nanocomposite Membranes for Water Treatment and Desalination)

Abstract

:
Porous low-pressure membranes have been used as active membranes in water treatment and as support for thin-film composite membranes used in water desalination and gas separation applications. In this article, microfiltration polysulfone (PSf)mixed-matrix membranes (MMM) containing amine-functionalized graphene oxide (GO-NH2) were fabricated via a phase inversion process and characterized using XPS, SEM, AFM, DMA, XRD, and contact angle measurements. The effect of GO-NH2 concentration on membrane morphology, hydrophilicity, mechanical properties, and oil–water separation performance was analyzed. Significant enhancements in membrane hydrophilicity, porosity, mechanical properties, permeability, and selectivity were achieved at very low GO-NH2 concentrations (0.05–0.2 wt.%). In particular, the water permeability of the membrane containing 0.2 wt.% GO-NH2 was 92% higher than the pure PSf membrane, and the oil rejection reached 95.6% compared to 91.7% for the pure PSf membrane. The membrane stiffness was also increased by 98% compared to the pure PSf membrane. Importantly, the antifouling characteristics of the PSf-GO-NH2 MMMs were significantly improved. When filtering 100 ppm bovine serum albumin (BSA) solution, the PSf-GO-NH2 MMMs demonstrated a slower flux decline and an impressive flux recovery after washing. Notably, the control membrane showed a flux recovery of only 69%, while the membrane with 0.2 wt.% GO-NH2 demonstrated an exceptional flux recovery of 88%. Furthermore, the membranes exhibited enhanced humidity removal performance, with a permeance increase from 13,710 to 16,408. These results indicate that the PSf-GO-NH2 MMM is an excellent candidate for reliable oil–water separation and humidity control applications, with notable improvements in antifouling performance.

1. Introduction

Water security is a global challenge caused by population growth, climate change, agriculture, and industrialization, resulting in water-stressed regions [1,2]. To address this challenge, innovative technologies for wastewater reuse are crucial [1]. Oily wastewater production has notably increased due to industrial activities like oil and gas extraction, food processing, and metal treatment [2]. In the US alone, daily production reaches volumes of 1.7 to 2.3 billion gallons [3]. Treating these oily water streams is vital to protect the environment and human health, as they are carcinogenic and harmful to ecosystems [4]. Various technologies, including membrane filtration, are being developed for oil–water separation [5]. Membrane technology offers high oil rejection rates and versatility in treating a wide range of compositions [6].
Porous membranes, such as polysulfone (PSf), are commonly used in oil–water separation and as a support for air dehumidification membranes [7,8]. However, the water vapor permeance (WVP) performance of existing porous supports, like PES and PSf, is limited [9,10,11,12]. Ultrafiltration polymeric membranes, particularly PSf, have demonstrated good performance in oil–water separation [13,14,15]. Additionally, membranes have been proposed as exciting candidates for humidity control by separating water from air [7,8]. To further optimize their reliability and reduce cleaning costs, incorporating nanomaterials into the polymer matrix is an effective approach [10]. These composite membranes, known as mixed-matrix membranes (MMMs), enhance permeability, mechanical stability, rejection, and antifouling properties.
Two-dimensional (2D) graphene oxide (GO) and its derivatives are promising nanomaterials for membrane modification. GO has an sp2 carbon honeycomb structure similar to graphene but contains oxygen functional groups such as hydroxyl (–OH), epoxy (C–O–C), carbonyl (C––O), and carboxylic (–COOH) [16]. GO has remarkable properties like high reactivity and solubility, ease of synthesis, and a very hydrophilic nature [17,18]. These properties make GO one of the most researched dope nanomaterials for membrane modification [19,20,21,22,23]. However, GO alone may not be sufficient to achieve the desired performance of the membranes, as it may suffer from leaching, aggregation, or instability. Therefore, various strategies have been developed to functionalize GO with different molecules or nanoparticles to enhance its properties and interactions with the polymer matrix [24,25].
Hwang et al. reported the fabrication of PSf membranes coated with a hydrophilic layer of GO. A phase inversion process first fabricated the PSf membranes. The prepared PSf/GO membrane improved hydrophilicity, permeability, and antifouling performance. The contact angle of the PSf/GO membrane decreased by 20.5° compared to the pure PSf membrane. Moreover, the flux recovery after fouling of the PSf/GO improved from 85.6% for PSf membrane to 90.4% for PSf/GO membrane [26]. However, these PSf/GO membranes suffer from leaching and delamination of the coated GO layer from the membrane surface, limiting their potential application [27]. PEBA MMMs with GO also face some additional challenges, such as aggregation and uneven dispersion of GO sheets, and weak interfacial adhesion between GO and the PEBA matrix [28]. Functionalized nanofillers or a coating material help to improve the hydrophilicity, antifouling, and antibacterial properties of membranes [25,29], which is important for their longevity.
Luque-Alled and coworkers [30] incorporated various concentrations of GO functionalized with 3-aminopropyltriethoxysilane (APTS) (APTS-GO) into the matrix of polyethersulfone (PES) and fabricated a MMM via non-solvent induced phase inversion (NIPS). The membrane porosity was significantly decreased upon adding APTS-GO, changing the membrane type from UF to NF. Additionally, a higher water flux of 9.9 L/m2hr Bar (LMH/bar) was achieved using the 0.1 wt.% APTS-GO membrane compared to 0.5 LMH/bar for the pure PES membrane. The performance of the membrane for rejection of magnesium sulfate (MgSO4), sunset yellow dye (SY), acridine orange dye (AO), and bovine serum albumin (BSA) was analyzed. The achieved rejection was 96.5%, 97.4%, 96.5%, and 51.6% for BSA, SY, AO, and MgSO4, respectively. Furthermore, improved antifouling and mechanical characteristics were obtained upon incorporating APTS-GO.
Zambare et al. [31] studied the impact of the amine chain length on coupling-agent-assisted GO functionalization with ethylenediamine, diethylenetriamine, and triethylenetetramine. The functionalized GO was then incorporated into the PSf solution to fabricate MMMs and investigate their performance. The functionalized GO membranes’ characteristics and performances were improved in terms of pure water flux, which reached 170.5 LMH/bar compared to 56.1 LMH/bar for the control membrane. The highest performances were attained by the 1.0 wt.% of EDA/GO membrane, as EDA reacted the most during the reaction, achieving the highest conversion among other amines. Additionally, the 1 wt.% EDA/GO membrane showed the best antifouling characteristics, as illustrated by it having the highest BSA flux recovery. However, the method used to functionalize GO with EDA is complicated and would face some difficulties during scale-up.
In this study, we present a novel and facile approach to functionalize graphene oxide with ethylenediamine (EDA), a simple and scalable coupling agent, and incorporate it into the PSf matrix to fabricate mixed-matrix membranes (MMMs) with superior performance for oil–water separation and humidity control applications. We use a versatile and cost-effective phase inversion process to produce asymmetric porous microfiltration membranes with enhanced interfacial adhesion and reduced aggregation of GO sheets. We investigate the effect of EDA-functionalized graphene oxide (GO-NH2) concentration on membrane morphology, hydrophilicity, mechanical properties, and oil–water separation performance. We also evaluate the antifouling characteristics of the PSf-GO-NH2 MMMs by filtering the bovine serum albumin (BSA) solution. Furthermore, we assess the potential of the PSf-GO-NH2 MMMs as multifunctional and reliable porous supports for air dehumidification membranes by measuring their water vapor permeance and water/air selectivity. Our results indicate that the PSf-GO-NH2 MMMs are excellent candidates for oil–water separation and humidity control applications.
This study uses a facile functionalization of GO with ethylenediamine (EDA) to synthesize amine functionalized GO (GO-NH2). Different GO-NH2 was incorporated into the dope solution of PSf, and PSf-GO-NH2 MMMs were fabricated via phase inversion. The influences of GO functionalization on the characteristics (porosity, hydrophilicity, roughness, and mechanical properties) and performance (water permeability, oil rejection, and antifouling properties) of the prepared MMMs were investigated. A fouling resistance test was performed by filtering a model BSA protein through the membrane. The structural and chemical changes induced by the incorporation of GO-NH2 into the PSf matrix were analyzed and correlated with membrane performance. Additionally, the performance of the membranes was assessed as a porous support for air dehumidification applications. Finally, we measured the water vapor permeability (WVP) and the H2O/N2 selectivity of the original and modified membrane to evaluate how well they support the thin-film composite (TFC) air dehumidification membranes.

2. Materials and Methods

2.1. Materials

Graphene oxide (GO; SE2430) from the sixth element was used as received. Ethylenediamine (EDA), Methanol (MeOH), Dimethylacetamide (DMAc), Polysulfone (PSf) (Mn ~ 22,000), Polyvinylpyrrolidone (PVP) (Mw ~ 55,000), Acetone, and Bovine Serum Albumin (BSA) (Sigma Aldrich, St. Louis, MO, USA) were received and used without further purification. Sodium hydroxide (NaOH) was obtained from Research-Lab, diesel was obtained from Woqod petrol station, and Deionized water (DI) was also used in this study.

2.2. Functionalization and Characterization of GO with EDA (GO-NH2)

A total of 900 mg of GO was dispersed in 300 mL of DI water via bath sonication for 4 h. Then, 1.6 mL EDA was added to the GO solution, and the functionalization reaction was carried out for 4 h at 85 °C under reflux. The reaction mixture was then cooled to room temperature, filtered, and repeatedly washed with DI water and MeOH until reaching pH 7. The morphology of GO and GO-NH2 was analyzed using SEM (FEI Quanta 400 SEM, Thermo Fisher Scientific, Waltham, MA, USA) and TEM (FEI TECNAI G2 TF20, Thermo Fisher Scientific, USA). An X-ray diffractometer (XRD: Ultima IV, RIGAKU, The Woodlands, TX, USA) with Cu-α radiation (λ = 0.15418 nm) operating at 40 kV and 20 mA was used to estimate the stacking characteristics and interlayer d-spacing of GO and GO-NH2 using Bragg’s law [32]. The composition and the functional groups on the surface of GO and GO-NH2 were investigated using Escalab 250 Xi (Thermo Fisher Scientific, USA) X-ray photoelectron spectroscopy (XPS) with 20 eV pass energy for high-resolution scans and 100 eV for the survey scans.

2.3. Membrane Fabrication

Phase inversion was employed to fabricate the UF PSf and PSf-GO-NH2 MMMs [33]. A mixture of PSf (15%) and PVP (5%) as a pore-forming agent were dissolved in DMAc (80%) by stirring at room temperature to prepare the control polymer solution. The concentration of the filler GO-NH2 varied from 0% to 0.8% (0%, 0.05%, 0.1%, 0.2%, 0.4%, and 0.8%) to prepare multiple membranes. The preparation process was carried out as follows: the membrane with the highest filler concentration, i.e., 0.8 wt.% GO-NH2 (relative to PSf), was made by dispersing GO-NH2 (60 mg) into 12.5 g of DMAc via probe sonication for 5 min. The f-GO dispersion in DMAc was then added to the dope polymer solution (7.5 g of PSf, 2.5 g of PVP, and 37.5 g of DMAc), and the mixture was subjected to bath sonication for 1 h, followed by probe sonication for 5 min and degassing for 20 min. The remaining membrane solutions with lower GO-NH2 concentrations were prepared by mixing the 0.8% solution with the dope solution polymer solution. The six polymer solutions were then cast on a glass plate using an automated membrane-casting machine (Promotor MemCast) running at a speed of 4 m/min and a casting knife 150 μm in thickness. After 30 s, the glass plate was then immersed in a coagulation bath containing DI water for 5 min. The cast membrane sheets were rinsed with DI water with daily water changes for five days before testing to remove PVP.

2.4. Membrane Characterization

The membrane surface topography and cross-section morphology were analyzed using SEM (FEI Quanta 400 SEM, Thermo Fisher Scientific, USA). For membrane surface analysis, square samples were cut and mounted on the sample holder using carbon tape, while for the cross-sectional images, the membrane samples were cryo-fractured in liquid nitrogen. The hydrophilicity of the membranes was estimated by measuring the water contact angle (WCA) of the membrane via the sessile drop method using a Kruse drop shape analyzer (KDSA: DSA25, Germany) [34]. The membranes’ surface roughness was analyzed using Atomic Force Microscopy (AFM) (Dimension Icon, Bruker, Billerica, MA, USA) operating in tapping mode using 50 × 50 µm scan size. The mechanical properties of the membranes, such as Young’s modulus, breakage strength, and breaking strain, were measured via uniaxial tensile testing using dynamic mechanical analysis (DMA: Q800, TA Instruments, New Castle, DE, USA). The overall membrane porosity was measured using the wet/dry weight method. The (%) porosity was defined as a function of weight using the following equation:
Porosity ( % ) = W w W d ρ w V × 1
where W d and W w are the weight of the dry and wet membrane (g), respectively, ρ w is the density of pure water (g/m3), and V is the membrane volume.

2.5. Membrane Performance and Antifouling Characteristics

A dead-end cell (Sterlitech HP4750, Kent, WA, USA) was used to estimate the membrane’s permeability by measuring the water flux through the cell at trans-membrane pressures 1, 2, and 3 bars. The flux was calculated using the following equation:
J = m t A × 0.06   ( L / m 2 hr )
where J is the pure water flux (L/m2hr), (LMH)), m is the mass of water permeated (g), t is the time (minutes), and A is the active membrane area (14.6 cm2).
The membrane selectivity was evaluated by measuring oil (diesel) rejection. First, 1000-ppm oil emulsion was prepared as a stock solution via probe sonication. The stock solution was further diluted to 100-ppm oil emulsion and used as the feed. Three permeated samples and one residual sample were collected. The carbon content of the feed, the permeate samples, and the residual sample was analyzed using a total organic carbon analyzer (TOC: TOC-L, Shimadzu, Kyoto, Japan). The percentage of oil rejection was calculated according to the following equation:
R % = C F C p C F 100
where Cp and CF are the TOC concentrations of oil permeate and feed.
To study the membrane resistance to organic fouling, 200 mL of a 500 ppm BSA solution was permeated through the control membrane and one selected MMM at 1 bar. After the permeation experiment was completed, the membrane was cleaned by being rinsed with DI water twice, flushed with 2 M NaOH solution, and reused for an additional cycle.
To study the tradeoff between permeability and selectivity, separation and permeability factors were calculated as follows:
S F = 1 1 R
P F = J 1000
where R is the fraction of oil rejection, and J is the pure water flux.

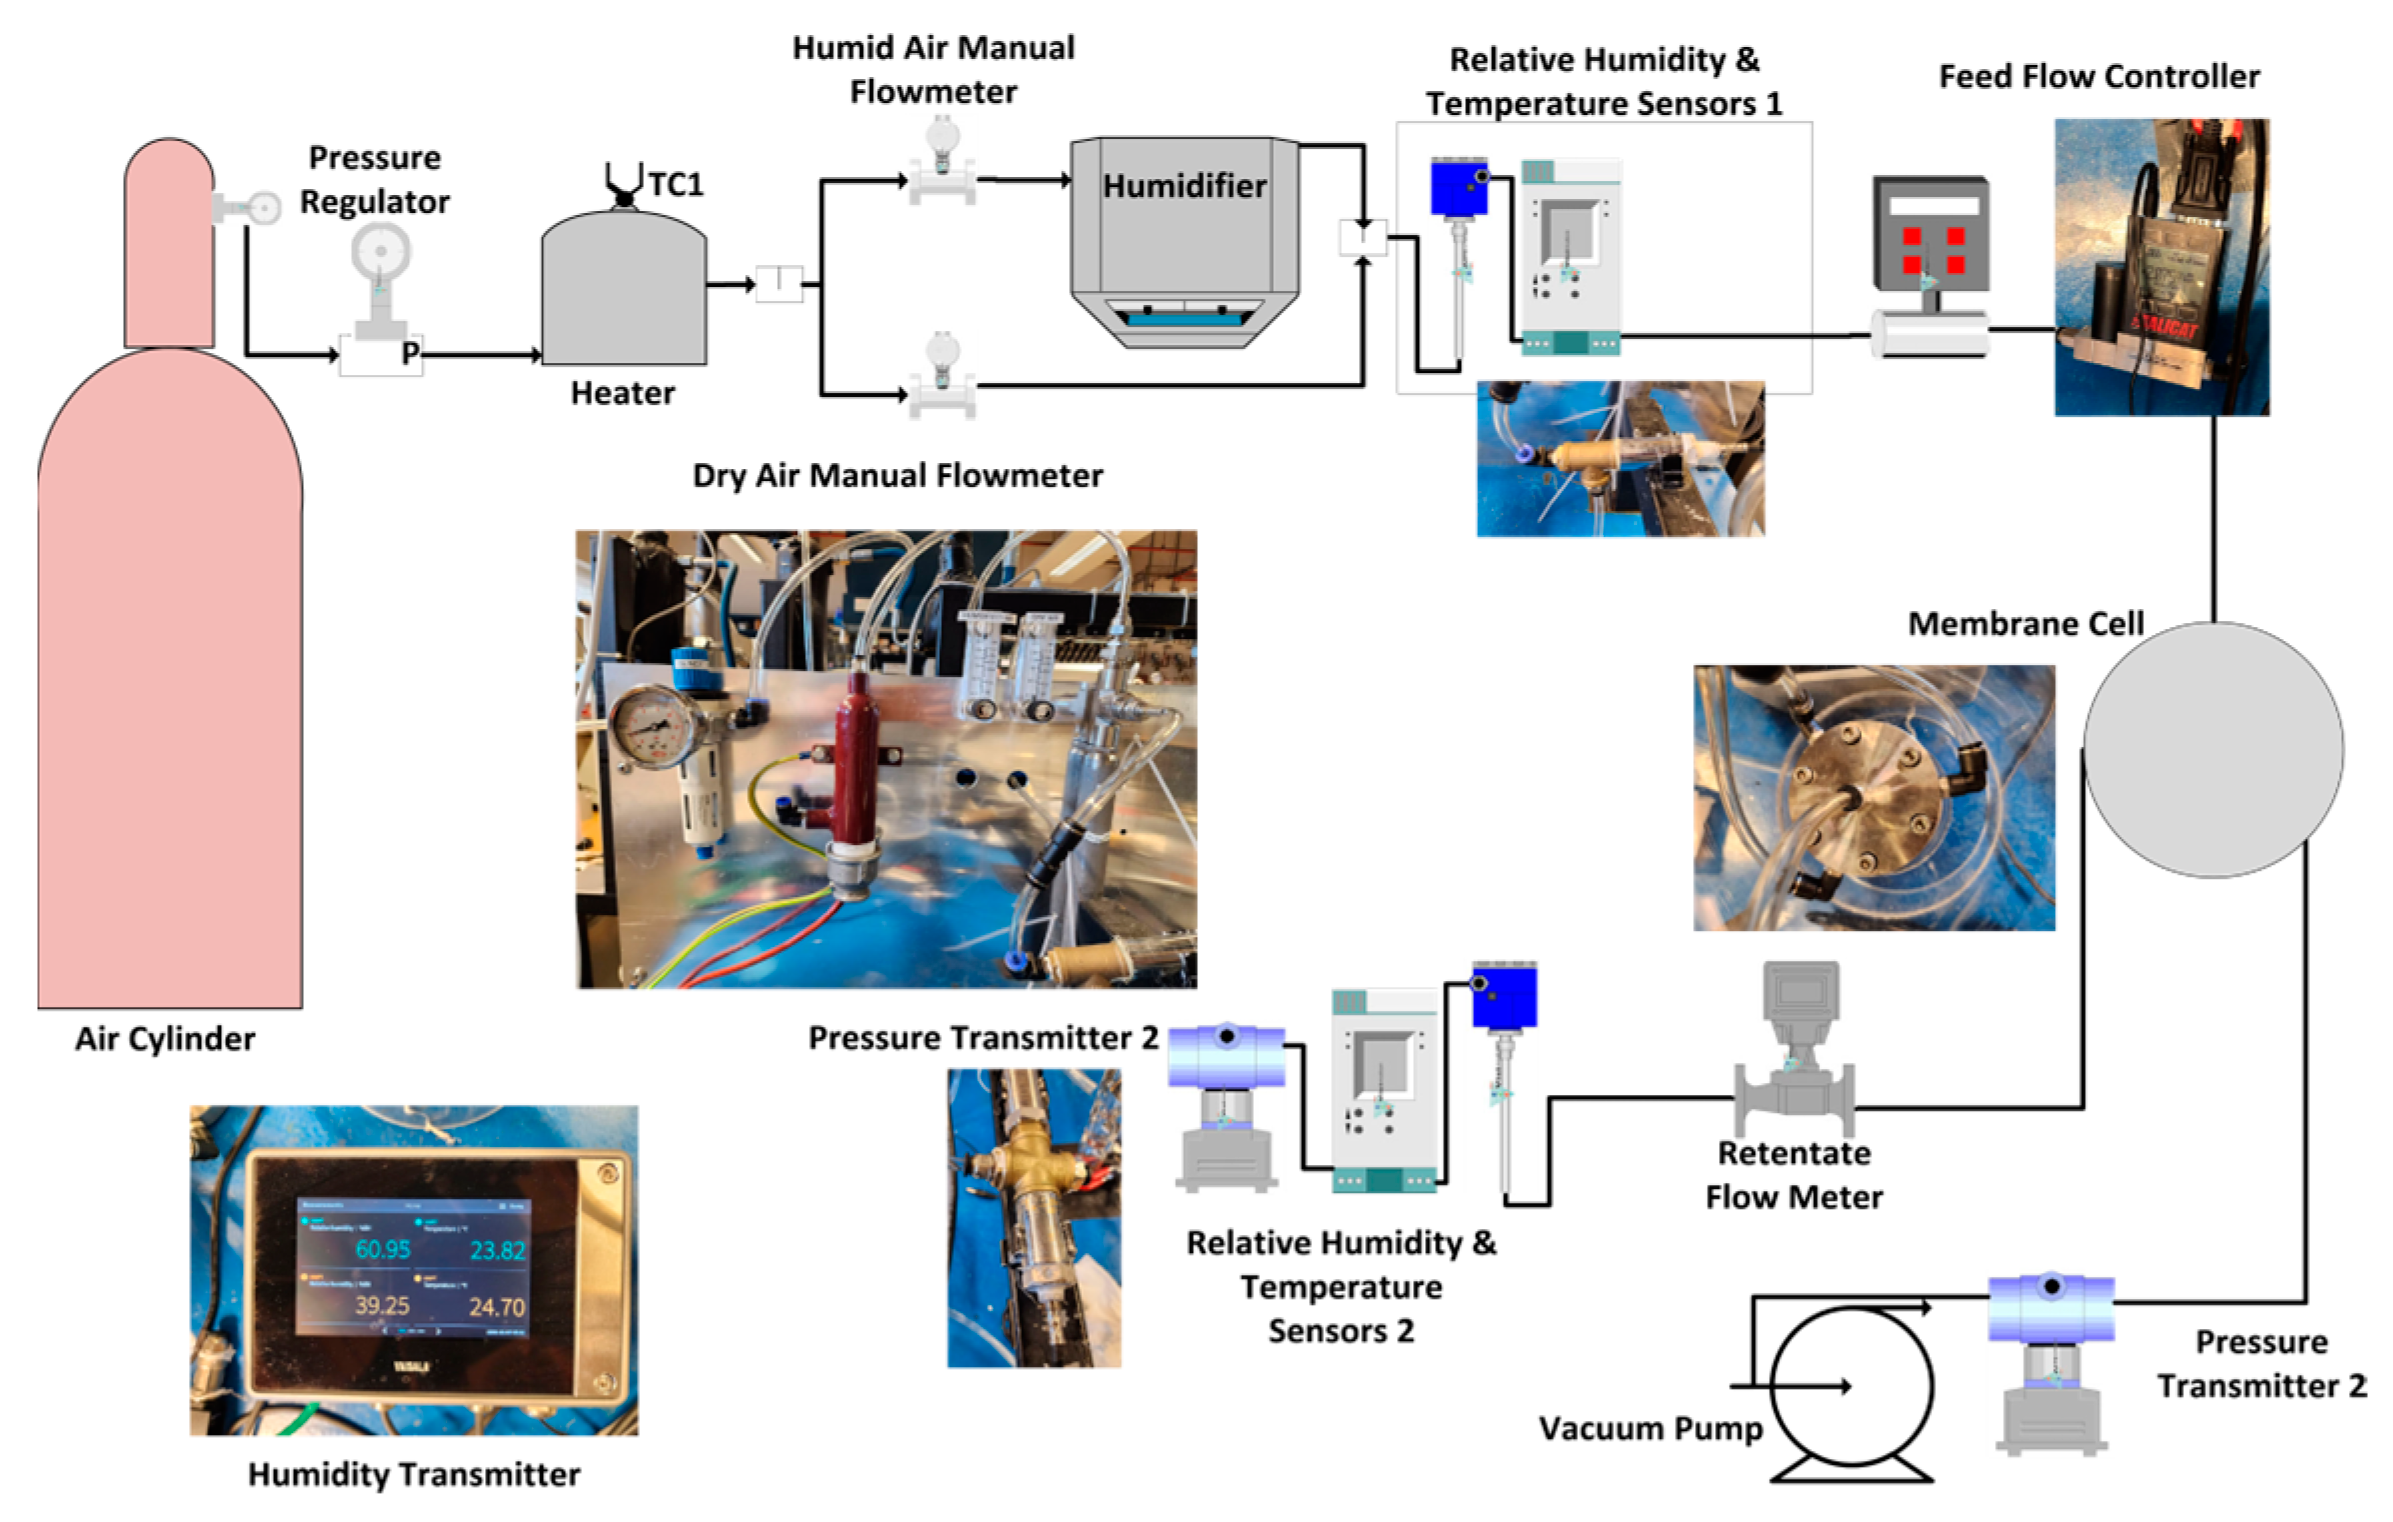
2.6. Water Vapor Permeance and Water/Air Selectivity

The air dehumidification performance of the membrane was tested at specific relative humidity levels and selected inlet feed pressures. The setup comprised an air dehumidification module with a humidity controller, following the process developed by Culp [35]. Humidified inlet air entered the membrane cell, which released dry air and allowed water vapor to pass through the permeate side (facilitated by a vacuum pump), as shown in Figure 1.
High-purity air (>99.9%), obtained from the National Industrial Gas Plant, was utilized as a carrier for the water. The absolute humidity was meticulously set to approximately 0.027–0.028 kg/m3, corresponding to 85–90% humidity. The air flow rate was regulated at precisely 2 SLPM, as measured by an Alicat Scientific mass flow meter. The temperature and relative humidity were ascertained using highly accurate sensors from Vaisala Oyj, boasting an accuracy of 1.0%. Both the retentate and permeate flow rates were determined using a mass flow meter, while a pressure transducer from Gentek facilitated the measurement of pressure at both locations. Lastly, the permeate pressure was maintained at a consistent 2 mBar (achieved with an IKA Vacstar pump). The permeance equation is a mathematical relationship that relates the gas flow rate through a membrane to the pressure difference across the membrane. It is commonly used to calculate the permeance of a membrane to a particular gas or vapor.
P i = N i A Δ p i , l m
Δ p i , l m = Δ p i , 1 Δ p i , 2 ln ( Δ p i , 1 / Δ p i , 2 )
Pi is the permeance in (mol/m2 s Pa), Ni is flow rate of component i (H2O or air) across the membrane (mol/s), A is the membrane area (m2), Δpi,lm is the log mean partial pressure difference of component i across the membrane (Pa), Δpi,1 is the partial water pressure difference across the membrane at the feed side (pi,f − pi,P), and Δp2 is the pressure difference across the membrane at the retentate side (pi,R − pi,P).

3. Results and Discussion

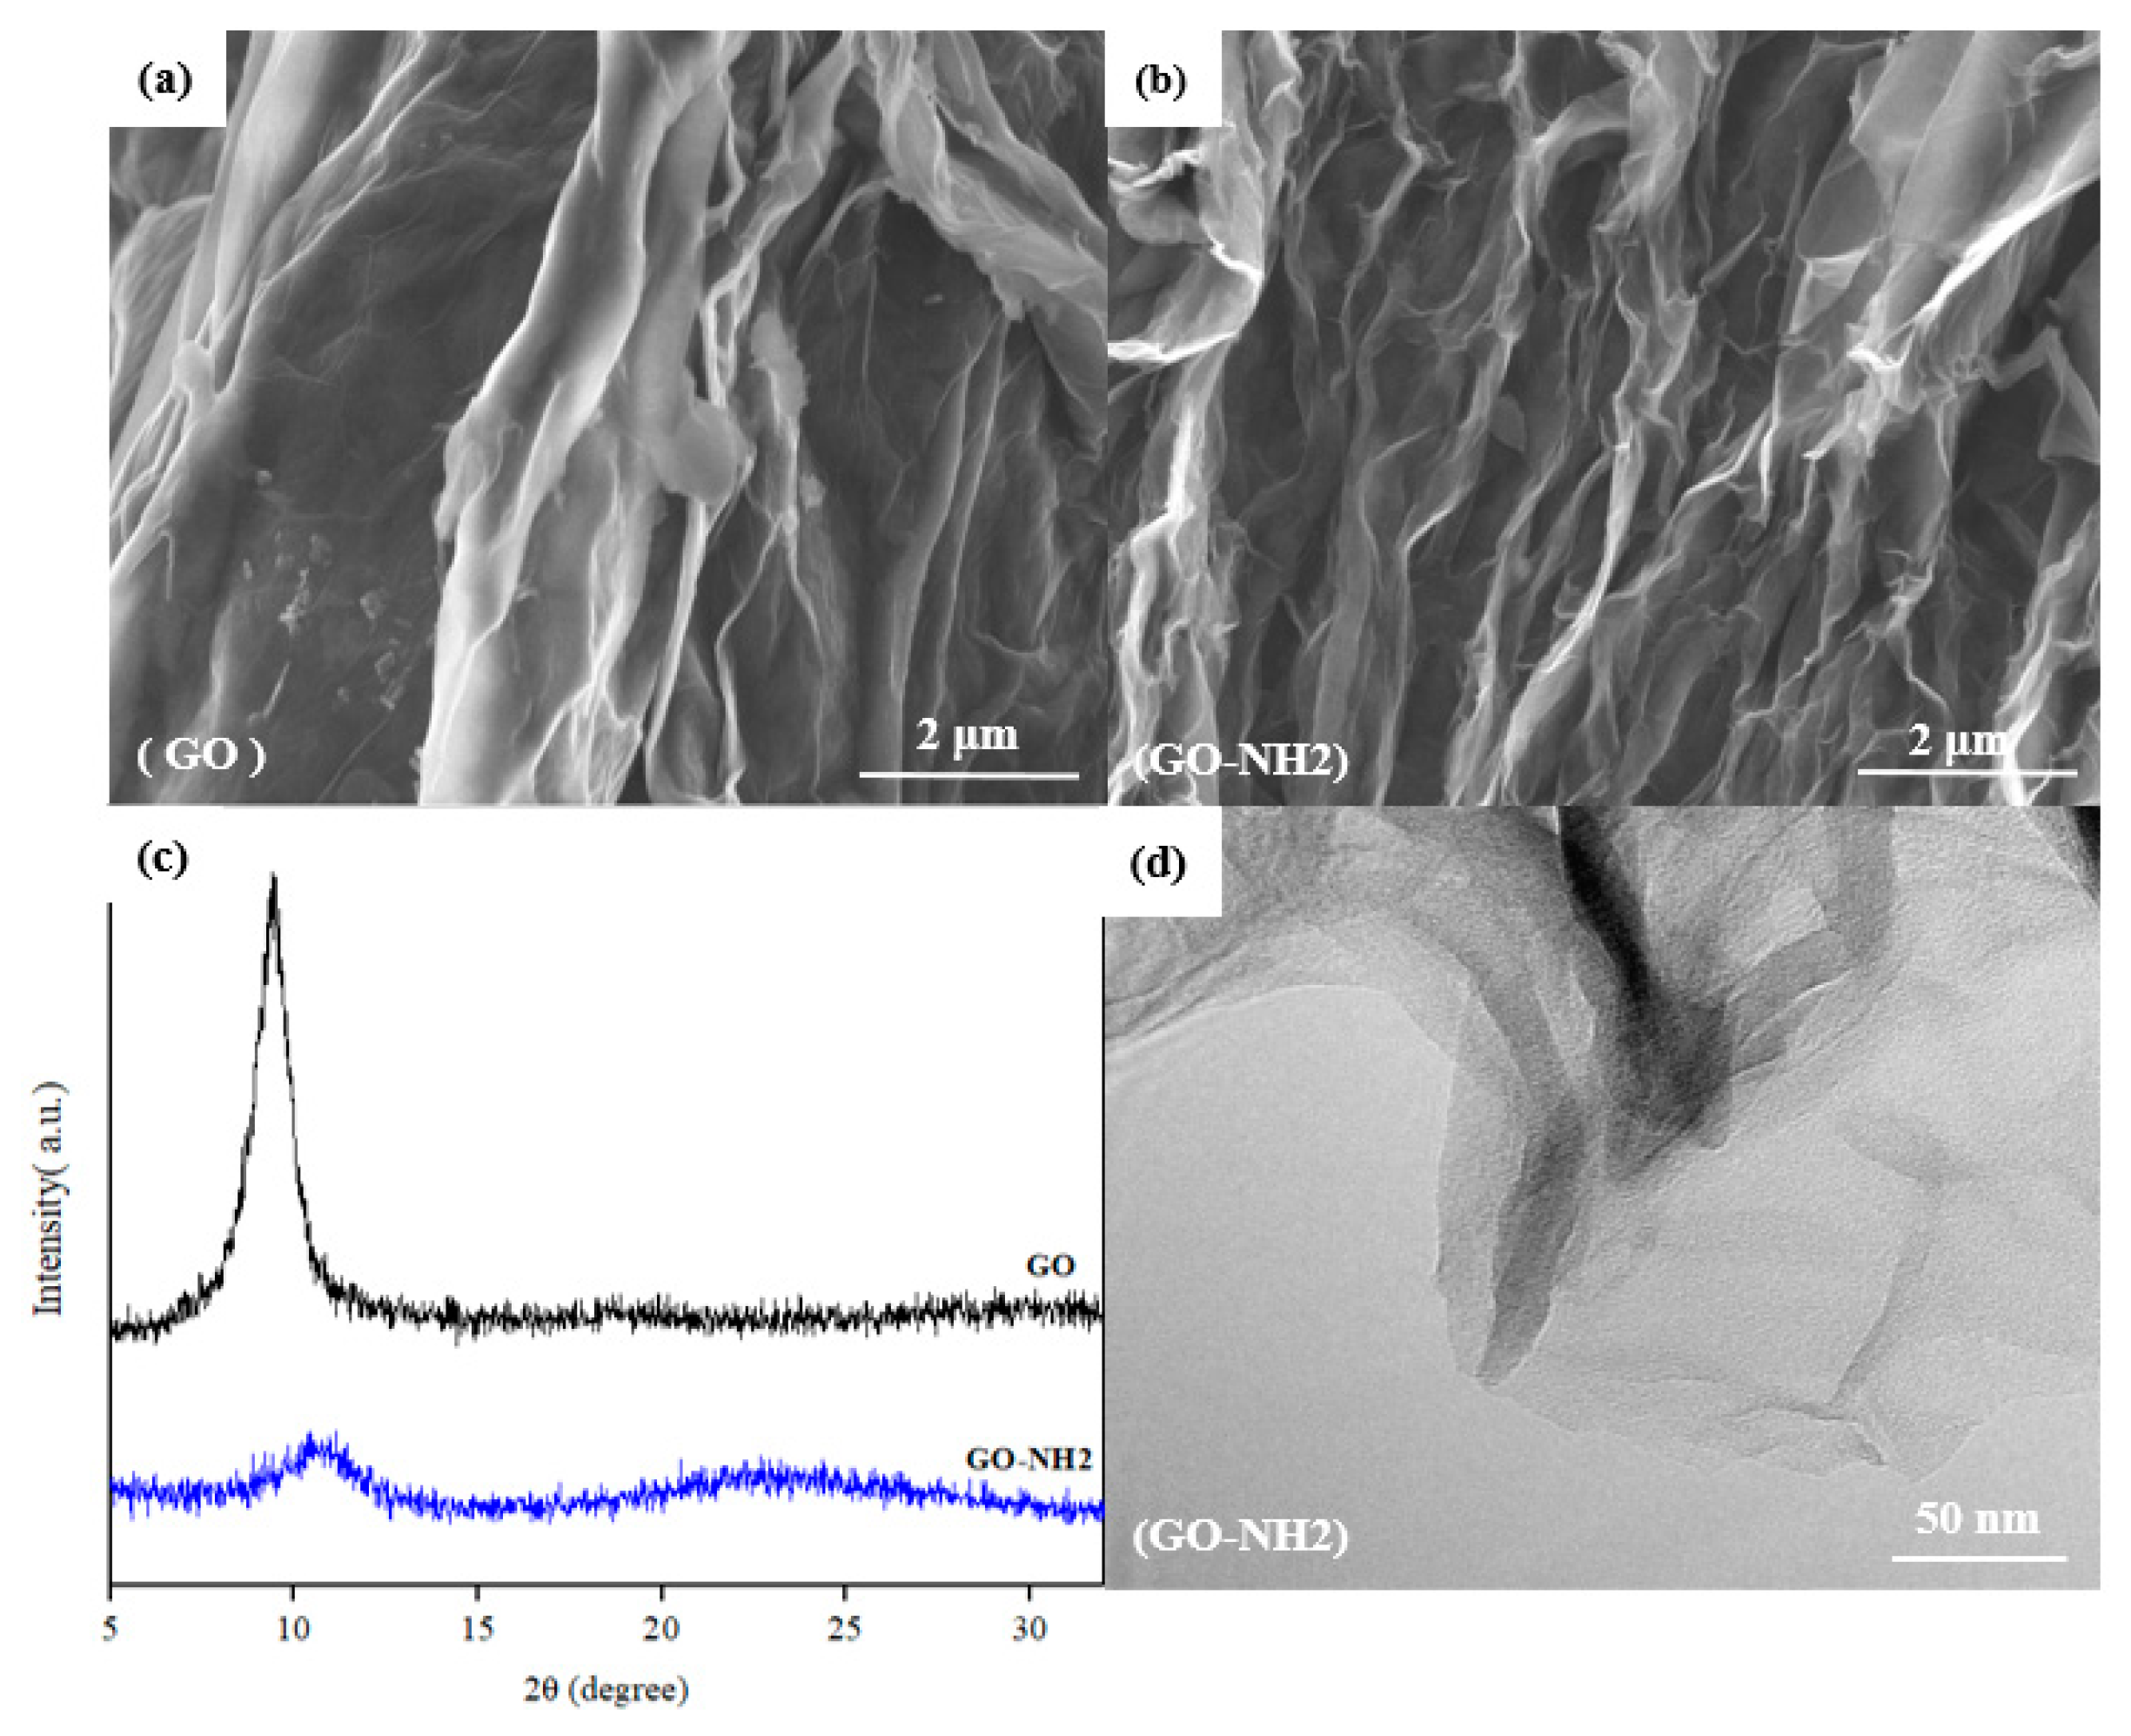
3.1. Characterization of GO and GO-NH2

Figure 2a,b shows SEM images of the GO and GO-NH2 samples. The morphology of GO and GO-NH2 appears to be almost the same with multiple layers, revealing folded structures with distinct wavy features and edges, which is consistent with the literature [36]. Comparing GO and GO-NH2, the functionalized GO appears to have a more wrinkled and folded structure than GO. However, the structure is retained even after functionalization. A single GO sheet can be seen in Figure 2d when focusing on the TEM image’s light regions, whereas dark regions indicate multi-folds and layers.
XRD was used to estimate the stacking characteristics and crystal structure of GO and GO-NH2 samples, and the XRD patterns in the 2θ range of 5° to 35°, are shown in Figure 2c. A clear dominant peak at 2θ = 9.42° was present in the GO pattern. This peak is consistent with the previously reported GO (002) peak [37,38]. For the GO-NH2 sample, the (002) peak’s intensity was significantly reduced, broadened, and shifted to the right, suggesting the exfoliation of graphite oxide structure. The d-spacing values of the GO and GO-NH2 samples, calculated from Bragg’s Law, were 9.38 Å and 8.50 Å, respectively. The reduction in the d-spacing of the GO-NH2 peak is attributed to the functionalization of GO with EDA, as the amine functional groups brought the interlayer space between GO sheets together, enhancing the stability of GO.
The elemental compositions of GO and GO-NH2 were investigated using EDX. Supplementary Information Table S1 shows the atomic composition of GO and GO-NH2. It is shown that GO is composed only of carbon and oxygen, with 63.15% and 36.85%, respectively [39]. At the same time, GO-NH2 contains 7.35% N in addition to carbon and oxygen. The presence of nitrogen in the GO-NH2 sample confirms the successful functionalization of GO with EDA since EDA has amine (NH2) functional groups in its structure. The elemental mapping of different elements, i.e., carbon, oxygen, and nitrogen on the surface of GO-NH2, is shown in Supplementary Information Figure S1. The homogenous distribution of the organic functionality on the surface of GO-NH2 is observed, where carbon, oxygen, and nitrogen are spread evenly.
Furthermore, XPS analysis was employed to investigate the bonding and chemical composition of GO before and after functionalization. Figure 3a shows the XPS elemental surveys for GO and GO-NH2 across binding energies from 100 eV to 900 eV. GO is reiteratively confirmed to consist only of carbon and oxygen with traces of nitrogen, as shown by the two dominant peaks at 283 eV and 533 eV for carbon and oxygen, respectively (similar to the peaks reported by Sali et al.) [40]. A new peak at 399 eV, corresponding to nitrogen, appears in the GO-NH2 survey with a nitrogen content of 7.2% for the GO-NH2, confirming the successful functionalization of GO with EDA. The high-resolution scans of C1s and N1s are shown in Figure 3b–d. The high-resolution deconvolution of the C1s scans, considering sp2 carbon (C1s) graphene, 283.63 eV) (C–C, 284.74 eV) groups, epoxy (C–O, 286.75 eV) groups, and carbonyl (C=O, 288.3 eV) groups are observed. A critical observation in the deconvoluted bonds was the drastic decrease in the epoxy (C–O) atomic composition (C–O) bond from 55.1% in GO to 26.8% in GO-NH2. This outcome occurred due to the amine functional groups replacing the epoxy groups during the functionalization of GO with EDA, along with the clear presence of C-NH2 groups in the N1s deconvoluted spectrum.

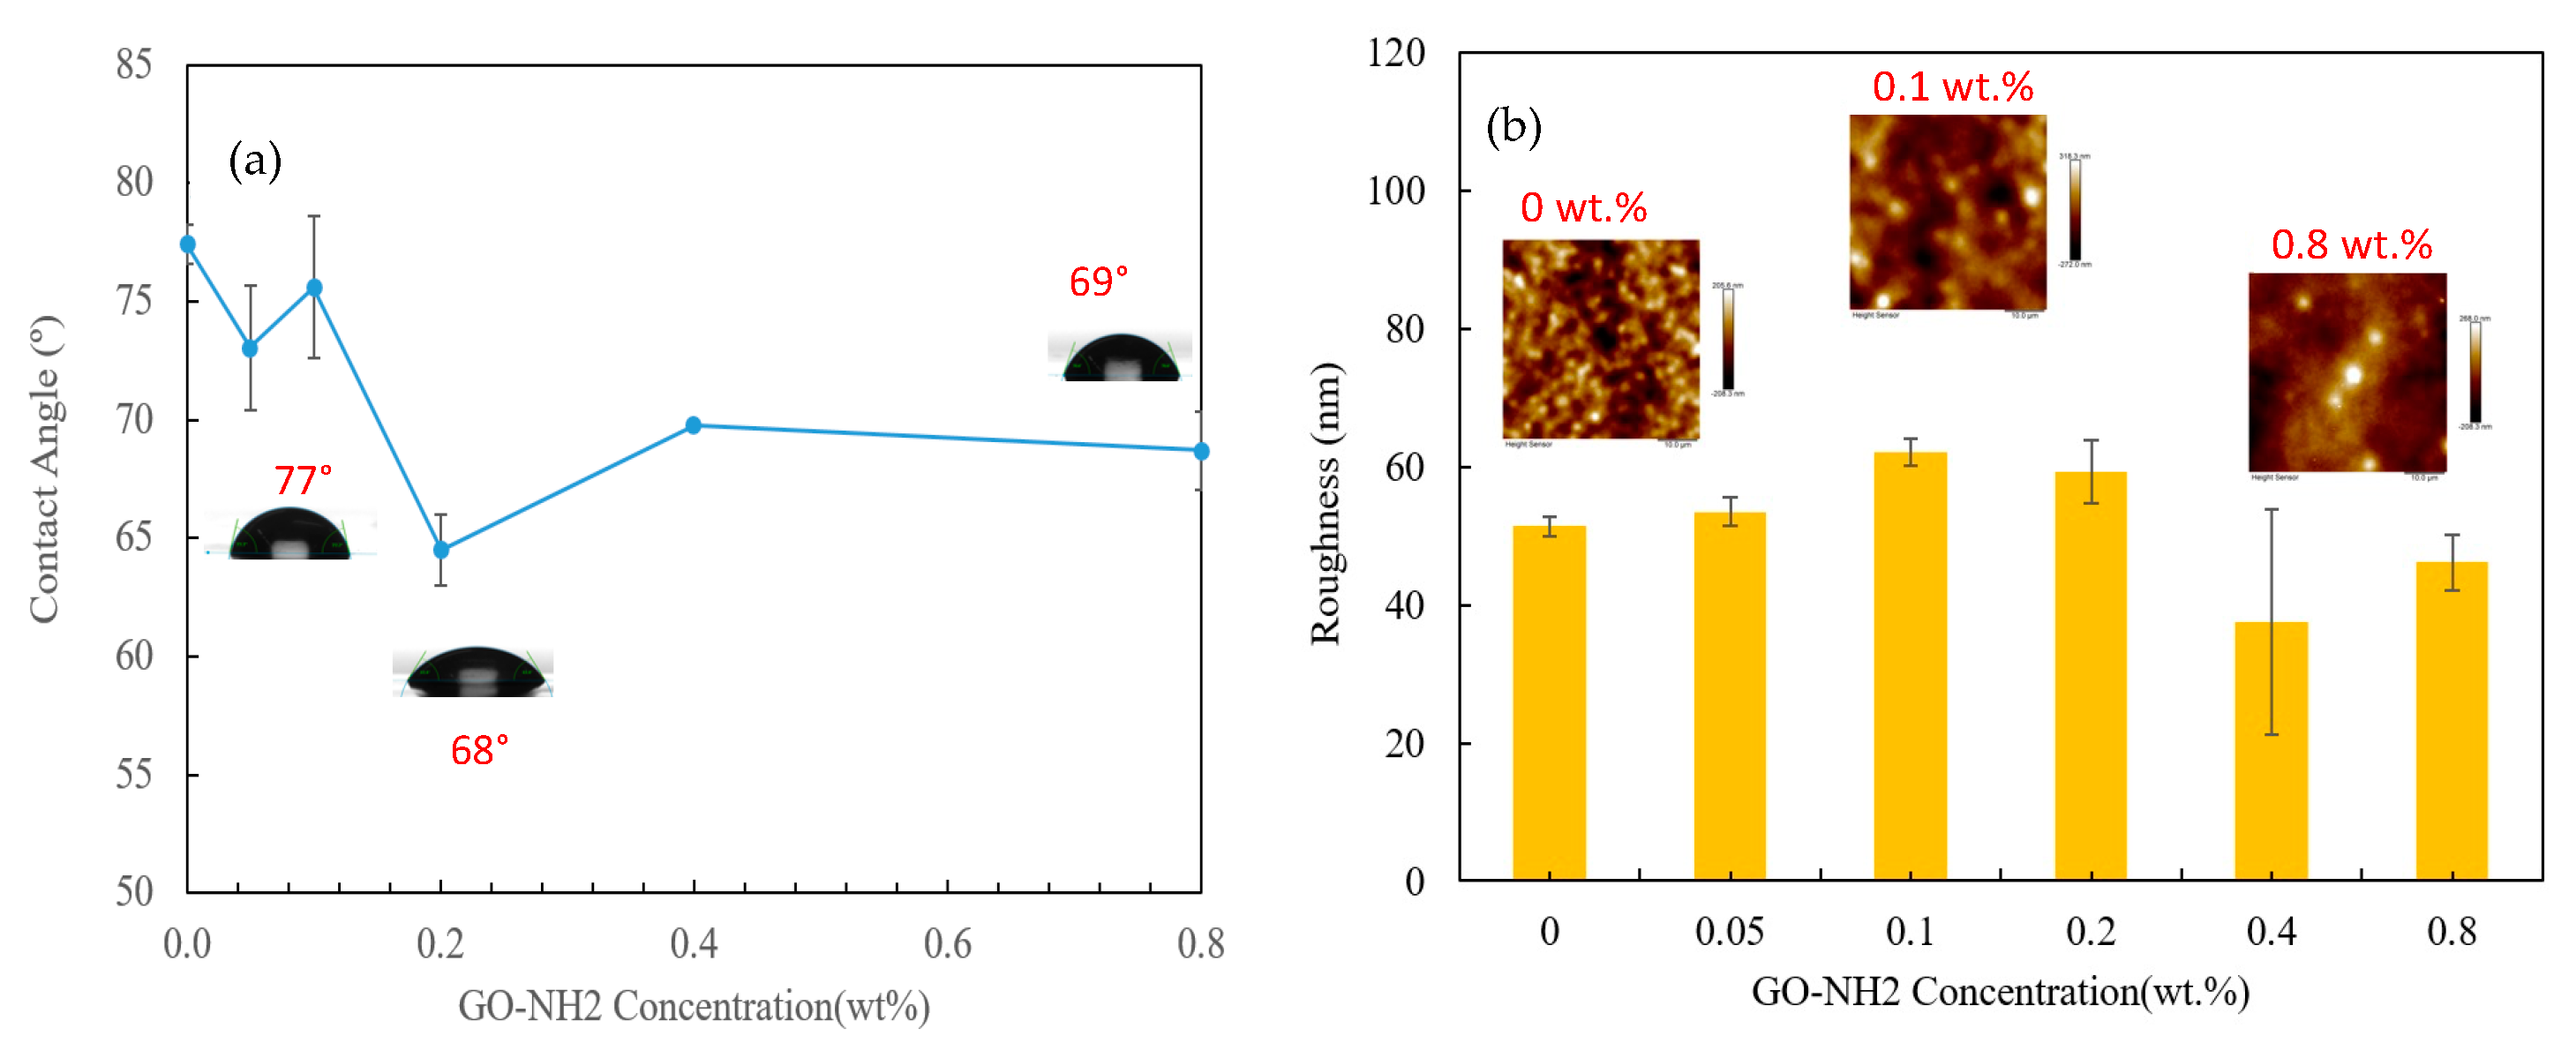
3.2. Membrane Characterization

The surface and cross-sectional morphology of the pure PSf membrane and the MMMs containing 0.2 and 0.8 wt.% GO-NH2 were analyzed using SEM, and the results are shown in Figure 4. The surface of the control membrane is smoother and less porous than MMMs membrane. Moreover, the cross-sectional morphologies of the mebranes exhibit the typical finger-like channeled sublayer expected for asymmetric porous membranes. However, these highly porous finger-like channels are covered by a well-structured dense skin layer in the MMMs (Figure 4e,f). Similar morphology was reported by Zinadini et al. in a previous study for a system of polyethersulfone (PES) mixed-matrix nanofiltration membrane containing graphene oxide (GO) nanoplates [41]. The sub-layer morphology can be described as finger-like micro-voids with sponge features at the bottom; this layer gives the needed mechanical stability for the fabricated membranes. The skin layer is the side that is open to air when casting, while the sub-layer is the side that is in contact with the glass plate. Comparing the control membrane with GO-NH2 membranes, the separating layer of the control membrane appears to be almost non-existent, while a much thicker separating layer is found in the GO-NH2 membranes, indicating higher separation possibilities.
Moreover, the sub-layer of the 0.2 wt.% GOO-NH2 MMM is thicker, more stretched, and possesses the thickness of finger-like voids more so than the control membrane. This could be due to the very hydrophilic NH2 groups on the surface of the membrane, which enhances and quickens the transfer between the DMAc and DI water during phase inversion, thus increasing the pores and channel size [42].
The surface hydrophilicity of the prepared membranes was tested by measuring water contact angles (WCAs). The test was performed on a square sheet sample of membranes to measure the wettability variation due to the various GO-NH2 concentrations studied. High water contact angles imply that the membranes have greater hydrophilicity and vice versa. The membrane with the highest hydrophobicity was the control membrane, with 77° WCA, consistent with previously reported measurements [31]. On the other hand, the highest hydrophilicity was attained by the 0.2 wt.% GO-NH2 membrane, with a reduction of almost 14° compared to the control membrane. Figure 5a shows the variation in WCA as the concentration of GO-NH2 increases. At low concentrations, the contact angle decreases to a minimum, increasing again at higher concentrations. This trend was observed because low concentrations of GO-NH2 have a strong attraction to water during phase inversion. Consequently, GO-NH2 moves toward the membrane/water interface, facilitating a low-energy interface that results in high hydrophilicity [43].
The fabricated membranes’ three-dimensional (3D) morphologies and respective surface roughness values were determined using AFM under tapping mode. A scan size of 50 × 50 µm was chosen for this study. Figure 5b shows the variation in surface roughness among the different concentrations of GO-NH2, along with selected topographical AFM images. The three selected AFM images illustrate the distinct extent of roughness that expresses the variation among all GO-NH2 concentrations. Dark regions in the AFM images define deep points such as pores and valleys, while light-colored regions define higher points such as peaks; the exact elevation scale can be seen on the right side of the image [41]. The main physical parameter obtained from AFM analysis is the average surface roughness (Ra), which describes the standard surface deviation of the designated surface, hence calculating the roughness. The roughness variation followed a trend whereby, at small loadings, the roughness increases to a maximum and decreases back at high loadings. This trend is consistent with that previously reported by Mokkapati and coworkers [44]. The MMMs are believed to be more porous than the control membrane, increasing the roughness upon adding GO-NH2, implying that the smoothest membrane is the control membrane. The membrane with the highest roughness was found to be 0.1 wt.% GO-NH2, with a roughness of 62.05 nm compared to 51.35 nm for the control membrane. Other AFM 3D images are provided in the Figure S2.
The application of the prepared MMMs greatly depends on their mechanical characteristics. DMA was applied to the fabricated membranes to investigate the effect of GO-NH2 on mechanical properties. Three specimens were tested from each membrane sample, as shown in Figure 6a. Moreover, Young’s modulus and breakage strength were calculated to fully understand the mechanical properties of the membranes. Figure 6b illustrates the effect of GO-NH2 as a filler on Young’s modulus and breakage strength. The 0.2 wt.%. membrane attained the highest Young’s modulus. GO-NH2 membrane was about 116.67 MPa. When GO-NH2 was added, the stiffness and strength of the material increased to reach a maximum at 0.2% by weight. Beyond that point, the material became weaker, but it was still stronger than the material without GO-NH2. This trend is explained by the fact that low-concentration GO-NH2 membranes possess a high aspect ratio and excellent interfacial adhesion between the GO-NH2 and the polymer, facilitating the development of their outstanding mechanical properties [45]. However, at high concentrations, the GO-NH2 filler aggregate in the polymer matrix reduces the mechanical properties [46,47]. The optimum mechanical properties were attained by the 0.2 wt.%. membrane. The GO-NH2 membrane’s Young’s modulus and breakage strength were improved by 98% and 50% compared to the control membrane. The steepest slope and high stress of the 0.2 wt.%.
The wet/dry method was used to calculate the porosity of the prepared membranes. Figure 7 shows the variation in the membrane’s porosity as the concentration of the GO-NH2 filler changes. The incorporation of GO-NH2 led to an increase in porosity to a maximum of 0.2 wt.% GO-NH2 followed by a decrease at higher concentrations. The increase in porosity was directly related to the hydrophilicity of the PSf-GO-NH2 mixture, which accelerated the exchange between the solvent and non-solvent. The highest enchantment in the porosity was about 11.39%, from 57.52% for the control membrane to 68.91% for the 0.2 wt.% GO-NH2 membrane.

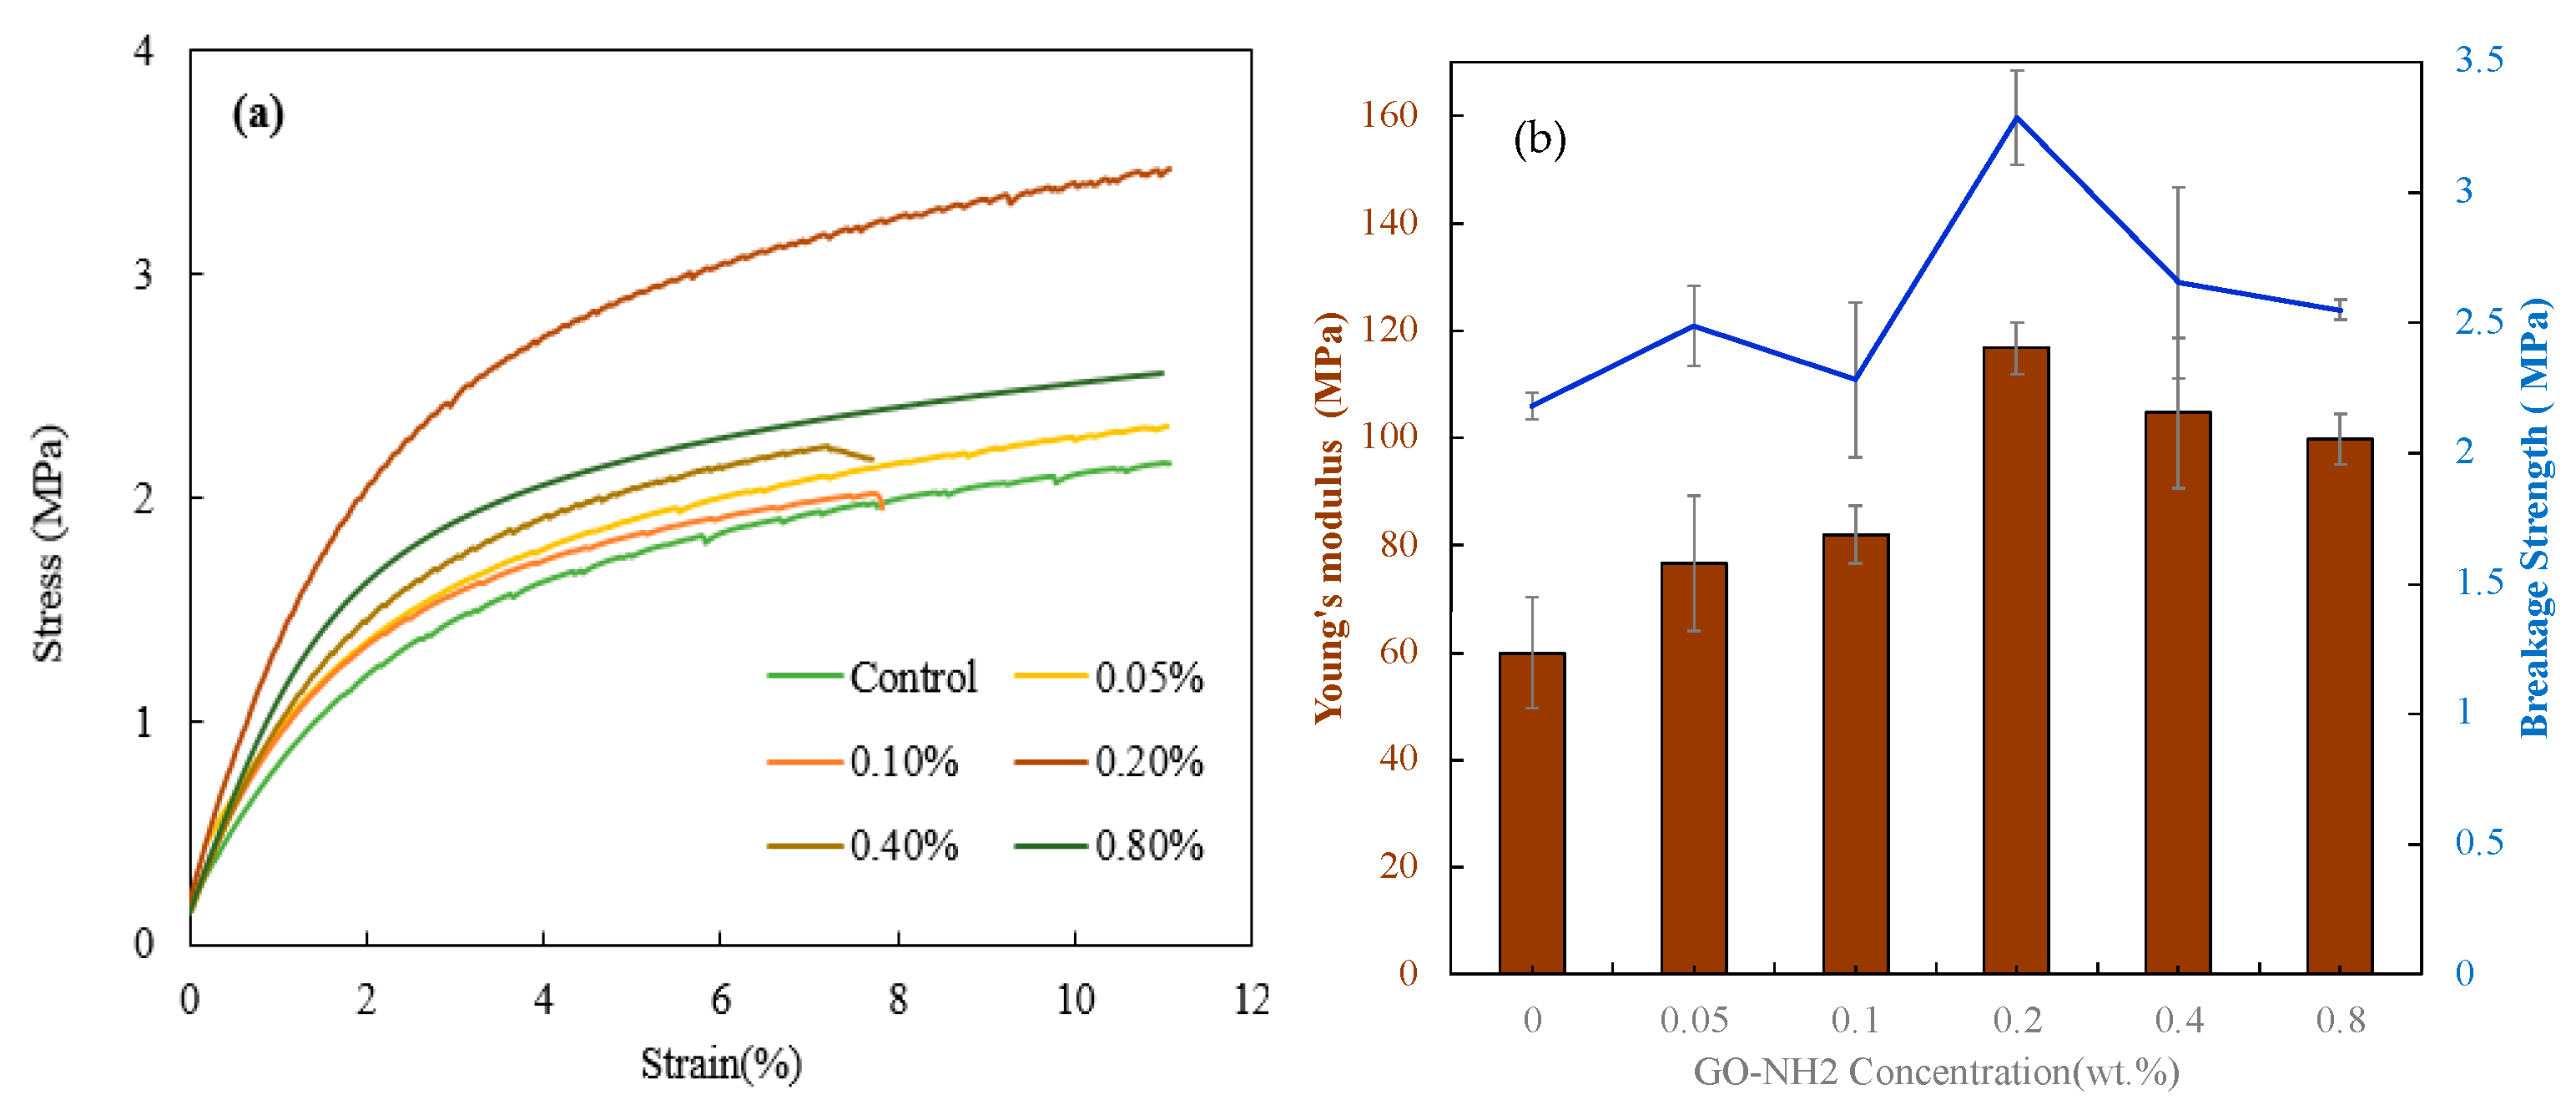
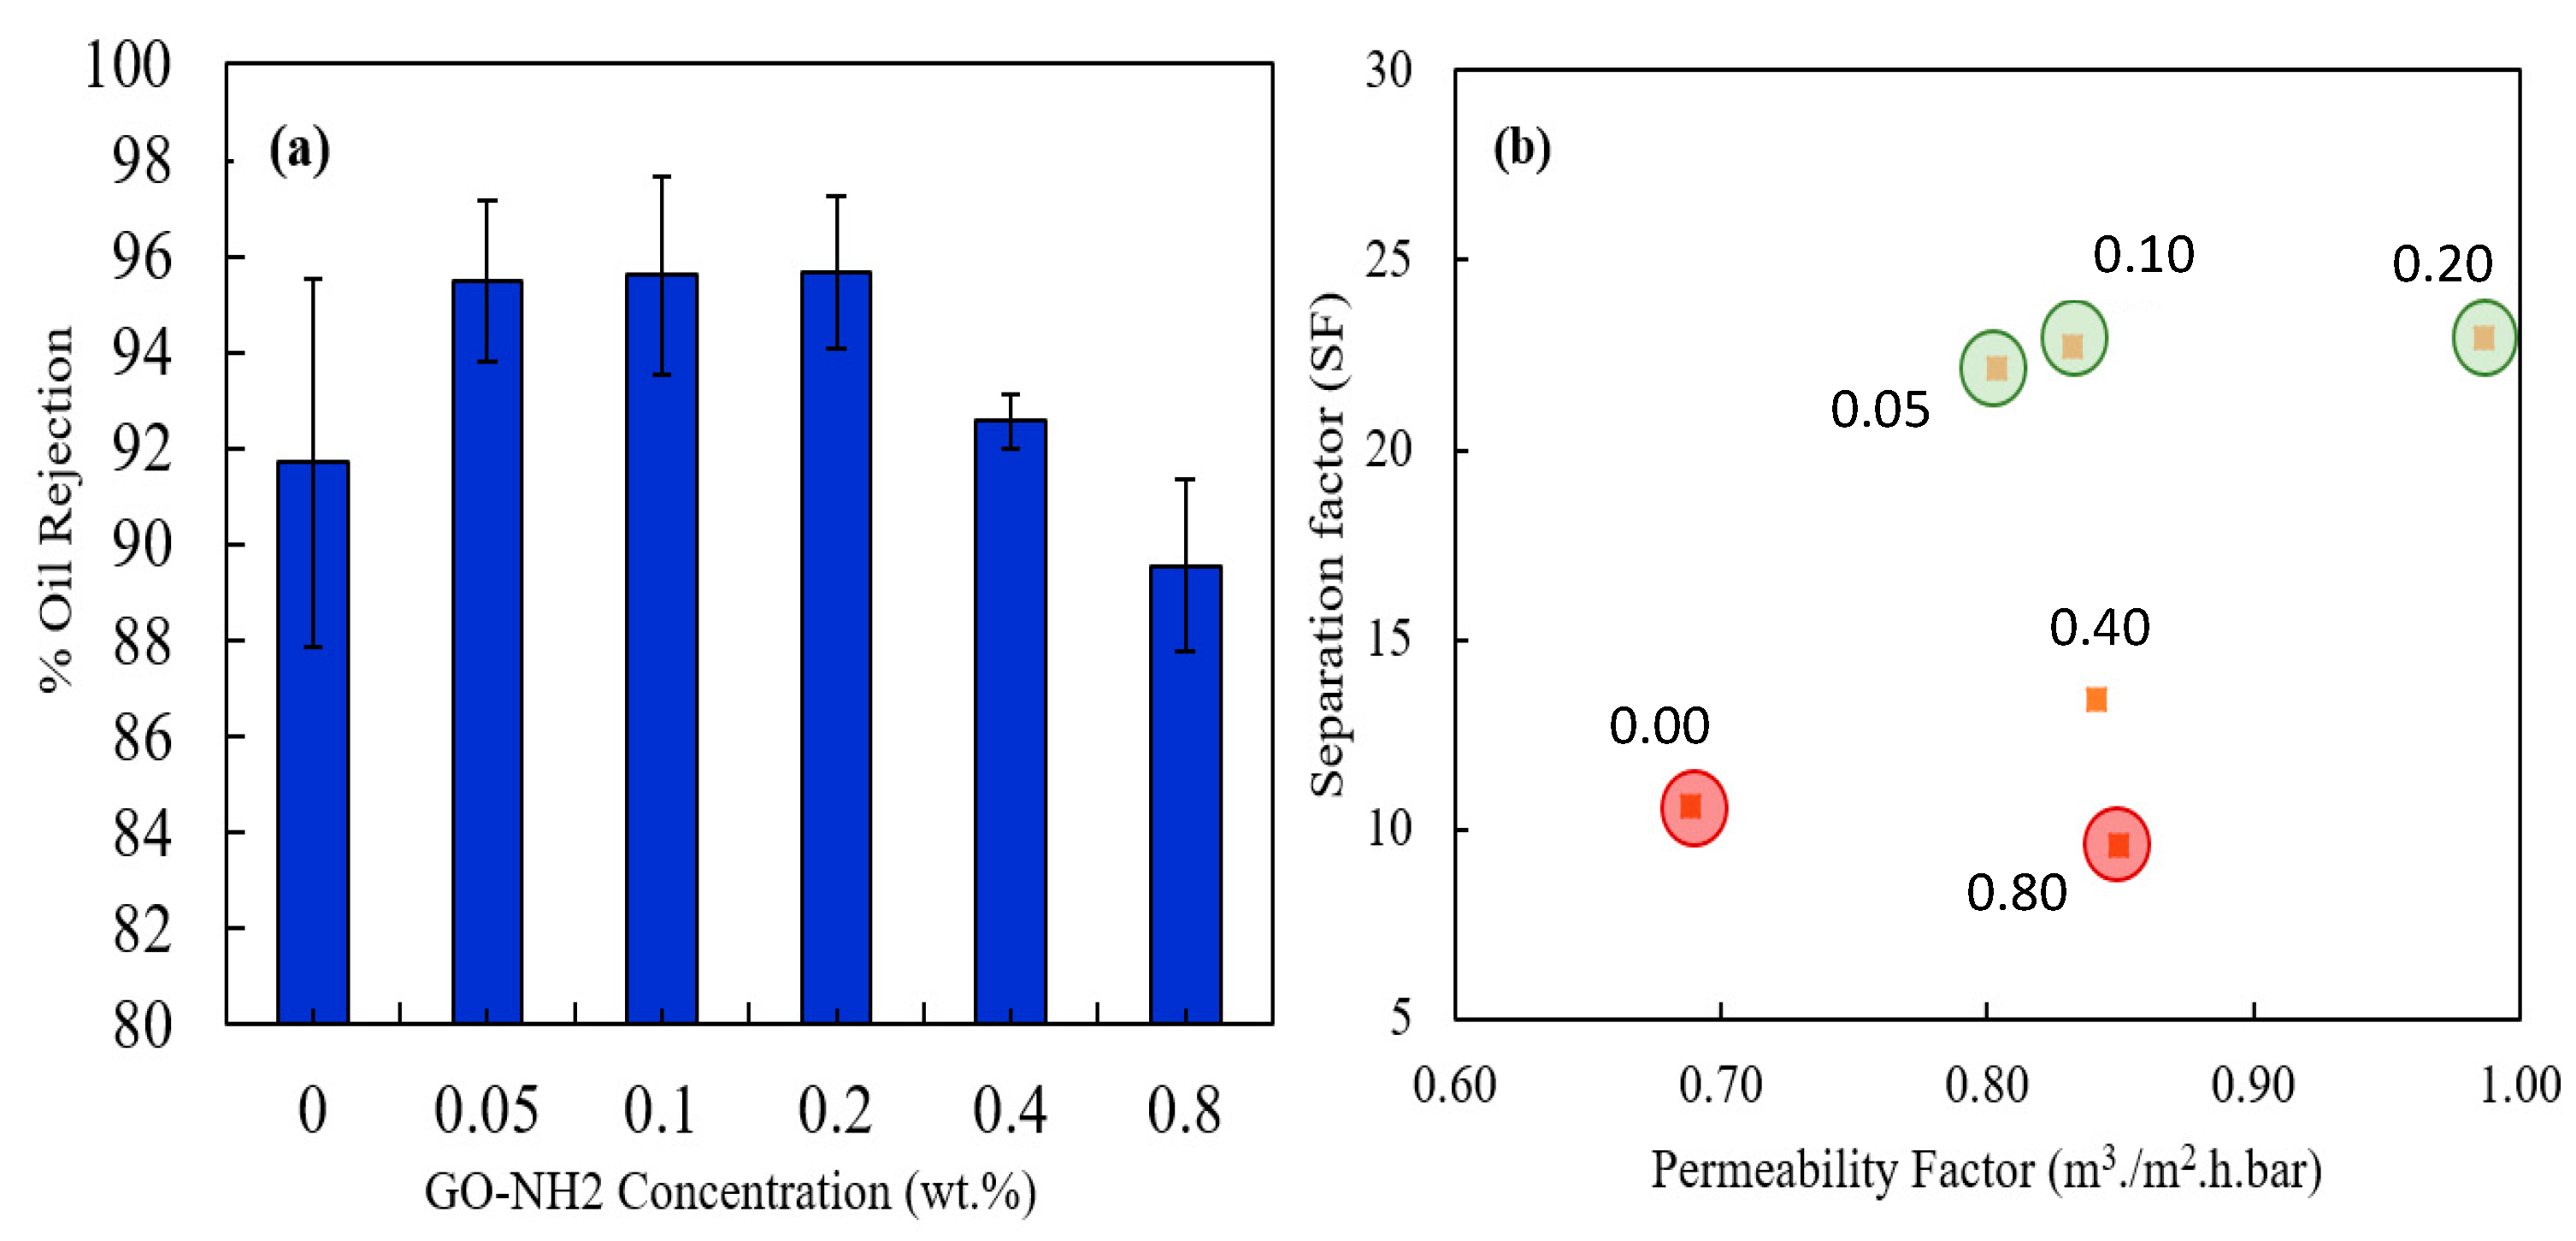
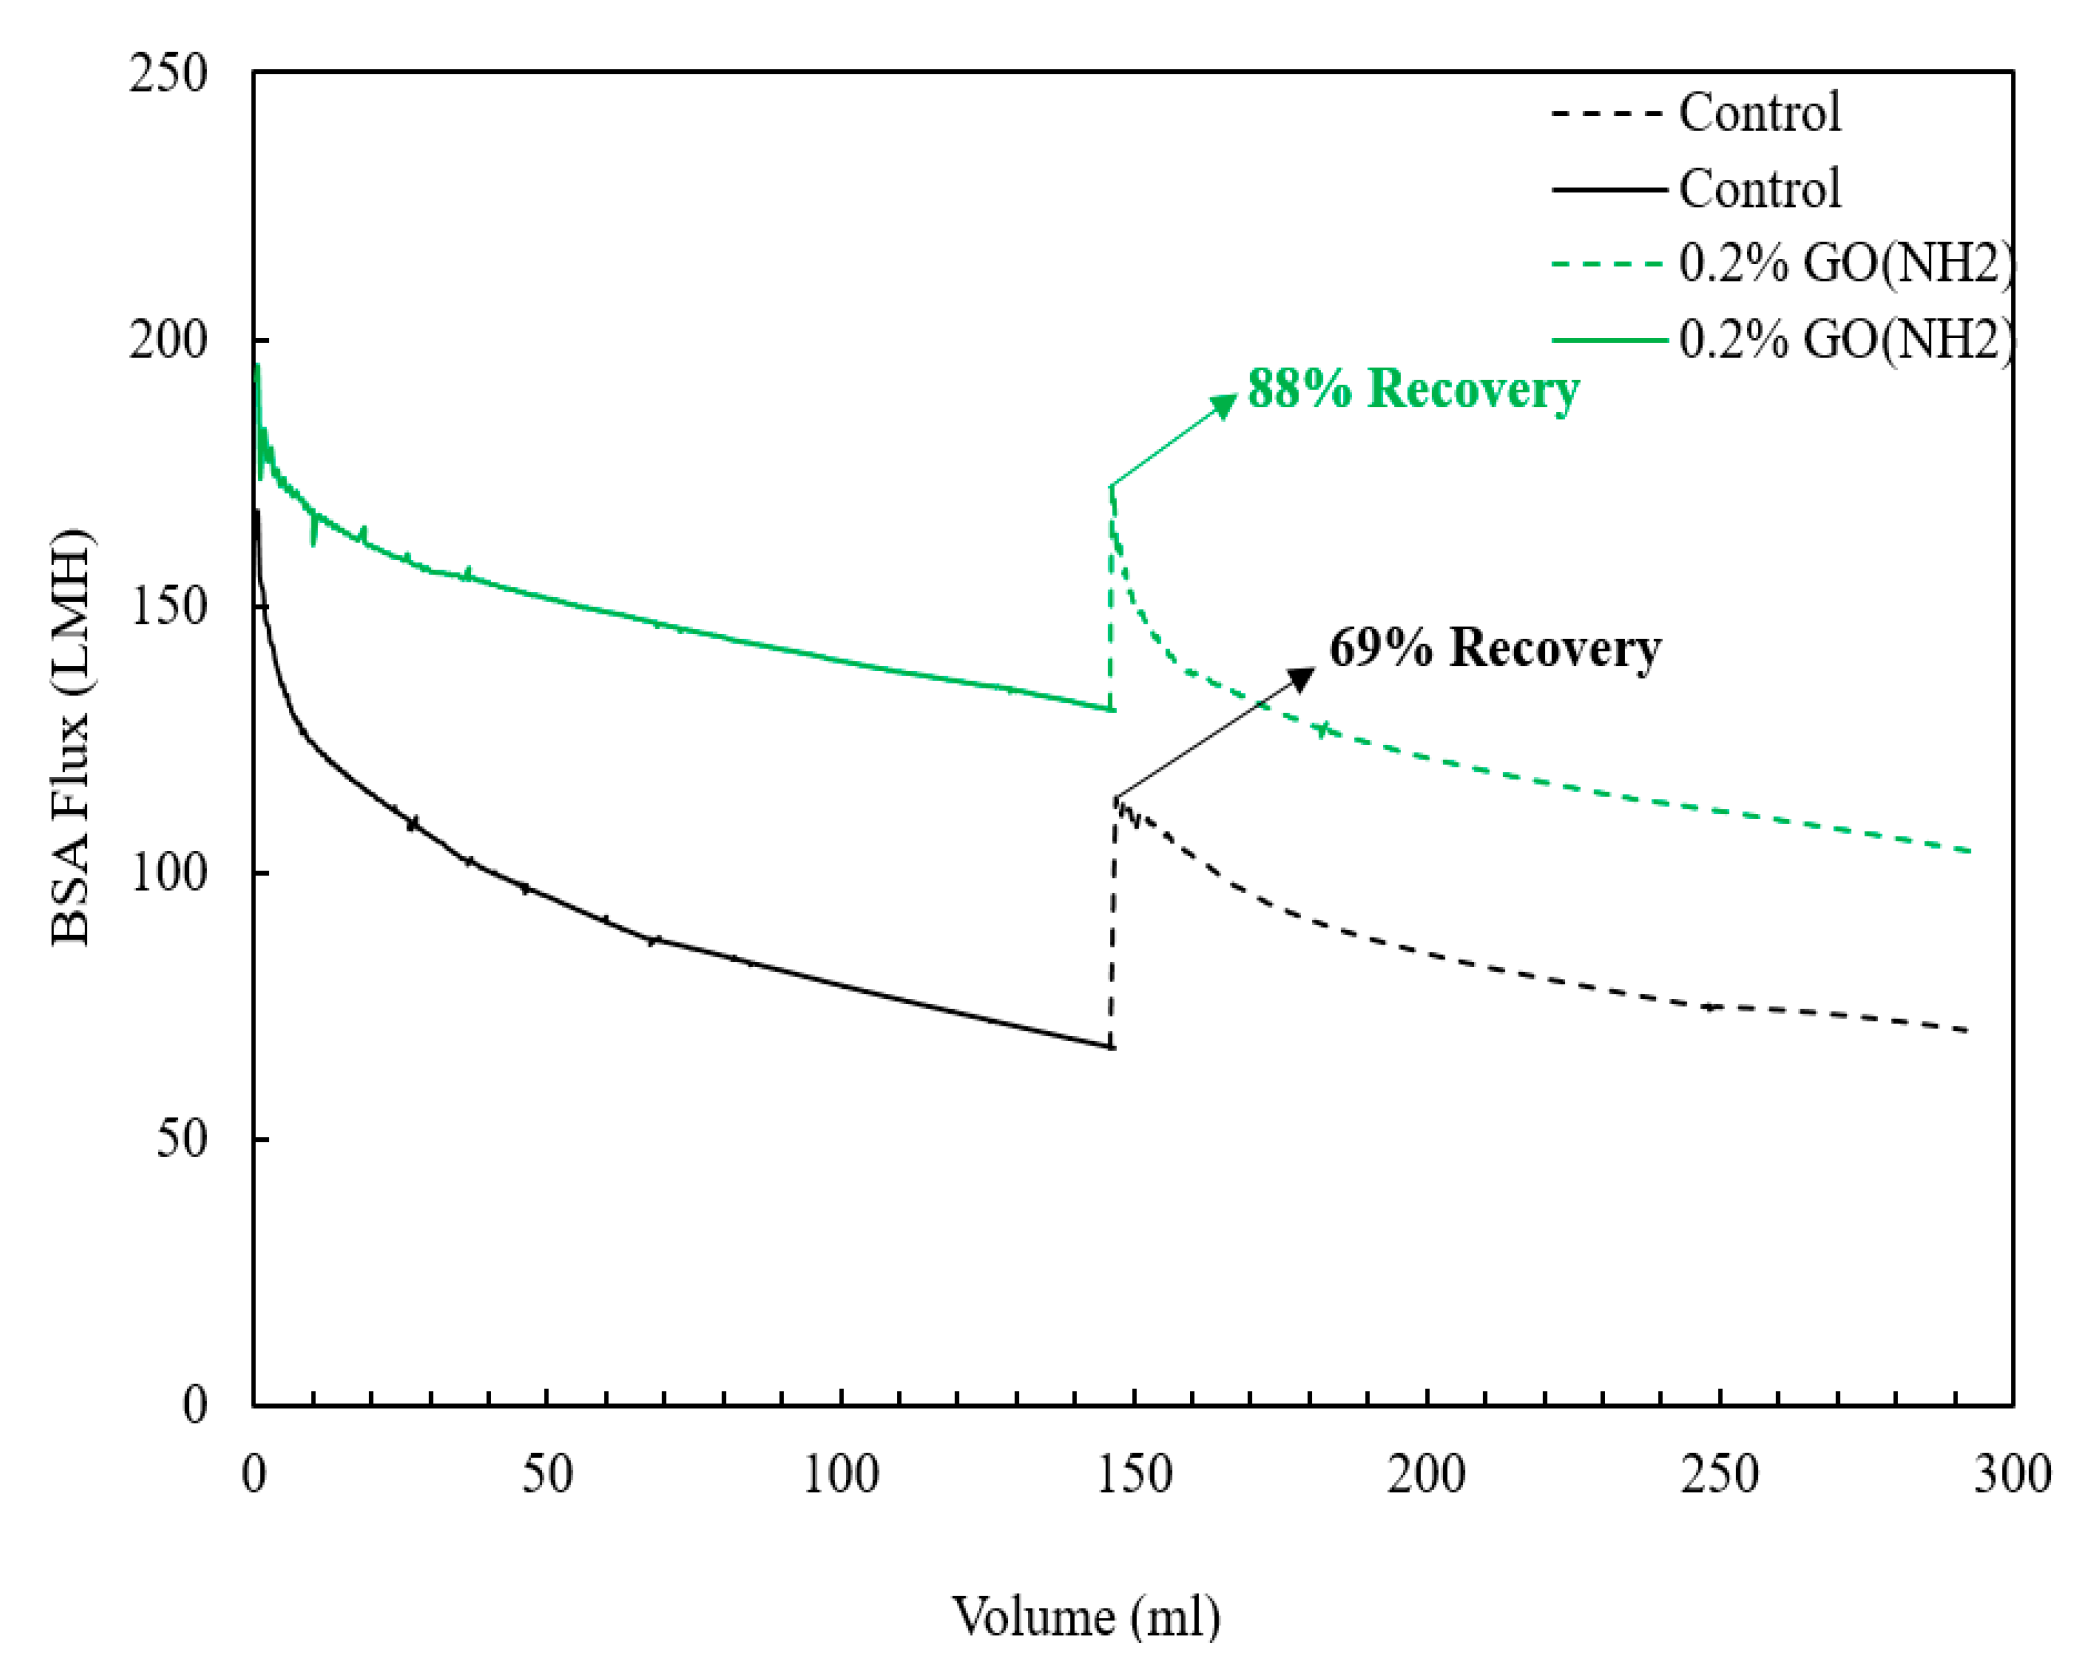
3.3. Performance Testing of the GO-NH2 Membranes

The performance of the membranes was tested by checking the permeability, selectivity, and antifouling characteristics. The permeability test involved checking DI water flux at a trans-pressure of 1, 2, and 3 bars using a dead-end cell. Before testing, the prepared membranes were pressurized at various pressures from 1 to 7 bars to ensure stable operation. Figure 7 shows the average pure water fluxes at different concentrations of GO-NH2. It can be observed from the figure that pure water fluxes increased when small amounts of GO-NH2 (0.05–0.2 wt.%) were added and decreased again at more significant amounts (0.4–0.8 wt.%). The same trend was observed by Zhao et al. and Abdalla et al. in one of their previous studies [47,48]. This result is associated with the agglomeration of the GO-NH2 filler when present in large amounts, as it negatively affects the porosity and hydrophilicity. The high concentration of the GO-NH2 filler increases the dope solution viscosity, which hinders the exchange between solvents and non-solvents during phase inversion, inducing a decrease in hydrophilicity and porosity. Therefore, the pure water flux decreases [42]. The 0.2 wt.% GO-NH2 membrane achieved the highest permeability (92% higher than the control membrane).
The extent of oil–water separation was used to assess the selectivity of the fabricated membranes. A 100-ppm oil–water mixture was filtered through the prepared membranes, and the percentage of oil rejection was calculated. Figure 8a shows the percentage of oil rejection for the control and GO-NH2 membranes. As demonstrated by Figure 8a, the oil rejection improved for all MMMs, except for the membrane with the highest GO-NH2 concentration. The control membrane had an oil rejection of 91.7%, while the 0.2 wt.% GO-NH2 membrane exhibited an oil rejection of 95.6%, with an improvement of about 4%; consequently, the oil content of the 0.2 wt.% GO-NH2 permeate (4.4 ppm) was much lower than that of the control membrane (8.3 ppm), indicating greater separation efficiency [49].
Generally, there is a tradeoff between the permeability and selectivity of polymeric membranes, as higher water fluxes usually tend to reduce the separation efficiency [50]. This study examined this tradeoff by plotting the separation factor vs. permeability factor for all prepared membranes, as presented in Figure 8b. The separation and permeability factors were calculated using the equations presented in Section 2.4. This study found the tradeoff to be minimal, as the highly permeable membranes exhibited high separation factors. Therefore, incorporating small quantities of GO-NH2 positively influenced the fabricated membranes’ performance in multiple criteria. The optimum membranes were found to be 0.05 wt.%, 0.1 wt.%, and 0.2 wt.% GO-NH2, as highlighted by the light green color in Figure 8b, and the poorest performing membranes were the control and 0.8 wt.% GO-NH2 membranes.
Fouling is one of the main issues limiting the practical application of membranes since it controls the membrane performance over a period of time [51]. Membrane fouling is caused by either pore blocking, cake formation, organic adsorption, inorganic precipitation, or biological fouling, resulting in short-term or immutable flux decline [52]. In this study, an organic fouling test was performed by filtering 500-ppm BSA solution through the membranes, followed by rinsing with DI water, 0.1 M NaOH solution, and a second BSA cycle.
Each step measured the BSA flux to check the fouling behavior in flux decline and recovery ratio. An antifouling test was only carried out on the control and 0.2 wt.% GO-NH2 membrane since it was the optimum membrane among the rest in terms of permeability, selectivity, and mechanical properties. The two membranes were pre-compacted at high pressures before BSA filtration to ensure that the flux decline was only caused due to the fouling phenomenon. Figure 9 shows the variation in BSA fluxes with volume for the control and 0.2 wt.% GO-NH2 membrane. As demonstrated by the figure, the control membrane exhibited the highest flux reduction compared to the modified membrane. This is associated with the low hydrophilicity of the control membrane compared to the 0.2 wt.% GO-NH2 membrane, indicating higher fouling potential. Therefore, from the results, it can be deduced that the incorporation of GO-NH2 resulted in improved antifouling characteristics due to the higher achieved hydrophilicity. Furthermore, as investigated through the second BSA fouling step, the modified membrane displayed enhanced flux recovery compared to the control membrane. The control membrane showed a flux recovery of only 69%, while a flux recovery of 88% was recorded for the 0.2 wt.% GO-NH2 membrane (Table 1).

3.4. Performance Testing of the GO-NH2 Membranes for Air Dehumidification

The incorporation of 0.20 wt.% GO-NH2 into the PSf matrix enhances the water vapor and air permeance of the PSf-GO-NH2 membranes, as shown in Table 2. This is attributed to the following factors: (1) GO-NH2 increases the porosity of the membranes, which reduces the transport resistance and increases the mass transfer rate of water vapor and air molecules through the membranes; (2) GO-NH2 increases the membrane hydrophilicity (decreases the water contact angle), which increases the affinity and adsorption of water vapor molecules on the membrane surface and within the pores. These factors are beneficial for air dehumidification applications, where high water vapor permeance is desirable. However, the increased porosity also has a negative effect on the selectivity and separation factor of the membranes. This is because both larger pores and a higher porosity allow for more non-selective gases, such as nitrogen and oxygen, to pass through the membranes, along with water vapor, reducing the relative difference in permeance between water vapor and other gases. Selectivity and separation factor are important parameters for evaluating membrane performance for gas separation applications, where high gas purity is required. The water vapor permeance of the membranes with 0.20 wt.% GO-NH2 was 16,408 GPUs, which was ~20% higher than that of the pure PSf membrane, while the selectivity and separation factor were slightly lower. The water vapor permeance of the PSf-GO-NH2 membranes is higher than that of other PSf-based membranes [53,54], which makes them ideal candidates as substrates for thin-film composite (TFC) air dehumidification membranes. This study highlights the first use of amine-functionalized graphene oxide (GO-NH2) as an additive to enhance the features of PSf matrix, as GO-NH2 offers advantages other graphene-based additives, such as improved dispersion, compatibility, and functionalization [55].

4. Conclusions

In conclusion, a facile functionalization method was developed to functionalize GO with amine groups. The functionalization was confirmed through multiple characterization techniques such as XRD, SEM, EDX, and XPS. Amine-functionalized GO (GO-NH2) was incorporated into the polymeric mix via straightforward addition to the casting solution. The prepared membranes, i.e., PSf/GO-NH2, were fabricated via phase inversion. The influence of GO-NH2 on the morphology, hydrophilicity, mechanical properties, performance, and antifouling characteristics of the membranes was further investigated through SEM, contact angle measurements, pure water flux, and oil rejection. The addition of GO-NH2 into polysulfone matrix enhanced the hydrophilicity and mechanical properties of the membranes since GO-NH2 has a hydrophilic nature and a high aspect ratio. Outstanding improvements in mechanical properties were demonstrated through the high Young’s modulus and breakage strength values attained by the MMMs.
Furthermore, the prepared membranes’ permeability and selectivity were elevated by almost 91.7% and 5.08% compared to the control membrane. Moreover, a robust antifouling capability was observed for the 0.2 wt.% GO-NH2 membrane because of its high hydrophilicity and electrostatic repulsion characteristics. Consequently, the 0.2 wt.% GO-NH2 membrane was chosen as the optimum membrane as it showed the best performance and properties among all prepared membranes, as shown in Table 1. Finally, further investigations must be carried out to better understand the specific interactions between water and GO-NH2 membranes. The initial results show tremendous potential and indicate that these MMMs could be utilized in various industrial applications. Regarding the membrane performance for air dehumidification, the addition of GO-NH2 to the membrane increased the water vapor permeance by 20%, indicating an enhancement of the membrane air-dehumidification characteristics.

Supplementary Materials

The following supporting information can be downloaded at: https://www.mdpi.com/article/10.3390/membranes13070678/s1, Table S1: Elemental Analysis of GO and GO-NH2 Obtained from XPS; Figure S1: SEM of GO-NH2 and EDS mapping of (b) carbon, (c) nitrogen, and (d) oxygen atoms of GO-NH2; Figure S2: Surface Topography Analysis of GO-NH2 Membranes: (a) PSf, (b) Roughness of PSf, (c) Surface of PSf-0.1-GO-NH2, and (d) Roughness of PSf-0.1-GO-NH2.

Author Contributions

Conceptualization, O.A. and A.A.; methodology, O.A., A.A. and A.R.; validation, A.A.; formal analysis, O.A. and A.N.; investigation, O.A.; resources, A.A.; data curation, O.A. and A.R.; writing—original draft preparation, O.A. and A.N.; writing—review and editing, O.A., A.N. and A.A.; visualization, O.A. and A.N.; supervision, M.A.W., A.A.-W. and A.A.; funding acquisition, A.A. All authors have read and agreed to the published version of the manuscript.

Funding

This research was supported by NPRP grant # NPRP12S-0128190016 from the Qatar National Research Fund (a constituent member of the Qatar Foundation).

Institutional Review Board Statement

Not applicable.

Data Availability Statement

Data will be available upon a reasonable request to the corresponding author.

Acknowledgments

The authors would like to thank the Central Materials facility at TAMUQ for their hard work in conducting various characterization analyses, including SEM, AFM, and XRD. The authors would like to acknowledge the Qatar Environment and Energy Research Institute (QEERI) for their assistance with X-ray photoelectron spectroscopy and dynamic mechanical and contact angle analyses.

Conflicts of Interest

The authors declare no conflict of interest.

References

  1. Shannon, M.A.; Bohn, P.W.; Elimelech, M.; Georgiadis, J.G.; Mariñas, B.J.; Mayes, A.M. Science and technology for water purification in the coming decades. Nature 2008, 452, 301–310. [Google Scholar] [CrossRef] [PubMed]
  2. Yu, L.; Han, M.; He, F. A review of treating oily wastewater. Arab. J. Chem. 2017, 10, S1913–S1922. [Google Scholar] [CrossRef] [Green Version]
  3. Clark, C.E.; Veil, J.A. Produced Water Volumes and Management Practices in the United States; Argonne National Lab.: Argonne, IL USA, 2009. [Google Scholar]
  4. Putatunda, S.; Bhattacharya, S.; Sen, D.; Bhattacharjee, C. A review on the application of different treatment processes for emulsified oily wastewater. Int. J. Environ. Sci. Technol. 2019, 16, 2525–2536. [Google Scholar] [CrossRef]
  5. Jamaly, S.; Giwa, A.; Hasan, S.W. Recent improvements in oily wastewater treatment: Progress, challenges, and future opportunities. J. Environ. Sci. 2015, 37, 15–30. [Google Scholar] [CrossRef]
  6. Ikhsan, S.N.W.; Yusof, N.; Ismail, A.F.; Salleh, W.N.W.; Aziz, F.; Jaafar, J.; Hasbullah, H. Chapter 1—Synthetic polymer-based membranes for treatment of oily wastewater. In Synthetic Polymeric Membranes for Advanced Water Treatment, Gas Separation, and Energy Sustainability; Ismail, A.F., Salleh, W.N.W., Yusof, N., Eds.; Elsevier: Amsterdam, The Netherlands, 2020; pp. 3–22. [Google Scholar]
  7. Liu, X.; Ren, Z.; Ngo, H.H.; He, X.; Desmond, P.; Ding, A. Membrane technology for rainwater treatment and reuse: A mini review. Water Cycle 2021, 2, 51–63. [Google Scholar] [CrossRef]
  8. Li, Z.; Zhang, H.; Chen, H.; Huang, J.; Fu, H. Water vapor capture using microporous ceramic membrane. Desalination 2020, 482, 114405. [Google Scholar] [CrossRef]
  9. Xie, W.; Geise, G.; Freeman, B.; Lee, H.-S.; Byun, G.; McGrath, J. Polyamide interfacial composite membranes prepared from m-phenylene diamine, trimesoyl chloride and a new disulfonated diamine. J. Membr. Sci. 2012, 403–404, 152–161. [Google Scholar] [CrossRef]
  10. Baig, M.I.; Ingole, P.G.; Choi, W.K.; Park, S.R.; Kang, E.C.; Lee, H.K. Development of carboxylated TiO2 incorporated thin film nanocomposite hollow fiber membranes for flue gas dehydration. J. Membr. Sci. 2016, 514, 622–635. [Google Scholar] [CrossRef]
  11. Zhao, W.; Lu, H.; Li, C. Composite hollow fiber membrane dehumidification: A review on membrane module, moisture permeability and self-cleaning performance. Int. J. Heat Mass Transf. 2021, 181, 121832. [Google Scholar] [CrossRef]
  12. Ingole, P.G.; Choi, W.K.; Lee, G.B.; Lee, H.K. Thin-film-composite hollow-fiber membranes for water vapor separation. Desalination 2017, 403, 12–23. [Google Scholar] [CrossRef]
  13. Bilad, M.R.; Mat Nawi, N.I.; Subramaniam, D.D.; Shamsuddin, N.; Khan, A.L.; Jaafar, J.; Nandiyanto, A.B.D. Low-pressure submerged membrane filtration for potential reuse of detergent and water from laundry wastewater. J. Water Process Eng. 2020, 36, 101264. [Google Scholar] [CrossRef]
  14. Rodrigues, R.; Mierzwa, J.C.; Vecitis, C.D. Mixed matrix polysulfone/clay nanoparticles ultrafiltration membranes for water treatment. J. Water Process Eng. 2019, 31, 100788. [Google Scholar] [CrossRef]
  15. Song, D.; Xu, J.; Fu, Y.; Xu, L.; Shan, B. Polysulfone/sulfonated polysulfone alloy membranes with an improved performance in processing mariculture wastewater. Chem. Eng. J. 2016, 304, 882–889. [Google Scholar] [CrossRef]
  16. Pendolino, F.; Armata, N. Graphene Oxide in Environmental Remediation Process; Springer: Cham, Switzerland, 2017. [Google Scholar] [CrossRef]
  17. Smith, A.T.; LaChance, A.M.; Zeng, S.; Liu, B.; Sun, L. Synthesis, properties, and applications of graphene oxide/reduced graphene oxide and their nanocomposites. Nano Mater. Sci. 2019, 1, 31–47. [Google Scholar] [CrossRef]
  18. Zhu, Y.; Murali, S.; Cai, W.; Li, X.; Suk, J.W.; Potts, J.R.; Ruoff, R.S. Graphene and Graphene Oxide: Synthesis, Properties, and Applications. Adv. Mater. 2010, 22, 3906–3924. [Google Scholar] [CrossRef] [PubMed]
  19. Lee, J.; Chae, H.-R.; Won, Y.J.; Lee, K.; Lee, C.-H.; Lee, H.H.; Kim, I.-C.; Lee, J.-m. Graphene oxide nanoplatelets composite membrane with hydrophilic and antifouling properties for wastewater treatment. J. Membr. Sci. 2013, 448, 223–230. [Google Scholar] [CrossRef]
  20. Liu, H.; Liu, X.; Zhao, F.; Liu, Y.; Liu, L.; Wang, L.; Geng, C.; Huang, P. Preparation of a hydrophilic and antibacterial dual function ultrafiltration membrane with quaternized graphene oxide as a modifier. J. Colloid Interface Sci. 2020, 562, 182–192. [Google Scholar] [CrossRef]
  21. Zhang, X.; Liu, Y.; Sun, C.; Ji, H.; Zhao, W.; Sun, S.; Zhao, C. Graphene oxide-based polymeric membranes for broad water pollutant removal. RSC Adv. 2015, 5, 100651–100662. [Google Scholar] [CrossRef]
  22. Ma, J.; Ping, D.; Dong, X. Recent developments of graphene oxide-based membranes: A review. Membranes 2017, 7, 52. [Google Scholar] [CrossRef]
  23. Omnya, A.; Md, A.W.; Ahmed, A. Fabrication of Graphene Oxide-Based Membranes and their Applications in Water Treatment. Curr. Pharm. Biotechnol. 2021, 22, 1686–1704. [Google Scholar] [CrossRef]
  24. Cruz-Silva, R.; Endo, M.; Terrones, M. Graphene oxide films, fibers, and membranes. Nanotechnol. Rev. 2016, 5, 377–391. [Google Scholar] [CrossRef]
  25. Huang, Z.; Nazifi, S.; Jafari, P.; Karim, A.; Ghasemi, H. Networked Zwitterionic Durable Antibacterial Surfaces. ACS Appl. Bio Mater. 2020, 3, 911–919. [Google Scholar] [CrossRef] [PubMed]
  26. Hwang, T.; Oh, J.-S.; Yim, W.; Nam, J.-D.; Bae, C.; Kim, H.-i.; Kim, K.J. Ultrafiltration using graphene oxide surface-embedded polysulfone membranes. Sep. Purif. Technol. 2016, 166, 41–47. [Google Scholar] [CrossRef] [Green Version]
  27. Kim, H.S.; Oweida, T.J.; Yingling, Y.G. Interfacial stability of graphene-based surfaces in water and organic solvents. J. Mater. Sci. 2018, 53, 5766–5776. [Google Scholar] [CrossRef]
  28. Kardani, R.; Asghari, M.; Mohammadi, T.; Afsari, M. Effects of nanofillers on the characteristics and performance of PEBA-based mixed matrix membranes. Rev. Chem. Eng. 2018, 34, 797–836. [Google Scholar] [CrossRef]
  29. Liang, Y.; Ding, W.; Yao, B.; Zheng, F.; Smirnova, A.; Gu, Z. Mediating Lithium Plating/Stripping by Constructing 3D Au@Cu Pentagonal Pyramid Array. Batteries 2023, 9, 279. [Google Scholar] [CrossRef]
  30. Luque-Alled, J.M.; Abdel-Karim, A.; Alberto, M.; Leaper, S.; Perez-Page, M.; Huang, K.; Vijayaraghavan, A.; El-Kalliny, A.S.; Holmes, S.M.; Gorgojo, P. Polyethersulfone membranes: From ultrafiltration to nanofiltration via the incorporation of APTS functionalized-graphene oxide. Sep. Purif. Technol. 2020, 230, 115836. [Google Scholar] [CrossRef]
  31. Zambare, R.S.; Dhopte, K.B.; Patwardhan, A.V.; Nemade, P.R. Polyamine functionalized graphene oxide polysulfone mixed matrix membranes with improved hydrophilicity and anti-fouling properties. Desalination 2017, 403, 24–35. [Google Scholar] [CrossRef]
  32. Humphreys, C. The significance of Bragg’s law in electron diffraction and microscopy, and Bragg’s second law. Acta Crystallogr. Sect. A Found. Crystallogr. 2013, 69, 45–50. [Google Scholar] [CrossRef] [Green Version]
  33. Chakrabarty, B.; Ghoshal, A.K.; Purkait, M.K. Preparation, characterization and performance studies of polysulfone membranes using PVP as an additive. J. Membr. Sci. 2008, 315, 36–47. [Google Scholar] [CrossRef]
  34. Zhang, W.; Wahlgren, M.; Sivik, B. Membrane Characterization by the Contact Angle Technique: II. Characterization of UF-Membranes and Comparison between the Captive Bubble and Sessile Drop as Methods to obtain Water Contact Angles. Desalination 1989, 72, 263–273. [Google Scholar] [CrossRef]
  35. Claridge, D.E.; Culp, C.; Liu, W.; Pate, M.; Haberl, J.; Bynum, J.; Tanskyi, O.; Schaff, F. A new approach for drying moist air: The ideal Claridge-Culp-Liu dehumidification process with membrane separation, vacuum compression and sub-atmospheric condensation. Int. J. Refrig. 2019, 101, 211–217. [Google Scholar] [CrossRef]
  36. Gurunathan, S.; Han, J.; Eppakayala, V.; Kim, J.-H. Green synthesis of graphene and its cytotoxic effects in human breast cancer cells. Int. J. Nanomed. 2013, 8, 1015–1027. [Google Scholar] [CrossRef] [PubMed] [Green Version]
  37. Bera, M.; Yadav, C.; Gupta, P.; Maji, P. Facile One-Pot Synthesis of Graphene Oxide by Sonication Assisted Mechanochemical Approach and Its Surface Chemistry. J. Nanosci. Nanotechnol. 2018, 18, 902–912. [Google Scholar] [CrossRef]
  38. Krishna, R.; Titus, E.; Okhay, O.; Gil, J.; Ventura, J.; Ramana, E.; Gracio, J. Rapid Electrochemical Synthesis of Hydrogenated Graphene Oxide Using Ni Nanoparticles. Int. J. Electrochem. Sci. 2014, 9, 4054–4069. [Google Scholar] [CrossRef]
  39. Kalil, H.; Maher, S.; Bose, T.; Bayachou, M. Manganese Oxide/Hemin-Functionalized Graphene as a Platform for Peroxynitrite Sensing. J. Electrochem. Soc. 2018, 165, G3133–G3140. [Google Scholar] [CrossRef]
  40. Sali, S.; Mackey, H.; Abdala, A. Effect of Graphene Oxide Synthesis Method on Properties and Performance of Polysulfone-Graphene Oxide Mixed Matrix Membranes. Nanomaterials 2019, 9, 769. [Google Scholar] [CrossRef] [Green Version]
  41. Zinadini, S.; Zinatizadeh, A.A.; Rahimi, M.; Vatanpour, V.; Zangeneh, H. Preparation of a novel antifouling mixed matrix PES membrane by embedding graphene oxide nanoplates. J. Membr. Sci. 2014, 453, 292–301. [Google Scholar] [CrossRef]
  42. Xu, Z.; Zhang, J.; Shan, M.; Li, Y.; Li, B.; Niu, J.; Zhou, B.; Qian, X. Organosilane-functionalized graphene oxide for enhanced antifouling and mechanical properties of polyvinylidene fluoride ultrafiltration membranes. J. Membr. Sci. 2014, 458, 1–13. [Google Scholar] [CrossRef]
  43. Ganesh, B.M.; Isloor, A.M.; Ismail, A.F. Enhanced hydrophilicity and salt rejection study of graphene oxide-polysulfone mixed matrix membrane. Desalination 2013, 313, 199–207. [Google Scholar] [CrossRef]
  44. Mokkapati, V.R.S.S.; Koseoglu-Imer, D.Y.; Yilmaz-Deveci, N.; Mijakovic, I.; Koyuncu, I. Membrane properties and anti-bacterial/anti-biofouling activity of polysulfone–graphene oxide composite membranes phase inversed in graphene oxide non-solvent. RSC Adv. 2017, 7, 4378–4386. [Google Scholar] [CrossRef] [PubMed] [Green Version]
  45. Morimune-Moriya, S.; Goto, T.; Nishino, T. Effect of aspect ratio of graphene oxide on properties of poly (vinyl alcohol) nanocomposites. Nanocomposites 2019, 5, 84–93. [Google Scholar] [CrossRef] [Green Version]
  46. Ammar, A.; Al-Enizi, A.M.; AlMaadeed, M.A.; Karim, A. Influence of graphene oxide on mechanical, morphological, barrier, and electrical properties of polymer membranes. Arab. J. Chem. 2016, 9, 274–286. [Google Scholar] [CrossRef] [Green Version]
  47. Abdalla, O.; Wahab, M.A.; Abdala, A. Mixed matrix membranes containing aspartic acid functionalized graphene oxide for enhanced oil-water emulsion separation. J. Environ. Chem. Eng. 2020, 8, 104269. [Google Scholar] [CrossRef]
  48. Zhao, G.; Hu, R.; Li, J.; Zhu, H. Graphene oxide quantum dots embedded polysulfone membranes with enhanced hydrophilicity, permeability and antifouling performance. Sci. China Mater. 2019, 62, 1177. [Google Scholar] [CrossRef] [Green Version]
  49. Hu, X.; Yu, Y.; Zhou, J.; Wang, Y.; Liang, J.; Zhang, X.; Chang, Q.; Song, L. The improved oil/water separation performance of graphene oxide modified Al2O3 microfiltration membrane. J. Membr. Sci. 2015, 476, 200–204. [Google Scholar] [CrossRef]
  50. Park, H.B.; Kamcev, J.; Robeson, L.; Elimelech, M.; Freeman, B. Maximizing the right stuff: The trade-off between membrane permeability and selectivity. Science 2017, 356, 1138–1148. [Google Scholar] [CrossRef] [PubMed] [Green Version]
  51. Karkooti, A.; Yazdi, A.Z.; Chen, P.; McGregor, M.; Nazemifard, N.; Sadrzadeh, M. Development of advanced nanocomposite membranes using graphene nanoribbons and nanosheets for water treatment. J. Membr. Sci. 2018, 560, 97–107. [Google Scholar] [CrossRef]
  52. Zhang, R.; Liu, Y.; He, M.; Su, Y.; Zhao, X.; Elimelech, M.; Jiang, Z. Antifouling membranes for sustainable water purification: Strategies and mechanisms. Chem. Soc. Rev. 2016, 45, 5888–5924. [Google Scholar] [CrossRef]
  53. Shen, L.; Hung, W.-s.; Zuo, J.; Zhang, X.; Lai, J.-Y.; Wang, Y. High-performance thin-film composite polyamide membranes developed with green ultrasound-assisted interfacial polymerization. J. Membr. Sci. 2019, 570–571, 112–119. [Google Scholar] [CrossRef]
  54. Li, X.; Wang, K.Y.; Helmer, B.; Chung, T.-S. Thin-film composite membranes and formation mechanism of thin-film layers on hydrophilic cellulose acetate propionate substrates for forward osmosis processes. Ind. Eng. Chem. Res. 2012, 51, 10039–10050. [Google Scholar] [CrossRef]
  55. Padaki, M.; Surya Murali, R.; Abdullah, M.S.; Misdan, N.; Moslehyani, A.; Kassim, M.A.; Hilal, N.; Ismail, A.F. Membrane technology enhancement in oil–water separation. A review. Desalination 2015, 357, 197–207. [Google Scholar] [CrossRef]
Figure 1. Testing setup for our vacuum-based air dehumidification performance analysis.
Membranes 13 00678 g001
Figure 2. Characterization of GO and GO-NH2: (a) SEM Images of GO, (b) SEM Images of GO-NH2, (c) XRD Patterns of GO and GO-NH2, and (d) TEM Image of GO-NH2.
Membranes 13 00678 g002
Figure 3. XPS Analysis of GO and GO-NH2: (a) XPS Surveys of GO and GO-NH2, (b) XPS C1s Deconvoluted Spectra of GO, (c) XPS C1s Deconvoluted Spectra of GO-NH2, and (d) XPS N1s Deconvoluted Spectra of GO-NH2.
Membranes 13 00678 g003
Figure 4. Surface SEM images of GO-NH2 membranes—(a) control, (b) 0.2%, (c) 0.8%—and cross-section SEM images of GO-NH2 membranes with (d) 0%, (e) 0.2%, and (f) 0.8% GO-NH2.
Membranes 13 00678 g004
Figure 5. Effect of GO-NH2 concentration on (a) Water Contact Angle and (b) Roughness of PSf-GO-NH2 MMM.
Membranes 13 00678 g005
Figure 6. Effect of GO-NH2 concentration on (a) Young’s modulus and fracture strength of the PSf/GO-NH2 MMMs and (b) Young Modulus (Brown Bars) and Breakage Strength (Blue Curve). Stress vs. strain for the GO-NH2 membranes.
Membranes 13 00678 g006
Figure 7. Porosity and water fluxes of control and GO-NH2 membranes.
Membranes 13 00678 g007
Figure 8. Comparison of GO-NH2 Membranes: (a) Percentage of Oil Rejection and (b) Correlation between Separation Factor and Permeability.
Membranes 13 00678 g008
Figure 9. BSA fluxes vs. volume for control and 0.2 wt.% GO-NH2 membrane.
Membranes 13 00678 g009
Table 1. Summarized results of control and optimum 0.2 wt.% GO-NH2 membrane.
MembraneContact Angle
(°)
Porosity
(%)
Young’s Modulus
(MPa)
Breakage Strength
(MPa)
Permeability
(LMH/Bar)
Oil Rejection
(%)
BSA Flux Recovery (%)
Control7767.5602.2108091.769
0.2% GO-NH26568.91173.3207195.688
Table 2. Summarized results of air dehumidification performance of PSf and PSf- 0.2 GO-NH2 membranes.
MembraneAbsolute Humidity (kg/m3)Humidity Reduction, %Permeance
(GPU)
Water/
Air Selectivity
Separation Factor
FeedRetentateWaterAir
PSf 0.02710.019129.413710202071
PSf-0.2 GO-NH20.02800.018334.616410268068
Disclaimer/Publisher’s Note: The statements, opinions and data contained in all publications are solely those of the individual author(s) and contributor(s) and not of MDPI and/or the editor(s). MDPI and/or the editor(s) disclaim responsibility for any injury to people or property resulting from any ideas, methods, instructions or products referred to in the content.

