Article

Hydration and Mobility of Alkaline Metal Cations in Sulfonic Cation Exchange Membranes

by
Vitaly I. Volkov
1,2,*,
Nikita A. Slesarenko
1,
Alexander V. Chernyak
1,2,
Irina A. Avilova
1 and
Victor P. Tarasov
1
1
Federal Research Center of Problems of Chemical Physics and Medicinal Chemistry RAS, 142432 Chernogolovka, Russia
2
Scientific Center in Chernogolovka of the Institute of Solid State Physics Named Yu. A. Osipyan RAS, 142432 Chernogolovka, Russia
*
Author to whom correspondence should be addressed.
Membranes 2023, 13(5), 518; https://doi.org/10.3390/membranes13050518
Submission received: 25 April 2023 / Revised: 12 May 2023 / Accepted: 13 May 2023 / Published: 16 May 2023
(This article belongs to the Section Membrane Physics and Theory)

Abstract

:
The interconnection of ionogenic channel structure, cation hydration, water and ionic translational mobility was revealed in Nafion and MSC membranes based on polyethylene and grafted sulfonated polystyrene. A local mobility of Li+, Na+ and Cs+ cations and water molecules was estimated via the 1H, 7Li, 23Na and 133Cs spin relaxation technique. The calculated cation and water molecule self-diffusion coefficients were compared with experimental values measured using pulsed field gradient NMR. It was shown that macroscopic mass transfer is controlled by molecule and ion motion near sulfonate groups. Lithium and sodium cations whose hydrated energy is higher than water hydrogen bond energy move together with water molecules. Cesium cations in possession of low hydrated energy are directly jumping between neighboring sulfonate groups. Cation Li+, Na+ and Cs+ hydration numbers (h) in membranes were calculated from 1H chemical shift water molecule temperature dependences. The values calculated from the Nernst–Einstein equation and the experimental conductivity values were close to each other in Nafion membranes. In MSC membranes, calculated conductivities were one order of magnitude more compared to the experimental ones, which is explained by the heterogeneity of the membrane pore and channel system.

1. Introduction

Understanding of ion exchange membrane selectivity nature is a fundamental problem of ionic separation [1,2]. Ionic transport in sulfonic cation (-exchange) membranes is controlled by the ionogenic channel nanostructure and particularities of the cation hydration. For the transport mechanism revelation of an ionic interaction, the mobility of water molecules and cations in different spatial scales should be investigated. NMR spectroscopy is widely applied to the structure and dynamics of complicated molecular systems studies. Nuclear spin relaxation and pulsed field gradient NMR (PFG NMR) became the methods of choice for molecular and ionic mobility revelation in polymeric electrolytes. The more interesting and fundamental results were obtained for water molecule and alkaline cations transport in sulfocation-exchange membranes. Perfluorinated Nafion [3,4,5,6,7,8,9,10,11,12,13,14,15,16,17,18,19,20] and MF-4SC membranes [21,22,23,24] attracted a special interest. Self-diffusion of water molecules [3,4,5,6,7,8,9,10,11,12,13,14,15,16,17,18,19,21,22,23,24] and Li+, Na+ and Cs+ cations were investigated at different water contents using PFG NMR [4,13,20,21]. The correlation between cation hydration numbers (h) and self-diffusion coefficients was revealed. Spin relaxation investigations of 1H water molecule and cation nuclei gave us the opportunity to calculate water and Li+, Na+ and Cs+ translation correlation times in appropriate ionic forms in Nafion and MF-4SC membranes. It was concluded that the local mobility of molecules and cations near sulfonate groups governs its macroscopic transport [20,21]. The mobility of alkaline cations has been investigated rather poorly in spite of some publications devoted to the relaxation and diffusion of 7Li, 23Na and 133Cs in Nafion and polystyrene sulfonate systems [20,21,25,26,27,28,29,30] showing the efficiency of a combined application of spin relaxation and PFG NMR techniques. Local cation mobilities research into lithium and the sodium salts of polystyrene sulfonic acid is especially interesting [27,28,29,30]. These investigations are fundamental because polystyrene sulfonic acid and salt aqueous solutions may be treated as models of homogeneous membranes—for instance, of MSC membranes based on polyethylene and grafted sulfonated polystyrene. These studies are especially interesting for cations with different hydration abilities, such as Li+, Na+ and Cs+; therefore, they enable us to understand microscopic transport mechanism.
In the last decade, the number of works devoted to ionic conductivity and the self-diffusion of water molecules, hydrated H+ cations and alkaline metal ions Li+, Na+ and Cs+ in Nafion membranes and membranes based on polyethylene with grafted sulfonated polystyrene (MSC) has increased [25,26,31]. Comparison of PFG NMR and impedance spectroscopy measurements gave us the opportunity to reveal the main features of the translational mobility of water molecules, alkaline metal cations and ionic conductivity in sulfocation-exchange MSC and Nafion 117 membranes. The ionic conductivities of Li+, Na+ and Cs+ in Nafion and MSC membranes are changed in the same way as the cation self-diffusion coefficients. The dependences of ionic conductivities and self-diffusion coefficients on temperature and moisture content are symbatic. It was shown that it becomes possible to purposefully vary the mobility of cations and, consequently, the selectivity of membranes to cations of alkali metals. This may be done, for example, by changing the moisture content of MSC through spatial crosslinking of its polymer chains.
The mobility and self-diffusion peculiarities of water and Li+, Na+ and Cs+ cations in the Nafion membrane and in the MSC membrane were revealed by the 1H, 7Li, 23Na and 133Cs spin relaxation and PFG NMR techniques discussed. These membranes are an example of the main type of sulfo cation exchangers: perfluorinated and sulfonated polystyrene membranes.

2. Materials and Methods

2.1. Materials

Extruded N117 (thickness 183 μm, equivalent weight (EW) = 1100, Dupont, Ion Power Inc., New Castle, DE, USA) membranes were used for the experimental characterization of Nafion in salt (Li+, Na+, Cs+) ionic form. As-received membranes were pre-cleaned by boiling in 3 wt % oxygen peroxide (H2O2) for 1 h to eliminate organic residues and rinsed with demineralized water. To guarantee a complete acidification and paramagnetic ion impurities extraction, the samples were soaked in aqueous 10 M H2SO4 at room temperature for 1 h and rinsed with demineralized water. Finally, the membranes were boiled for 1 h in aqueous 1 M HCl and then rinsed with demineralized water. Salt membrane ionic forms were prepared through repeated equilibration with aqueous lithium, sodium and cesium chloride 1M solutions, followed by rinsing in demineralized water [4,5,13]. For the required humidity achievement, Nafion samples were placed in an open weighing bottle inserted in desiccators in which the relative humidity was determined by the vapor pressure of the saturated aqueous salt solution [5,6,13]. Membrane samples in contact with water were also investigated. Sulfocation-exchange MSC membranes made from polyethylene with sulfonated grafted polystyrene were studied. These membranes were obtained through postradiation graft polymerization of styrene on a low-density polyethylene film previously peroxidized through irradiation in air on a 60Co γ-radiation source, followed by sulfonation of the grafted polystyrene with 96% sulfuric acid. The concentration of the sulfo groups, the static exchange capacity (SEC), was 2.5 meq/g. The membrane thickness was more than 20 µm. A detailed method for obtaining MSC membranes is described in our previous works [25,26,31].
For NMR measurements, membrane plates with a dimension of 3 mm × 40 mm were inserted in hermetically closed NMR sample tubes, the outer diameter of which was 5 mm. Dry membrane samples were obtained by drying at 110 °C until a constant weight or equilibration with P2O5 at room temperature. The gravimetrical measured water content λg was characterized as water molecule amount per sulfonated group, calculated from Equation (1):
λ g = m H 2 O · E W m d r y · M ( H 2 O ) ,   or   λ g = m H 2 O m d r y · M ( H 2 O ) · I E C
where EW is the equivalent weight and IEC is the ion-exchange capacity of the membrane considered. In this study, we used the values of EW = 1100 g/eq and IEC= 2.5 mg-eq/g. M (H2O) = 18 g/mol is the molar mass of water, mH2O is the total mass of water in the membrane and mdry is the mass of the dry membrane.

2.2. High-Resolution NMR

High resolutions of 1H, 7Li, 23Na and 133Cs membrane spectra were recorded on the AVANCE-III-500 Bruker NMR spectrometer (the proton Larmor frequency was 500 MHz) in the temperature region from −40 °C to +60 °C. The 1H chemical shift was calculated relative to the bulk water 1H NMR signal (δH2O = 4.30 ppm relatively TMS), and the chemical shift measurement error was less than 0.05 ppm.
NMR spectra of 1H, 7Li, 23Na and 133Cs nuclei belong to water molecules, and Li+, Na+ and Cs+ cations are singlet lines whose width is rather narrow even at temperatures below 0 °C. A high water and cation mobility is indicated at low temperatures. An example of the temperature evolution of water molecule 1H spectra in Cs+ Nafion ionic form is shown inserted in Figure 1.

2.3. PFG NMR

The self-diffusion coefficients were measured for 1H, 7Li, 23Na and 133Cs nuclei with the pulsed field gradient technique at the frequencies 400.22, 155.51, 105.84 and 52.48 MHz, respectively. The measurements were carried out on a Bruker AVANCE-III-400 NMR spectrometer equipped with the diff60 gradient unit. The pulsed field gradient stimulated echo sequence was used. Three 90° pulses produced a stimulated spin echo at time 2τ + τ1 (where τ is the time interval between the first and second 90° pulses and τ1 is the interval between the second and the third pulses). The magnetic field gradient pulses of amplitude g and duration δ were applied after the first and third 90° pulses. The gradient strength was varied linearly in 32 steps within a range from 0.1 to 27 T/m in value. The integrated intensities of spectrum lines were used to obtain the dependence of echo signal attenuation on g2 (diffusion decay) [19,20].
The evolution of the spin echo signal is described by the following equation.
A ( 2 τ , τ 1 , g ) = A ( 2 τ , τ 1 ) exp ( γ 2 g 2 δ 2 t d D s )
where γ is the gyromagnetic ratio, Δ is the interval between gradient pulses, td = Δ − δ/3 is the diffusion time and Ds is the self-diffusion coefficient. A(2τ, τ1, 0) is expressed by the equation
A ( 2 τ , τ 1 , g ) = A ( 0 ) 2 exp 2 τ T 2 τ 1 T 1
where A(0) is the signal intensity after the first radio frequency (RF) pulse. T1 and T2 are the spin–lattice and spin–spin relaxation times, respectively. During the measurement of echo signal evolution, τ and τ1 were fixed, and only the dependence of A on g (diffusion decay) was analyzed.
Experimental diffusion decays were well approximated by Equation (2) in 2–3 orders of magnitude; self-diffusion coefficient measurement error was less than 10%.

2.4. NMR Relaxation

Spin–lattice T1 and spin–spin T2 nuclear relaxation times were measured using 180° -τ-90° and Carr–Purcell–Meiboom–Gill (90° -τ-n180°) pulsed sequences, correspondingly. Longitudinal magnetization Mz recovery and perpendicular magnetization Mx·y decay were approximated using exponential dependences (3) and (4), correspondingly, for 1H, 7Li, 23Na and 133Cs nuclei. The spin echo attenuation of 23Na and 133Cs nuclei was too fast to detect a detailed decay curve shape.
( M 0 M z ) 2 M 0 = exp ( t / T 1 ) ]
Mo is equilibrium nuclear magnetization.

3. Results and Discussion

3.1. Hydration Numbers Calculation

From water molecules 1H chemical shift temperature dependences (Figure 1), the hydration numbers h of Li+, Na+ and Cs+ cations in Nafion 117 and MSC membranes were calculated (Table 1) using Equation (5) [4,5,13,26].
h = λ s 1 d δ d T d δ H 2 O d t
where /dt is a chemical shift temperature dependence of membrane water, H2O/dt is the chemical shift temperature dependence of bulk water and λs is the number of water molecules per SO3 group. In some papers, [32] for example, λs is wrongly called “hydration number”.
The h values are 4.1 ± 1, 5 ± 1 and 3.1 ± 1 and 5 ± 1, 6 ± 1 and 1 ± 0.2 for Li+, Na+ and Cs+ cations in MSC [26] and Nafion membranes [4], correspondingly. The latter values are closed to h of these cations in aqueous chloride solutions [13]. At high water content (RH = 98%) in MSC membranes, cation self-diffusion coefficients increased in the row Li+ < Na+ < Cs+ [26]. The cation self-diffusion coefficients sequence was Li+ ≥ Na+ > Cs+ in Nafion membranes [4]. The discrepancy of the cation translation mobility row in these membranes might be explained by Cs+—SO3 group contact ionic pairs forming in Nafion as opposed to in MSC.

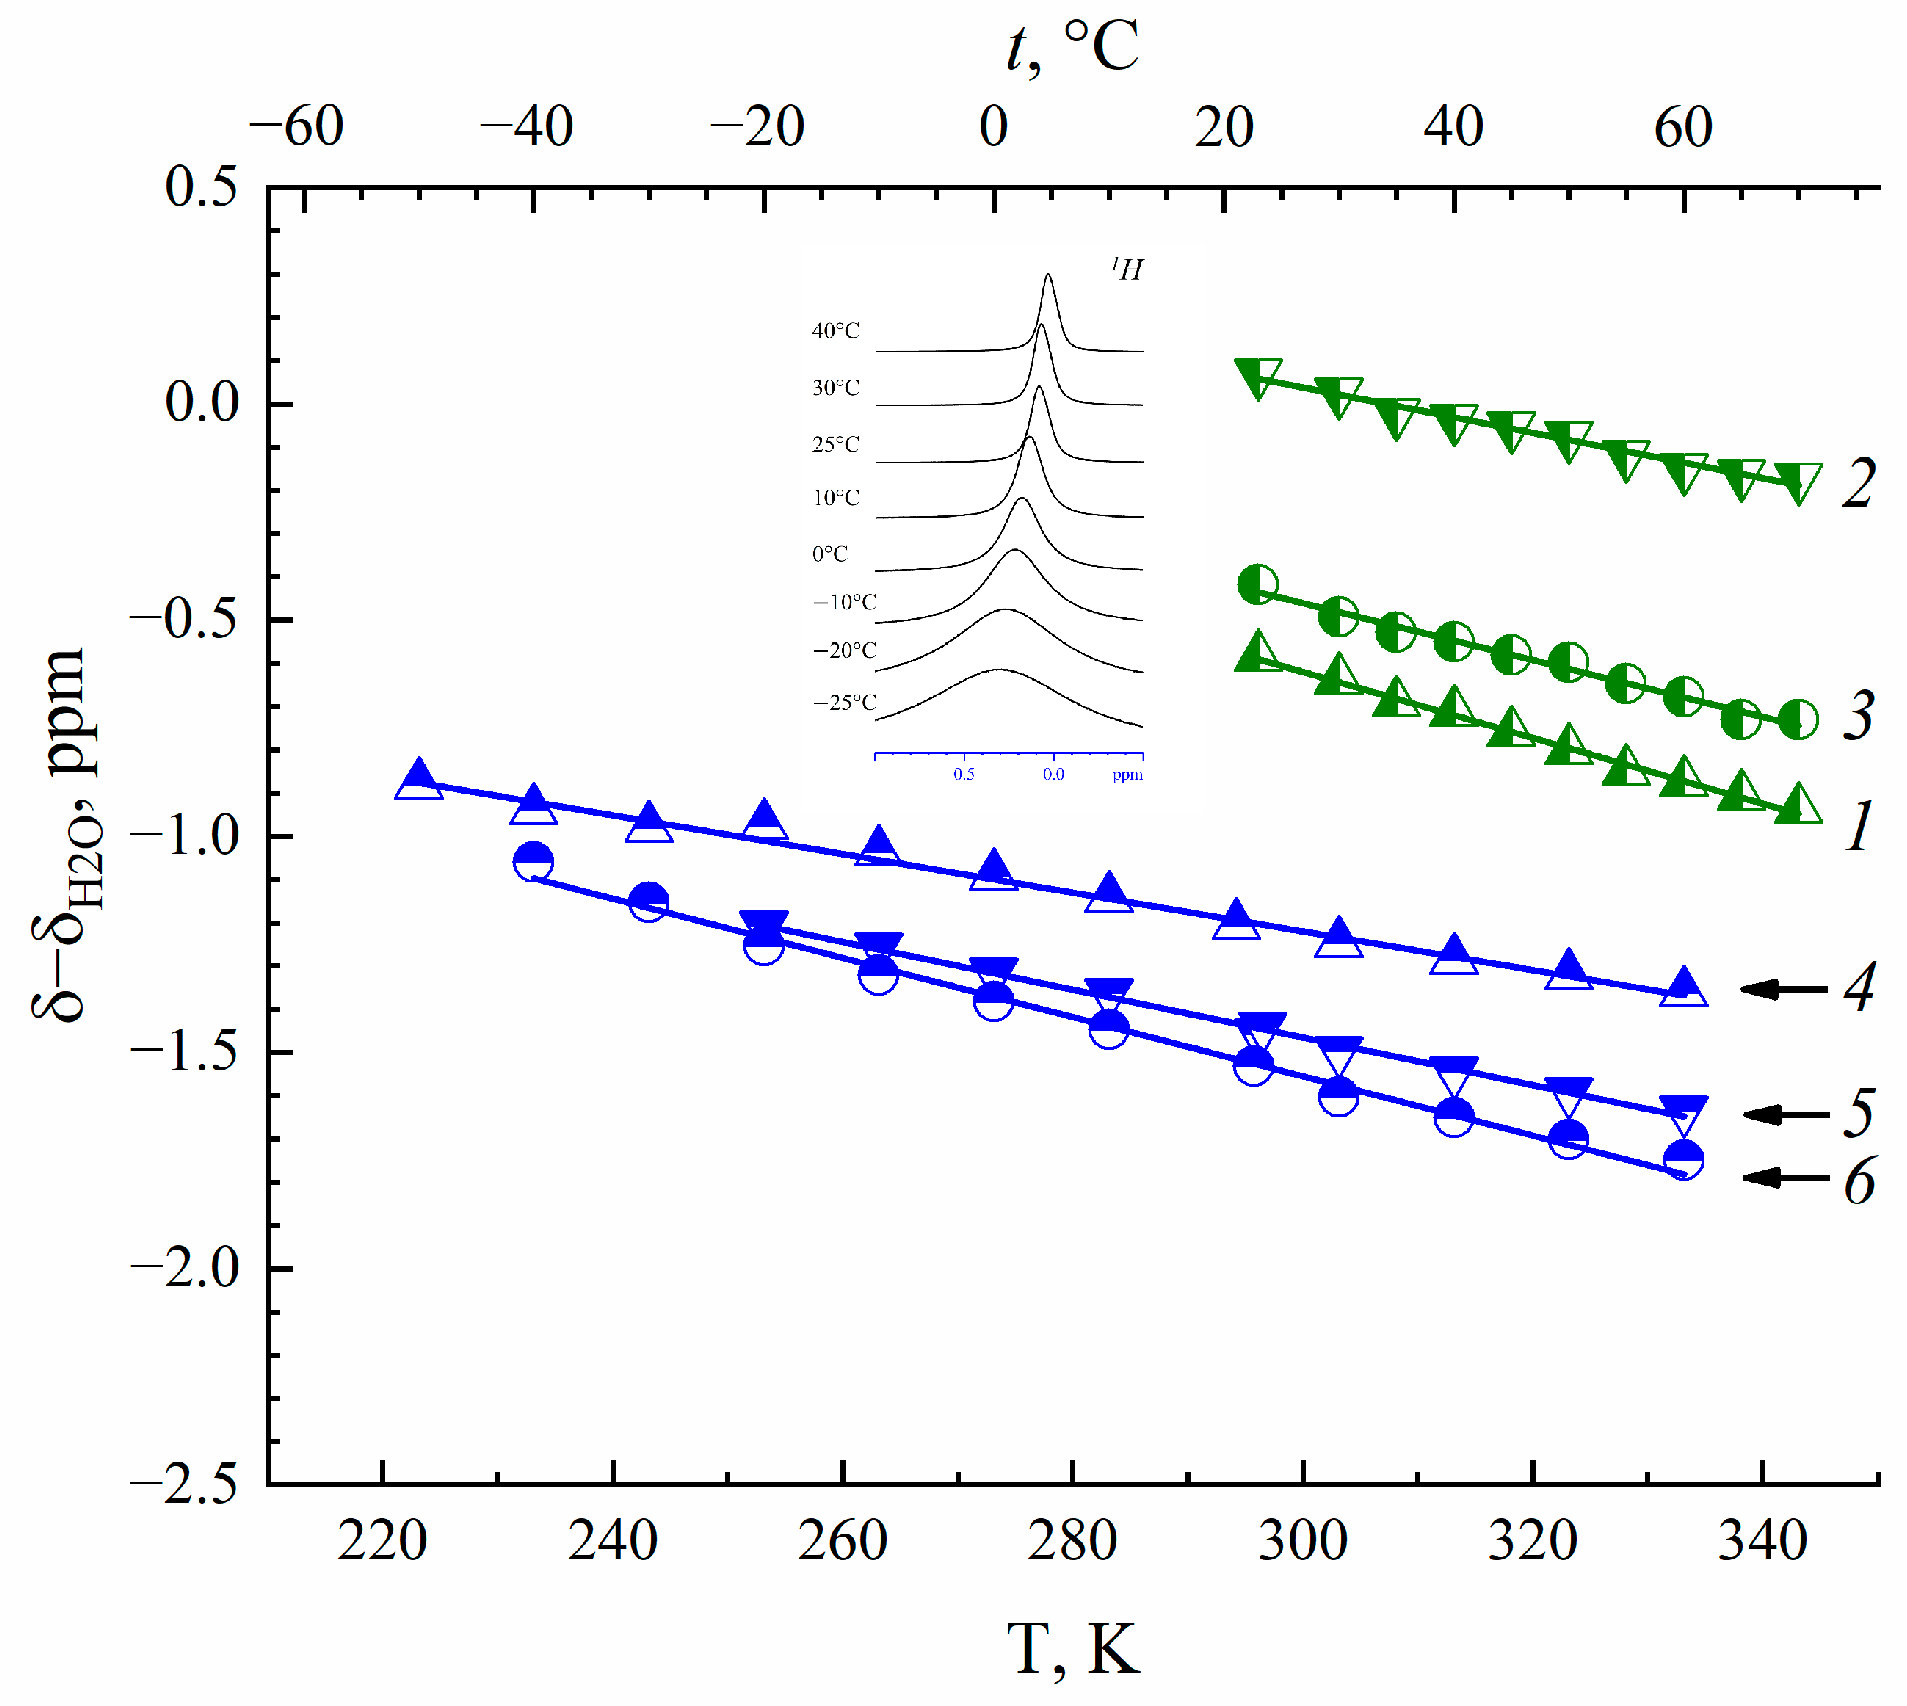
3.2. 1H Relaxation, Local Water Mobility and Self-Diffusion

The temperature dependences of spin–lattice (T1) and spin–spin (T2) relaxation times are shown in Figure 2.
The spin of 1H nuclei is 1/2; therefore, spin relaxation occurs due to proton dipole–dipole interaction modulated by water molecule mobility. In the case of the exponential correlation function relaxation times described by Bloembergen, Purcell and Pound (BPP) equations:
1 T 1 = 2 3 γ 2 Δ H 2 τ c 1 + ω τ c 2 + 4 τ c 1 + ω τ c 2
1 T 2 = 1 3 γ 2 Δ H 2 3 τ c + 5 τ c 1 + ω τ c 2 + 2 τ c 1 + 2 ω τ c 2
Δ H 2 = 9 γ 2 2 20 r 6
τ c = τ c 0 e x p E c / R T
where γ is proton gyromagnetic ratio, r is proton–proton distance, ω is proton NMR frequency and τc is correlation time. In this case, the dependence of T1 on 1/T is Lorentz shaped and shows at a minimum condition of ωτc = 0.62. At this temperature, T1/T2 is equal to 1.6. As is shown in Figure 2, T1 (1/T) dependences are not approximated BPP equations and T1/T2 > 1.6. It is indicated on the distribution of correlation time. The shapes of the distribution function of water proton relaxation in perfluorinated sulfocation-exchange membranes were analyzed [24]. Two types of distribution function, Gaussian and rectangular, were applied. In spite of the correlation times distribution, the condition of T1 minimum was the same at ωτav = 0.62, where τav is the average correlation time [19,23,24]. We applied a Gaussian distribution (Figure 2). At these temperatures, correlation times at minimum T1(T) were 2.46 × 10⁻¹⁰ s and 1.97 × 10⁻¹⁰ s for resonance frequencies 500 MHz and 400 MHz, correspondingly. The water self-diffusion coefficient may be estimated from the Einstein relation [19]:
D = l2/6 τav
where l is average jumping distance. Calculated self-diffusion coefficients were compared with experimental values at temperatures equal to a temperature of minimum T1, which is indicated in Table 2. We may estimate the diffusion length of cation l in the PFG NMR experiment as (6Dtd)1/2. The minimum td (diffusion time) is 10−2 s and D (self-diffusion coefficient) is 10−11 m2/s [5], so l is about 1 µm. It is macroscopic size. Therefore, in PFG NMR, we measure the macroscopic self-diffusion coefficient. The correlation times may be calculated correctly at temperatures where the spin relaxation time T1 shows a minimum. We measured self-diffusion coefficients namely at these temperatures in order to compare calculated and experimental self-diffusion coefficients.
The distance l was calculated in Nafion 117 for different humidities. For Li+ and Na+, the ionic forms’ water jumping distances were 0.15–0.2 nm at low water content and about 3.0 nm at high humidity (Table 2). The first values were comparable with water hydrogen bond length, but the second was equal to water molecule size. Therefore, it may be concluded that macroscopic water self-diffusion is controlled by water molecule local motion through the continuous hydrogen bond network which forms at rather high water content (λ is 6.4 in Li+ form and 5.1 in Na+ form at RH = 86%).

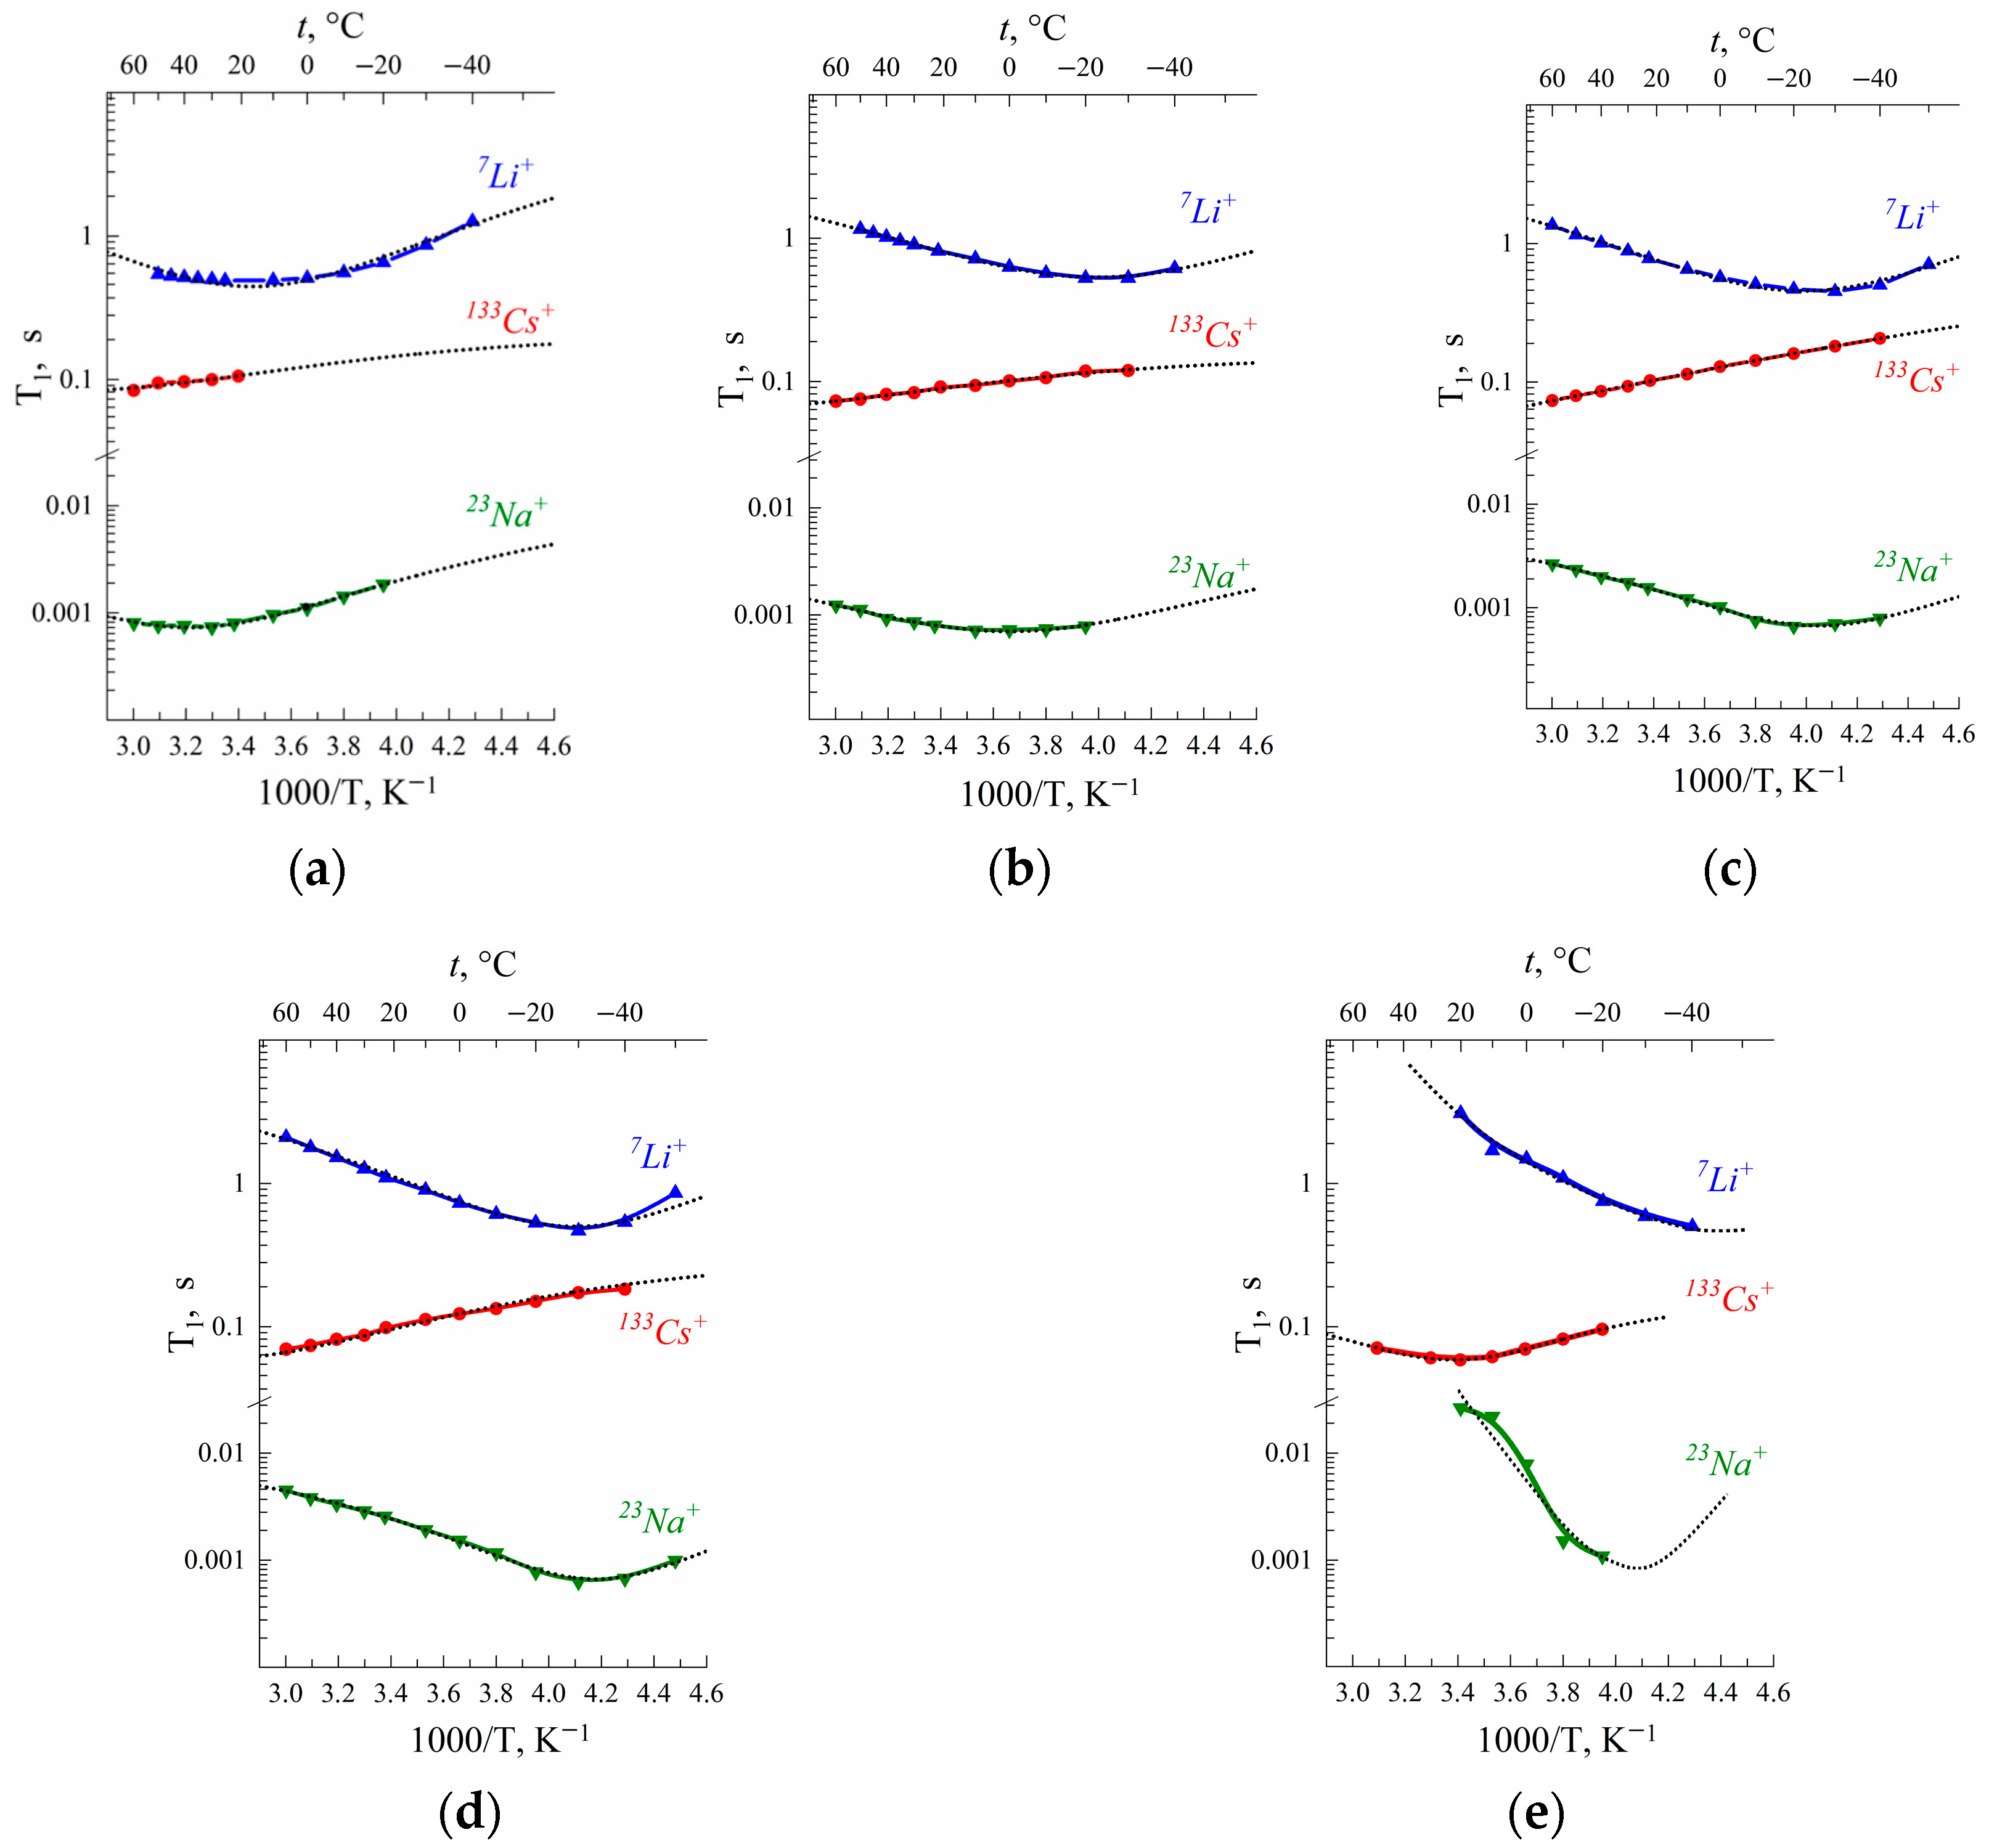
3.3. 7Li, 23Na and 133Cs Spin Relaxation, Local Cation Mobilities and Self-Diffusion

The nuclear spins of 7Li and 23Na are 3/2, but the 133Cs nuclear spin is 7/2. For these nuclei, the main relaxation mechanism is quadrupole relaxation. For nuclear spin 3/2
( M z M 0 ) M ( cos Θ 1 ) = 1 5 exp ( 2 J 1 t ) + 4 5 exp ( 2 J 2 t )
( M x ) M 0 · sin Θ = 3 5 exp [ ( J 0 + J 1 ) t ] + 2 5 exp [ ( J 1 + J 2 ) t ]
where ω is NMR frequency, Ѳ is a rotation angle of equilibrium magnetization and M0 during radio frequency pulse J(λω) is the spectral density on the frequency λω (λ = 0, 1, 2).
J λ = 0 , 1 · π 2 · χ 2 · J ( λ ω )
where
χ = eQ·eq/h
Q is the nuclear quadrupole moment, eq is the mean square value of the electric field gradient on the nucleus and h is Planck’s constant.
J ( λ ω ) = 2 τ [ 1 + ( λ ω τ ) 2 ]
τ = τo·exp(Ea/RT), where τ is the correlation time and Ea is the activation energy [20,21].
Spin–lattice and spin–spin 7Li, 23Na and 133Cs nuclei relaxation times temperature dependences in Nafion 117 membranes are shown in Figure 3.
The T1(T) dependences show at a minimum of (ωτ)2 ≈ 1. Cation self-diffusion coefficients calculated from Equation (10) were compared with experimental ones.
As is shown in Table 3, for Li+ cations the jumping distance l is 0.15–0.18 nm, which is close to water hydrogen bond length. It may be supposed that Li+ cation translation displacement is controlled by a rearrangement of hydration water molecule hydrogen bonds that explains a symbasis of water and lithium cation diffusion behavior. For Cs+ cations, l is approximately 0.7 nm. This value is equal to the average distance between neighboring sulfonate groups. Therefore, it may be assumed that τ, estimated from 133Cs spin–lattice relaxation, is the time of cesium cations jumping between SO3 groups. It looks very likely because the electric field gradient eq is dramatically changed when a cation comes to or departs from the sulfonate group.
Ionic conductivities were calculated on the basis of the Nernst–Einstein Equation (16):
σ = N · D · e 2 k · T
where N is the number of charge carriers, cm3; D is the self-diffusion coefficient, m2/s; e is the electron charge, 1.9 × 10⁻¹⁹ C; k is the Boltzmann constant, 1.38 × 10⁻²³ J/K; and T is the absolute temperature, K.
The calculated conductivities were compared with experimental values measured using impedance spectroscopy. As is shown in Table 4, cation self-diffusion coefficients calculated from local mobility DR were in good agreement with experimental self-diffusion coefficients DPFG measured from PFG NMR. Ionic conductivities calculated from Equation (16) were much closer to experimental values measured using impedance spectroscopy.
All results listed above are explained on the basis of the nanostructural model of transport channels in Nafion shown in Figure 4.
According to this model, ionic and water transport is realized through nanochannels of infinite length by jumping between neighboring sulfonate groups. The main centers of hydration are cations; water molecules also form hydrogen bonds with sulfonate group oxygen. Water molecules, cations and sulfonate groups form channels of infinite length for ionic macroscopic transfer (broken curve in Figure 4). Water content changes the channel width only [6].
In Figure 5, fragments of transport channels are shown in the Li+ and Cs+ ionic forms of Nafion 117. Nanochannels for cesium cations are narrowly compared to lithium cations because of lower humidity in Cs+ ionic form. In Li+ ionic form, water molecules form a continuous hydrogen bond network, and the lithium cation moves through low dimension steps which are hydrogen bond length. In Cs+ ionic form, the hydrogen bond network is broken; therefore, the cesium cation is jumping directly between the nearest SO3 groups.
In the MSC membrane, the temperature dependences of relaxation times are similar to spin relaxation behavior in the Nafion membrane. Spin–lattice relaxation times temperature dependences T1 (T) also display at minimum, as is shown in Figure 6. Correlation times were calculated at the temperature of T1 minimum. The self-diffusion coefficients of cations were calculated based on the Einstein relation.
In Table 5, the self-diffusion coefficients of Li+, Na+ and Cs+ calculated from NMR relaxation and measured using PFG NMR compared with calculated and measured ionic conductivities in MSC membranes are shown.
The calculated and experimental values of the self-diffusion coefficients are rather close to each other. However, calculated conductivities are one order of magnitude more compared with experimental values. As was shown earlier, the distribution of water molecules in MSC membranes is uneven: some of the water molecules are located in the ionogenic phase, while the rest are localized in areas with a depleted content of sulfo groups and cations, as is shown in Figure 7. In these two areas, which are connected sequentially to each other by channels, cations are well hydrated; therefore, cation behavior in MSC membranes is similar to that in aqueous salt solutions. During macroscopic transfer, cations are moving in high and low sulfo group concentration regions. In sulfo-group-depleted parts, ionic conductivity is lower than in charge-rich parts. The depleted membrane part namely limits macroscopic conductivity.

4. Conclusions

Spin relaxation and pulsed field gradient NMR were applied to 1H, 7Li, 23Na and 133Cs nuclei in order to reveal water and cation transfer particularities in different spatial scales in Nafion 117 and MSC membranes. Spin–lattice and spin–spin relaxation times temperature dependences analysis gave us the opportunity to estimate the correlation times of local water molecules and Li+, Na+ and Cs+ cations motion. Self-diffusion coefficients calculated from the Einstein relation were compared with the values of macroscopic self-diffusion coefficients measured using pulsed field gradient NMR. It was concluded that macroscopic mass transfer in Nafion membranes is controlled by molecule and ion motion near sulfonate groups. This conclusion is explained from the point of view of the structural model of membrane ionogenic channels. Lithium and sodium cations translation displacement is controlled by a rearrangement of hydration water molecules hydrogen bonds that explains a symbasis of water and lithium cation self-diffusion behavior. It may be assumed that, opposite to Li+ and Na+, cesium cations jump between SO3 groups directly. It looks very likely because the electric field on the cation nucleus is dramatically changed when the cation comes to or departs from the sulfonate group. In MSC membranes based on polyethylene with sulfonated grafted polystyrene, the diffusion coefficients estimated from the correlation times are also close to the diffusion coefficients measured using the NMR PFG method. Ionic conductivities calculated from cation self-diffusion coefficients are one order of magnitude more compared to experimental values. It has been shown that the limiting stage of macroscopic cation transfer ion transport is ion transport in the regions with a lower concentration of sulfo groups.

Author Contributions

Conceptualization, V.I.V.; methodology, A.V.C.; validation, N.A.S. and I.A.A.; investigation, V.P.T. and N.A.S.; data curation, I.A.A.; writing–original draft preparation, A.V.C. and V.I.V.; writing–review and editing, V.P.T. and A.V.C.; visualization, N.A.S. and I.A.A.; supervision, V.I.V.; project administration and funding, A.V.C. and V.I.V.; acquisition, V.I.V. All authors have read and agreed to the published version of the manuscript.

Funding

This research was supported by the Ministry of Education and Science of the Russian Federation, project no. AAAA-A19-119071190044-3.

Institutional Review Board Statement

Not applicable.

Data Availability Statement

Not applicable.

Acknowledgments

NMR measurements were performed using equipment from the Multi-User Analytical Center of the Federal Research Center of Problems of Chemical Physics and Medicinal Chemistry RAS and Science Center in Chernogolovka RAS with the support of State Assignment of the Federal Research Center of Problems of Chemical Physics and Medicinal Chemistry RAS (state registration No 0089-2019-0010/AAAA-A19-119071190044-3).

Conflicts of Interest

The authors declare no conflict of interest.

References

  1. Stenina, I.A.; Yaroslavtsev, A.B. Ionic Mobility in Ion-Exchange Membranes. Membranes 2021, 11, 198. [Google Scholar] [CrossRef]
  2. Yaroslavtsev, A.B.; Stenina, I.A. Current progress in membranes for fuel cells and reverse electrodialysis. Mendeleev. Commun. 2021, 31, 423–432. [Google Scholar] [CrossRef]
  3. Fechete, R.; Demco, D.E.; Zhu, X.; Tillmann, W.; Möller, M. Water states and dynamics in perfluorinated ionomer membranes by 1H one- and two-dimensional NMR spectroscopy, relaxometry, and diffusometry. Chem. Phys. Lett. 2014, 597, 6–15. [Google Scholar] [CrossRef]
  4. Volkov, V.I.; Chernyak, A.V.; Gnezdilov, O.I.; Skirda, V.D. Hydration, self-diffusion and ionic conductivity of Li+, Na+ and Cs+ cations in Nafion membrane studied by NMR. Solid State Ion. 2021, 364, 115627. [Google Scholar] [CrossRef]
  5. Volkov, V.I.; Chernyak, A.V.; Avilova, I.A.; Slesarenko, N.A.; Melnikova, D.L.; Skirda, V.D. Molecular and Ionic Diffusion in Ion Exchange Membranes and Biological Systems (Cells and Proteins) Studied by NMR. Membranes 2021, 11, 385. [Google Scholar] [CrossRef]
  6. Volkov, V.I.; Marinin, A.A. NMR methods for studying ion and molecular transport in polymer electrolytes. Russ. Chem. Rev. 2013, 82, 248–272. [Google Scholar] [CrossRef]
  7. Iwamoto, R.; Oguro, K.; Sato, M.; Iseki, Y. Water in perfluorinated, sulfonic acid Nafion membranes. J. Phys. Chem. B 2002, 106, 6973–6979. [Google Scholar] [CrossRef]
  8. Maldonado, L.; Perrin, J.-C.; Dillet, J.; Lottin, O. Characterization of polymer electrolyte Nafion membranes: Influence of temperature, heat treatment and drying protocol on sorption and transport properties. J. Membr. Sci. 2012, 389, 43–56. [Google Scholar] [CrossRef]
  9. Ma, Z.; Jiang, R.; Myers, M.E.; Thompson, E.L.; Gittleman, C.S. NMR studies of proton transport in fuel cell membranes at sub-freezing conditions. J. Mater. Chem. 2011, 21, 9302. [Google Scholar] [CrossRef]
  10. Guillermo, A.; Gebel, G.; Mendil-Jakani, H.; Pinton, E. NMR and pulsed field gradient NMR approach of water sorption properties in Nafion at low temperature. J. Phys. Chem. B 2009, 113, 6710–6717. [Google Scholar] [CrossRef]
  11. Chernyak, A.V.; Vasiliev, S.G.; Avilova, I.A.; Volkov, V.I. Hydration and Water Molecules Mobility in Acid Form of Nafion Membrane Studied by 1H NMR Techniques. Appl. Magn. Reson. 2019, 50, 677–693. [Google Scholar] [CrossRef]
  12. Hammer, R.; Scho, M.; Hansen, M.R. Comprehensive Picture of Water Dynamics in Nafion Membranes at Different Levels of Hydration. J. Phys. Chem. B. 2019, 123, 8313–8324. [Google Scholar] [CrossRef] [PubMed]
  13. Volkov, V.I.; Chernyak, A.V.; Slesarenko, N.A.; Avilova, I.A. Ion and Molecular Transport in Solid Electrolytes Studied by NMR. Int. J. Mol. Sci. 2022, 23, 5011. [Google Scholar] [CrossRef]
  14. Kusoglu, A.; Weber, A.Z. New Insights into Perfluorinated Sulfonic-Acid Ionomers. Chem. Rev. 2017, 117, 987–1104. [Google Scholar] [CrossRef] [PubMed]
  15. Zhao, Q.; Majsztrik, P.; Benziger, J. Diffusion and Interfacial Transport of Water in Nafion. J. Phys. Chem. B 2011, 115, 2717–2727. [Google Scholar] [CrossRef] [PubMed]
  16. Nicotera, I.; Coppola, L.; Rossi, C.O.; Youssry, M.; Ranieri, G.A. NMR Investigation of the Dynamics of Confined Water in Nafion-Based Electrolyte Membranes at Subfreezing Temperatures. J. Phys. Chem. B 2009, 113, 13935–13941. [Google Scholar] [CrossRef]
  17. Moster, A.L.; Mitchell, B.S. Hydration and Proton Conduction in Nafion/Ceramic Nanocomposite Membranes Produced by Solid-State Processing of Powders from Mechanical Attrition. Appl. Polym. Sci. 2009, 113, 243. [Google Scholar] [CrossRef]
  18. Thompson, E.L.; Capehart, T.W.; Fuller, T.J.; Jorne, J. Investigation of Low-Temperature Proton Transport in Nafion Using Direct Current Conductivity and Differential Scanning Calorimetry. J. Electrochem. Soc. 2006, 153, A2351–A2362. [Google Scholar] [CrossRef]
  19. Slesarenko, N.A.; Chernyak, A.V.; Avilova, I.A.; Zabrodin, V.A.; Volkov, V.I. Mobility of water molecules in Li+, Na+ and Cs+ ionic forms of Nafion membrane studied by NMR. Mendeleev. Commun. 2022, 32, 534. [Google Scholar] [CrossRef]
  20. Slesarenko, N.A.; Chernyak, A.V.; Avilova, I.A.; Tarasov, V.P.; Volkov, V.I. Mobility of Li+, Na+, and Cs+ cations in Nafion membrane, as studied by NMR techniques. Mendeleev. Commun. 2023, 33, 215–217. [Google Scholar] [CrossRef]
  21. Nesterov, I.A.; Volkov, V.I.; Pukhov, K.K.; Timashev, S.F. Magnetic-relaxation of 7Li+ nuclei and dynamics of movements of lithium counter-ions and water-molecules in perfluorinated sulfocationite membranes. Russ. J. Chem. Phys. 1990, 10, 1155–1162. [Google Scholar]
  22. Volkov, V.I.; Sidorenkova, E.A.; Timashev, S.F.; Lakeev, S.G. State and diffusive mobility of water in perfluorinated sulfocationite membranes according to proton magnetic resonance data. Russ. J. Phys. Chem. 1993, 67, 914–918. [Google Scholar]
  23. Volkov, V.I.; Vasilyak, S.L.; Park, I.-W.; Kim, H.J.; Ju, H.; Volkov, E.V.; Choh, S.H. Water Behavior in Perfluorinated Ion-Exchange Membranes. Appl. Magn. Reson. 2003, 25, 43–53. [Google Scholar] [CrossRef]
  24. Volkov, V.I.; Nesterov, I.A.; Sundukov, V.I.; Kropotov, L.V.; Timashev, S.F. The diffusion transfer of water in perfluorinated sulfocation exchange membranes as studied by pulse NMR. Russ. J. Chem. Phys. 1989, 8, 209. [Google Scholar]
  25. Volkov, V.I.; Slesarenko, N.A.; Chernyak, A.V.; Zabrodin, V.A.; Golubenko, D.V.; Tverskoy, V.A.; Yaroslavtsev, A.B. Mobility of Li+, Na+, Cs+ Cations in Sulfocation-Exchange Membranes Based on Polyethylene and Grafted Sulfonated Polystyrene Studied by NMR Relaxation. Membr. Membr. Technol. 2022, 4, 189. [Google Scholar] [CrossRef]
  26. Volkov, V.I.; Chernyak, A.V.; Golubenko, D.V.; Tverskoy, V.A.; Lochin, G.A.; Odjigaeva, E.S.; Yaroslavtsev, A.B. Hydration and diffusion of H+, Li+, Na+, Cs+ ions in cation-exchange membranes based on polyethylene and sulfonated-grafted polystyrene studied by NMR technique and ionic conductivity measurements. Membranes 2020, 10, 272. [Google Scholar] [CrossRef]
  27. Halle, B.; Bratko, D.; Piculell, L. Interpretetion of Counterion Spin Relaxation in Polyelectrolyte Solutions. II. Effects of Finite Polyion Lenght. Ber. Bunsenges. Phys. Chem. 1985, 89, 1254–1260. [Google Scholar] [CrossRef]
  28. Halle, B.; Wennerstrom, H.; Piculell, L. Interpretation of Counterion Spin Relaxation in Polyelectrolyte Solutions. J. Phys. Chem. 1984, 88, 2482–2494. [Google Scholar] [CrossRef]
  29. Tromp, R.H.; Van der Maarel, J.R.C.; De Bleijser, J.; Leyte, J.C. Counter-ion dynamics in crosslinked poly( styrene sulfonate) systems studied by NMR. Biophys. Chem. 1991, 41, 81–100. [Google Scholar] [CrossRef]
  30. Bohme, U.; Hanel, B.; Scheler, U. Influence of the Counterions on the Behaviour of Polyelectrolytes. Progr. Colloid Polym. Sci. 2011, 138, 45–48. [Google Scholar] [CrossRef]
  31. Volkov, V.I.; Chernyak, A.V.; Golubenko, D.V.; Shevlyakova, N.V.; Tverskoy, V.A.; Yaroslavtsev, A.B. Mobility of cations and water molecules in sulfocation-exchange membranes based on polyethylene and sulfonated grafted polystyrene. Membr. Membr. Technol. 2020, 1, 54–62. [Google Scholar] [CrossRef]
  32. Simari, C.; Prejan, M.; Lufrano, E.; Sicilia, E.; Nicotera, I. Exploring the Structure–Performance Relationship of Sulfonated Polysulfone Proton Exchange Membrane by a Combined Computational and Experimental Approach. Polymers 2021, 13, 959. [Google Scholar] [CrossRef] [PubMed]
Figure 1. Temperature dependence of water molecule 1H nuclear chemical shift in Li+(1), Na+(2) and Cs+(3) ionic forms of MSC membrane and Li+(4), Na+(5) and Cs+(6) ionic forms of Nafion 117 membrane at RH = 95%. Evolution of 1H (water molecules) spectra with temperature variation in Cs+ Nafion ionic form is shown in insertion.
Membranes 13 00518 g001
Figure 2. Temperature dependences of 1H spin–lattice T1 and spin–spin T2 relaxation times of water molecules in Li+ (a), Na+ (b) and Cs+ (c) ionic forms in Nafion 117 membrane at different RH. Dotted lines are Gaussian functions.
Membranes 13 00518 g002aMembranes 13 00518 g002b
Figure 3. Temperature dependences of 7Li, 23Na and 133Cs nuclei spin–lattice T1 relaxation times in Nafion at RH (a) 32%, (b) 65%, (c) 86%, (d) 95% and (e) 98% [20]. Dotted lines are Gaussian function approximation.
Membranes 13 00518 g003
Figure 4. Structure of the amorphous part of a perfluorinated sulfonate cation-exchange membrane [6]. (1) Polymer backbone; (2) hydrated counter-ions and functional groups at a low moisture content; (3) transport channels for ions and water molecules at a high moisture content; L1 = 4 nm according to low-angle X-ray scattering data; L2 = 10 nm according to Mössbauer spectroscopy; l1 = l2 = 1 nm according to ENDOR and relaxation NMR data; l3 = 1.5 nm according to standard porosimetry and ENDOR methods.
Membranes 13 00518 g004
Figure 5. Fragments of ionogenic nanochannels in Li+ and Cs+ ionic forms of Nafion membranes.
Membranes 13 00518 g005
Figure 6. Temperature dependences of the spin–lattice relaxation times T1 of 7Li, 23Na and 133Cs nuclei in appropriate ionic forms of MSC membranes. Dashed curves are Lorentzian functions.
Membranes 13 00518 g006
Figure 7. Scheme of the structure of the system of pores with different sulfo group density connected by channels in MSC membranes. (1) Polymer backbone; (2) water channels; (3) SO3 group; (4) Li+, Na+ and Cs+ cations; designed on the basis of MSC nanostructure given in [25].
Membranes 13 00518 g007
Table 1. Water content λs and hydration number h of Li+, Na+ and Cs+ cations in Nafion and MSC membranes at RH = 98% and in equimolar aqueous salt chloride solutions.
Nafion [4]MSC [26]Aqueous Chloride Solutions [13]
Ionic FormLi+Na+Cs+Li+Na+Cs+Li+Na+Cs+
λs, [H2O]/[SO3]
or concentration
1210313.810.38.1Equi-
molar to MSC
Equi-
molar to MSC
Equi-
molar to MSC
h5.0 ± 1.06.0 ± 1.01.0 ± 0.24.1 ± 1.05.0 ± 1.03.1 ± 1.044.63.9
Table 2. Water self-diffusion coefficients measured using PFG NMR (Ds) at conditions of minimum T1 for Li+, Na+ and Cs+ Nafion membrane ionic forms at different RH. The variable l is the water molecule proton jumping length calculated from the Einstein relation.
Ionic FormLi+Na+Cs+
RH, %658695658695658695
T1min (T), °C0302210−20−3040−1022.6
Ds at T1min (T), m2/s (10−11)3.010.030.00.922.03.70.70.291.1
l, nm0.20.280.320.10.150.210.10.10.11
Table 3. Li+ and Cs+ cation jumping length l in Nafion membranes at different humidity.
Ionic FormLi+Cs+
λs, [H2O]/[SO3] [4]5.78.910.74
T1min (T), °C−20−30−3020.2
Ds at T1min (T), m2/s (10−12)4.54.76.530.0
l, nm0.150.150.180.7
Table 4. Self-diffusion coefficients of cations at 293 K calculated from the Einstein relation on the basis of NMR relaxation data (DR). Self-diffusion coefficients DPFG measured using PFG NMR. Ionic conductivities (σexp) measured using impedance spectroscopy and calculated (σcalc) from the Nernst–Einstein relation on the basis of self-diffusion coefficients of Li+, Na+ and Cs+ cations in a Nafion membrane.
Ionic FormDPFG, m2/s [4]DR, m2/sσexp, S/m [4]σcalc, S/m [4]
Li+(1.5 ± 0.1) × 10−10(1.0 ± 0.1) × 10−101.3 ± 0.11.6 ± 0.1
Na+(2.0 ± 0.3) × 10−10(0.8 ± 0.1) × 10−101.1 ± 0.12.0 ± 0.3
Cs+(0.6 ± 0.2) × 10−10(0.34 ± 0.1) × 10−10(2.3 ± 0.3) × 10−1(6.0 ± 0.2) × 10−1
Table 5. Self-diffusion coefficients at 293 K calculated on the basis of the Einstein equation from the NMR relaxation data (DR), experimental self-diffusion coefficients measured using pulsed magnetic field gradient NMR (DPFG), ionic conductivity measured using impedance spectroscopy (σexp) and calculated (σcalc) on the basis of the Nernst–Einstein relation from the self-diffusion coefficients of Li+, Na+ and Cs+ cations in a MSC membrane [25].
Ionic FormDPFG, m2/s [25]DR, m2/s [25]σexp, S/mσcalc, S/m
Li+5.0 × 10−103.8 × 10−102.7 × 10−15.3
Na+5.0 × 10−105.5 × 10−103.0 × 10−15.0
Cs+9.0 × 10−101.5 × 10−108.0 × 10−19.0
Disclaimer/Publisher’s Note: The statements, opinions and data contained in all publications are solely those of the individual author(s) and contributor(s) and not of MDPI and/or the editor(s). MDPI and/or the editor(s) disclaim responsibility for any injury to people or property resulting from any ideas, methods, instructions or products referred to in the content.

