3.2. Identifying Critical Process Parameters for the Scaling Up of SXC
SXC has so far only been performed at small scales using axial membrane devices with a diameter of up to 25 mm. By increasing the membrane surface area four-fold (MA100 module), we aimed to identify critical process parameters for successful scaling up of the purification of lentiviral vectors via SXC. Previous research with a small-scale MA15 device determined 12.5% PEG 4000 as an ideal buffer for the purification of LVs with SXC [
10]. Therefore, this buffer composition was used and not further modified in the following experiments. In the same study using the MA15, an optimal flow rate of 6–7 mL·min
−1 (tested flow rate range 3–9 mL·min
−1) was identified, achieving infectious LV recovery above 80%. In a first attempt, we tested flow rates between 3–9 mL·min
−1 using the MA100 device and an LV batch with a titer of 1.25 × 10
7 TU·mL
−1.
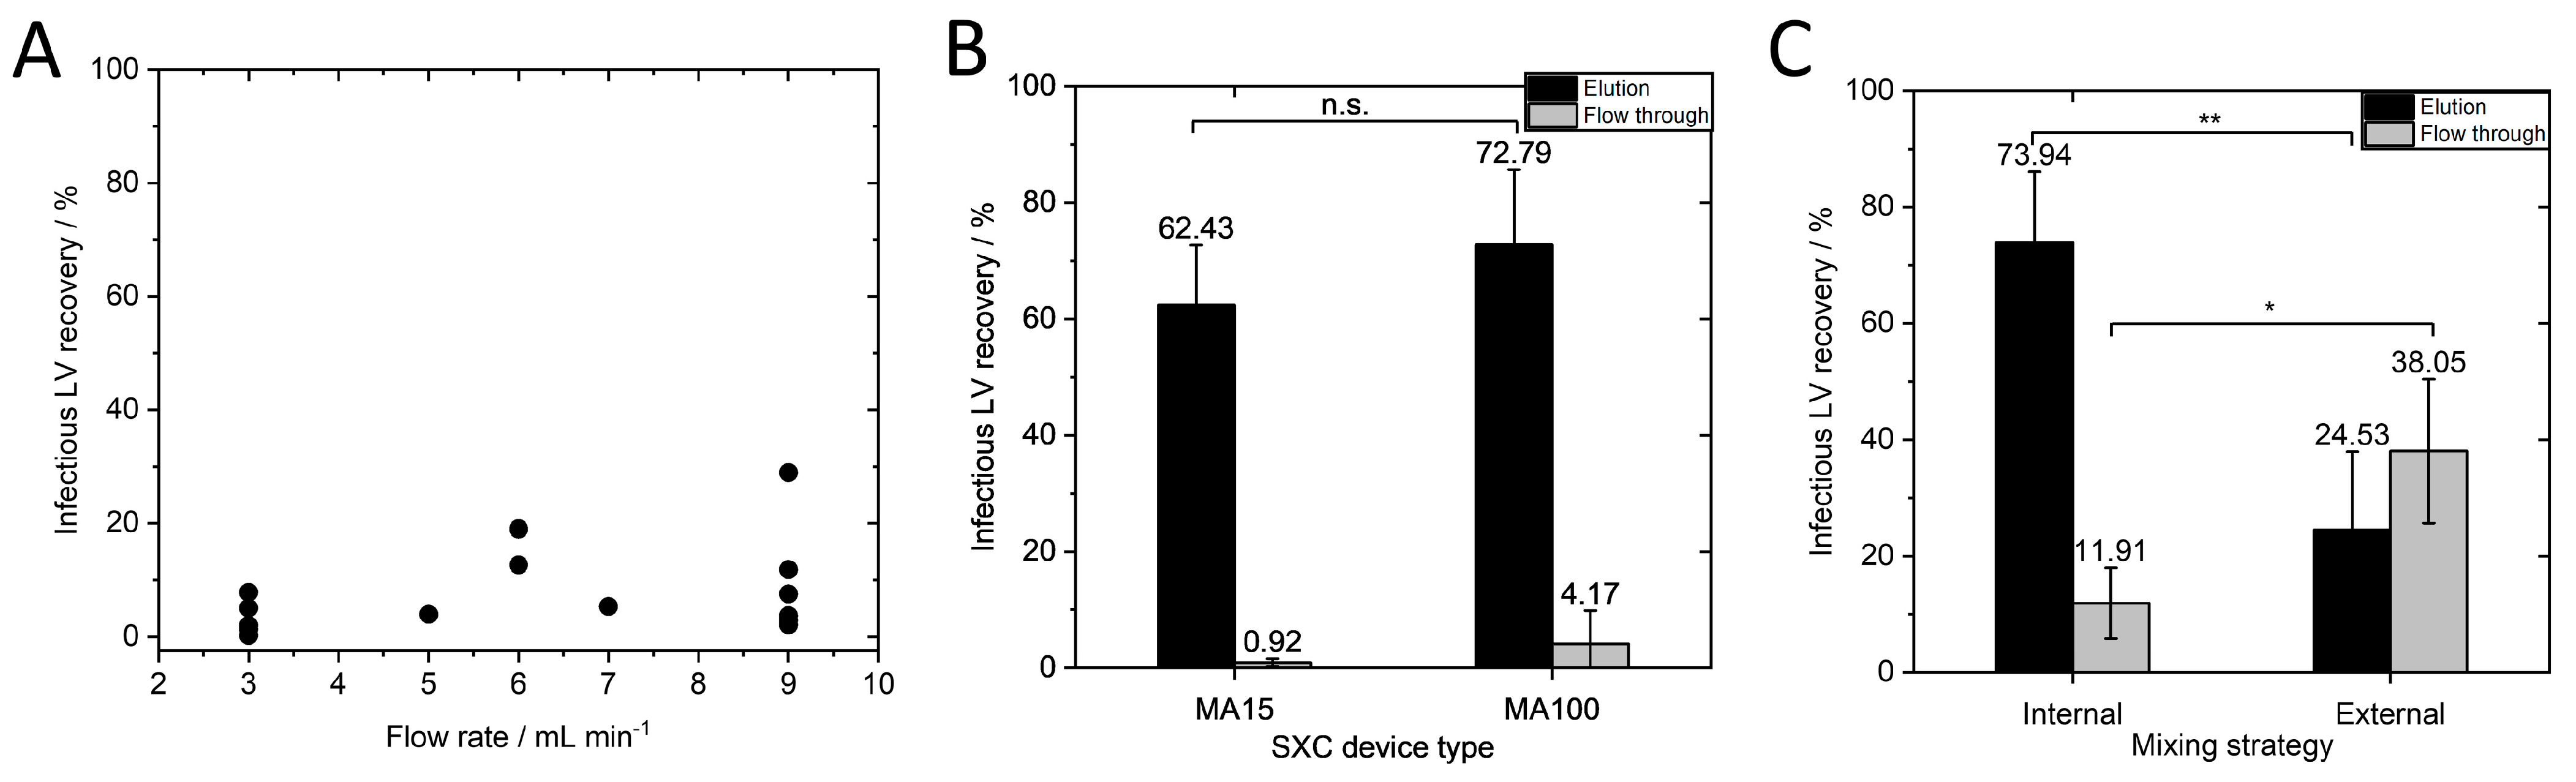
Figure 3A shows that lower than expected infectious LV recoveries were observed. We concluded that the optimal flow rate for the MA100 device is not within this range.
For membrane chromatography, the flow rate is typically given in membrane volumes per minute. As discussed in
Section 3.1, scaling up by only increasing the membrane volume but not the surface area of the first membrane does not seem to be useful with respect to the surface-oriented capture of the vector particles. Thus, specification of the flow rate per membrane surface area (of one layer) would be more reasonable than flow rate per membrane volume. For this reason, we did not scale flow rate with membrane volume as a first attempt. It was shown in a previous study that scaling the flow rate according to membrane volume is not necessary for axial devices with the same diameter [
10]. In the aforementioned study, MA15 devices with 5 and 10 membrane layers achieved LV recoveries that were not significantly different when applying the same flow rate of 7 mL·min
−1, which is the same surface area-dependent flow rate of 1.43 mL·min
−1·cm
−2. It should be noted that scaling with the surface-area dependent flow rate was still unknown and not discussed in the previous study, as no different device sizes were tested. This parameter is investigated in our study for the first time. However, 7 mL·min
−1 was half the flow rate in membrane volumes per minute for the 10-layer unit compared to the 5-layer unit (6.2 MV·min
−1 for the 10-layer MA15 and 12.4 MV·min
−1 for the 5-layer MA15). If flow rate had to be scaled with membrane volume, this would have been noticed in the experiment, and the non-significant differences indicated that this was not necessary. For this reason, the flow rates for the MA100 device were not adjusted according to membrane volume, though the same volumetric flow rates were used since an adjustment based on the membrane area of the first layer was only considered in the next step. Given the dynamic depletion flocculation process of SXC, we hypothesized that the flow rate is dependent on the surface area of one membrane layer. The previously determined optimal flow rate of 7 mL·min
−1 for the MA15 device corresponds to a surface area-dependent flow rate of 1.43 mL·min
−1·cm
−2. We aimed to apply the same surface area-dependent flow rate for the MA100 device. As the membrane surface area of one layer is four times larger, a flow rate of 1.43 mL·min
−1·cm
−2 for the MA100 device corresponds to 28 mL·min
−1.
However, the pressure limit was reached when applying 28 mL·min
−1 with the viscous PEG buffer. The UV cell and fractionator of the chromatography system contribute to the pressure. To circumvent this technical limitation, we opened the chromatography system after the column position and fractionated manually. This adjustment allowed us to apply a flow rate of 1.43 mL·min
−1·cm
−2 (28 mL·min
−1) for the MA100 device. We performed SXC runs with an LV batch with a titer of 1.73 × 10
7 TU·mL
−1 at 1.43 mL·min
−1·cm
−2 with the MA15 and MA100 device and detected no significant differences in infectious titer (
Figure 3B). The MA100 yielded an infectious LV recovery of 72.79 ± 12.92%. These results confirm our hypothesis that the flow rate must be scaled to the surface area of one membrane layer. The flow velocity through the stationary phase seems to be a decisive factor in purification success. When the same flow rate in mL·min
−1 is applied to the MA100 device, the same feed is distributed to a larger surface area and, thus, to a higher number of pores compared to the MA15 device. Since the average pore diameter remains unchanged, the flow velocity inside the pores decreases and falls below the optimal flow velocity inside the stationary phase to achieve efficient LV capture during loading and release during elution. Another possible explanation, recently discussed in [
13], is that a limited spontaneous encounter for the LV and the stationary phase could lead to a less efficient depletion interaction. In our case, a certain flow rate through the membrane pores might be necessary to increase the probability of an encounter between the LVs and the stationary phase.
Internal and external mixing of the LV solution with PEG buffer was performed for the MA100 SXC runs as was previously performed for the MA15 runs [
10]. Briefly, LV solution (titer of 1.64 × 10
7 TU·mL
−1) was mixed with PEG buffer in a flask with a magnetic stirrer. After 1 h of incubation at 4 °C, the sample was loaded onto the membrane (external mixing) or was loaded via pump A and pump B of the chromatography system and mixed in the dynamic mixer shortly before reaching the membrane device. Infectious LV recovery was significantly higher (
p ≤ 0.01) when internal mixing was performed (
Figure 3C) than when external mixing was performed (73.94 ± 12.13% and 24.53 ± 13.43%, respectively). These findings support the results of Labisch et al. and Eilts et al., in which the same effect was observed for other module sizes [
10,
13]. Moreover, a significantly higher amount of LVs (38.05 ± 12.37%) was lost in the flow through (
p ≤ 0.05) when LVs were loaded after external mixing. The external mixing of PEG buffer with the LV solution and incubation could have led to LV aggregation as depletion interaction can occur between LVs and the stationary phase during the SXC loading step, as well as between the viral particles themselves [
27]. Forming aggregates, the system’s free energy is already reduced, leading to a less effective depletion interaction between the LV and the membrane and loss in the flow through. These observations underline the highly dynamic nature of this chromatography method, as already observed by the importance of flow rate.
Total protein and dsDNA removal using the MA15 and MA100 devices at the same surface area-dependent flow rate of 1.43 mL·min
−1·cm
−2 was next investigated (
Figure 4). The total dsDNA and protein concentrations of the loading material and elution fractions are listed in
Table 2.
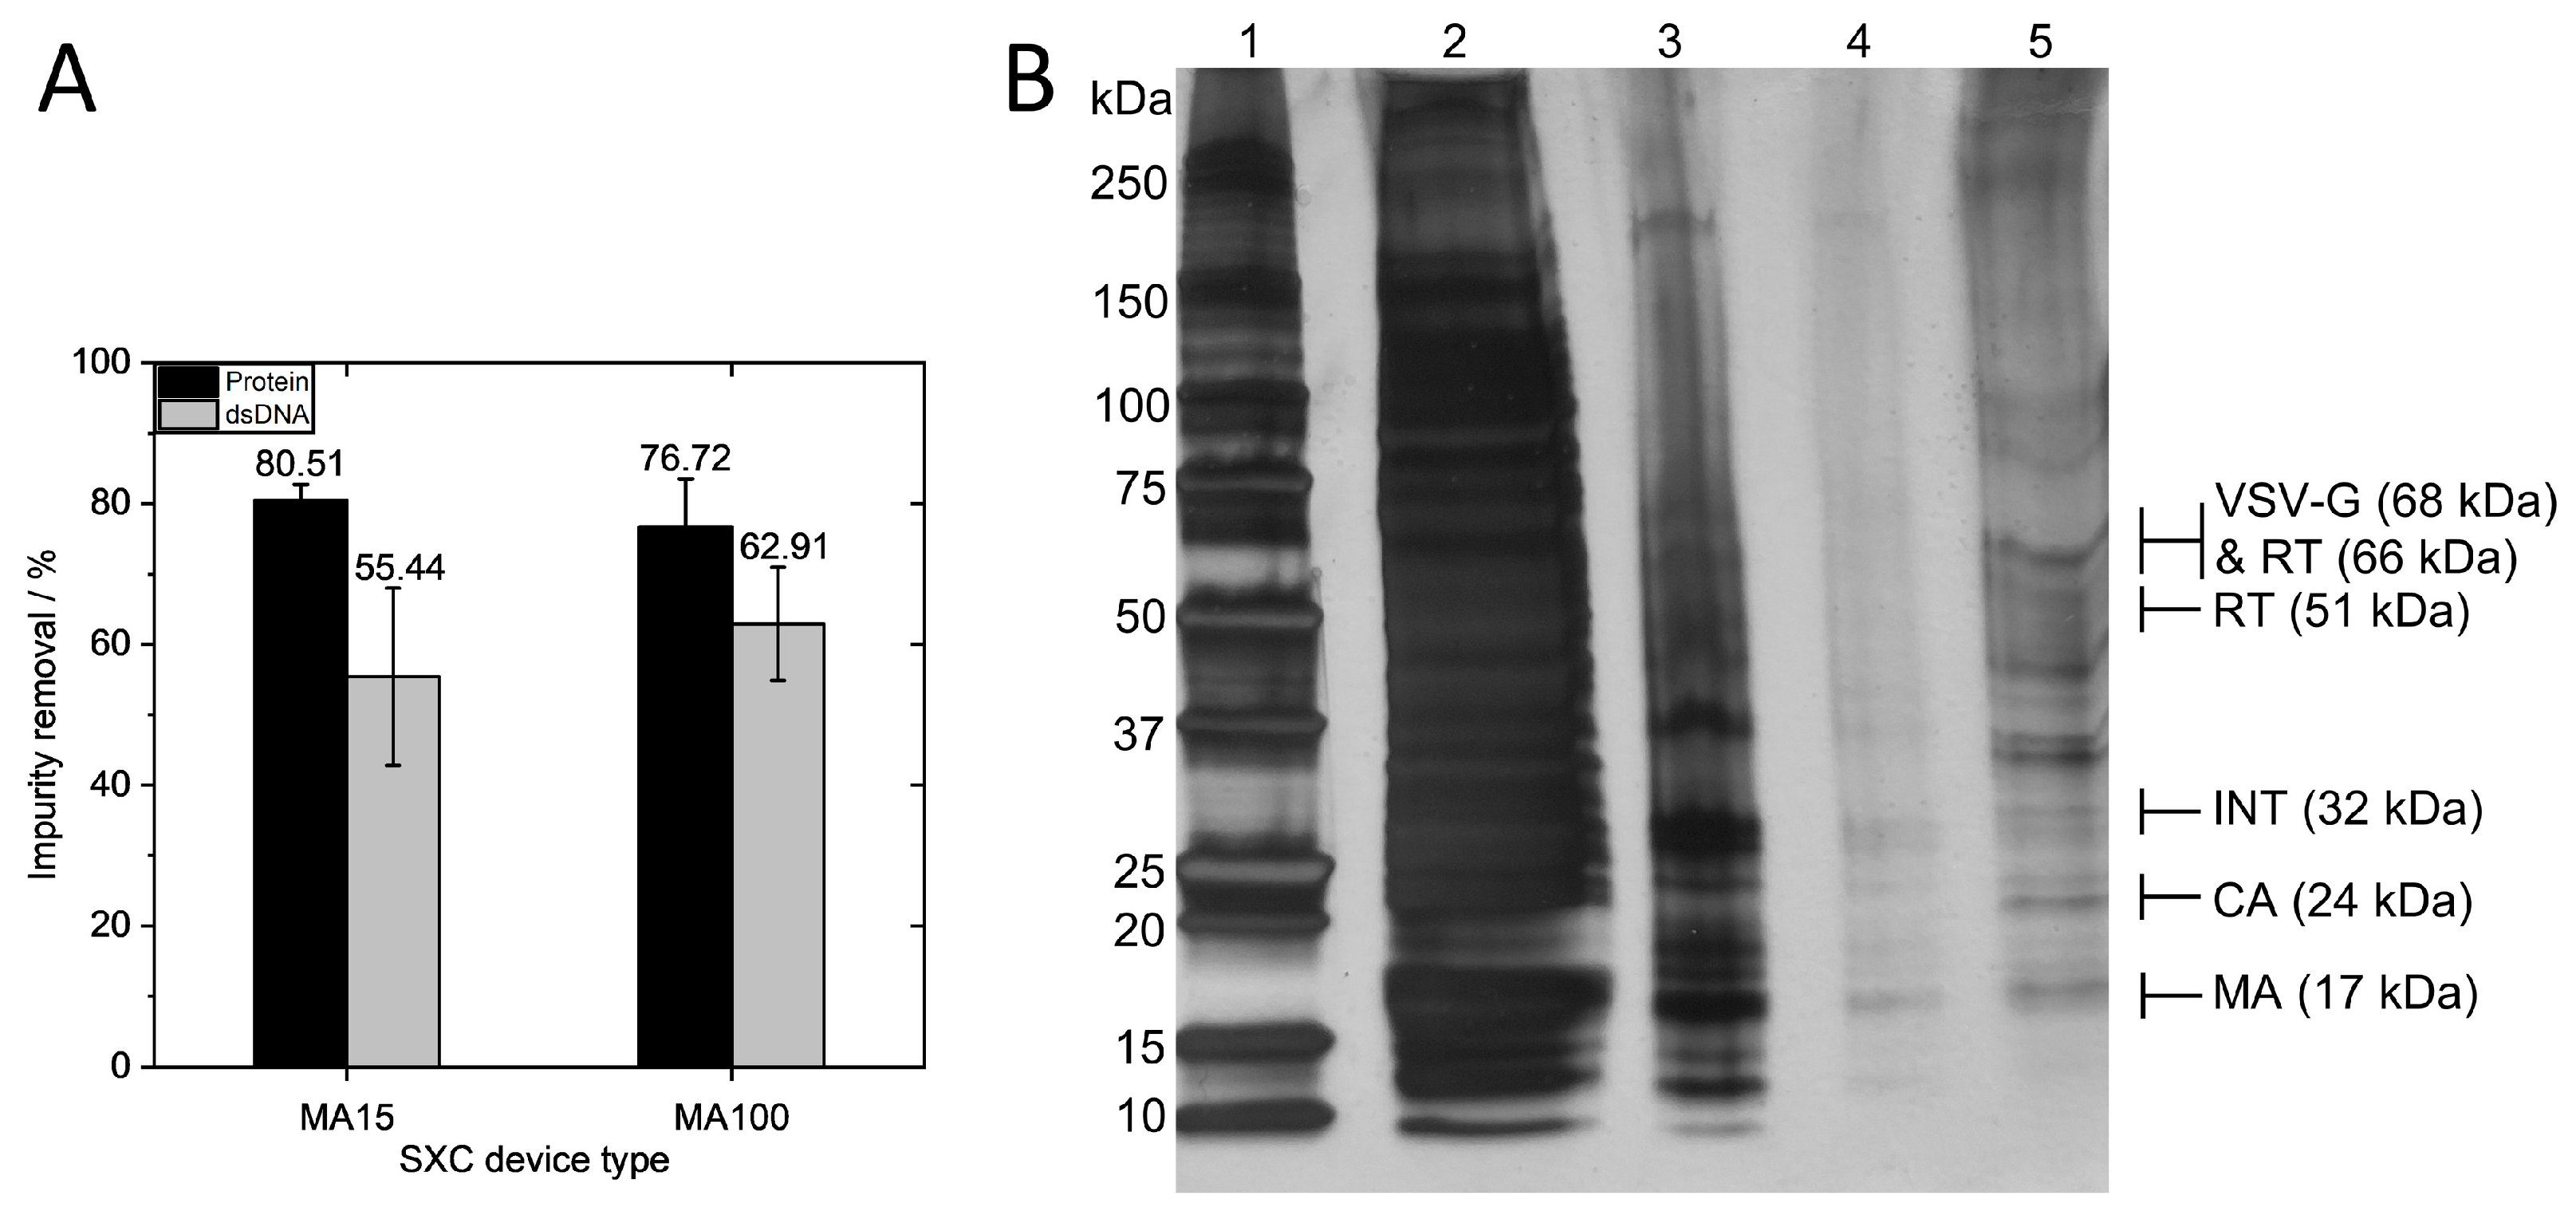
Overall, high removal of proteins was observed, with 80.51 ± 2.22% (0.7 log removal) for the MA15 device and 76.72 ± 6.81% (0.64 log removal) for the MA100 device. A silver-stained SDS-PAGE gel confirmed the measurement, showing a high amount of protein contaminants in the loading material and the removal of the majority of the protein impurities in the flow through (
Figure 4B). The elution fraction shows protein bands for the structural proteins of the lentiviral vector and little contaminating protein. Total dsDNA removal was 55.44 ± 12.58% (0.35 log removal) for the MA15 device and 62.91 ± 8.06% (0.43 log removal) for the MA100 device. These results demonstrate that comparable impurity removals are obtained for both device types. The effective removal of impurities derives from the pronounced size differences between the LV and the contaminating proteins and DNA, as discussed extensively elsewhere [
10].
Next, we tested different loading volumes ranging from 100 to 700 mL (corresponding to 50 to 350 mL LV solutions) on the MA100 device. The LV batch had a titer of 1.35 × 10
7 TU·mL
−1 and 1.14 × 10
10 VP·mL
−1. Previous SXC experiments with the MA100 were performed by loading 200 mL. Flow through and elution fractions of all runs were analyzed. No increase in the amount of LVs in the flow through was observed as the loading volume increased, which is exemplarily shown in
Figure 5A,D.
These findings are supported by captured images of HEK293T cells expressing no GFP after transduction with the flow through fractions (
Figure 5B). In contrast, HEK293T cells transduced with LVs from the elution fractions showed GFP expression (
Figure 5C). When a high LV amount was loaded (
Figure 5D), the elution of the captured LVs was hardly possible, resulting in a low recovery in the elution fraction. The highest LV recovery was achieved by loading around 200 mL (
Figure 5A). Therefore, we define a loading capacity of 1.35 × 10
9 TU and 1.14 × 10
12 VP. In contrast to conventional chromatography methods, SXC does not rely on a stationary phase having functional groups, and thus limited binding sites, which typically results in a breakthrough that is observed once all binding sites are occupied. During our SXC runs, no LV breakthrough was observed. Thus, membrane capacity for SXC cannot be defined at 10% LV breakthrough; instead, different loading volumes and the success of LV elution are analyzed to determine the loading capacity at which the LV recovery in the elution is satisfactory. In the previous experiments (
Figure 3B), 4.10 × 10
8 TU and 1.60 × 10
9 TU were loaded onto the MA100 and MA15 device, respectively, showing that approximately four times as many LVs could be loaded onto the MA100 device compared to the MA15 device. The loaded amount of LVs was lower than in the previous study, in which CAR-T-based LVs were used with a higher LV titer in the loading material [
10]. These differences in the upstream material are likely the reason for the different outcomes, and it might be necessary to determine the ideal loading volume for each target product separately. Another reason could be the uneven LV distribution on the membrane with the MA100 standard housing discussed in
Section 3.3, which might lead to the inefficient elution of overloaded membrane areas.
To further analyze the presented approach of scaling the flow rate according to the membrane surface area of the first layer, we performed scale-down experiments with an axial PP15 device for three different flow rates (N = 3 each) and a scale-up experiment with a radial 5′′ device for two different flow rates (N = 1 each). Additionally, further runs at different flow rates with the MA15 and MA100 modules were performed (N = 3) to complement the data.
According to the literature, this is the first study using a membrane capsule for SXC and includes the largest membrane module that has been used for this method to date, with a loaded LV volume of 0.98 L. Pressure limitation was often discussed as a potential hurdle for SXC scale-up. As previously reported, the viscous buffers result in higher pressure compared to conventional chromatography methods such as anion exchange chromatography, and pressure increases during loading have often been reported [
10,
22,
23]. We observed a pressure increase during the two scale-up runs with the 5′′ capsules of 0.4 to 0.8 bar (run 1) and 0.5 to 0.7 bar (run 2). As the pressure limit of the device is 4 bar, pressure was not a limiting factor during the scale-up runs under the tested conditions.
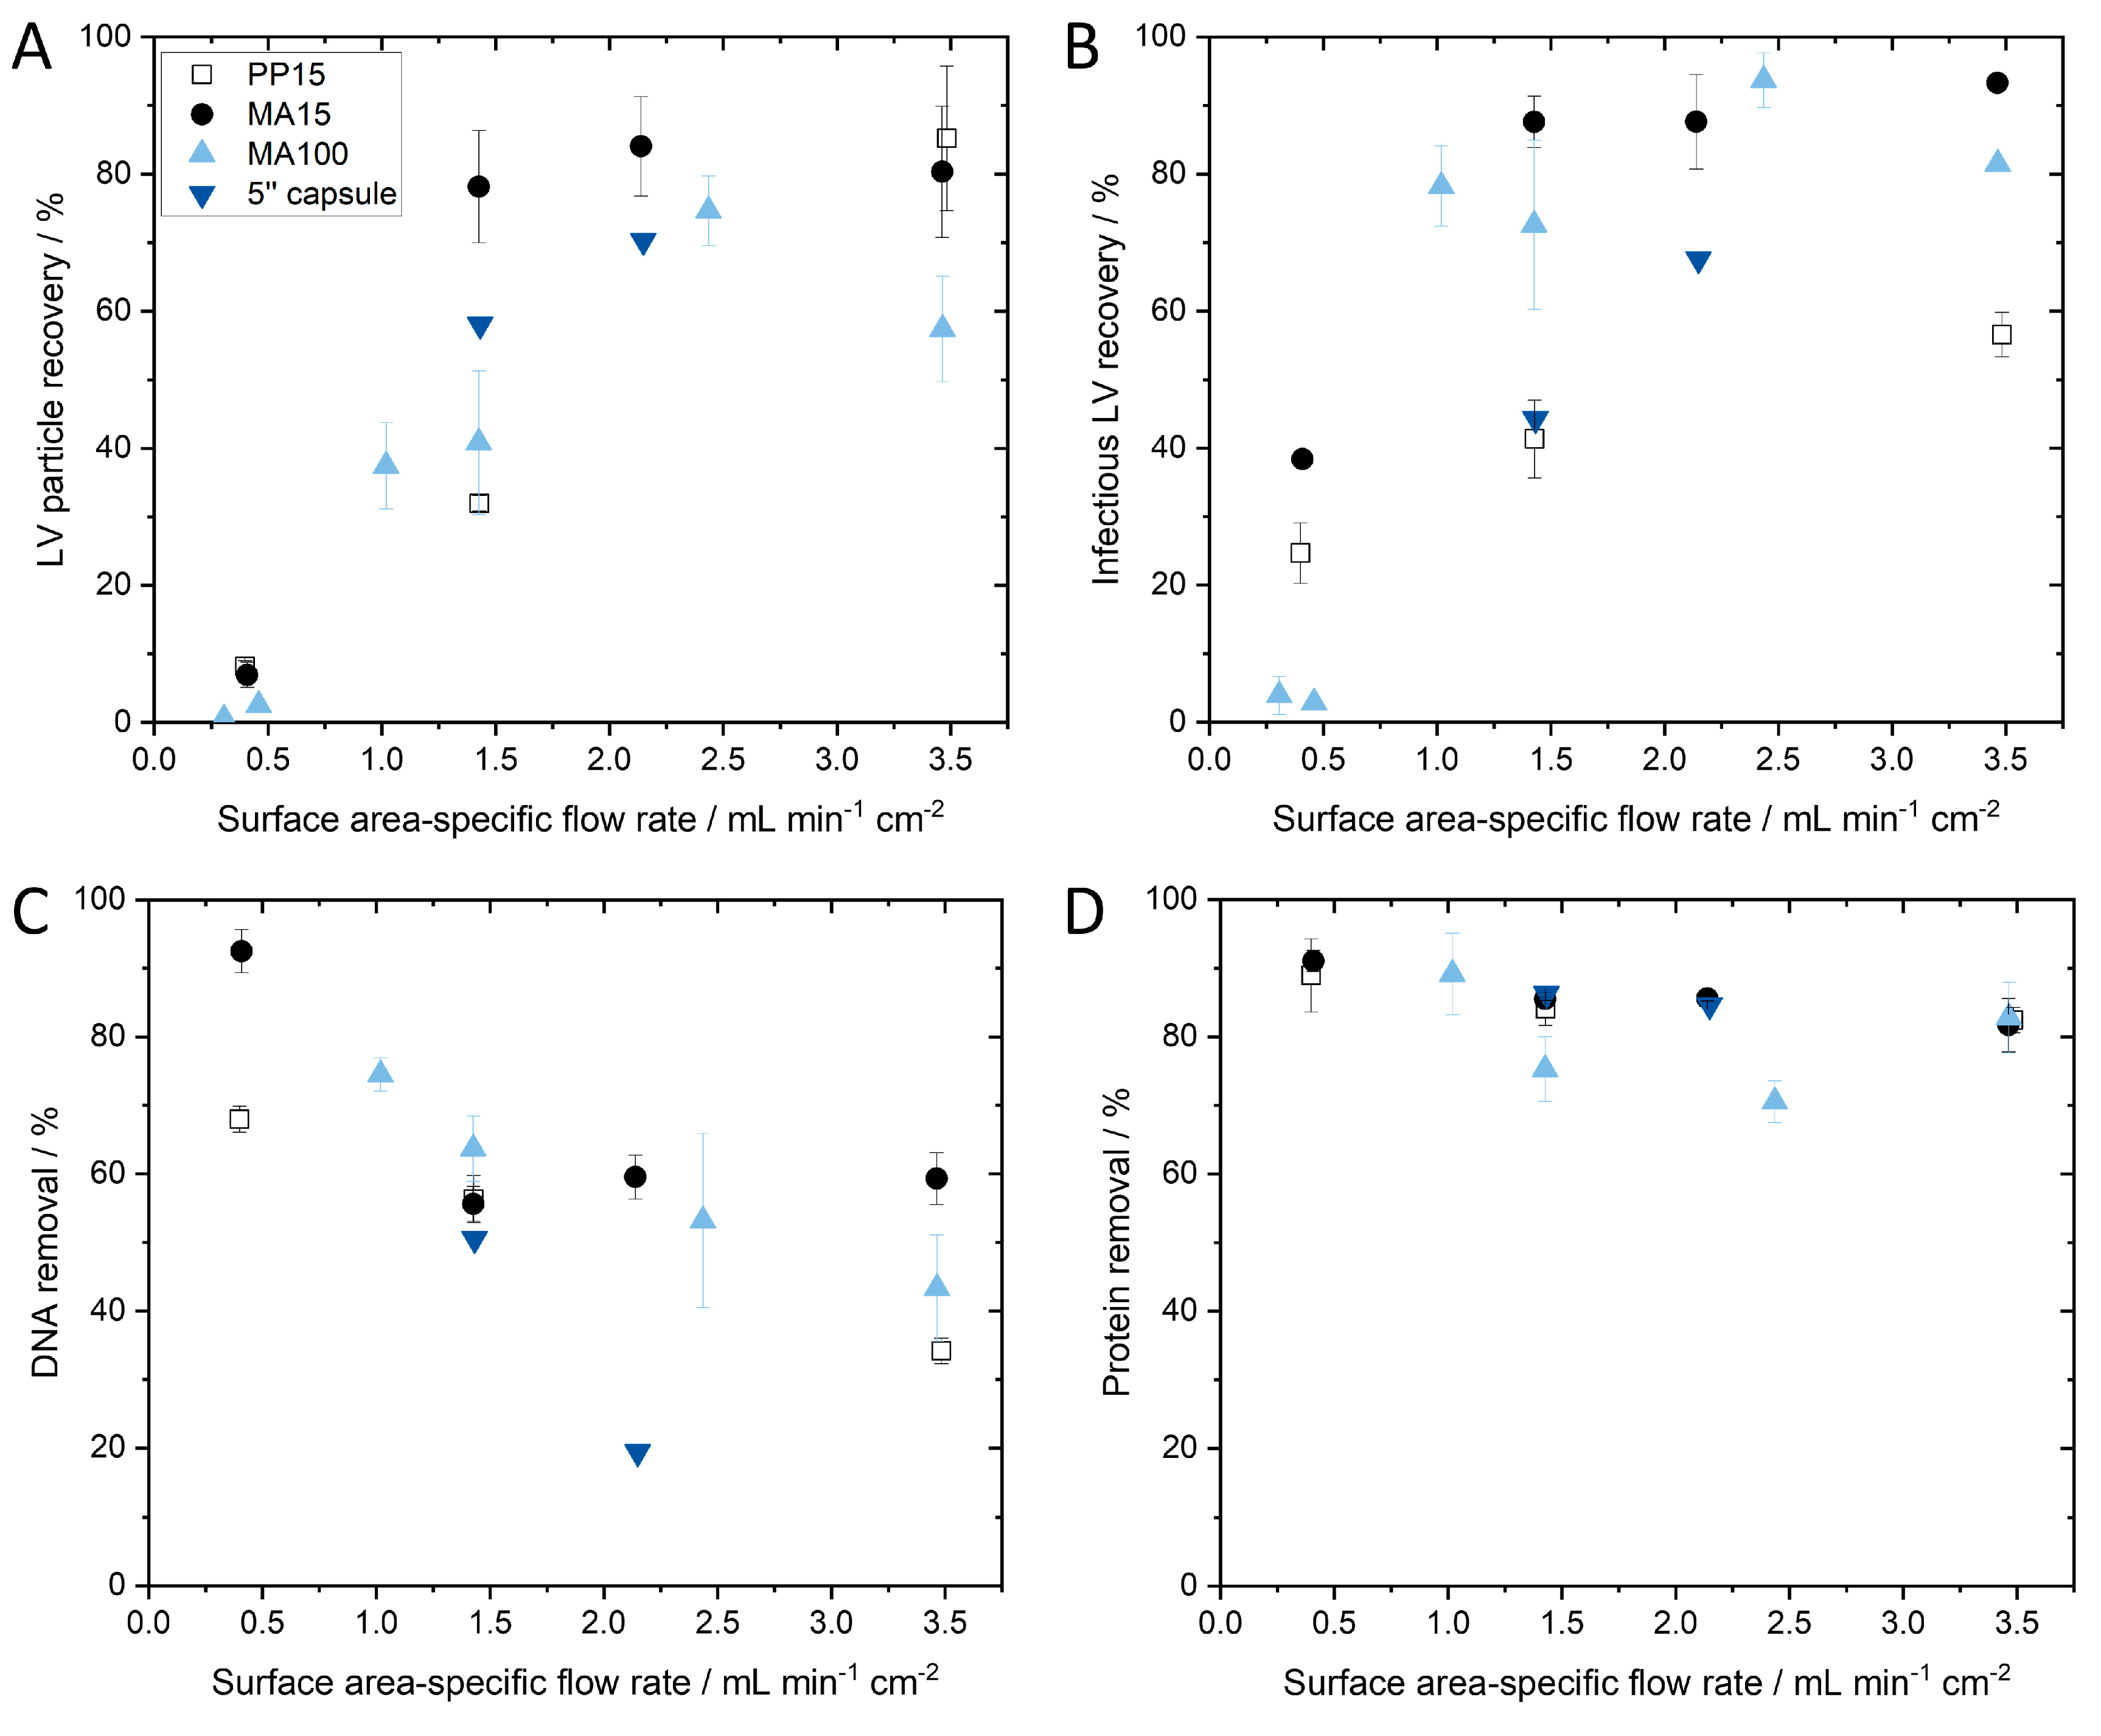
The infectious and particle recoveries and impurity removals for the four different device scales are shown in
Figure 6 and are plotted against different surface area-specific flow rates.
Plotting the infectious and particle titer recoveries of the tested device scales against different surface-area specific flow rates shows that if the flow rate falls under a critical minimum flow rate, then LV recovery decreases significantly (
Figure 6A,B). It appears that LV recovery asymptotically approaches a maximum. A decrease in LV recovery at flow rates above 3.5 mL·min
−1·cm
−2 is possible; however, there is a technically feasible limit due to the maximum flow rate of the system and the maximum pressure of the module. Further investigation is necessary to confirm this observation, but it is clear that a surface area-dependent flow rate that is too low significantly reduces LV recovery. In general, a surface area-dependent flow rate of approximately 1.4 mL·min
−1·cm
−2 or higher is necessary for successful scaling up of SXC. The reason why a critical minimum flow rate is necessary can be explained when considering the capture mechanism on the membrane. An association (capture) of the LVs on the membrane takes place when the depletion zones of the LVs and the membrane overlap. This occurs through random encounters between the LV and the membrane while passing through the membrane. When the flow rate is increased, the turbulence within the membrane increases as well, which in turn is expected to increase the likelihood of LVs encountering other LVs or the membrane for depletion interaction. We expect that the effect approaches a maximum probability of encounters that can be observed in an asymptotical trend.
When scaling the flow rate and loaded LV volume according to the membrane area of the chromatography module, the processing time for a complete chromatography run remains constant; thus, SXC runs with an MA15 or a 5′′ capsule both take approximately 20 min at 1.43 mL·min
−1·cm
−2. This short processing time is especially beneficial for fragile enveloped viruses and viral vectors and enables a fast and efficient DSP process. With the scaling approach of using a minimum surface-area dependent flow rate, we were able to achieve reproducible SXC LV recovery at four different module sizes. The highest LV volume purified by SXC was 980 mL, with a recovery of 68% representing an overall scaling factor of 98 compared to the smallest device (PP15) (
Table 1). dsDNA removal shows a decreasing trend with increasing surface area-specific flow rate (
Figure 6C). To achieve both high LV recovery and dsDNA removal, a surface area-specific flow rate between 1.4 and 2.5 mL·min
−1·cm
−2 is preferred, which subsequently achieves approximately 51% dsDNA removal. Protein removal was unaffected by flow rate and was consistent for the different module sizes, with a protein removal of about 84% (
Figure 6D). Good overall impurity removals were achieved and a subsequent ultrafiltration and diafiltration step will likely follow the DSP process to remove residual PEG and further increase the purity of the product.
3.3. Influence of the Design of the Membrane Housing on SXC Performance
After identifying critical process parameters for the scaling up of SXC, we investigated the impact of the design of the membrane housing of the MA100 module on LV capture in the membrane and SXC performance.
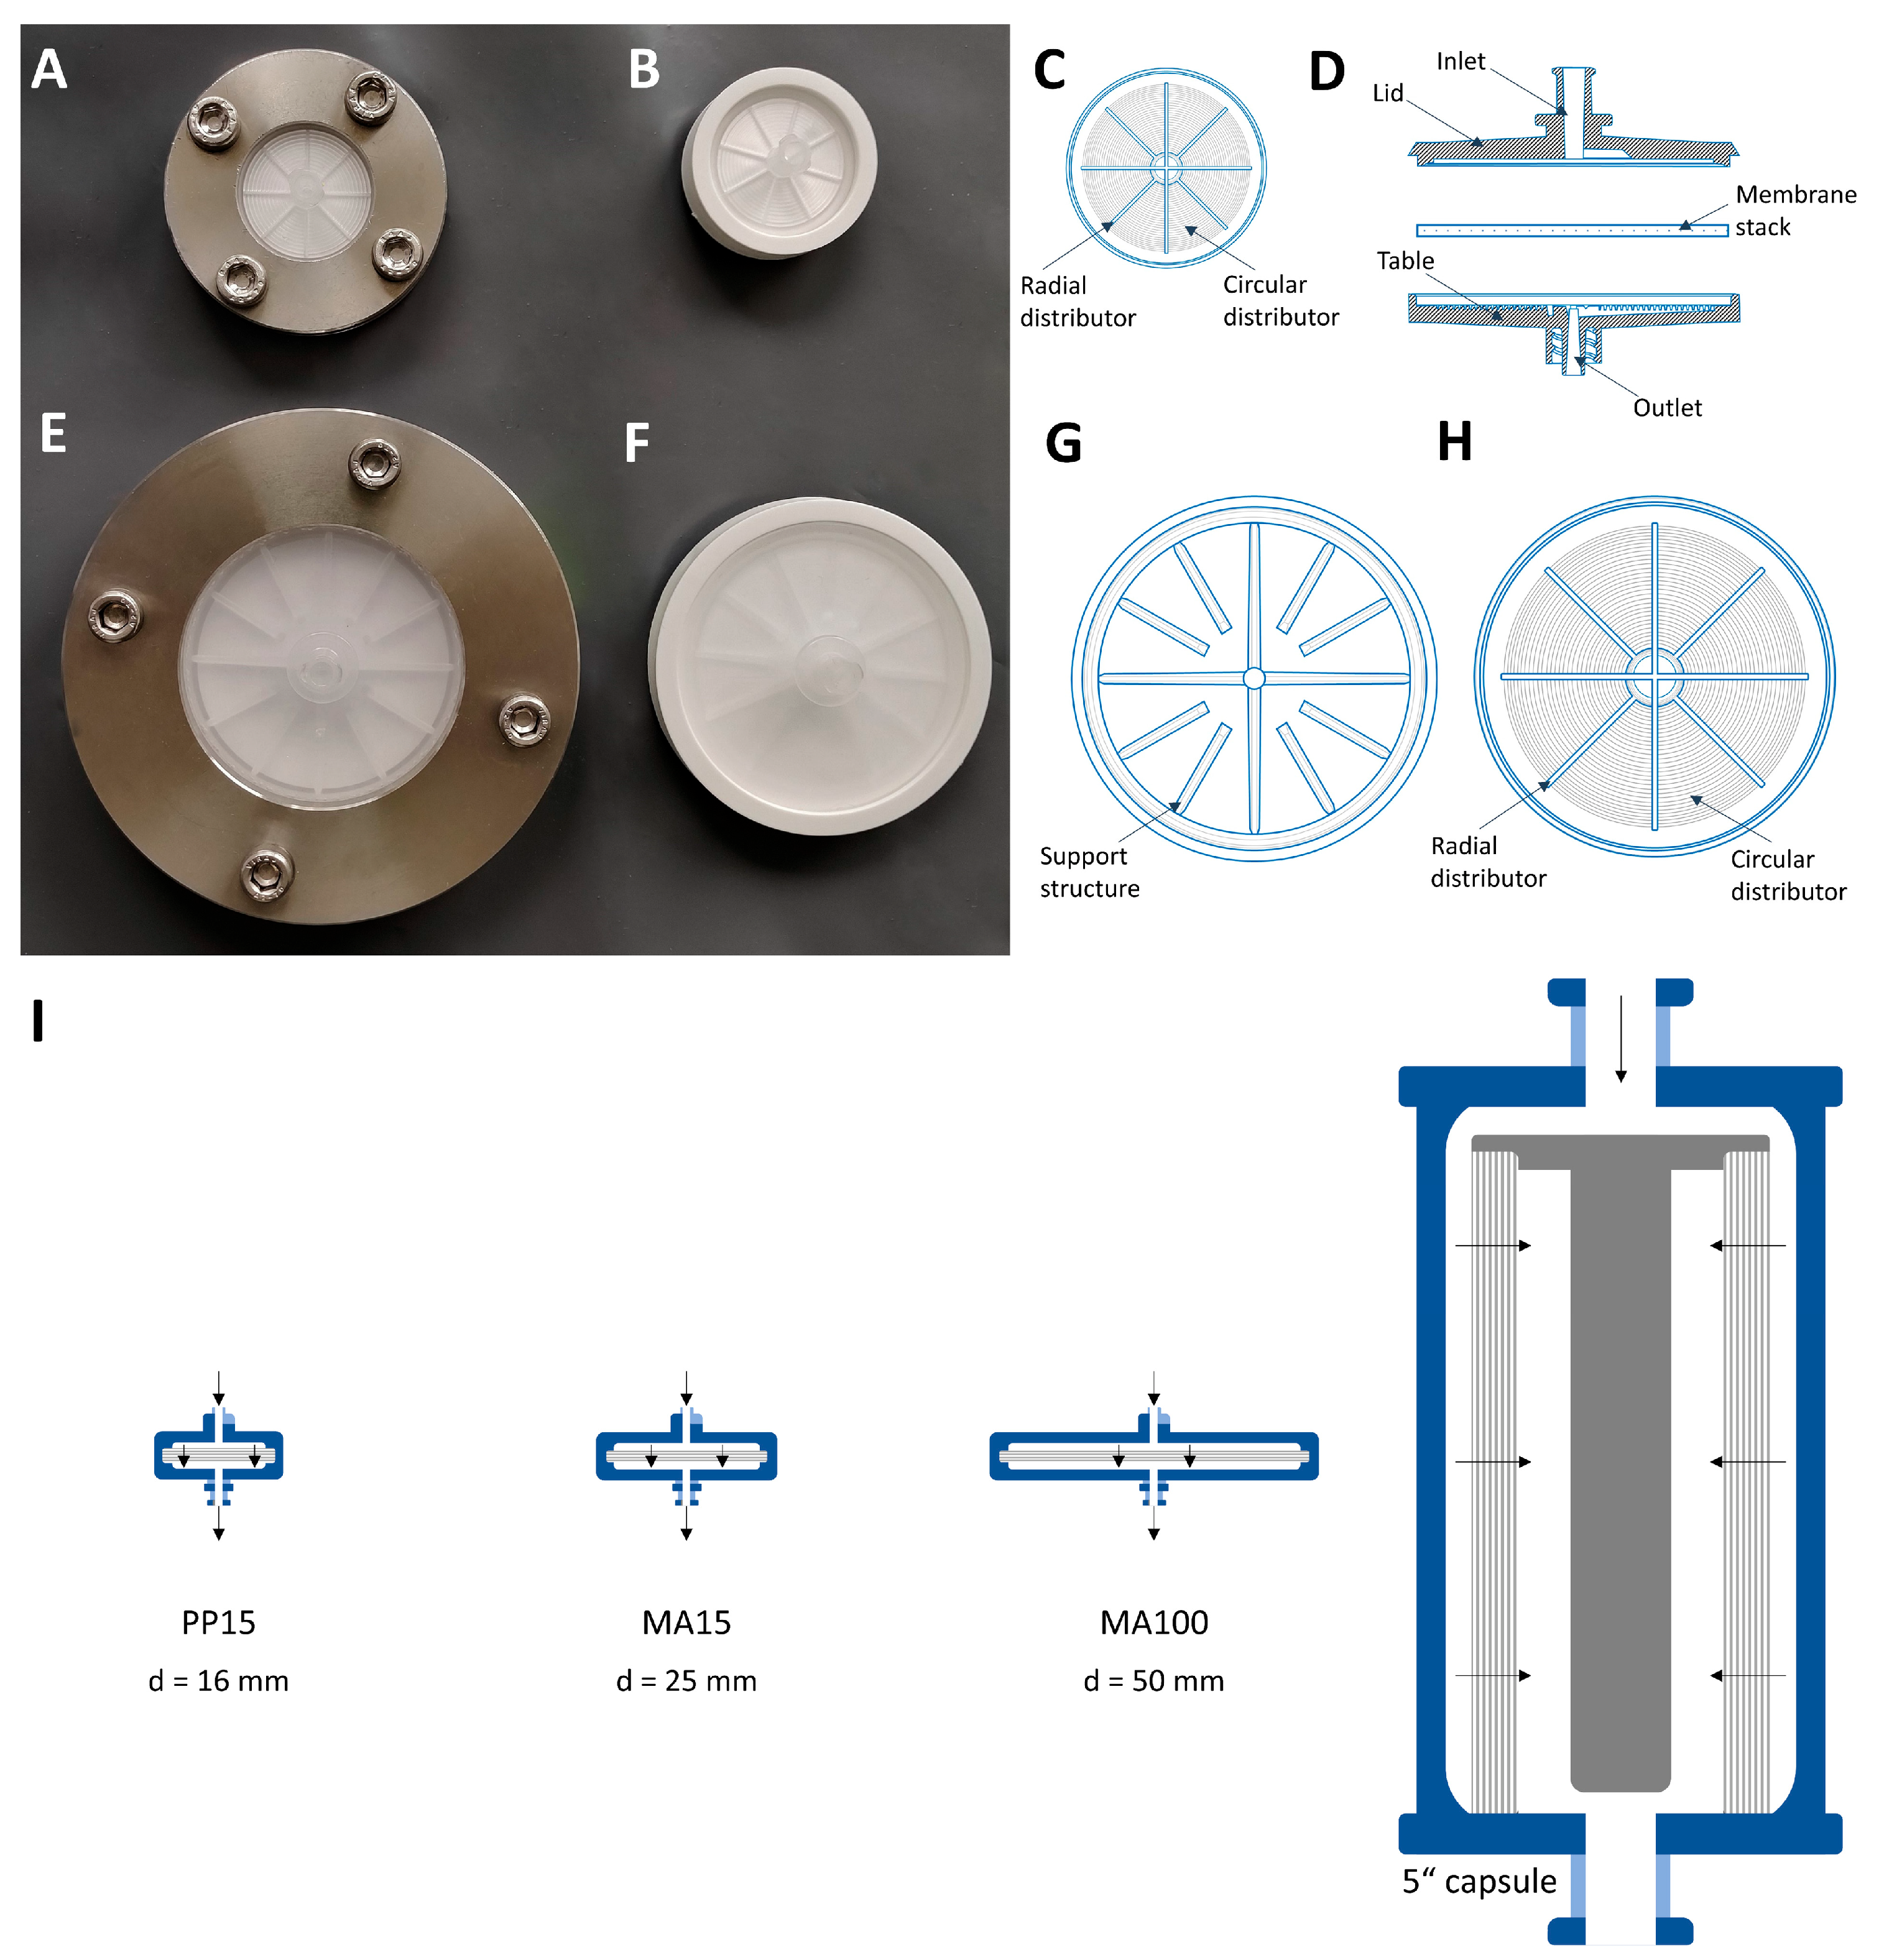
The membrane chromatography devices used in this study are operated by an axial flow from above through a membrane stack and have a low bed height (height of superimposed membrane layers). Besides a lower bed height, the incident flow area is larger than the resin columns. A uniform flow distribution over the entire membrane area is required to avoid channeling and to enable the whole membrane area to be used efficiently. Even flow distribution is achieved by a distributor structure inside the lid, which spreads the fluid over the membrane, and a collector structure inside the table, which collects the fluid. As housing geometry significantly influences fluid transport through the membrane, housing design should play a major role during chromatography process development [
28,
29].
Axial devices are limited by their central inlet, resulting in a velocity profile; however, they still have the advantage of simple production and are therefore preferred at small scales.
Lentiviral vector visualization with the MA100 housing was carried out to assess LV distribution on the membrane before and after elution. SXC was performed at a flow rate of 1.43 mL·min
−1·cm
−2. A volume of 160 mL was loaded, which corresponds to a volume of 80 mL of LV solution with a particle titer of 7.27 × 10
9 VP·mL
−1 and an infectious titer of 2.71 × 10
7 TU·mL
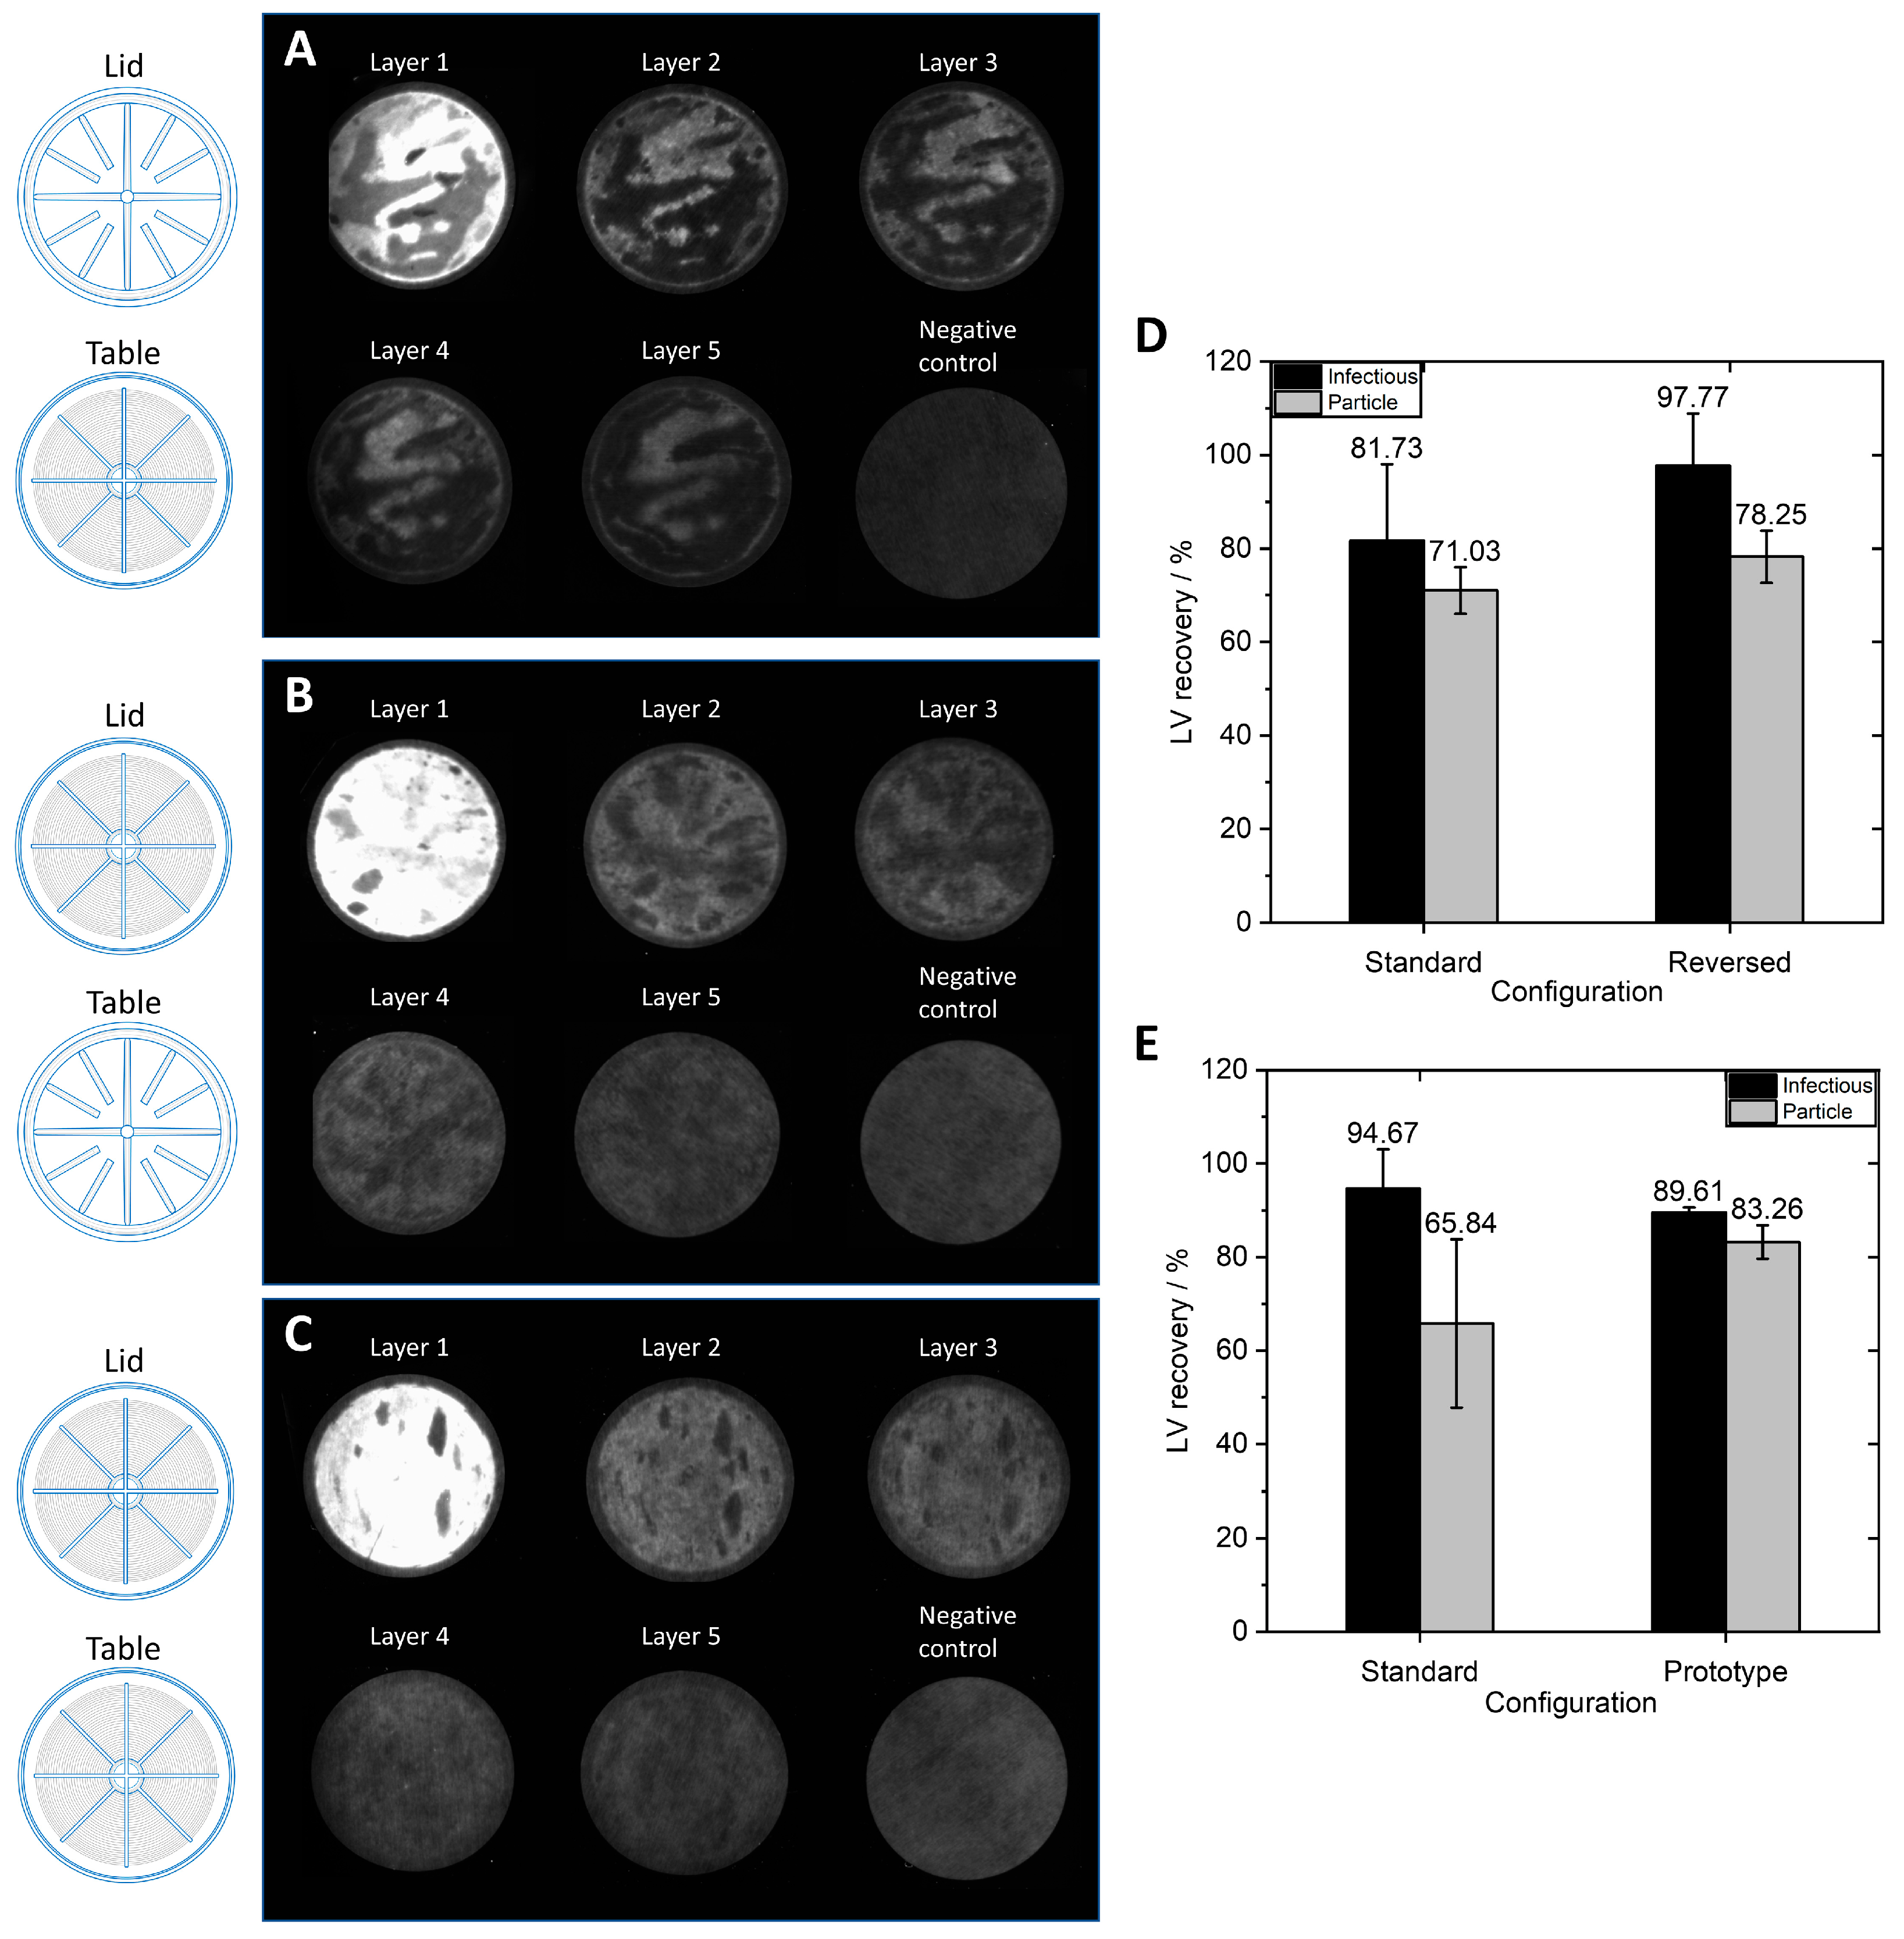
−1. For the first SXC run with labeled LVs, a standard housing configuration was used with the lid and table having distinct structures (
Figure 1G,H).
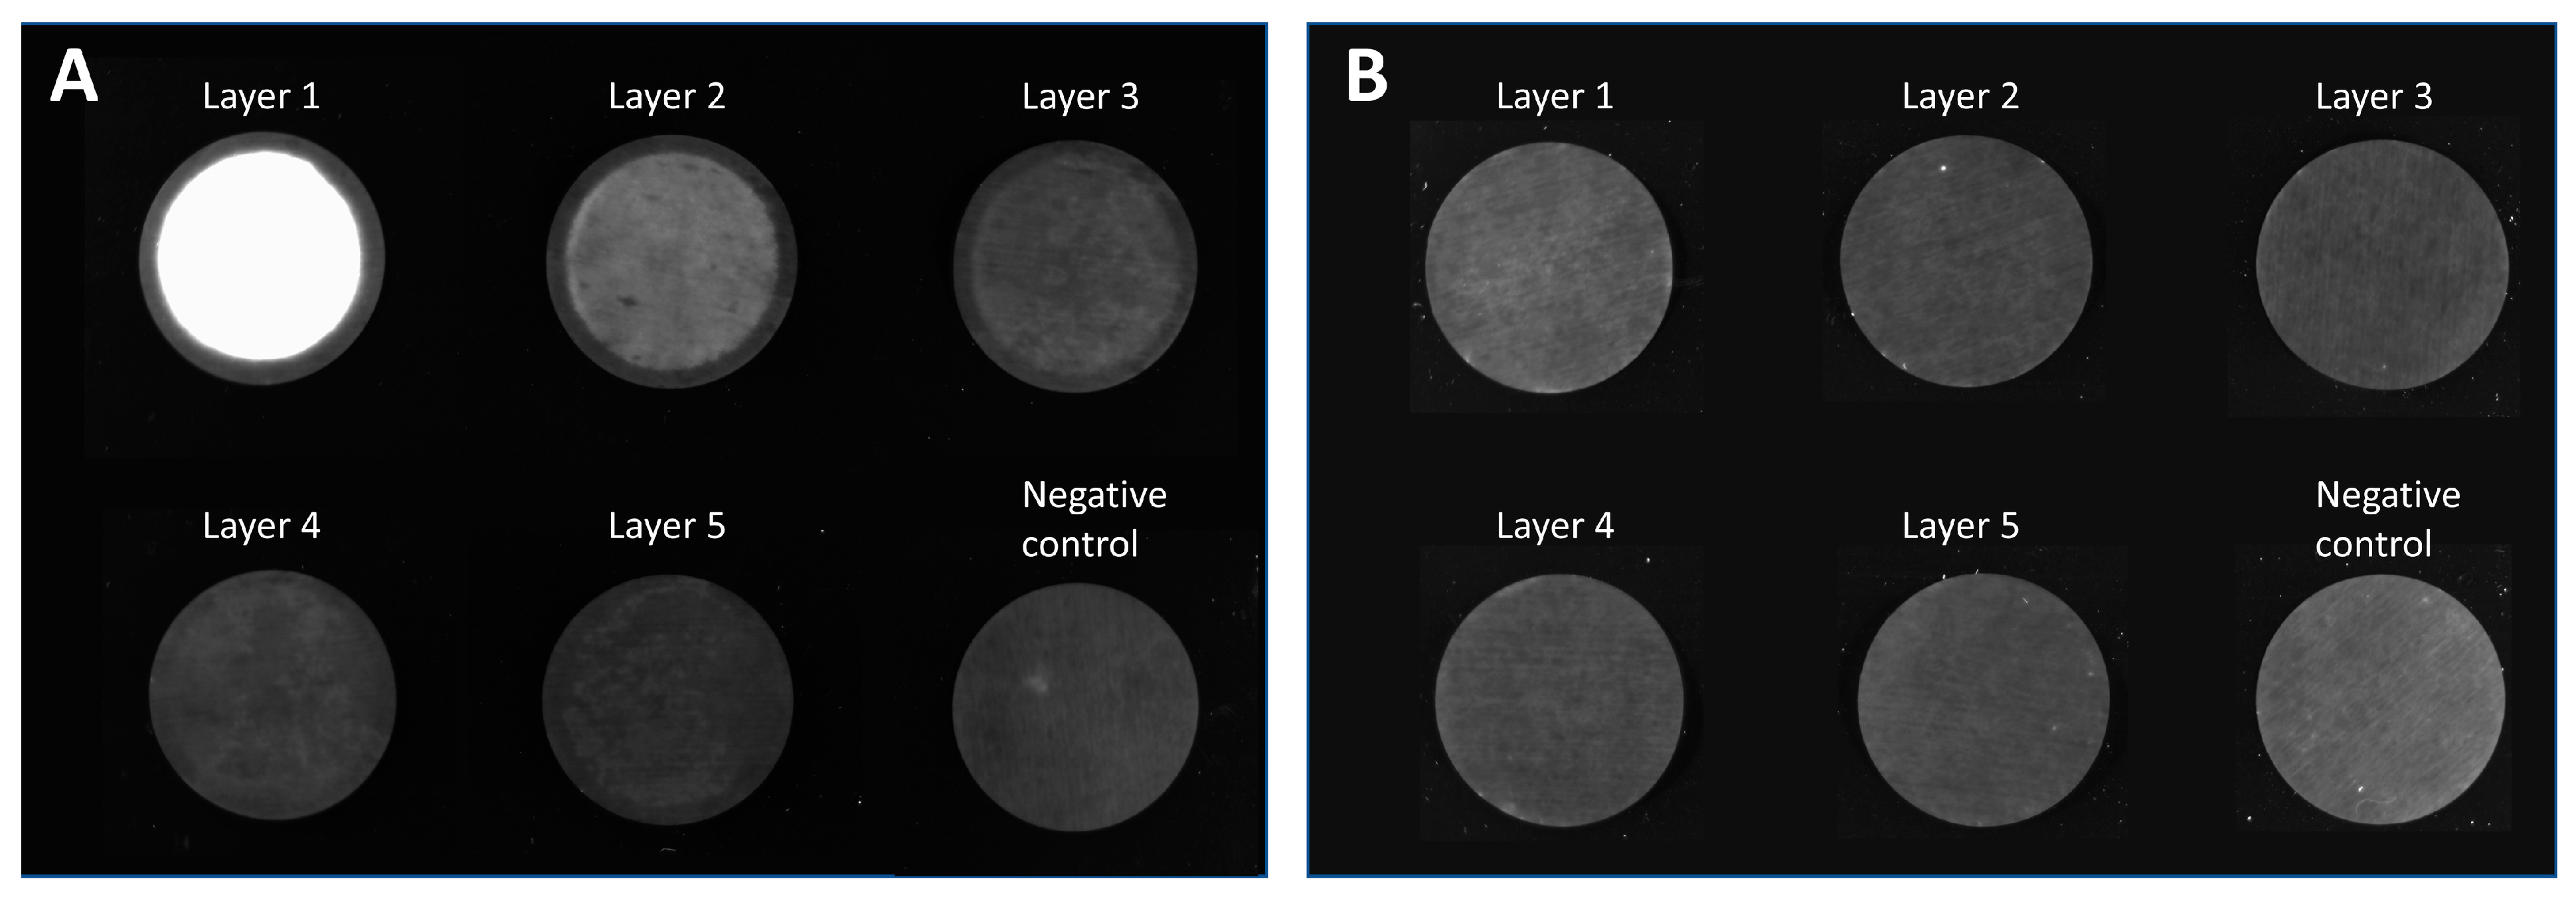
Figure 7A displays an uneven distribution on the membrane layers with a consistent appearance throughout all membrane layers. As previously observed with the MA15 device (
Figure 2), the LVs are mainly located on the upper layers, although some LVs also reach the bottom membrane layers. The fluid does not seem to have been distributed evenly over the membrane. This uneven fluid distribution has favored membrane channeling and an imbalanced utilization of the membrane layer, thus leading to the overloading of some areas. These overloaded areas can potentially lead to the poorer detachment of particles, causing them to remain aggregated on the membrane.
For the second SXC run, the device’s configuration was reversed; the table (
Figure 1H) was used as a lid and vice versa. Therefore, the incoming fluid was distributed by the radial and circular distribution channels.
Figure 7B shows that the LVs are more evenly distributed on the membrane layers. LV presence on the first membrane layer is visible, comparable to the findings when using the MA15 module (
Figure 2). The changed lid and table configuration in this run highly improved fluid distribution over the membrane. These findings demonstrate that a lid with radial and circular distribution channels is better suited than a coarse structure with thick bridges when seeking to spread the fluid over the membrane (
Figure 1G). The dark spots within the bright areas indicate the presence of air bubbles that did not allow the fluid to access the membrane in this area. Air bubbles prevent the utilization of the surface area they occupy, reducing the recovery of target species. A higher pressure drop across the membrane could eliminate air bubbles; alternatively, an optimized module design might be necessary.
A prototype was constructed with radial and circular distribution channels in the lid and the table. This housing configuration also resulted in evenly distributed LVs on the membrane (
Figure 7C). Some air bubbles were present in the device (dark spots). Comparing
Figure 7B,C, the LVs appear to be better distributed with the prototype housing. A possible reason is that the fluid is not only evenly distributed on top of the membrane stack but is also collected from the membrane more efficiently and directed to the outlet of the table with the distribution channel design. This LV visualization experiment shows that the membrane module’s design is crucial to achieving evenly distributed fluid on the membrane so that the whole membrane area can be utilized.
The three device configurations explained above were used to purify LVs via SXC. For this experiment, the membranes, lid, and table of the MA100 module were incorporated into a stainless-steel holder (
Figure 1E). Thus, comparability to the overmolded MA100 devices used for previous experiments is limited. The LV recoveries for different MA100 housing configurations are shown in
Figure 7D,E. The standard configuration was used for all previous experiments and served as a comparison for the reversed and prototype configurations. The virus solution purified with the standard and reversed configuration (
Figure 7D) had a total particle titer of 1.02 × 10
10 VP·mL
−1 and an infectious titer of 2.39 × 10
7 TU·mL
−1. The virus solution purified with the prototype device and the standard configuration (
Figure 7E) had a total particle titer of 4.32 × 10
9 VP·mL
−1 with a concentration of 3.03 × 10
7 TU·mL
−1.
The reversed configuration generated higher infectious LV recovery and total LV particle recovery compared to the standard configuration, although differences were not significant. The LV recoveries of the prototype configuration were also not significantly different from the standard configuration, though standard deviations were lower with the prototype configuration. These findings indicate that utilizing a distribution structure on the inlet and outlet side allows for generally more stable reproduction of LV recoveries. The prototype and reversed configuration reduce the dead volume on the inlet side, which decreases back-mixing effects and promotes a narrower residence time distribution [
28]. Concerning the high LV recoveries, the uniform LV distribution on the membrane, and the lowest dead volume, the prototype device with a flow distributor plate in the lid and table is the favored configuration for an axial MA100 device. Further device optimizations are necessary to avoid the entrapment of air bubbles in the module. Moreover, other module geometries, such as the capsule format with a radial flow, showed promising results in our study and have the advantage of a homogenous flow distribution that has been previously discussed in several studies [
28,
30,
31] and that can be easily scaled [
32].


