1. Introduction
Processes to purify recombinant monoclonal antibodies (mAb) for therapeutic treatment are well established in the market. However, continuous improvements to reduce patient risk and the cost for such treatments are implemented. Over the past decade, efforts to improve efficiency have focused on the upstream side of increasing titers [
1]. These efforts result in a shift of the bottleneck towards the downstream side [
2]. The downstream process typically comprises three chromatographic purification steps. Specifically, the mAb capture step which still depends on protein A resin in a packed-bed column format has obvious short comings, such as high diffusional resistance leading to long process time, re-use over multiple batches to make it economical which, in turn, requires extensive cleaning and validation efforts, as well as tedious column packing [
3]. Considerable efforts are being made to identify alternative chromatographic materials which bypass these limitations while providing comparable product quality and support therapeutics which are affordable to more people [
4].
To date, available chromatographic matrices can be clustered into two categories based on their dominant mass transport capabilities. The first category comprises porous chromatographic resins. Here, the dominant mass transport mechanism is based on diffusion into the porous structure. Inside of resins, the effective pore diffusion is slow and the distances to be covered are comparatively large (~30–50 µm). This leads to process operations at low flow rates and high residence times which result in low productivity (10–30 g L
−1 h
−1) of this unit operation [
5]. Materials of this design can be denoted as diffusive materials.
The second category contains purely convective materials such as membranes, fiber-beds or monoliths. The predominant transport mechanism in these materials is based on convection as the binding sites are presented at the surface of the convective pores. This structure supports good accessibility of the ligand but comes with a trade-off between binding capacity and pressure drop because both values are tuned by the pore size while showing contrariwise behavior. Pore sizes that ensure acceptable binding capacities for a protein A-functionalized purely convective material (>30 g L
−1) are in the sub-micron range (e.g., 0.3 µm). This forces the user to either accept high pressure drop and increased fouling propensity, or low binding capacity [
6].
We present a new generation of chromatographic materials that combines structural and performance aspects of resins and purely convective materials. This new convecdiff membrane contains a high binding gel phase with short diffusional path length (2–3 µm) and large convective pores for fast transport to the gel phase [
7]. This combination offers robust and scalable high binding capacities at short residence times. In addition, the large convective pore sizes ensure low fouling propensity and easy cleanability, as well as high permeability, allowing for bed heights of about 4 mm or more with low pressure drops.
In this article, we demonstrate that the novel convecdiff membrane with a protein A ligand provides typical binding capacities > 30 g L−1 for a set of tested Fc-containing molecules at residence times of 12 s, as well as robust performance and product quality over 200 cycles. In addition, we show scalability of three different membrane volumes by comparing critical process parameters (CPP) and critical quality attributes (CQA). We further prove comparability of the CQA of an mAb purified with the convecdiff membrane and a state-of-the-art resin which showed the same high product quality for both materials. Beyond this, we analyzed the impact of different parameters, such as feed titer, flow rate and sanitization frequency on productivity and recommend an optimal combination of these parameters to maximize productivity (g L−1 h−1).
In summary, the novel convecdiff membrane is a viable, robust and scalable alternative to protein A resins used for mAb capture. It provides a magnitude increase in productivity compared to diffusion-limited chromatography resin. Specifically, molecules with a low feed titer benefit from the high flow rates. However, as productivity is also influenced by cycle time the obtained productivity is lower compared to high feed titers. When high feed concentrations are obtained the effect of DBC10% significantly increases and the flow rate during the load phase should be accordingly adjusted to achieve maximum productivity. In this study, optimal flow rates at maximum productivity were determined for various feed concentrations. Further improvement in productivity can be achieved by reducing the regeneration frequency to every 7th cycle. This will further increase productivity by 11.8 ± 6.5%, beyond this no further significant improvement was observed.
2. Materials and Methods
2.1. Buffers, Reagents and Monoclonal Antibodies
Chemicals used for buffer preparation were purchased from Carl Roth (Karlsruhe, Germany) and buffer constitutions are listed in
Table 1. Buffers and recipes used in this study are subject to internal platform approach.
All recombinant human monoclonal antibodies were expressed in Chinese hamster ovary (CHO) cells using standard cell culture techniques (stirred bioreactor). The cultivations were performed in 5 L Biostat
® bioreactors (Sartorius Stedim Biotech, Goettingen, Germany) in batch mode for 14 days. Cell clarification was performed in a two-step depth filtration using Sartorius Sartoclear DL20 and DL60 (Sartorius Stedim Biotech, Goettingen, Germany) with subsequent sterile filtration using Sartopore 2 XLG (Sartorius Stedim Biotech, Goettingen, Germany).
Table 2 summarizes the antibodies used in this study.
2.2. Protein A Chromatography Devices
Protein A chromatographic devices used were novel Sartorius convecdiff membrane prototypes with a membrane volume (MV) of 1.2 mL (capture of 4 different mAbs), 10 mL and 70 mL (proof of scalability) with bed heights of about 4 mm, as well as a HiTrap MabSelect SuRe column from Cytiva (Uppsala, Sweden) with a column volume (CV) of 1 mL (comparison adsorber versus resin).
2.3. Protein Concentration and Monomer Determination by Size Exclusion HPLC
Protein concentrations and monomer/aggregate levels of harvested cell culture fluid (HCCF) and purified samples were determined by analytical high-performance size exclusion chromatography (SEC-HPLC) using a TSKgel G3000SWXL-column (30 mm ID × 7.8 cm) from Tosoh (Griesheim, Germany) with an UltiMate 3000 HPLC System from ThermoFisher Scientific (Dreieich, Germany). The HPLC system was operated at 1 mL·min−1 with PBS as mobile phase applying 10 µL of sample. The elution profile was monitored at λ = 280 nm using the systems spectrophotometer. Elution peak area was converted to protein concentration using a standard curve generated with purified material. Aggregate levels were determined as a ratio of peak areas of the early-eluting aggregate peak(s), late-eluting fragment peak(s) and the monomer peak.
2.4. Dynamic Binding Capacity Measurements
DBC is defined as the maximum amount of target protein that can be loaded onto a stationary phase without causing unnecessary loss, measured under realistic experimental conditions. Dynamic binding capacity (g of mAb per L of membrane/resin) was determined for chromatographic devices (see
Section 2.2) using an ÄKTA Avant 150 chromatography system from Cytiva (Uppsala, Sweden) in two different ways.
(1) For the cycling studies, the DBC was determined using HCCF. The device was equilibrated and then loaded with the HCCF containing the mAbs until overloading (at 12 s residence time). The flowthrough was fractionated in 1-mL portions to identify the volume when the stationary phase was fully saturated and mAb breakthrough occurred. A DBC (total bound mAb) was calculated for the amount of HCCF loaded where monomer was below the level of detection in the breakthrough. The protein concentration of the feed and the breakthrough-fractions were determined with SEC-HPLC using a standard curve generated with purified material.
where
V0% is the volume where no mAb can be measured in the flowthrough fraction (L),
C0 is the mAb concentration (g·L
−1) in HCCF and
Vmembrane is the volume of the membrane bed in the chromatographic devices. Determination of DBC with HCCF reflects the real process due to physicochemical mAb interactions with impurities, as well as the competition and hindrance of accessibility to the ligand.
(2) For the other experiments, DBC
10%, defined as the amount of protein loaded at 10% breakthrough (g of mAb per L of membrane/resin) was determined. Purified protein load was adjusted to pH 7.0 ± 0.2. The device was equilibrated and then loaded with protein (feed concentration: C
Feed ∼1.0 g L
−1) until the stationary phase was saturated. The exact protein concentration of the feed was determined by offline A280 measurement using the Unchained Labs Little Lunatic (Pleasanton, CA, USA).
where
V10% is the volume at which 10% breakthrough was observed,
V0 = system void volume (L),
C0 is the mAb concentration (g L
−1) and
Vcolumn/membrane is the volume of the resin of the membrane in the chromatographic devices. The breakthrough was determined at a residence time of 12 s for convecdiff membrane prototypes and 4 min for HiTrap MabSelect SuRe.
2.5. Determination of Productivity
The productivity of the utilized chromatography devices for the purification of the different mAbs was calculated according to:
where PR (g L
MV−1 h
−1) is the productivity,
mmAb (g) is the average eluted mass of monoclonal antibody,
Vcolumn/membrane (L) is the volume of the resin/membrane in the chromatographic devices and
tc (h) is the average cycle time over the whole process.
2.6. Protein A Capture Chromatography from Harvested Cell Culture Fluid
Capture of monoclonal antibodies from HCCF was conducted with convecdiff membrane with a membrane volume of 1.2 mL for cycling studies with different mAbs and Cytiva HiTrap MabSelect SuRe (see
Section 2.2) as a comparison with regard to different critical process parameters (CPP) for one mAb using an ÄKTA Avant 150 chromatography system or Sartorius MU RCC system (Pompey, France). Chromatography was performed with buffers and chromatography recipes mentioned in
Table 1 and
Table 3.
The load was calculated as 80% of the DBC10% measured at a residence time of 12 s for the membrane or as 80% of the DBC10% measured at a 4 min residence time for the resin depending on the HCCF titer. The load density was conservatively chosen to achieve the desired number of cycles without product loss. Elution pools were collected from 100–100 mAU (using ÄKTA spectrophotometer with a 2 mm path length at λ = 280 nm). Step yield was determined using the mass of the product in the load and pool (both determined by SEC-HPLC).
2.7. Host Cell Protein, hcDNA and Leached Protein A Measurements
Host cell protein (HCP) concentrations were measured using the CHO HCP ELISA Kit3G F550-1 kit from Cygnus Technologies (Southport, NC, USA). Host cell DNA concentrations were measured using the Quant-iT PicoGreen dsDNA assay kit from Thermo Fisher (Dreieich, Germany). The log-reduction-value (LRV) of both impurities was determined by means of the decadic logarithm of the quotient of impurity concentration in the feed and the impurity concentration in the elution fraction. Leached protein A was measured using the Protein A ELISA Kit (9000-1) from Repligen (Waltham, MA, USA). The values listed refer to ng protein A per mg mAb. All assay kits utilized according to the manufacturer’s instructions and analyzed in an Infinite M Nano+ plate reader from Tecan (Maennedorf, Switzerland). Every 20th elution fraction was collected and analyzed regarding different CQA (critical quality attributes) and CPP.
3. Results
3.1. Robustness of New Convecdiff Membrane—Evalution of Chromatographic Performance and Product Quality Attributes over 200 Cycles
The convecdiff membrane was evaluated for its capability to run 200 robust and reproducible cycles. The cycling study included detection of UV traces, pressure drops, elution peak symmetry and critical quality attributes of the product such as yield, monomer content, HCP and hcDNA removal, as well as protein A ligand leaching. Further, to demonstrate the robustness of the convecdiff membrane the same chromatography protocol (see
Table 3) was used for all four mAbs.
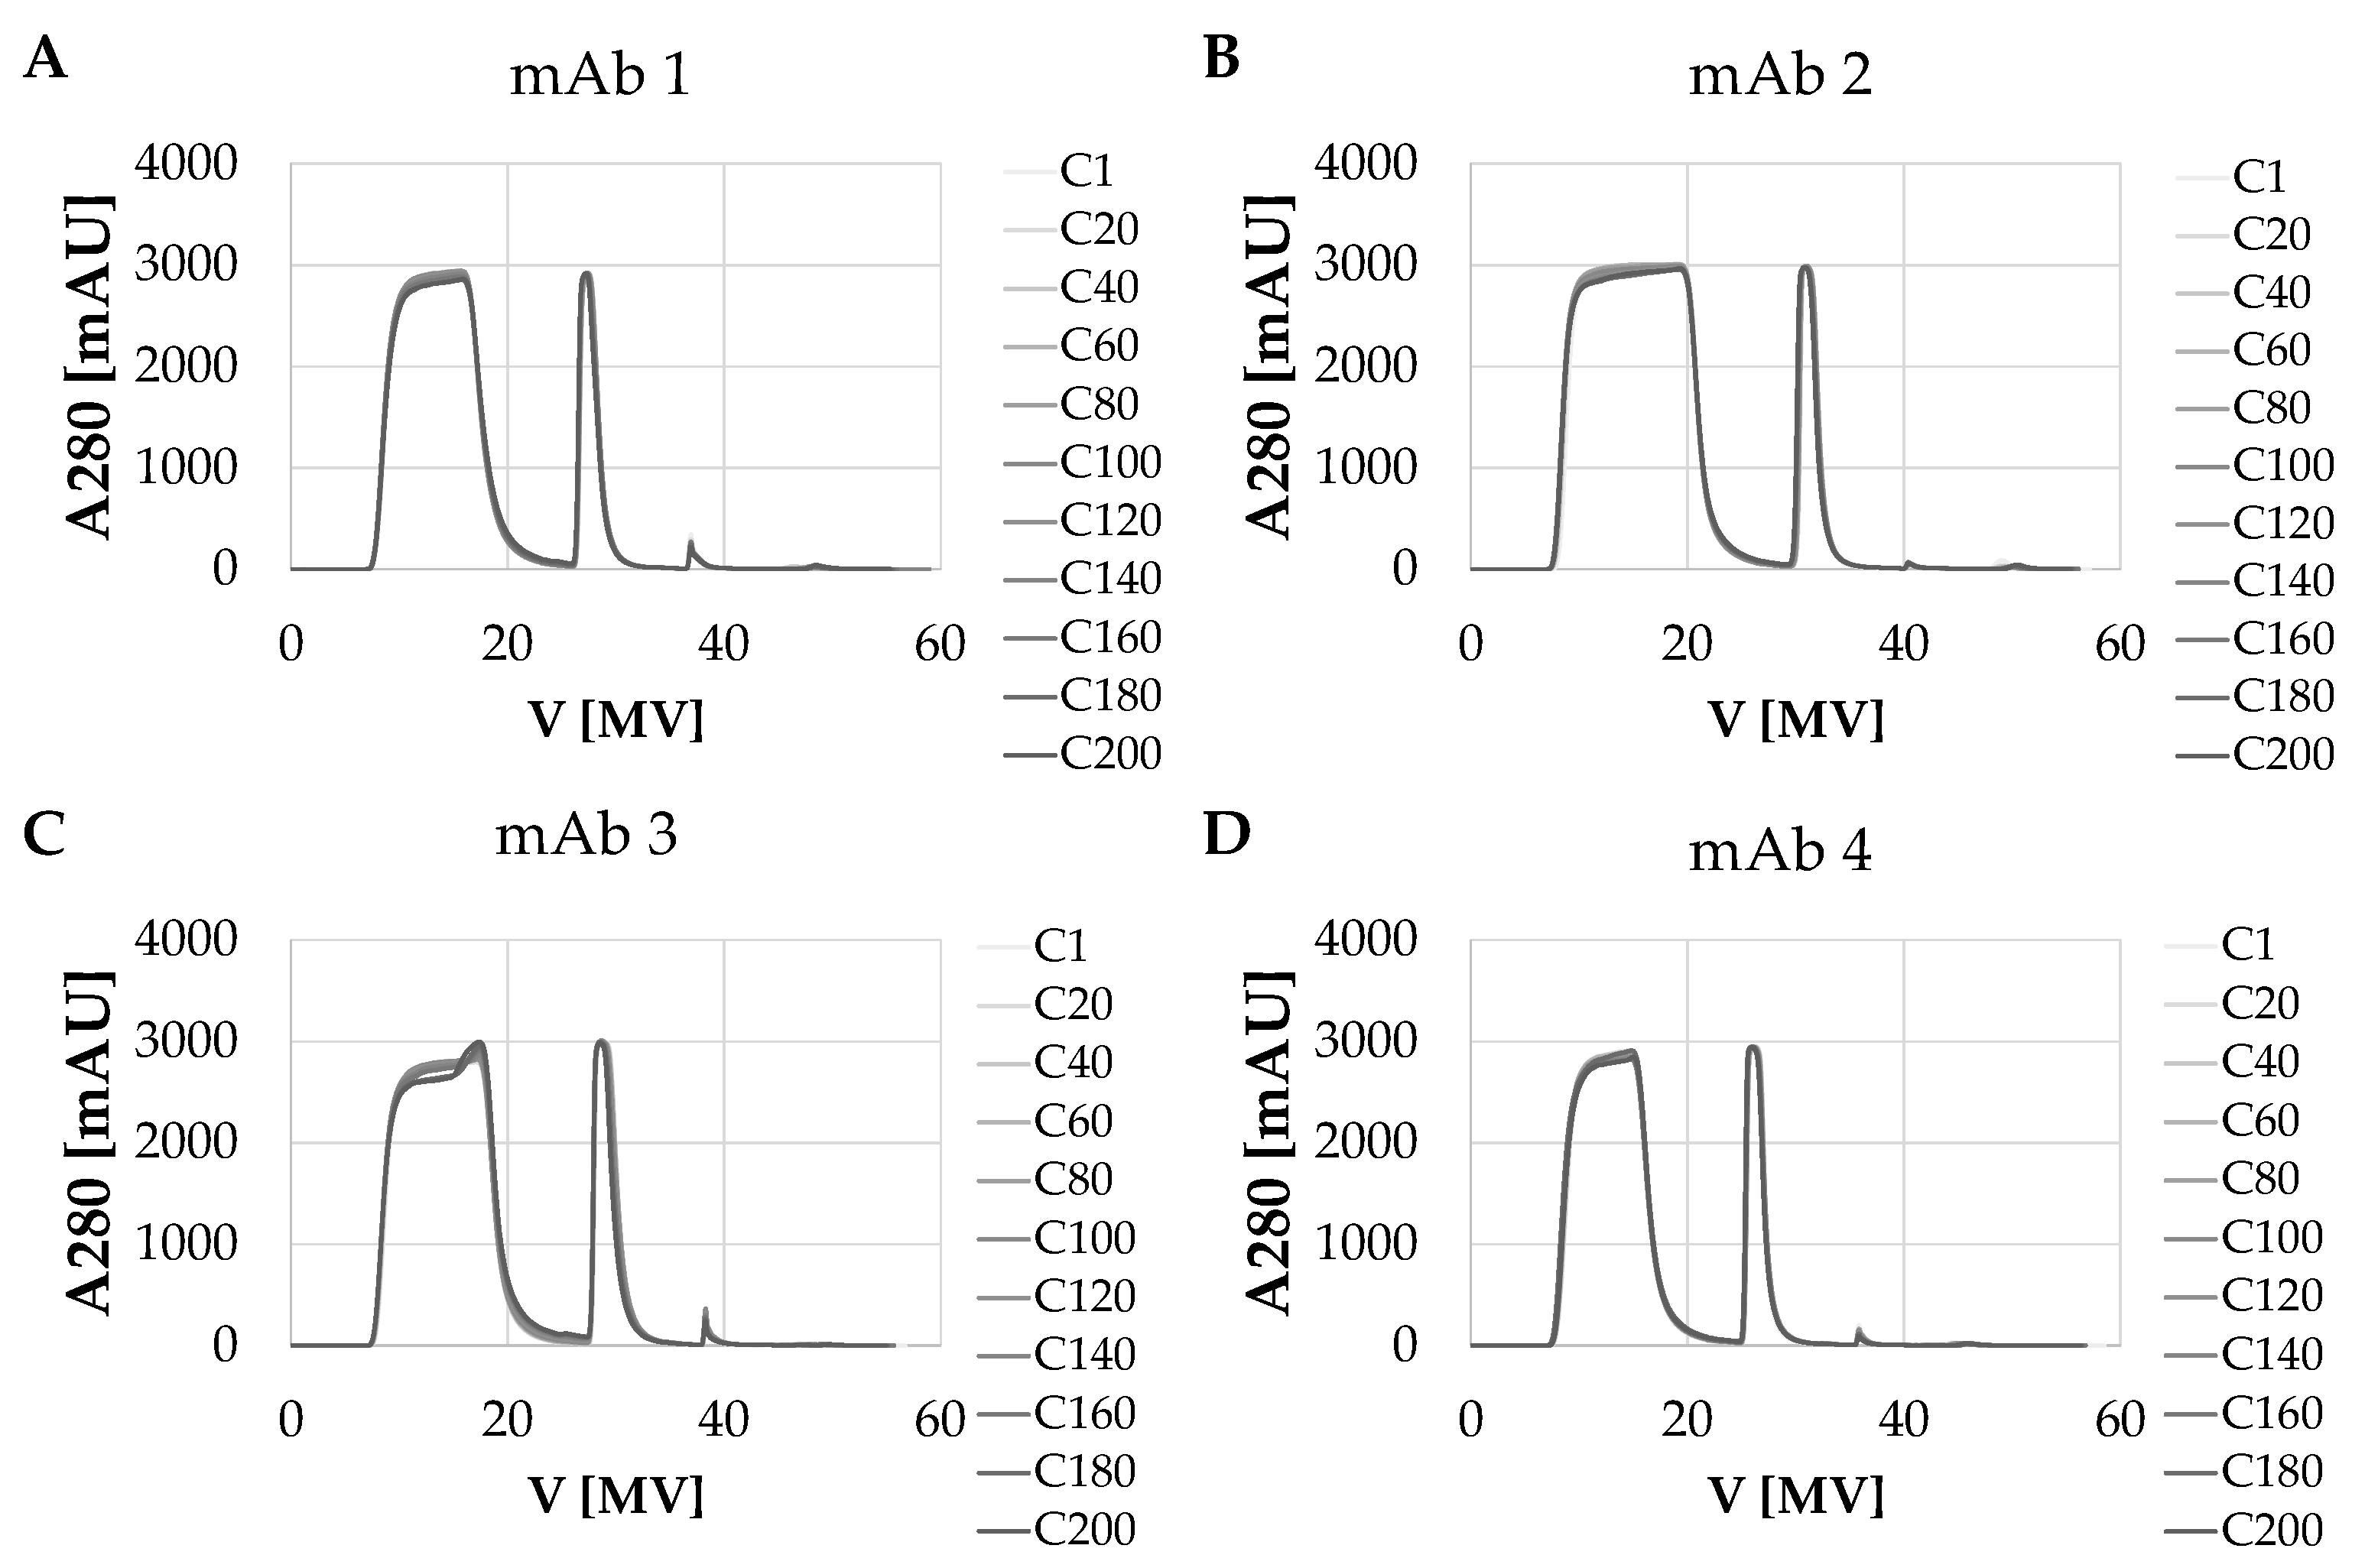
Figure 1 shows the overlays of UV adsorption at 280 nm for all four mAbs over the 200 cycles. During the load phase of the feed, unbound components flow through the convecdiff membrane resulting in high UV absorbance after approximately 8 MV. In the following wash step, unbound components are flushed out of the membrane leading to a decrease in the UV signal to zero (at ~27 MV). For elution of the bound mAb, the pH is decreased resulting in release of the target molecule from the membrane which, again, results in an increase in the UV signal at approximately 30 MV. After the elution block, the regeneration solution is applied on the membrane resulting in release of non-eluted mAbs and sticky impurities. A small peak during regeneration appeared in each cycle. Subsequently, the membrane was re-equilibrated to flush out the regeneration buffer and to restore optimal conditions for the next bind and elute cycle of mAb.
For each of the four mAbs, the intended number of mAb capture cycles was achieved with very high reproducibility. The peak shapes of the UV signals are extremely consistent. No significant peak broadening or shifts were observed over the whole process time. For only mAb 3, a slight change in the UV signal was observed during the loading. This was caused by degradation of the HCCF during the process time and resulted in a decrease in yield. The overall process time for 200 cycles was around 34 h.
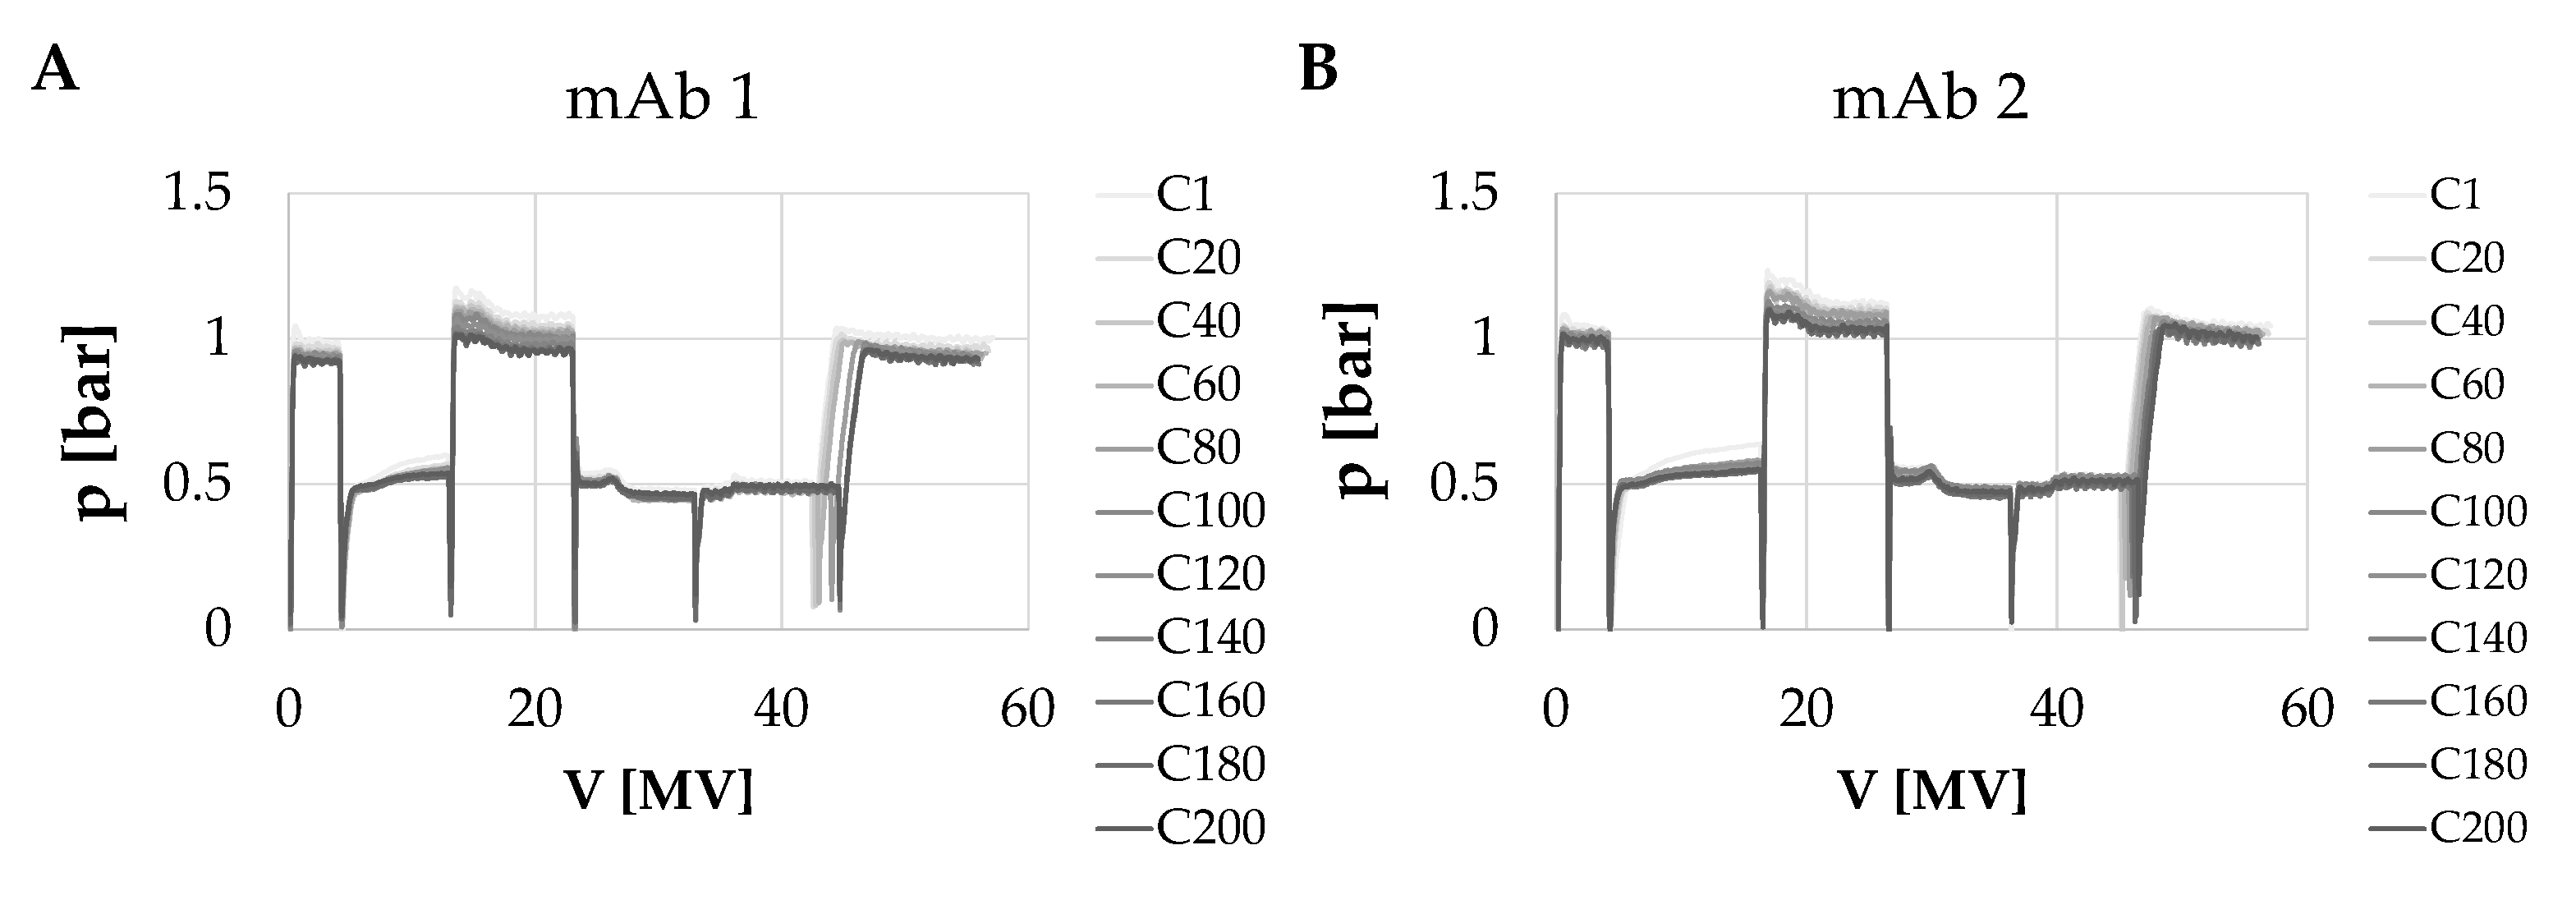
In addition, the pressure behavior over 200 cycles was detected. The highest observed pressure drops were detected during the wash step for which a flowrate of 10 MV min
−1 was applied and when the stationary phase was saturated. Here, maximum pressure between 1.1–1.4 bar (0.11–0.14 mPa; see
Figure 2) was detected. Overall, the pressure behavior of the convecdiff membrane showed only small variations within 0.2 bar indicating that the membrane was not affected by considerable fouling under the applied conditions over 200 cycles.
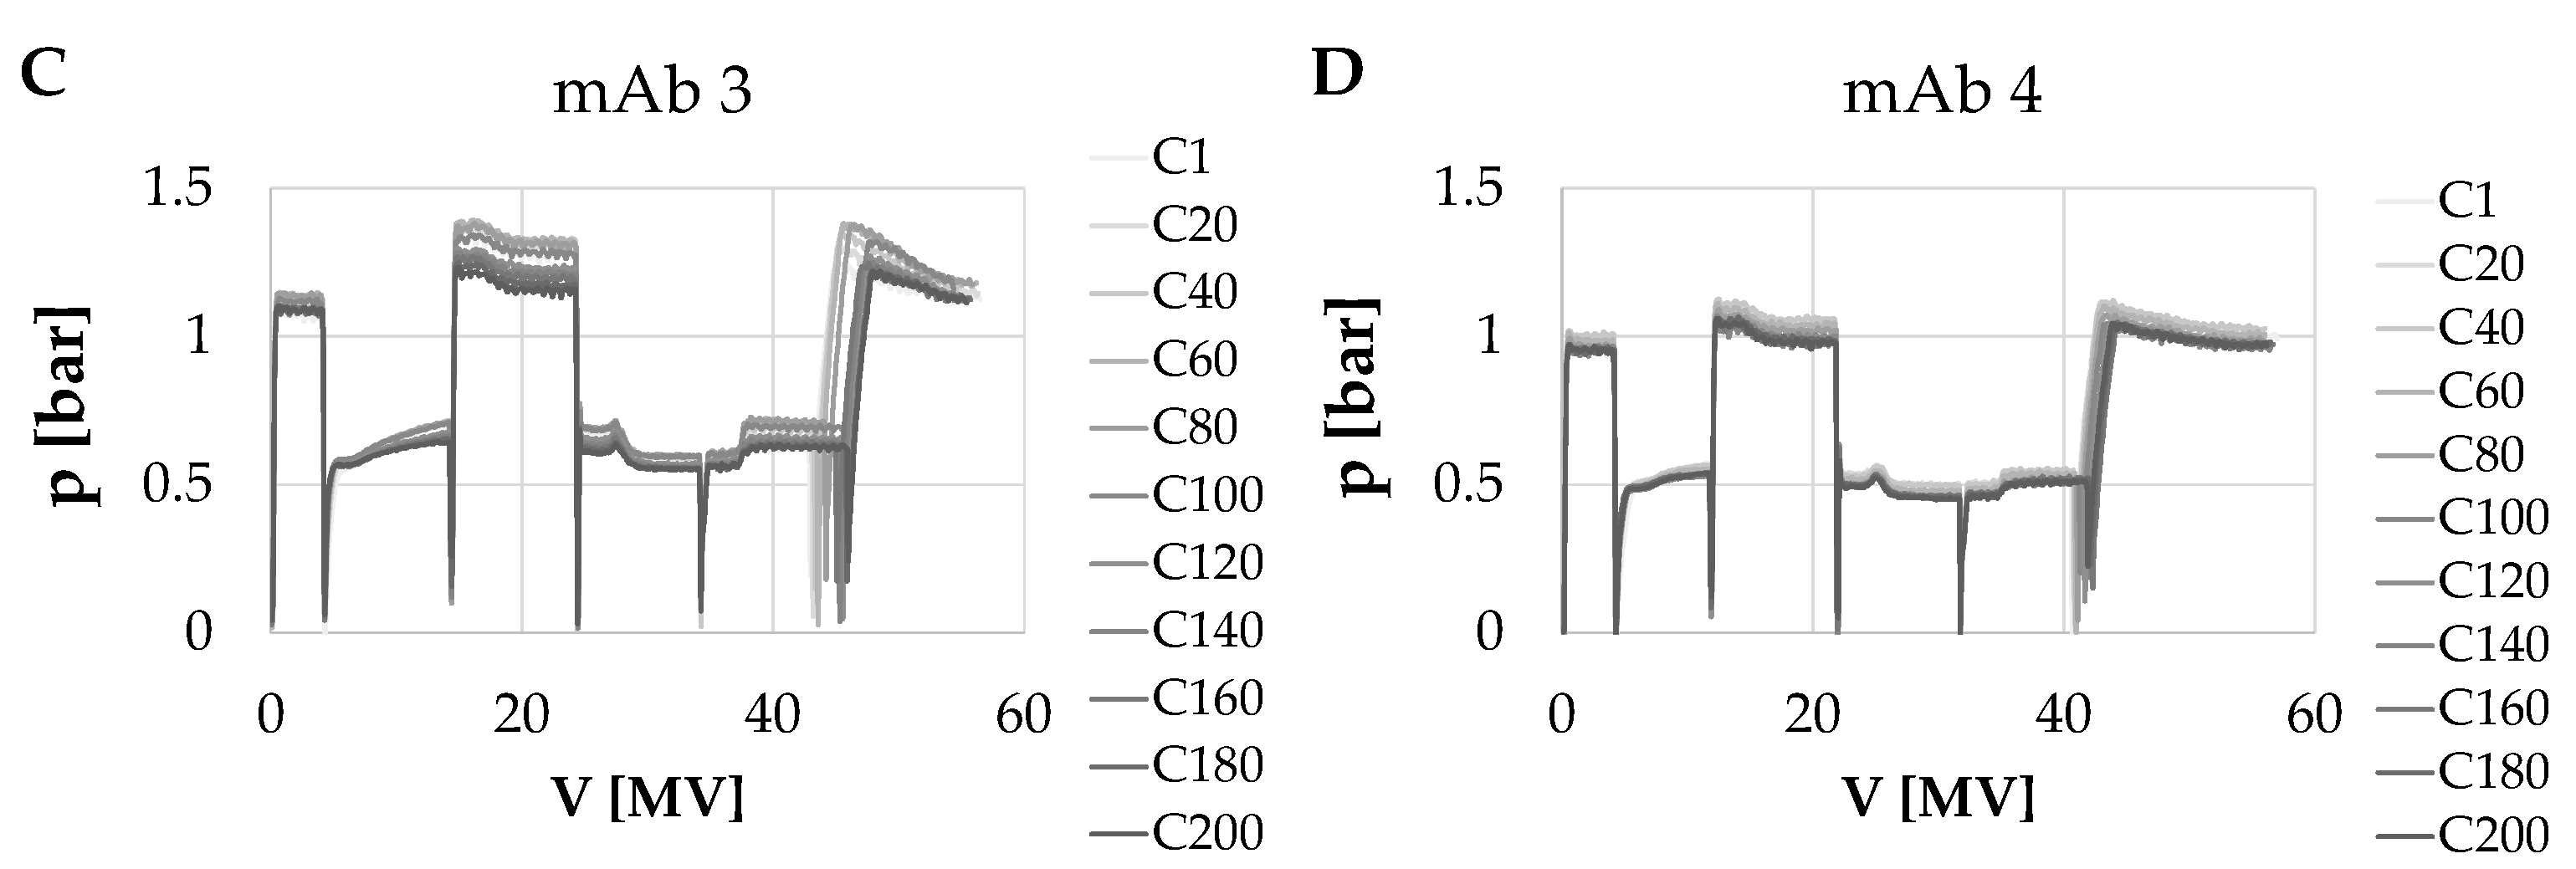
Additionally, the CQA of the product were analyzed, including HCP removal, hcDNA removal, protein A ligand leaching and high and low molecular weight (HMW and LMW) species. As shown in
Figure 3, consistent results were achieved for the 200 cycles for HCP and hcDNA removal for each HCCF. mAb 3 and 4 show lower log reduction values (LRV) due to lower HCP and hcDNA content in the HCCF. As described earlier, mAb 3 HCCF was not stable over the processing time which also results in a decrease in the LRV at cycles above 130. However, for hcDNA depletion, no effect was observed. These data confirm a consistent removal of both HCP and hcDNA over 200 cycles for four different mAbs demonstrating the cycling capability and stability of the membrane adsorber considering that no optimization of the purification protocol was performed.
Further process- and product-related parameters were summarized in
Table 4. For three of the four mAbs, all analyzed CPP and CQA values showed extremely high consistency over the 200 cycles. mAb 3 showed consistent values until cycle 130. After this, the HCCF started to degrade and form aggregates. Therefore, two values are given in
Table 4 for this mAb to demonstrate that, until cycle 130, the same high CPP and CQA values were achieved with the convecdiff membrane.
Purification with the convecdiff membrane resulted in extremely high yields for three of the four mAbs. MAb 4 showed lower yields, which can be explained by higher elution pH (pH 3.2) compared to the other mAbs (pH 2.9). An improvement in the yield for this mAb could be achieved by further protocol optimization. Further, the membrane showed very low capability to introduce aggregation and fragment formation resulting in a remarkably high monomer concentration in the elution fractions. Furthermore, the elution volumes and mAb concentration in the elution showed no significant change over the 200 cycles (5–6 MV; 5–6.5 g L
−1; depending on HCCF). Another important parameter is ligand leaching of the protein A ligand from the membrane during purification. The analysis of this value in the product showed very low levels, consistently below 3.4 ppm. Compared to usual protein A resins, the leached ligand is at a comparable level but in contrast and despite cleaning with caustic after every single cycle, there was no noticeable decrease in binding capacity as typically seen with resins [
9].
The underlying calculated productivities were exceptionally high which is a result of very short cycle times (average cycle times of 10–11 min) and very low stationary phase of the chromatography material (1.2 mL MV). Variations between the four experiments are due to different feed concentrations and binding capacities, which directly influence the cycle time.
3.2. Scalability of Convecdiff Membrane Implemented in Different Device Sizes
To demonstrate the scalability of the novel convecdiff membrane, the membrane was implemented in standard membrane capsules with a bed height of 4 mm for all scales. Scalability was investigated using three different membrane adsorber sizes with membrane volumes of 1.2 mL, 10 mL and 70 mL. The purification protocol from
Table 3 was applied, and HCCF containing mAb 1 was loaded to the membrane adsorbers. The available HCCF originated from different cultivations and, therefore, contained slightly different mAb concentrations. The impurity and aggregate levels were in a similar range.
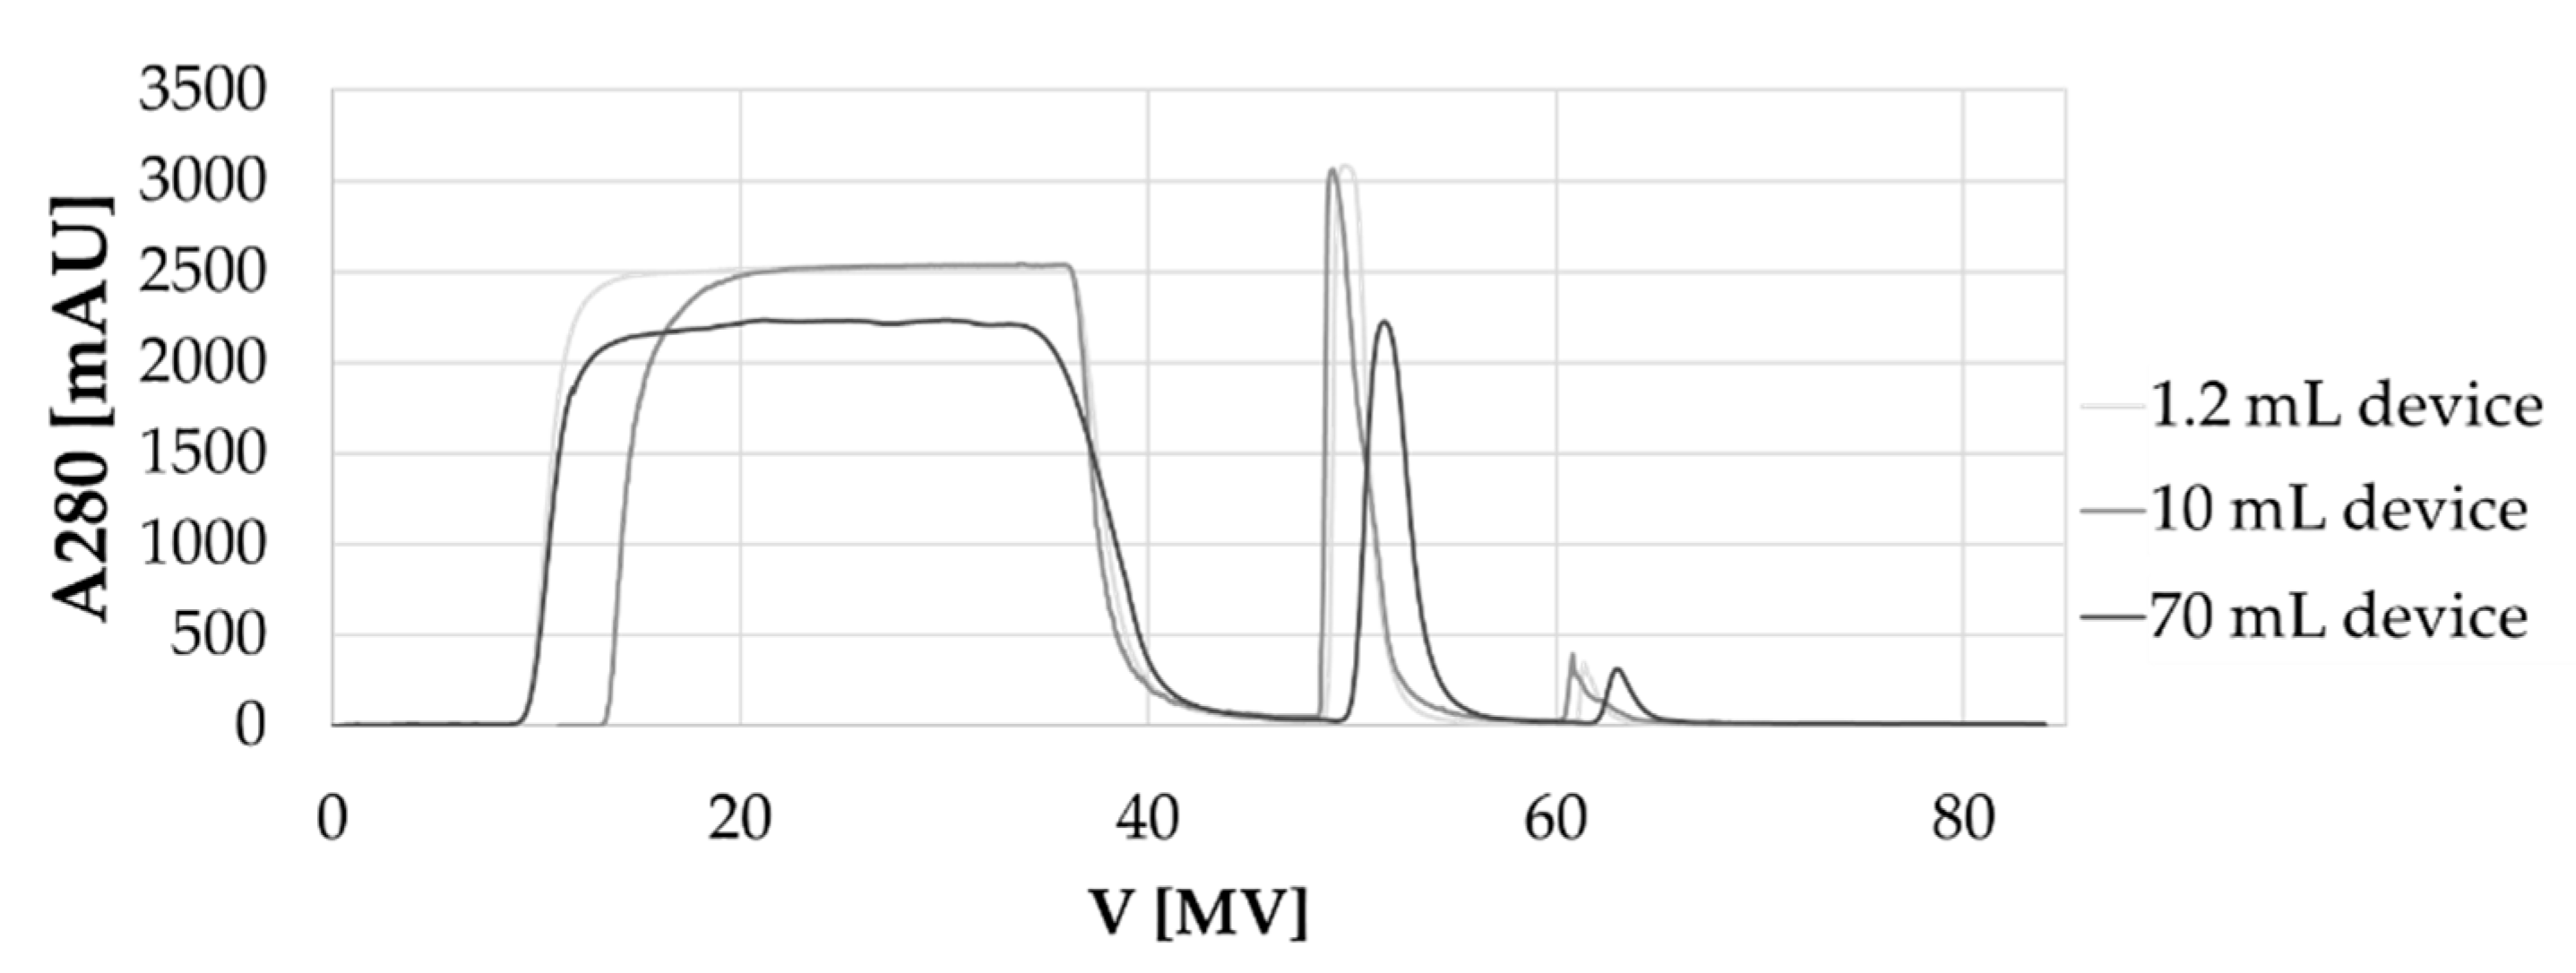
As shown in
Figure 4, the chromatograms showed very similar peak shapes. Slight variations resulted from the different HCCF. The mAb concentration of the feed for the 10 mL device was slightly higher compared to the other two tested sizes and, therefore, the load phase was shorter resulting in a shorter UV curve. The 70 mL adsorber required a pilot scale chromatography skid. In comparison to the benchtop system used for the 1.2 mL and 10 mL device, the larger skid had different void volumes, UV sensors and other signal smoothing factors. As a result, the UV signal for the 70 mL device during load and wash phase, as well as the elution peak appears slightly shifted to the right and with a lower intensity. However, this is a common challenge during scale up.
The analyzed CPP and CQA values are summarized in
Table 5. The overview of process-related parameters and product quality attributes show very high comparability. Elution concentrations of the mAbs range from 4.1 to 5.0 g L
−1, elution volumes from 4.4 to 5.1 MV and yields from 98.0 to 99.4%. These data support high scalability of the membrane when implemented into ready-to-use devices at a fixed bed height of 4 mm.
3.3. Comparability of Product Quality Attributes and Critical Process Parameters after Purification Using the Convecdiff Membrane and a Standard Resin
To compare CPP and CQA between different stationary phases, mAb 1 was purified with a standard protocol over the convecdiff membrane and a resin. For the resin, the recommended protocol from the manufacturer was chosen (
Table 3). The volume of the stationary phase used was 1.2 mL for the membrane and 1 mL for the column.
The membrane showed an average DBC
10% of 42.9 g L
−1 at 12 s residence time compared to the resin were a DBC
10% of 30.4 g L
−1 was achieved at 4 min residence time. Based on this first evaluation of the DBC
10% for each chromatographic matrix, the resin/membrane was loaded with 80% of DBC
10% to simulate common practice in the industry. This resulted in a comparable yield for both materials in the range of 94.5–96.8% in the elution fraction. In addition, impurity removal and leached ligand for both materials were within a comparable range (see
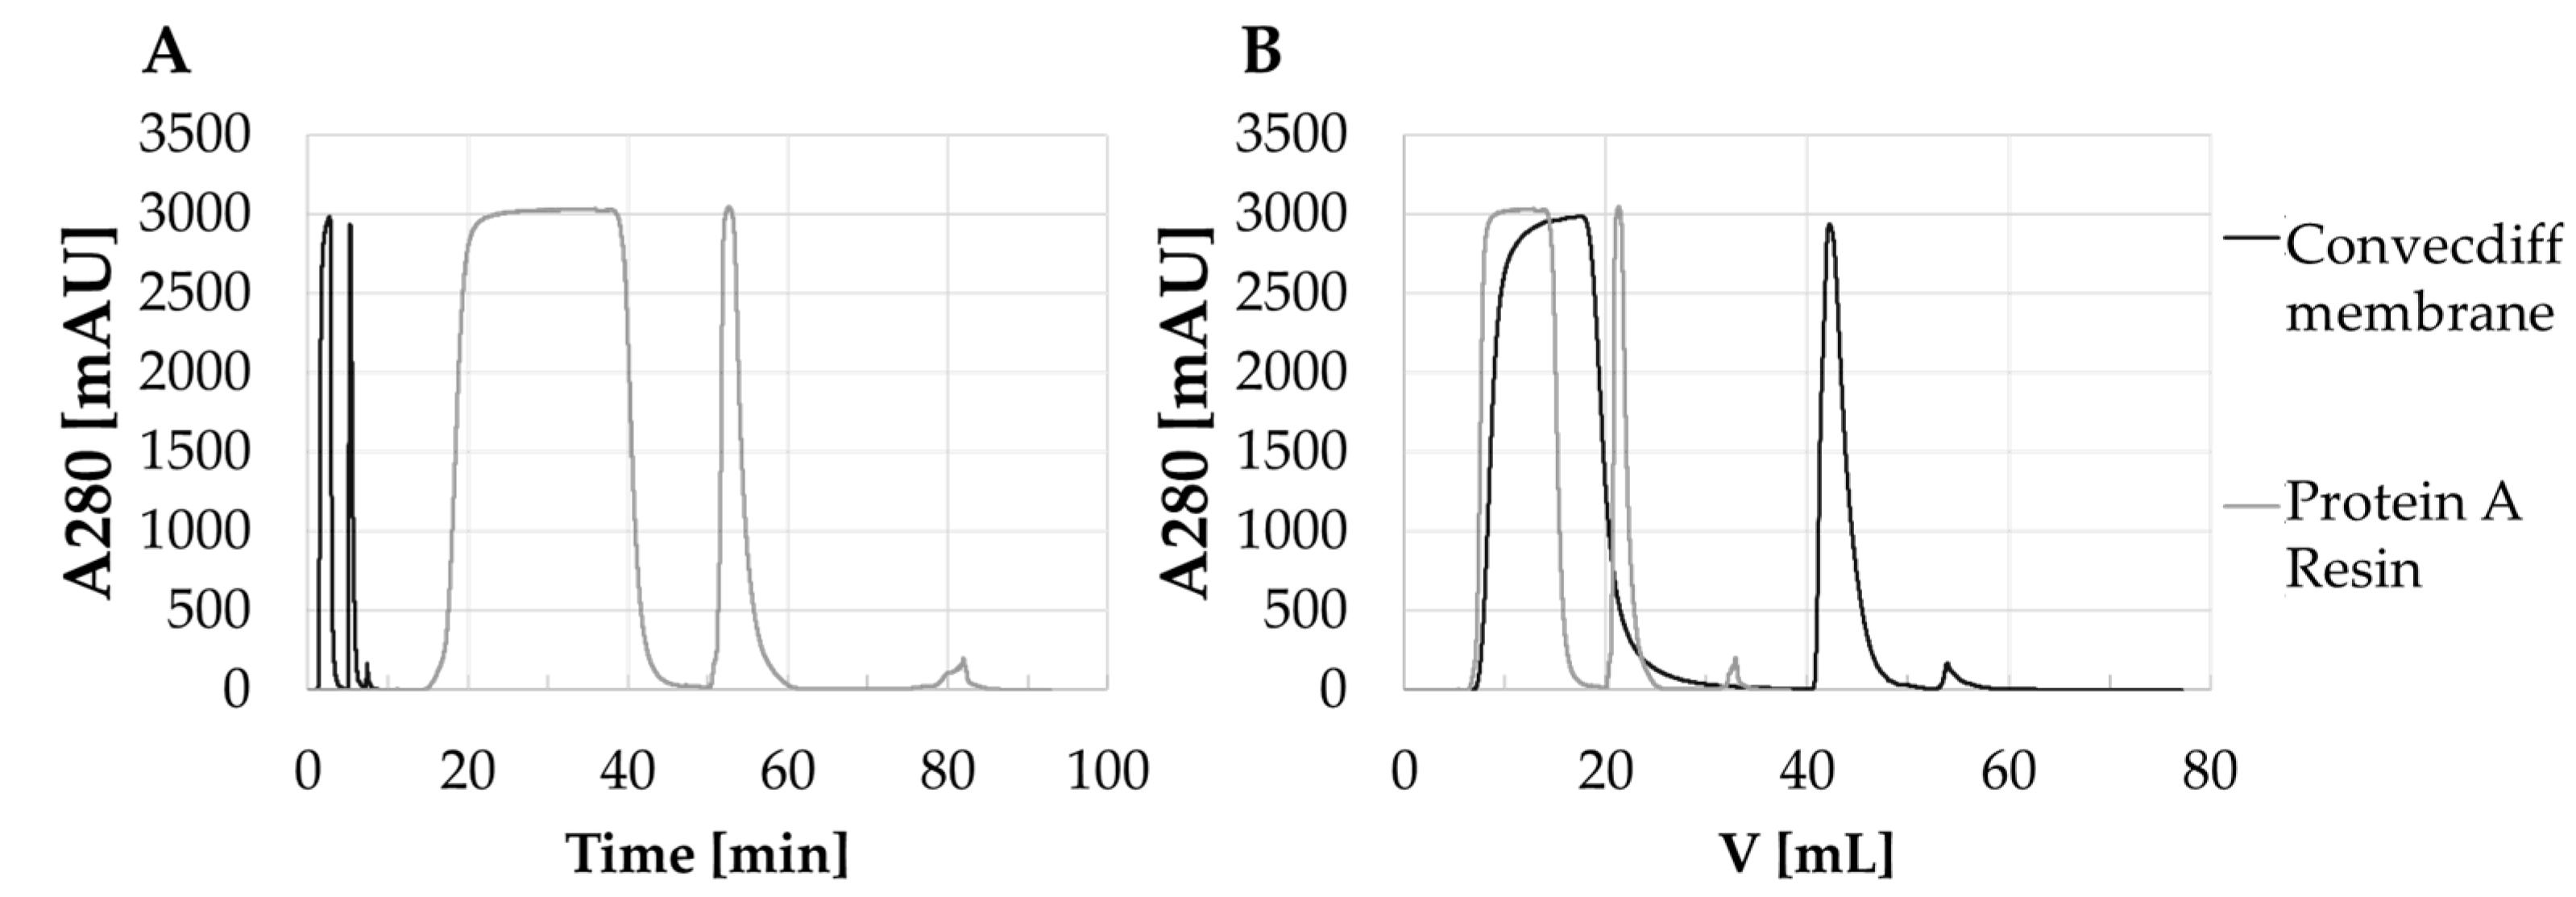
Table 6). Slightly higher LRV for hcDNA removal was detected for the membrane. However, a significant difference of both materials can be observed in the average productivity. Here, the membrane shows 14-fold higher productivity compared to the resin. As described above, this high productivity is mainly achieved by the fact that the membrane reaches similar binding capacities with a 20-times shorter residence time (higher flow rate) resulting in very short cycle times (see
Figure 5A).
Figure 5B shows the buffer consumption of both materials used to perform one purification cycle, demonstrating that the membrane required 1.74 L per g of purified mAb while the resin required 1.21 L g
mAb−1. The higher buffer consumption of the membrane compared to the resin is a result of the properties of the stationary phase and the device (higher volume of stationary phase 1.2 mL membrane vs. 1 mL resin, not considered).
3.4. Factors Influencing Productivity of the Convecdiff Membrane
After performance testing of the convecdiff membrane and experimental demonstration of the high productivity of the membrane, factors influencing productivity were analyzed to determine further optimization potential of the productivity in order to identify the sweet-spot for process implementation.
3.4.1. Influence of Residence Time (Flow Rate), Binding Capacity and Feed Titer (Cycle Time) on Productivity
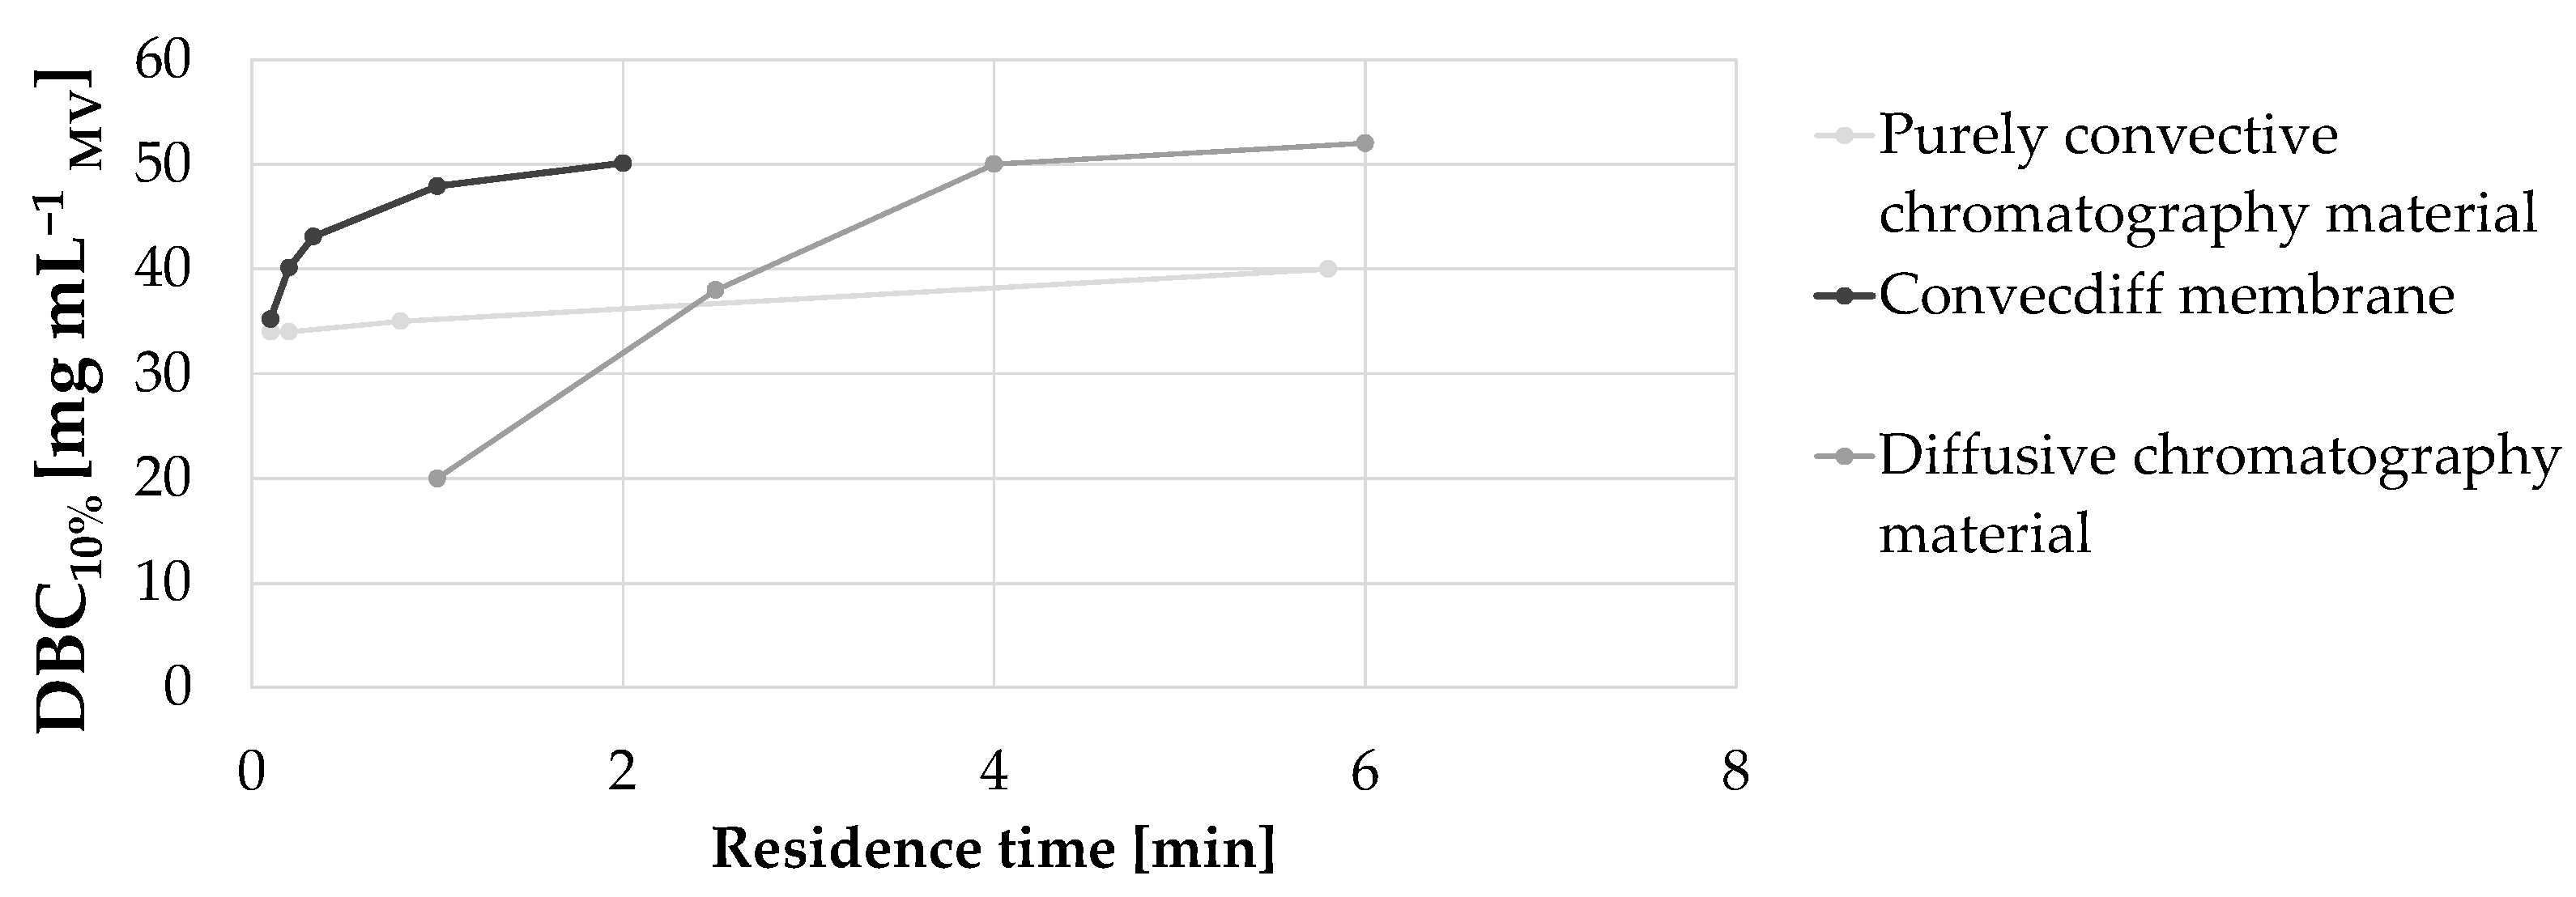
First, the dynamic binding capacity of the convecdiff membrane was experimentally determined at varying residence times (by varying the flow rate) from 12 s to 2 min (see
Figure 6). This was compared with DBC
10% data for a purely convective material and a diffusive chromatography material [
10,
11]. As shown in
Figure 6, similar to diffusion-limited resins, the convecdiff membrane showed an increase in DBC
10% when residence time was increased. A dynamic binding capacity of 50.1 mg mL
−1 at 2 min residence time and 35.2 mg mL
−1 at 0.1 min residence time was reached using this prototype. At about 1–2 min residence time, the plateau of maximum DBC
10% was achieved while resins reach the plateau at around 4–6 min of residence time. The purely convective material showed a very limited dependence of residence time on DBC
10%.
As expected, the purely convective chromatography material, like a fiber material without diffusive regions, is not limited by diffusion and, therefore, showed a very limited dependence of DBC
10% on residence time. The convecdiff and diffusive materials have diffusive regions and, therefore, exhibit a residence-time dependent binding capacity. This is caused by mass transport based on diffusion, which is a slow process, and is dominant especially inside the material, which increases by lowering the residence time or increasing the diffusive distance (particle size) [
6].
Based on this relationship between residence time and DBC
10%, the productivity was calculated as a function of the flow rate as well as product titer (see
Figure 7A). The product mass and therefore the feed volume which was required to reach the DBC
10% was calculated according to the recipe in
Table 3. Additionally, a regeneration step after each cycle was assumed.
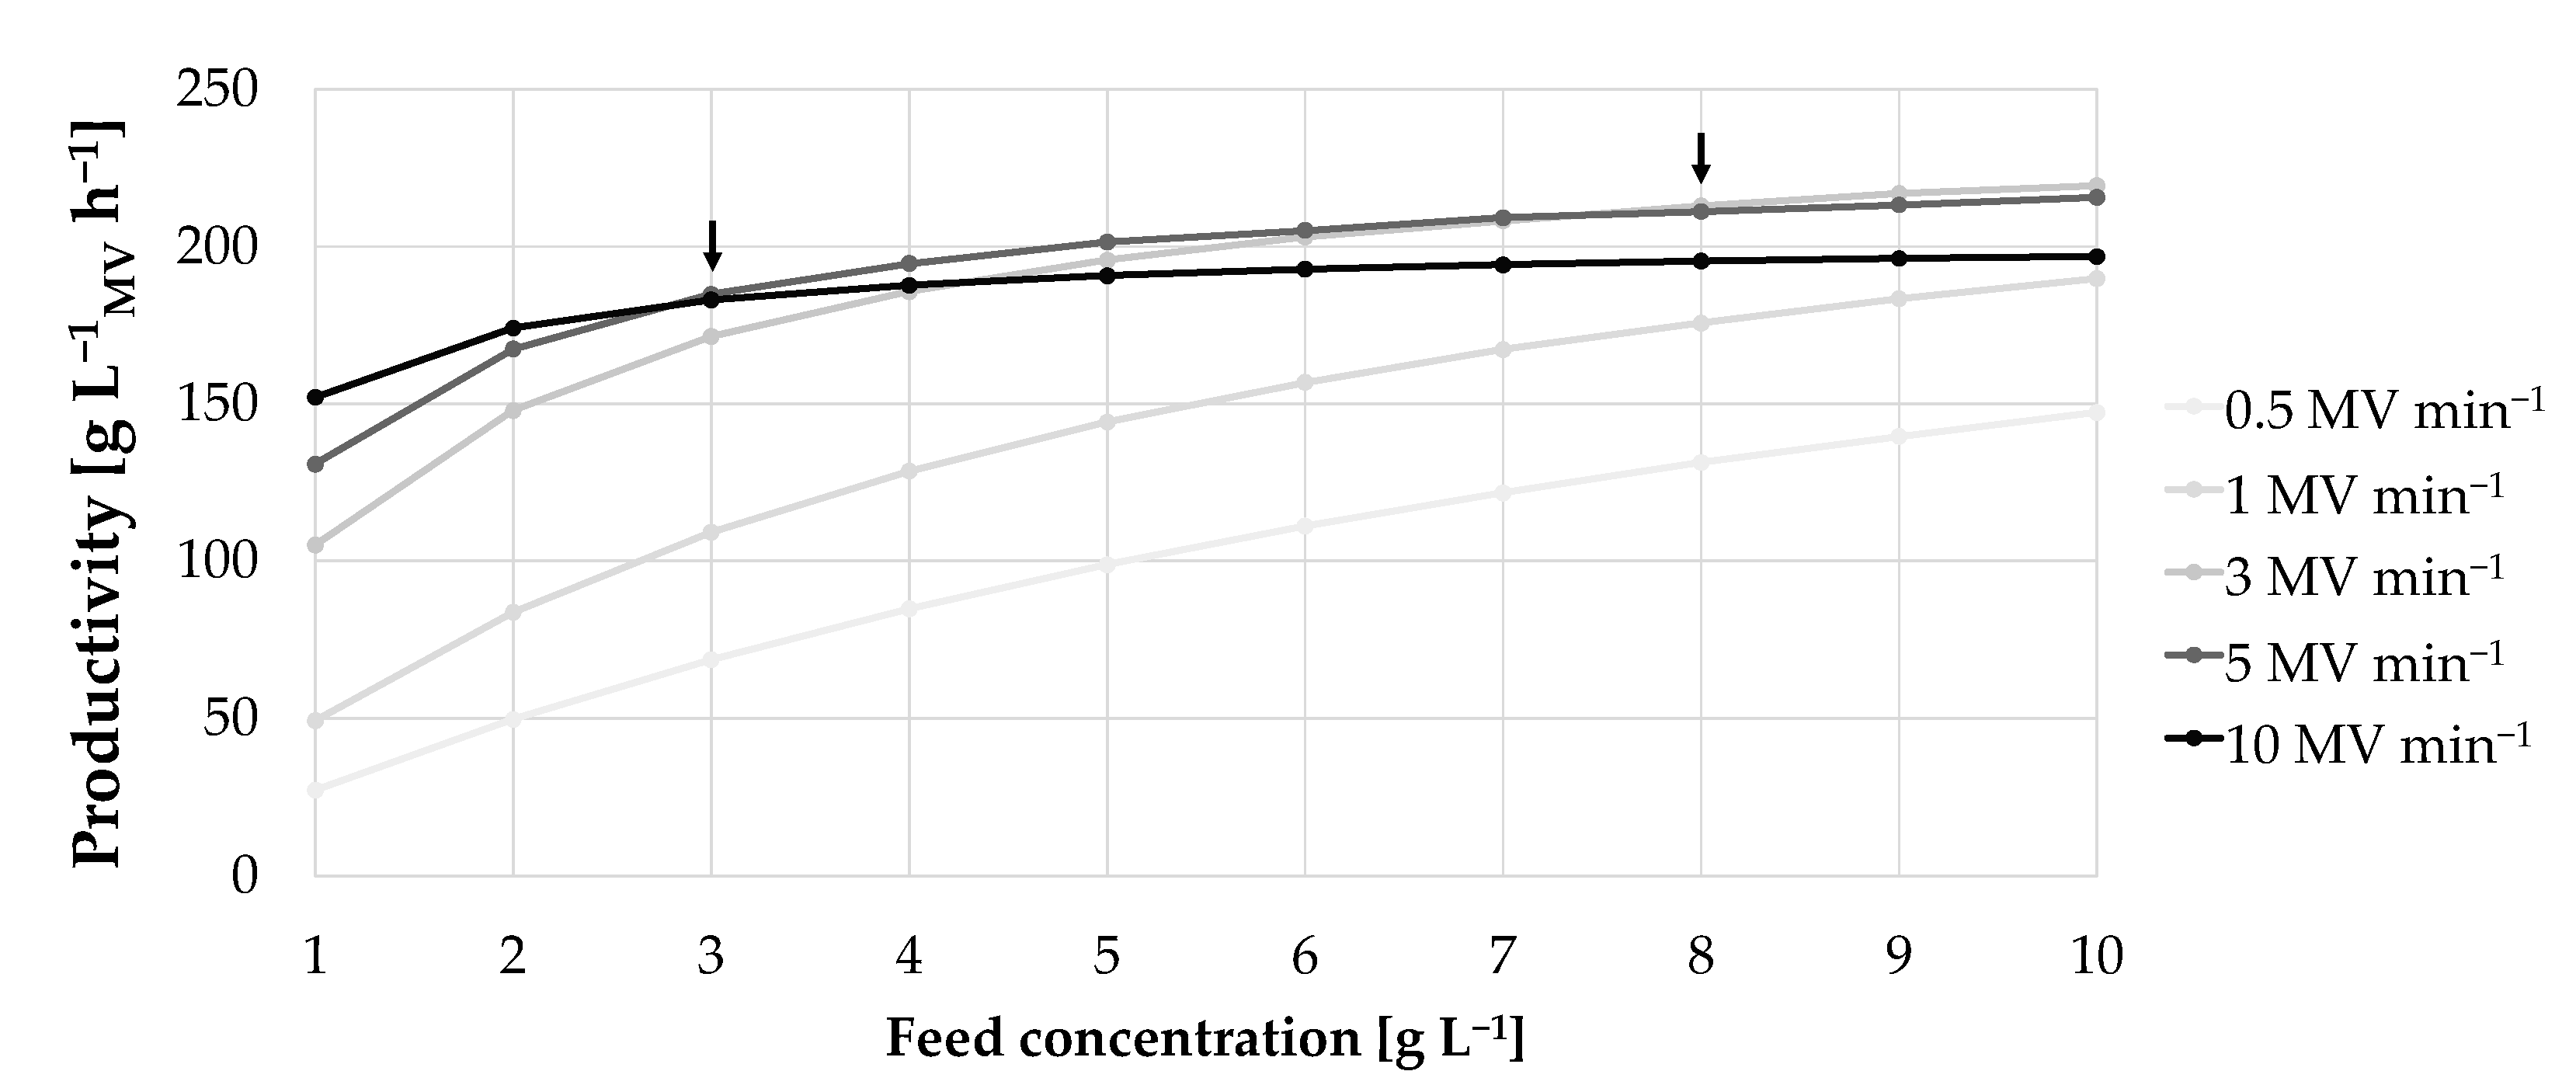
Although highest DBC
10% are obtained at high residence times and low flow rates, this combination does not automatically lead to the highest productivity, as shown in
Figure 7A. The highest productivity with 219.4 g L
−1MV h
−1 for a feed concentration of 10 g L
−1 was achieved at 3 MV min
−1. In general, with decreasing titer the optimum was achieved with increasing flow rate (productivity of 201.5 g L
−1MV h
−1 with 5 MV min
−1 flow rate and 5 g L
−1 feed concentration, as well as 152.1 g L
−1MV h
−1 at 10 MV min
−1 flow rate and 1 g L
−1 feed concentration).
Thus, for low feed concentrations, the maximum productivity was achieved with high flow rates (see
Figure 7A). This results from a decreasing cycle time when feed concentrations increase which influence the productivity (see
Figure 7B). Apparently, cycle time had a stronger effect on productivity than DBC
10%, as DBC
10% did not compensate the associated residence time. Below a feed concentration of 2 g L
−1, the respective cycle time is so high that a higher DBC
10% would increase cycle time even more and, thus, the positive effect on productivity is neglectable. From 3 g L
−1 upwards the DBC
10% starts to have a stronger effect, as shown in
Figure 8.
In summary, for a feed concentration of ≥3 g L
−1, the flow rate should be decreased from 10 MV min
−1 to 5 MV min
−1 to maximize productivity. A further reduction in the flow rate to 3 MV min
−1 is recommended for feed concentration of ≥8 g L
−1. Due to a reduction in flow rate, the DBC
10% is increased, which has a greater effect as the load phase for high feed concentrations is very short (see
Figure 7B). This indicates that if high feed concentrations are available the focus should be on optimizing the load time versus DBC
10%.
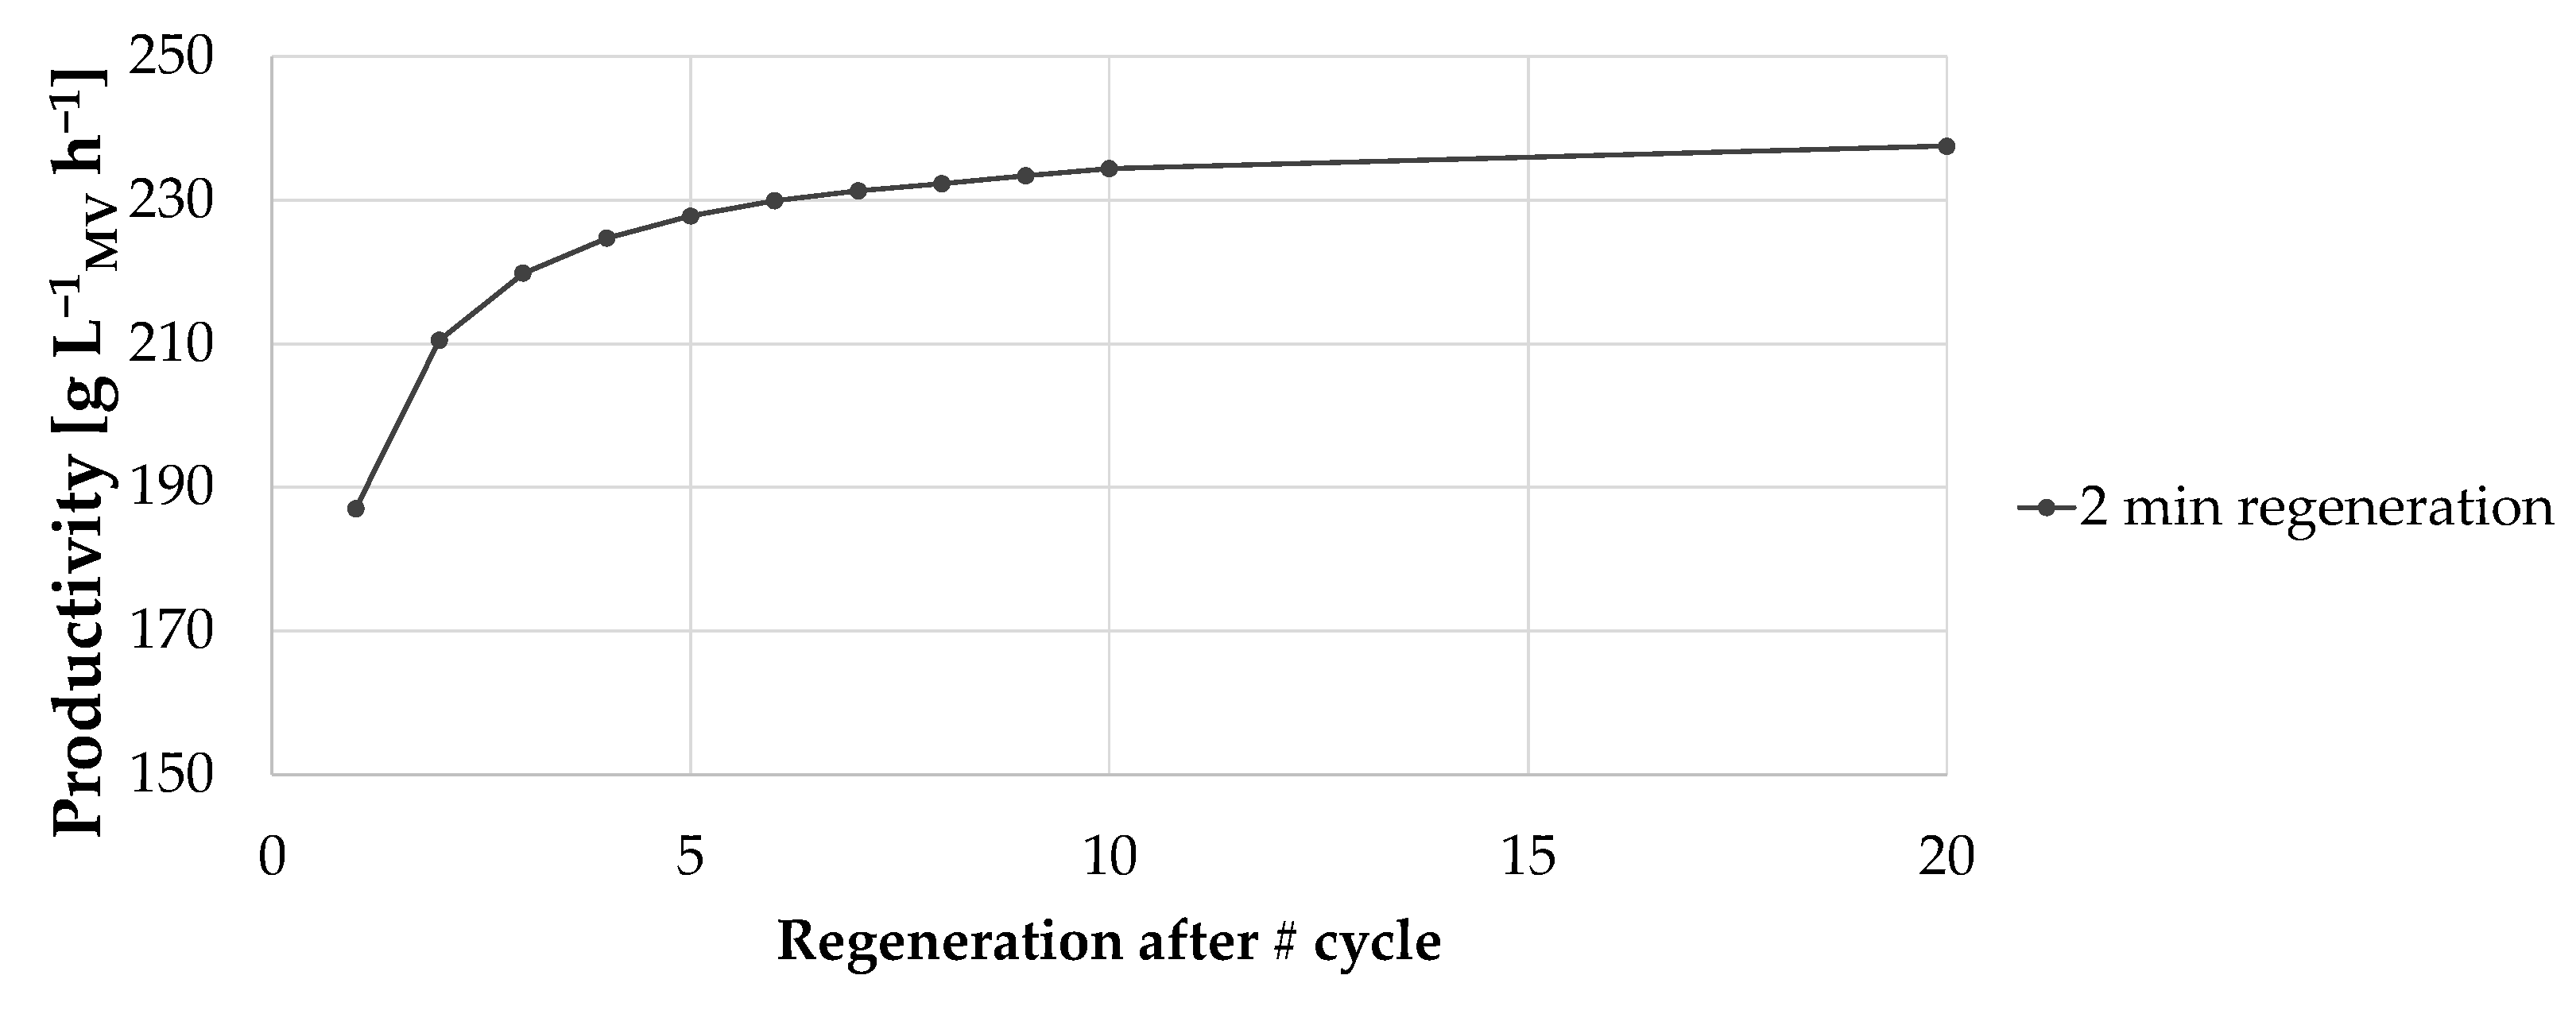
3.4.2. Influence of Regeneration Frequency and Duration on Productivity
The regeneration phase in the protocol considerably contributed to the cycle time and required additional volumes of re-equilibration buffer to prime the membrane for the next cycle. Therefore, the influence of regeneration frequency and duration on productivity was investigated.
As shown in
Figure 9, reducing regeneration frequency showed an effect on productivity only if regeneration was reduced within a limited number of cycles. A reduction beyond every 7th cycle is not recommended as the effect on productivity is negligible. The duration time of the regeneration phase had no significant effect on productivity (not shown). Due to the large pore structure of the convecdiff membrane, the regeneration interval can be reduced and, thus, productivity increased.
The findings for further improvement in productivity were summarized in
Table 7. A reduction in regeneration frequency from each cycle to every 7th cycle for the optimal conditions detected in
Section 3.4.1, leads to an additional increase in productivity of 11.8 ± 6.5%. A reduction in regeneration frequency can be achieved, e.g., when the number of impurities in the HCCF is comparatively low [
12,
13,
14].
Impurity levels and composition of HCCFs vary depending on the design of upstream processing (e.g., cell line, fermentation conditions) and cell clarification [
12,
13,
14]. In the case of an expected or measured low impurity level, a reduction in the regeneration frequency should be considered. Applying a HCCF comprising a low level of impurities, e.g., from a perfusion cultivation [
15], leads to reduced risk of fouling, enables a reduction in the regeneration intervals and, thus, leads to an increase in productivity.
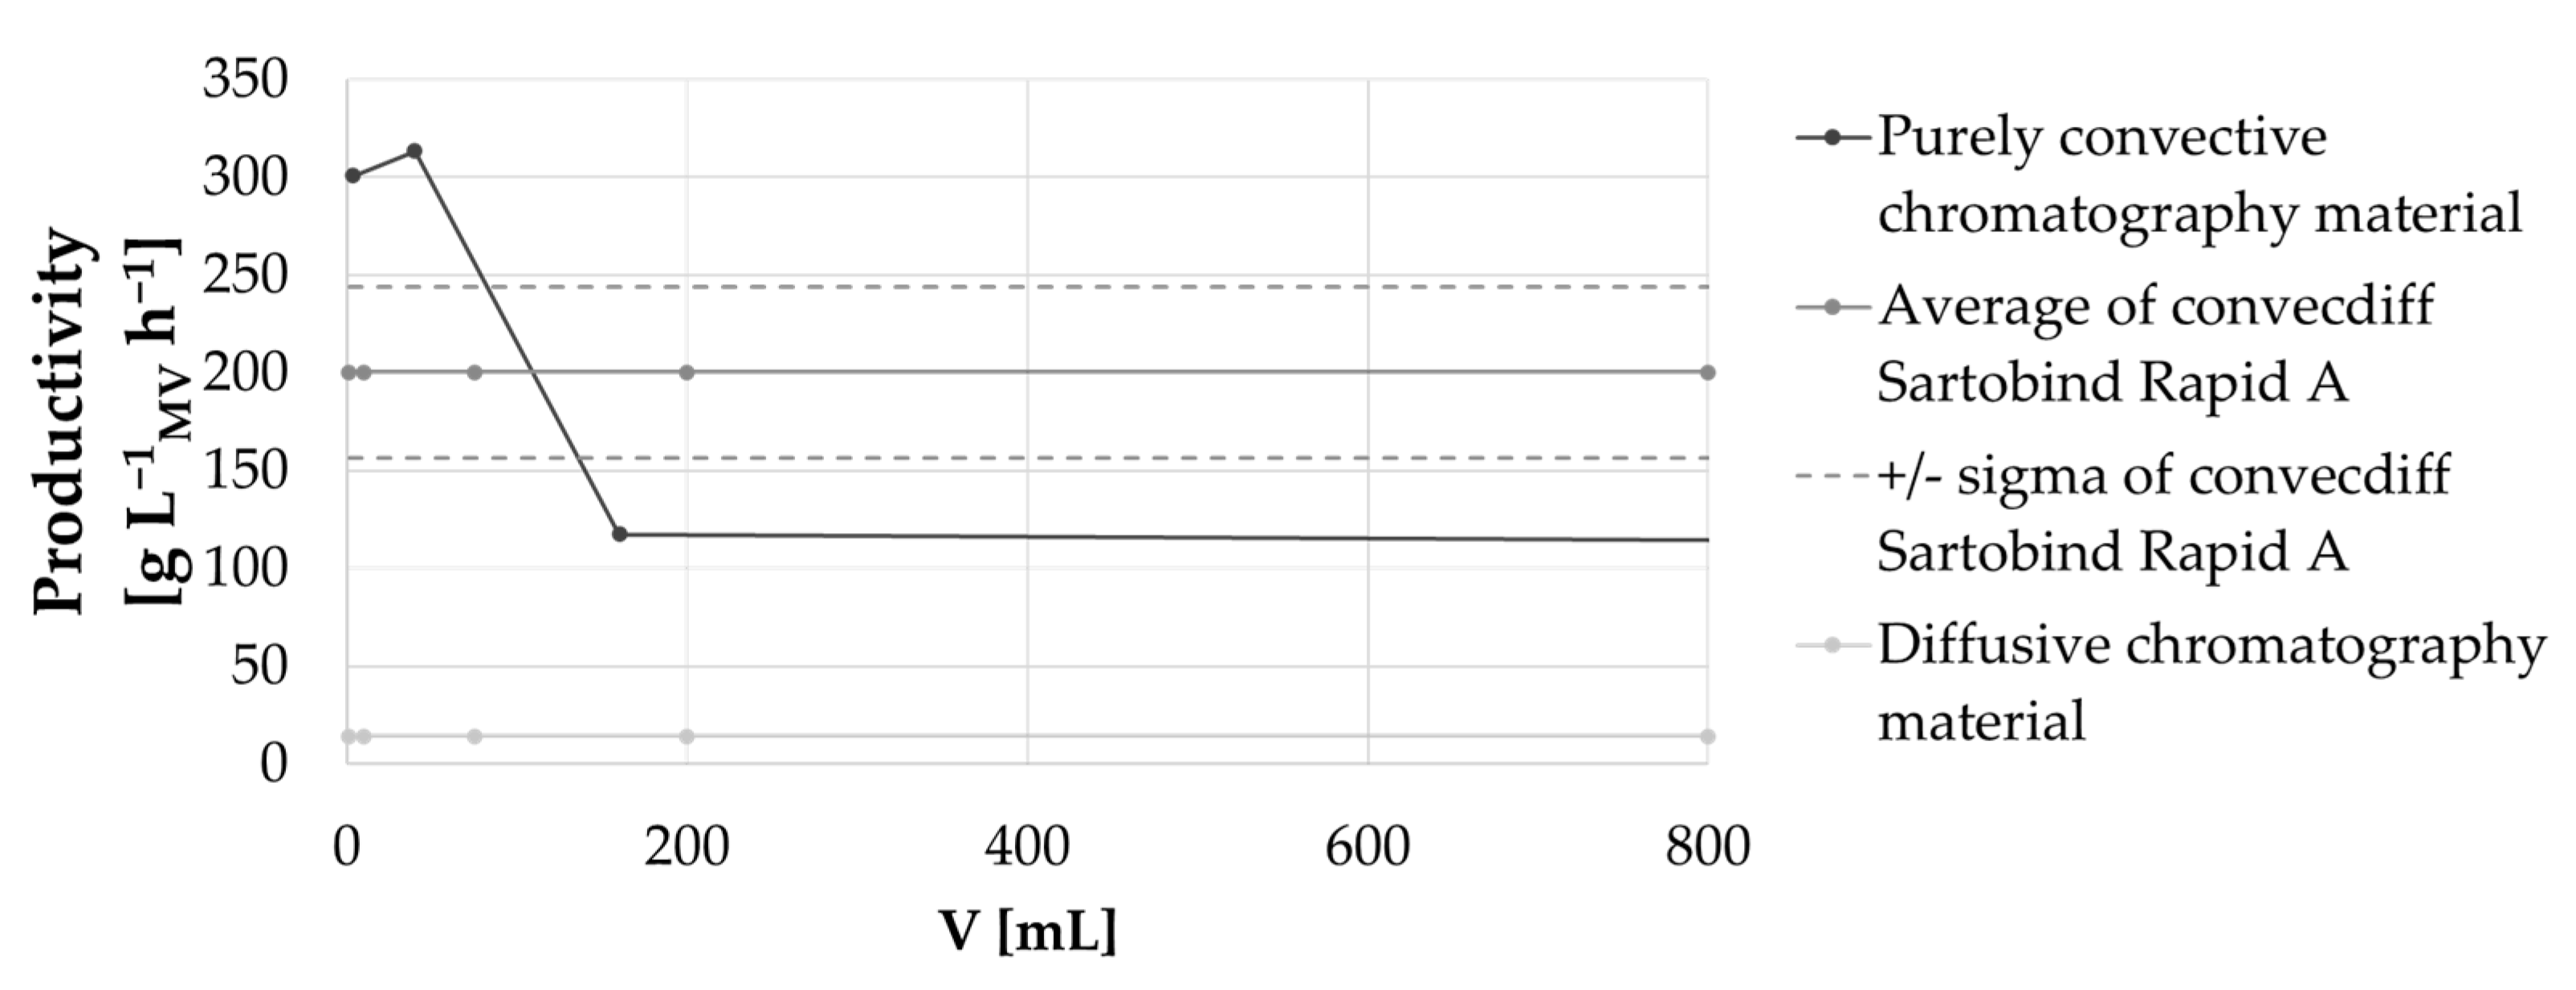
3.4.3. Productivity during Scale Up
Another important factor for process implementation of a technology is that it is easily scalable. Scalability on an experimental level was demonstrated in
Section 3.2. However, scalability of productivity is also important during scale up as optimization of productivity at small scale is only valuable if kept constant over different process scales.
As shown in
Figure 10, productivity is also slightly influenced during scale-up. Only diffusion-limited chromatography materials and the novel convecdiff membrane showed constant productivity during scale up. The purely convective fiber material showed a decrease in productivity over different device scales [
16]. This lack of scalability might result from a small pore size which requires a further adaptation of the bed height and an increase in the frontal bed surface to accommodate increasing pressure drops when MV and device size are increased.
4. Discussion
In this study, the robustness of the novel convecdiff membrane for the capture of mAbs from HCCF was demonstrated. For four different mAbs, the CCP and CQA were analyzed, demonstrating that there is no membrane-related decrease in performance over 200 cycles. As the convecdiff membrane consists of a novel structure (mass transport that is not primarily driven by diffusion but also not purely by convection), as well as very low bed heights in adsorbers, evaluation of the robustness of the membrane in a housing cannot be tested in the same way that packed beds in columns with HETP or plate number would be [
17]. The preservation of binding capacity (measured with yield), the pressure behavior, impurity removal and leached ligand, as well as elution volume were, therefore, assessed for membrane lifetime over 200 cycles. These parameters are indicators of robustness and fouling propensity of the protein A stationary phases [
18,
19].
The parameters analyzed for the four different mAbs varied within a very narrow range over the entire number of cycles. The integrity of the stationary phase was maintained over 200 cycles. This revealed that the fouling propensity of the membrane adsorber is very low. The fouling process was minimized by adding a short regeneration/cleaning step after each bind and elute cycle. This also indicated that the ligand was stable to repeated mild caustic exposure. Protein A ligands tend to undergo hydrolysis during caustic exposure which also typically leads to loss of binding capacity and yield [
9,
20]. The lowest yields in this study using the convecdiff membrane were observed for the experiments with the highest load density. Besides this, yield was constant over 200 cycles. Slight decreases in yield in the study of mAb 3 were related to changes in the feed constitution. Between cycle 130 and 140, the feed showed an increase in aggregate formation, indicating that the holding time of the HCCF was exceeded under the applied conditions. A lower yield rate for mAb 4 compared to the other mAbs seemed to be a result of the chosen elution conditions (elution mAbs 1–3: pH 2.9 ± 0.1; mAb 4: pH 3.2 ± 0.1). Since pH reduction is the main driver for the release of a mAb from protein A, the lower pH elution buffer resulted in better elution performance and, thus, higher yields. Some mAbs aggregate at lower pH (this did not occur in this study, see
Table 4), therefore, a higher pH was tested.
Scalability of the membrane implemented into different ready-to-use device sizes was demonstrated considering both CQA and CPP in respect to 10 mL and 70 mL membrane volume (and 200 mL MV, data not shown). This allows for process development at a small scale, as well as its scale-up or process validation (scale-down). The higher buffer consumption, as well as elution volume and concentration resulted from a non-optimized protocol. In addition, an effect on buffer consumption and elution volume comes from the mass transport in the membrane which does not solely rely on diffusion, the device design of the membrane housing, different fluid dynamic properties of the stationary phase and a not-preferable low ratio of stationary phase to void volumes (chromatography system, tubing connections). Assuming a back mixing of 100 mL for a 2 L column or a 70 mL membrane, the back mixing ratio for the adsorber is disadvantageous for the membrane. However, this effect is leveled out for larger membrane volumes.
Compared to resin beads as the stationary phase in chromatography, the convecdiff membrane showed very similar CPP and CQA results. The investigated parameters differ slightly in terms of impurity reduction and ligand leaching. It should be emphasized that, for the chosen HCCF (mAb 1), the binding capacity of the membrane adsorber was significantly higher at a lower residence time compared to the resin. The convecdiff mass transfer in the protein A membrane allowed very short residence times without substantial losses in binding capacity. As a result, a 14-fold higher productivity of the convecdiff membrane compared to the standard resin was achieved. This is an increasingly important aspect in the purification of biopharmaceuticals, enabling substantial cost, time and space savings, as well as process intensification of future processes [
21,
22,
23].
However, productivity is influenced by different factors such as cycle time, feed concentration and dynamic binding capacity. Providing that the novel convecdiff membrane also showed a dependency of DBC on residence time, productivity can be maximized by determining the best combination of those three influencing factors. The modulation of productivity for the convecdiff membrane revealed that low feed titers exhibit the highest productivities at high flow rates as, in this study, cycle time had the strongest influence on productivity. For feed titers larger than 3 g L−1, flow rates in the range of 5 MV min−1 revealed the highest productivities. High feed titers (beyond 8 g L−1) cause a very short load phase, therefore, a reduction in flow rate by concurrently improving DBC10% is preferable to maximize productivity. We also demonstrated that a reduction in the regeneration frequency will support further productivity increases. However, a reduction in the regeneration frequency is highly dependent on the feed conditions and contaminant levels, and this will have an impact on fouling of the membrane and might reduce the lifetime of the membrane. A first indication of membrane fouling is an increase in pressure. For HCCFs with low contaminant levels, the convecdiff membrane still shows constant performance over 300 consecutive cycles (data not shown). The large convective pores in the membrane and the low propensity of the material for unspecific binding allow for a reduction in the regeneration regime.
It is recommended to optimize productivity for each feed to best utilize the convecdiff membrane when implemented into processes. The higher the productivity is, the better will be the utilization of membrane capacity and time. In addition, we demonstrated constant productivity over different device sizes at a fixed bed height, which enables easy scalability.
In summary, this novel convecdiff membrane technology will solve the bottleneck of the mAb capture step in downstream processes of monoclonal antibodies. Provided in ready-to-use devices, it will reduce hands-on time to prepare packed bed columns. The short cycle times enable lifetime utilization of the membrane within one batch.
5. Conclusions
State of the art protein A materials still represent the workhorse as they offer the best compromise between high regulatory acceptance and specificity despite high costs. Certainly, in terms of costs and process intensification, they leave considerable room for improvement. Some efforts are being made to improve productivity and reduce the cost of resins using a multicolumn approach. However, this makes the mAb capture step very complex and prone to risks. In both cases, relatively large volumes of resins to purify a batch are required and the columns are re-used over multiple batches to lower cost which, in turn, adds a high risk of a bioburden event to the process and the product.
With this new technology, two main pain-points of the industry can be eliminated: first, packed bed chromatography and potential failure of it are avoided; second, re-use of those columns to make them economically viable. In addition, this new ready-to-use and disposable alternative will provide cost benefits in low number processes, where resins are typically underutilized, such as clinical scale processes and molecules with a low yearly demand. Human resources can focus on high-value tasks since column packing and cleaning validation are obsolete. Further, from a regulatory perspective, this technology will allow savings in processes as bed failure events, bioburden issues and cross-contamination between batches will be minimized.
Author Contributions
Conceptualization, M.G., K.B.K., K.T. and R.A.B.; methodology, M.G., K.T. and K.B.K.; formal analysis, M.G., K.T. and K.B.K.; investigation, M.G., K.B.K. and R.A.B.; writing—original draft preparation, M.G., K.B.K. and R.A.B.; writing—review and editing, M.G., K.B.K. and R.A.B.; visualization, K.B.K. All authors have read and agreed to the published version of the manuscript.
Funding
This research received no external funding.
Institutional Review Board Statement
Not applicable.
Informed Consent Statement
Not applicable.
Acknowledgments
We would like to acknowledge Imme van der Kamp and Cornelia Lindner from Cellca GmbH (Ulm, Germany) for providing us HCCF for this study. Arne Bluma, Franziska Krumbein and Martin Leuthold for their support to conduct this study. Nelli Marks and Enno Große Wichtrup for experimental support. The team of Volkmar Thom and Thomas Loewe for providing prototypes and technical support. In addition, we would like to thank Fabien Rousset, Martin Leuthold and Christian Koehler for review of the final draft (all are employees of Sartorius Stedim Biotech GmbH, Goettingen, Germany).
Conflicts of Interest
The authors declare no conflict of interest.
References
- Matuszczyk, J.C.; Lemke, J.; Schulze, M.; Janoschek, S.; Zijlstra, G.; Greller, G.; Grone, D. Intensified Seed Train Strategy for Faster, Cost-Effective Scale-Up of Biologics Manufacturing. Bioprocess Int. 2020, 18, 62–64. [Google Scholar]
- Somasundaram, B.; Pleitt, K.; Shave, E.; Baker, K.; Lua, L.H.L. Progression of continuous downstream processing of monoclonal antibodies: Current trends and challenges. Biotechnol. Bioeng. 2020, 115, 2893–2907. [Google Scholar] [CrossRef] [PubMed]
- Feidl, F.; Luna, M.F.; Podobnik, M.; Vogg, S.; Angelo, J.; Potter, K.; Wiggin, E.; Xu, X.; Ghose, S.; Li, Z.J.; et al. Model based strategies towards protein A resin lifetime optimization and supervision. J. Chromatogr. A 2020, 1625, 461261. [Google Scholar] [CrossRef] [PubMed]
- Mothes, B.; Pezzii, J.; Schroeder-Tittman, K.; Villain, L. Accelerated, Seamless Antibody Purification. Bioprocess Int. 2016, 14, 34–58. [Google Scholar]
- Cytiva. Process-Economy Simulation of mAb Capture Step with MabSelect™ PrismA Protein A Chromatography Resin; Application Note CY14070-03 2020; Cytiva: Uppsala, Sweden, 2020. [Google Scholar]
- Toeppner, K.; Adametz, P.; Goodwine, C.; Busse, R.A.; Thom, V. Purification of antibodies using novel convecdiff membranes, combining high binding capacity with high productivity and scalability. 2022; under review. [Google Scholar]
- Ley, A.; Petersen, R.; Taft, F.; Adametz, P.; Thiefes, A.; Toeppner, K.; Weber, S.; Gehrmann, N.; Hagemann, F.; Thom, V. Chromatographic Material and Method of Producing the Same. European Patent Application No. EP 4019125, 29 June 2022. [Google Scholar]
- Sambrook, J.; Maniatis, T.; Russel, D.W. Molecular Cloning: A Laboratory Manual, 3rd ed.; Cold Spring Harbor Laboratory Press: New York, NY, USA, 2001; ISBN 0-8796-9577-3. [Google Scholar]
- Gupte, P.M.; Gavasane, M.; Kambli, A.; Bhadal, T.; Cheulkar, S. Dynamic Binding Capacities of Protein A Resins for Antibody Capture. Bioprocess Int. 2020, 18, 34–38. [Google Scholar]
- Cytiva. MabSelectTM PrismA; Data Sheet CY553-17Sep20-DF; Cytiva: Uppsala, Sweden, 2020. [Google Scholar]
- Cytiva. HiTrap™ Fibro PrismA and HiScreen™ Fibro PrismA Units; Data Sheet CY7145-08Apr20-DF; Cytiva: Uppsala, Sweden, 2020. [Google Scholar]
- Tscheliessnig, A.L.; Konrath, J.; Bates, R.; Jungbauer, A. Host cell protein analysis in therapeutic protein bioprocessing—Methods and applications. Biotechnol. J. 2013, 8, 655–670. [Google Scholar] [CrossRef] [PubMed]
- Horak, J.; Ronacher, A.; Lindner, W. Quantification of immunoglobulin G and characterization of process related impurities using coupled Protein A and size exclusion high performance liquid chromatography. J. Chromatogr. A 2010, 1217, 5092–5102. [Google Scholar] [CrossRef] [PubMed]
- Gupta, A.; Amara, J.P.; Gousseinov, E.; Cacace, B. Chapter 6—Recent advances in harvest clarification for antibodies and related products. In Approaches to the Purification, Analysis and Characterization of Antibody-Based Therapeutics; Allan, M., Ed.; Elsevier: Amsterdam, The Netherlands, 2020; pp. 117–136. [Google Scholar]
- Walther, J.; Lu, J.; Hollenbach, M.; Yu, M.; Hwang, C.; McLarty, J.; Brower, K. Perfusion Cell Culture Decreases Process and Product Heterogeneity in a Head-to-Head Comparison With Fed-Batch. Biotechnol. J. 2019, 14, e1700733. [Google Scholar] [CrossRef] [PubMed]
- Zolyomi, R.; Scanlon, I.; Rusly, F.; Hardick, O.; Hesslein, A.; Tjandra, H. Bayer Evaluates Fibro for Scalable Single-Use mAb Purification. Available online: https://www.bioprocessonline.com/doc/bayer-evaluates-fibro-for-scalable-single-use-mab-purification-0001 (accessed on 31 May 2022).
- Scharl, T.; Jungreuthmayer, C.; Dürauer, A.; Schweiger, S.; Schröder, T.; Jungbauer, A. Trend analysis of performance parameters of pre-packed columns for protein chromatography over a time span of ten years. J. Chromatogr. A 2016, 1465, 63–70. [Google Scholar] [CrossRef] [PubMed] [Green Version]
- Steinmeyer, D.E.; McCormick, E.L. The art of antibody process development. Drug Discov. Today 2008, 13, 613–618. [Google Scholar] [CrossRef] [PubMed]
- Rathore, A.; Pathak, M.; Ma, G.; Bracewell, D.G. Re-use of Protein A Resin: Fouling and Economics. BioPharm Int. 2015, 28, 28–33. [Google Scholar]
- Hale, G.; Drumm, A.; Harrison, P.; Phillips, J. Repeated cleaning of protein A affinity column with sodium hydroxide. J. Immunol. Methods 1994, 171, 15–21. [Google Scholar] [CrossRef]
- Tugcu, N.; Roush, D.J.; Göklen, K.E. Maximizing productivity of chromatography steps for purification of monoclonal antibodies. Biotechnol. Bioeng. 2008, 99, 599–613. [Google Scholar] [CrossRef] [PubMed]
- Gjoka, X.; Gantier, R.; Schofield, M. Transfer of a three step mAb chromatography process from batch to continuous: Optimizing productivity to minimize consumable requirements. J. Biotechnol. 2017, 242, 11–18. [Google Scholar] [CrossRef] [PubMed]
- Armstrong, A.; Horry, K.; Cui, T.; Hulley, M.; Turner, R.; Farid, S.S.; Goldrick, S.; Bracewell, D.G. Advanced control strategies for bioprocess chromatography: Challenges and opportunities for intensified processes and next generation products. J. Chromatogr. A 2021, 1639, 461914. [Google Scholar] [CrossRef] [PubMed]
Figure 1.
Overlays of UV traces of 200 bind and elute cycles of mAbs 1–4 (A–D) using novel convecdiff membrane. Shown is an overlay of every 20th cycle for each experiment.
Figure 1.
Overlays of UV traces of 200 bind and elute cycles of mAbs 1–4 (A–D) using novel convecdiff membrane. Shown is an overlay of every 20th cycle for each experiment.
Figure 2.
Overlays of pressure traces of 200 bind and elute cycles of mAbs 1–4 (A–D). Shown is an overlay of every 20th cycle for each experiment.
Figure 2.
Overlays of pressure traces of 200 bind and elute cycles of mAbs 1–4 (A–D). Shown is an overlay of every 20th cycle for each experiment.
Figure 3.
Capability of convecdiff membrane to reduce (A) HCP and (B) hcDNA (log reduction value; LRV) over 200 cycles. Shown is LRV for every 20th cycle (cycle 60 for HCP was not measured). HCCF values for each mAb: mAb 1 (HCP = 54004 ppm, hcDNA = 2320 ppm); mAb 2 (HCP = 48,158 ppm, hcDNA = 4873 ppm); mAb 3 (HCP = 20,233 ppm, hcDNA = 2360 ppm) and mAb 4 (HCP = 10,305 ppm, hcDNA = 4750 ppm).
Figure 4.
Overlays of UV traces from exemplarily bind and elute cycles of mAb 1 implemented into three different device sizes.
Figure 4.
Overlays of UV traces from exemplarily bind and elute cycles of mAb 1 implemented into three different device sizes.
Figure 5.
Comparison of (A) cycle time and (B) volumes of one single cycle of mAb capture with protein A resin versus convecdiff membrane adsorber.
Figure 5.
Comparison of (A) cycle time and (B) volumes of one single cycle of mAb capture with protein A resin versus convecdiff membrane adsorber.
Figure 6.
DBC
10% as a function of residence time for several commercially-available materials and the convecdiff membrane prototype. The convecdiff membrane prototype (1.2 mL MV and 4 mm bed height), as well as some of the other membranes/materials were tested internally. All other data points are taken from competitor [
6,
10,
11].
Figure 7.
(A) Productivity as a function of product titer and flow rate during load for the convecdiff membrane prototype. Data points are based on internally investigations and calculations. (B) Cycle time in dependency to feed concentration.
Figure 7.
(A) Productivity as a function of product titer and flow rate during load for the convecdiff membrane prototype. Data points are based on internally investigations and calculations. (B) Cycle time in dependency to feed concentration.
Figure 8.
Productivity as a function of feed concentration at different flow rates during the load phase.
Figure 8.
Productivity as a function of feed concentration at different flow rates during the load phase.
Figure 9.
Productivity in dependency to the regeneration frequency, exemplary shown for low feed titer. Black dots constitute a regeneration duration of 2 min.
Figure 9.
Productivity in dependency to the regeneration frequency, exemplary shown for low feed titer. Black dots constitute a regeneration duration of 2 min.
Figure 10.
Productivity as a function of membrane/column volume for different categories of chromatographic materials. For the convecdiff membrane, an average value from this study is shown, as well as the range of the obtained productivities.
Figure 10.
Productivity as a function of membrane/column volume for different categories of chromatographic materials. For the convecdiff membrane, an average value from this study is shown, as well as the range of the obtained productivities.
Table 1.
Buffers utilized for the chromatographic experiments.
Table 1.
Buffers utilized for the chromatographic experiments.
| Buffer | Phase | Ingredients | pH |
|---|
| PBS | (Re-)equilibration, wash | 1 × PBS [8] | 7.4 ± 0.2 |
| Elution-buffer | Elution | 0.1 M acetic acid,
150 mM NaCl | 2.9 ± 0.1 1
3.2 ± 0.1 2 |
| Reg-buffer | Regeneration/cleaning | 0.2 M NaOH | >12.5 |
Table 2.
Monoclonal antibodies and their properties.
Table 2.
Monoclonal antibodies and their properties.
| Molecule | Class | pI | MW (kDa) |
|---|
| mAb1 | Antibody IgG1 | 8.36 | 145.41 |
| mAb2 | Antibody IgE | 7.33 | 146.50 |
| mAb3 | Antibody IgG1 | 8.09 | 146.53 |
| mAb4 | Antibody IgG1 | 8.68 | 145.23 |
Table 3.
Chromatography recipes for one cycle of mAb capture with convecdiff membrane versus resin.
Table 3.
Chromatography recipes for one cycle of mAb capture with convecdiff membrane versus resin.
| | Convecdiff Membrane | Protein A Resin |
|---|
| Phase | V (MV) | Flowrate (MV min−1) | V (CV) | Flowrate (CV min−1) |
|---|
| Equilibration | 5 | 10 | 5 | 0.5 |
| Load (g L−1) | 34.4 | 5 | 24.3 | 0.3 |
| Wash | 12 | 10 | 6 | 0.5 |
| Elution | 12 1 | 5 | 12 1 | 0.5 |
| Regeneration | 9–10 2 | 5 | 2 | 0.2 |
| Re-Equilibration | 15–16 3 | 10 | 6 | 0.5 |
| av. cycle time (min) | - | 9.6 | - | 100.4 |
Table 4.
Overview of process-related parameters and product quality attributes.
Table 4.
Overview of process-related parameters and product quality attributes.
| | mAb 1 | mAb 2 | mAb 3 | mAb 4 |
|---|
| Titer (g L−1) | 3.12 | 2.25 | 3.50 | 4.30 |
| DBC (g L−1) | 42.2 | 41.8 | 54.3 | 49.9 |
| Load 1 (g L−1) | 32.8 | 32.6 | 42.0 | 38.7 |
| Yield (%) | 95.7 ± 1.3 | 96.3 ± 2.6 | 92.1 ± 1.6 2
88.3 ± 7.7 3 | 87.3 ± 1.7 |
| Monomer (%) | >99.5 | >99.5 | 99.0 2
97.5 3 | >99.5 |
| HCP reduction (LRV) | 2.2 ± 0.1 | 2.4 ± 0.1 | 1.5 ± 0.2 2 | 1.8 ± 0.1 |
| hcDNA reduction (LRV) | 2.8 ± 0.1 | 2.8 ± 0.1 | 2.8 ± 0.2 2 | 2.6 ± 0.2 |
| Protein A leached (ppm) | 2.7 ± 0.7 | -4 | - 4 | 2.8 ± 0.3 |
| av. Productivity (g L−1 h−1) | 167.7 | 160.3 | 204.7 1
196.2 2 | 206.9 |
Table 5.
Overview of process-related parameters and product quality attributes.
Table 5.
Overview of process-related parameters and product quality attributes.
| | 1.2 mL Device | 10 mL Device | 70 mL Device |
|---|
| Load * (g L−1) | 25.0 | 25.0 | 25.0 |
| Yield (%) | 98.0 ± 2.5 | 98.8 ± 0.3 | 99.4 ± 1.9 |
| HCP reduction (LRV) | 2.2 ± 0.2 | - | 2.3 ± 0.1 |
| hcDNA reduction (LRV) | 2.8 ± 0.2 | - | 2.8 ± 0.1 |
| Elution volume (MV) | 4.4 | 4.1 | 5.1 |
| av. Productivity (g L−1 h−1) | 141.4 | 142.5 | 143.4 |
Table 6.
CPP and CQA of mAb 1 purified with convecdiff membrane and standard resin.
Table 6.
CPP and CQA of mAb 1 purified with convecdiff membrane and standard resin.
| | Convecdiff Membrane | Protein A Resin |
|---|
| DBC10% (g L−1) | 42.9 ± 0.8 | 30.4 ± 0.5 |
| Residence time (min) | 0.2 | 4.0 |
| Yield (%) | 94.7 ± 0.2 | 96.4 ± 0.4 |
| HCP reduction (LRV) | 2.2 ± 0.2 | 2.3 ± 0.1 |
| hcDNA reduction (LRV) | 2.9 ± 0.2 | 2.3 ± 0.1 |
| Protein A leached (ppm)] | 2.7 ± 0.7 | 6.7 ± 0.3 |
| av. productivity (g L−1 h−1) | 203.6 | 14.1 |
Table 7.
Highest productivity to be achieved in dependency of titer, flow rate during load, DBC10% and CIP frequency.
Table 7.
Highest productivity to be achieved in dependency of titer, flow rate during load, DBC10% and CIP frequency.
| Regeneration | Productivity (g LMV−1 h−1) |
|---|
Titer = 1 g L−1
(Load = 10 MV min−1, DBC10% = 35.2 mg mL−1) | Titer = 5 g L−1
(Load = 5 MV min−1, DBC10% = 40.1 mg mL−1) | Titer = 10 g L−1
(Load = 3 MV min−1, DBC10% = 43.1 mg mL−1) |
|---|
| Each cycle | 152.1 | 201.5 | 219.4 |
| Every 7th cycle | 181.5 | 248 | 271 |
| Publisher’s Note: MDPI stays neutral with regard to jurisdictional claims in published maps and institutional affiliations. |
© 2022 by the authors. Licensee MDPI, Basel, Switzerland. This article is an open access article distributed under the terms and conditions of the Creative Commons Attribution (CC BY) license (https://creativecommons.org/licenses/by/4.0/).


