Graphene Oxide-Based Membranes for Water Purification Applications: Effect of Plasma Treatment on the Adhesion and Stability of the Synthesized Membranes


 , ,
, ,  and
and 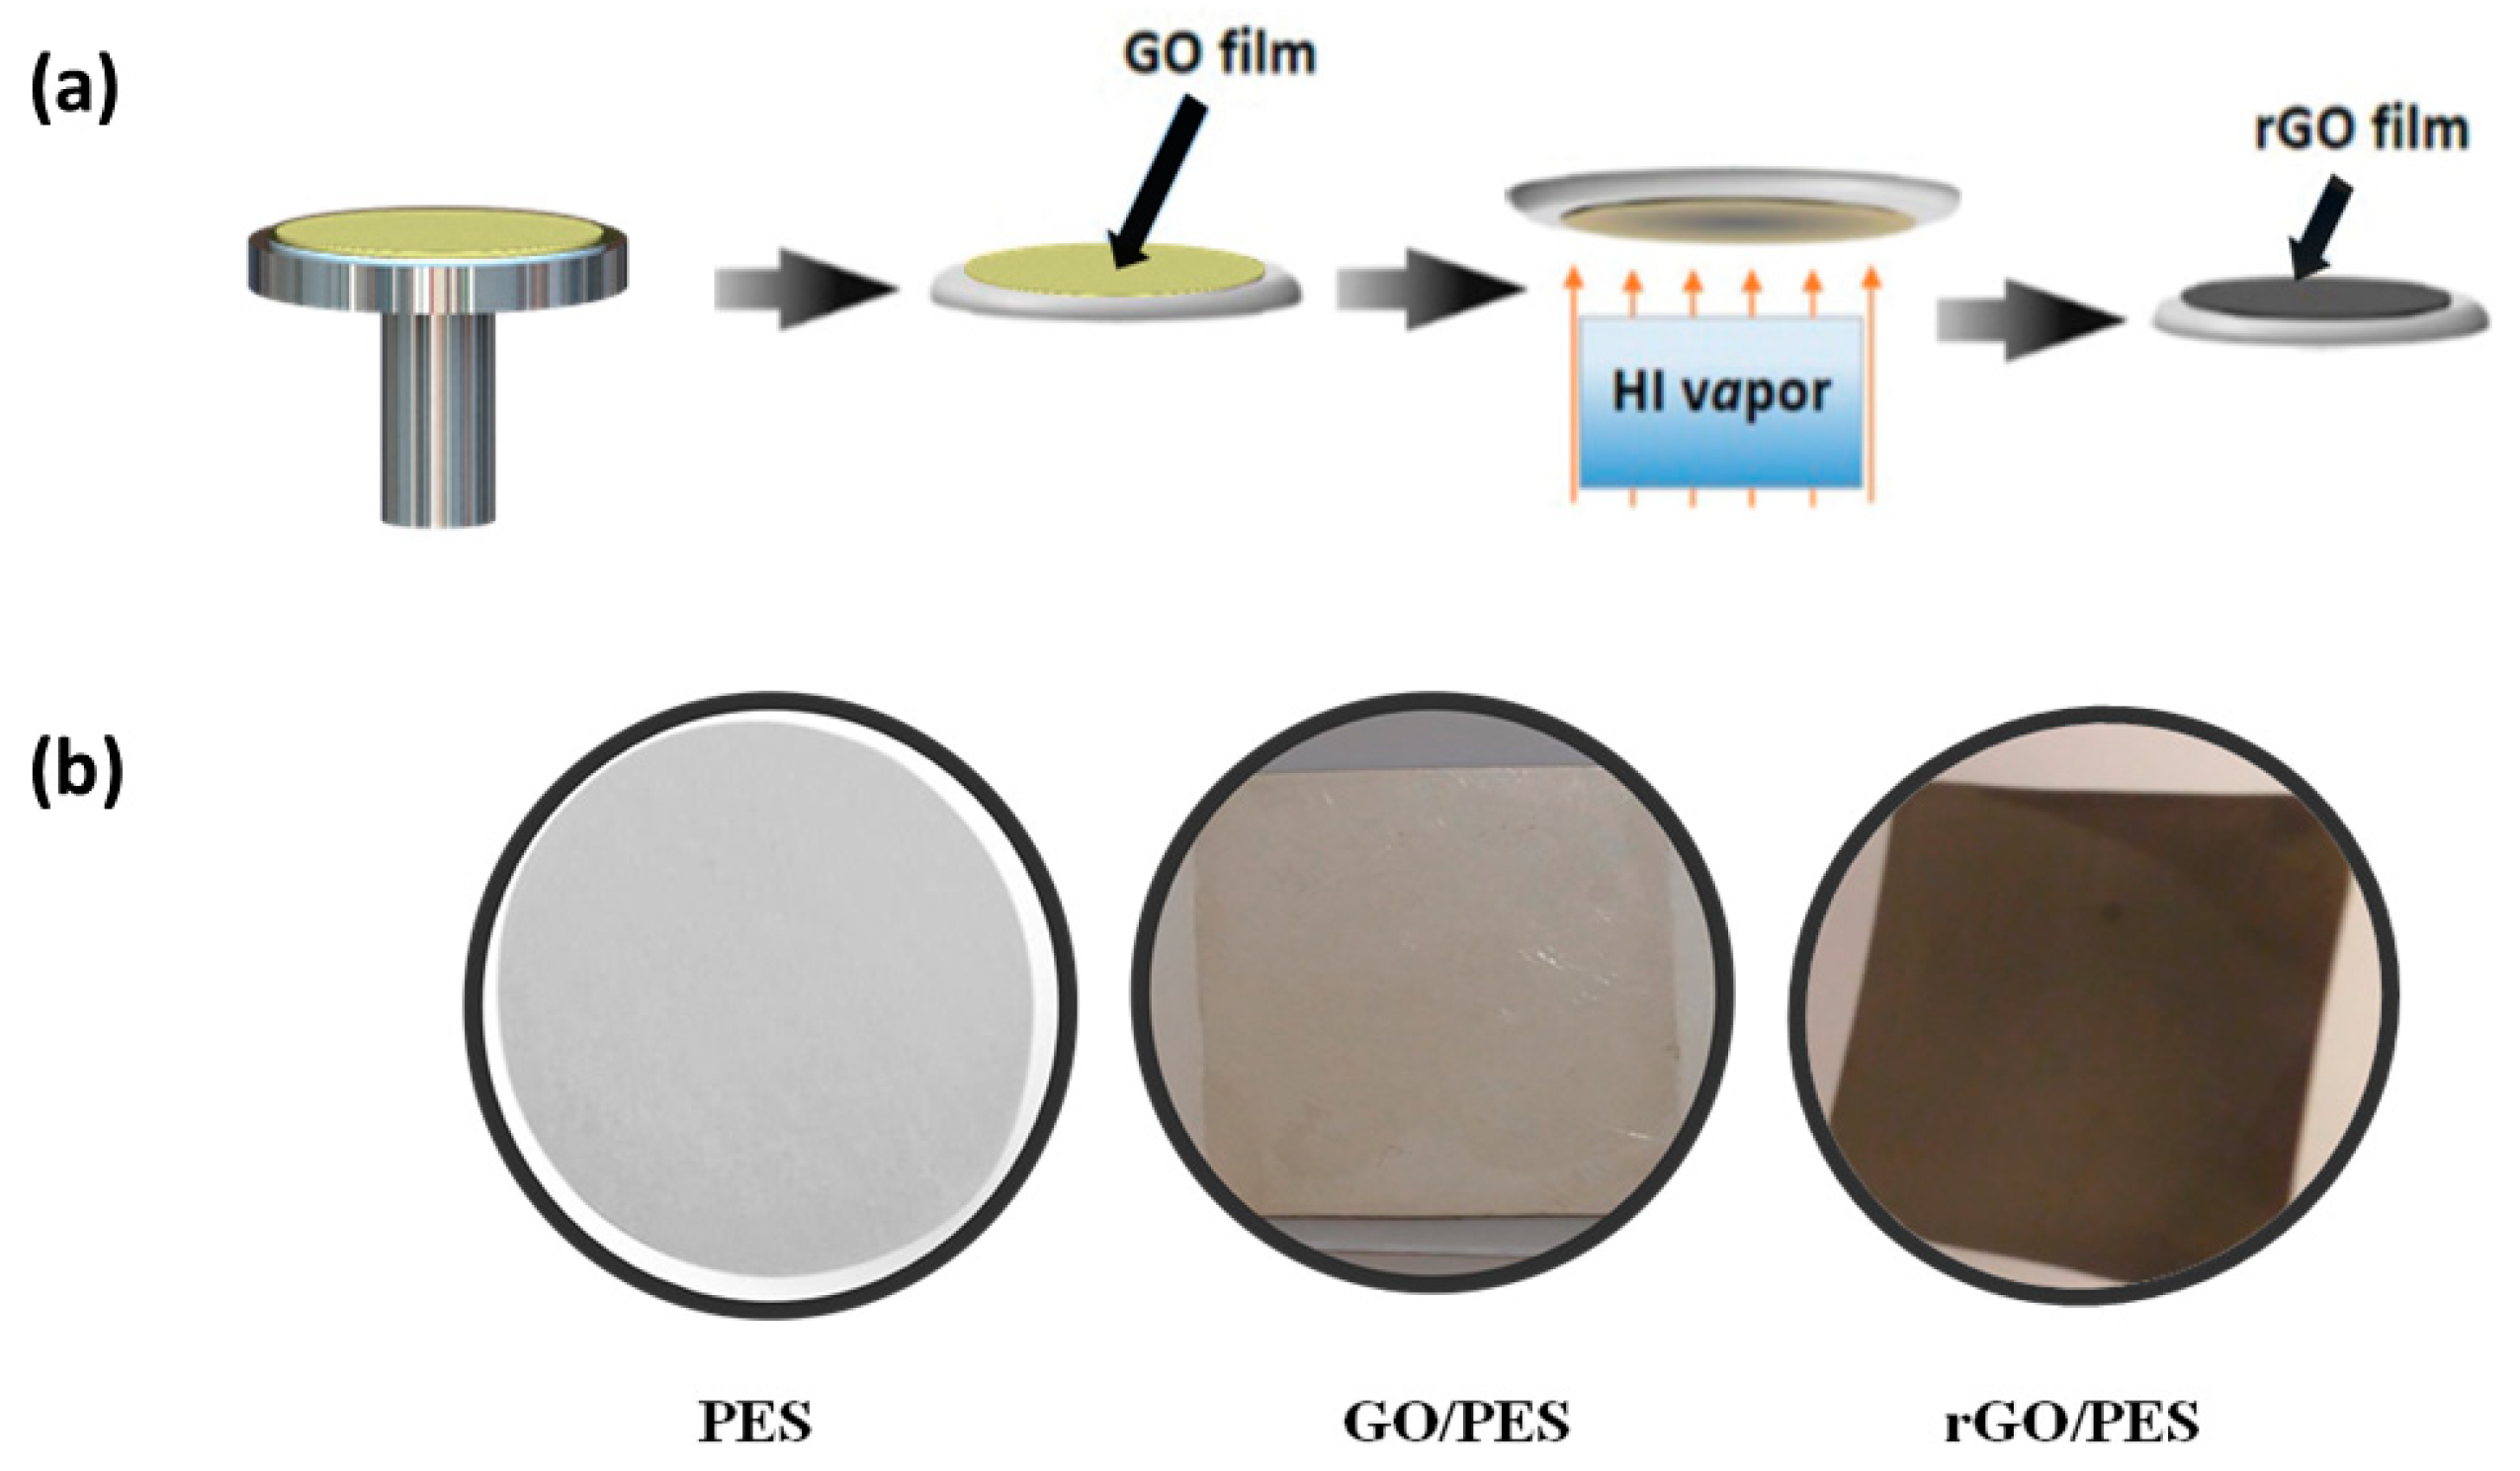
Abstract
:1. Introduction
2. Materials and Methods
2.1. Materials
2.2. Substrate Preparation
2.3. Preparation of GO/rGO-PES Membrane
2.4. Characterization of Synthesized Membranes
2.5. GO/PES Membrane Performance
3. Results and Discussion
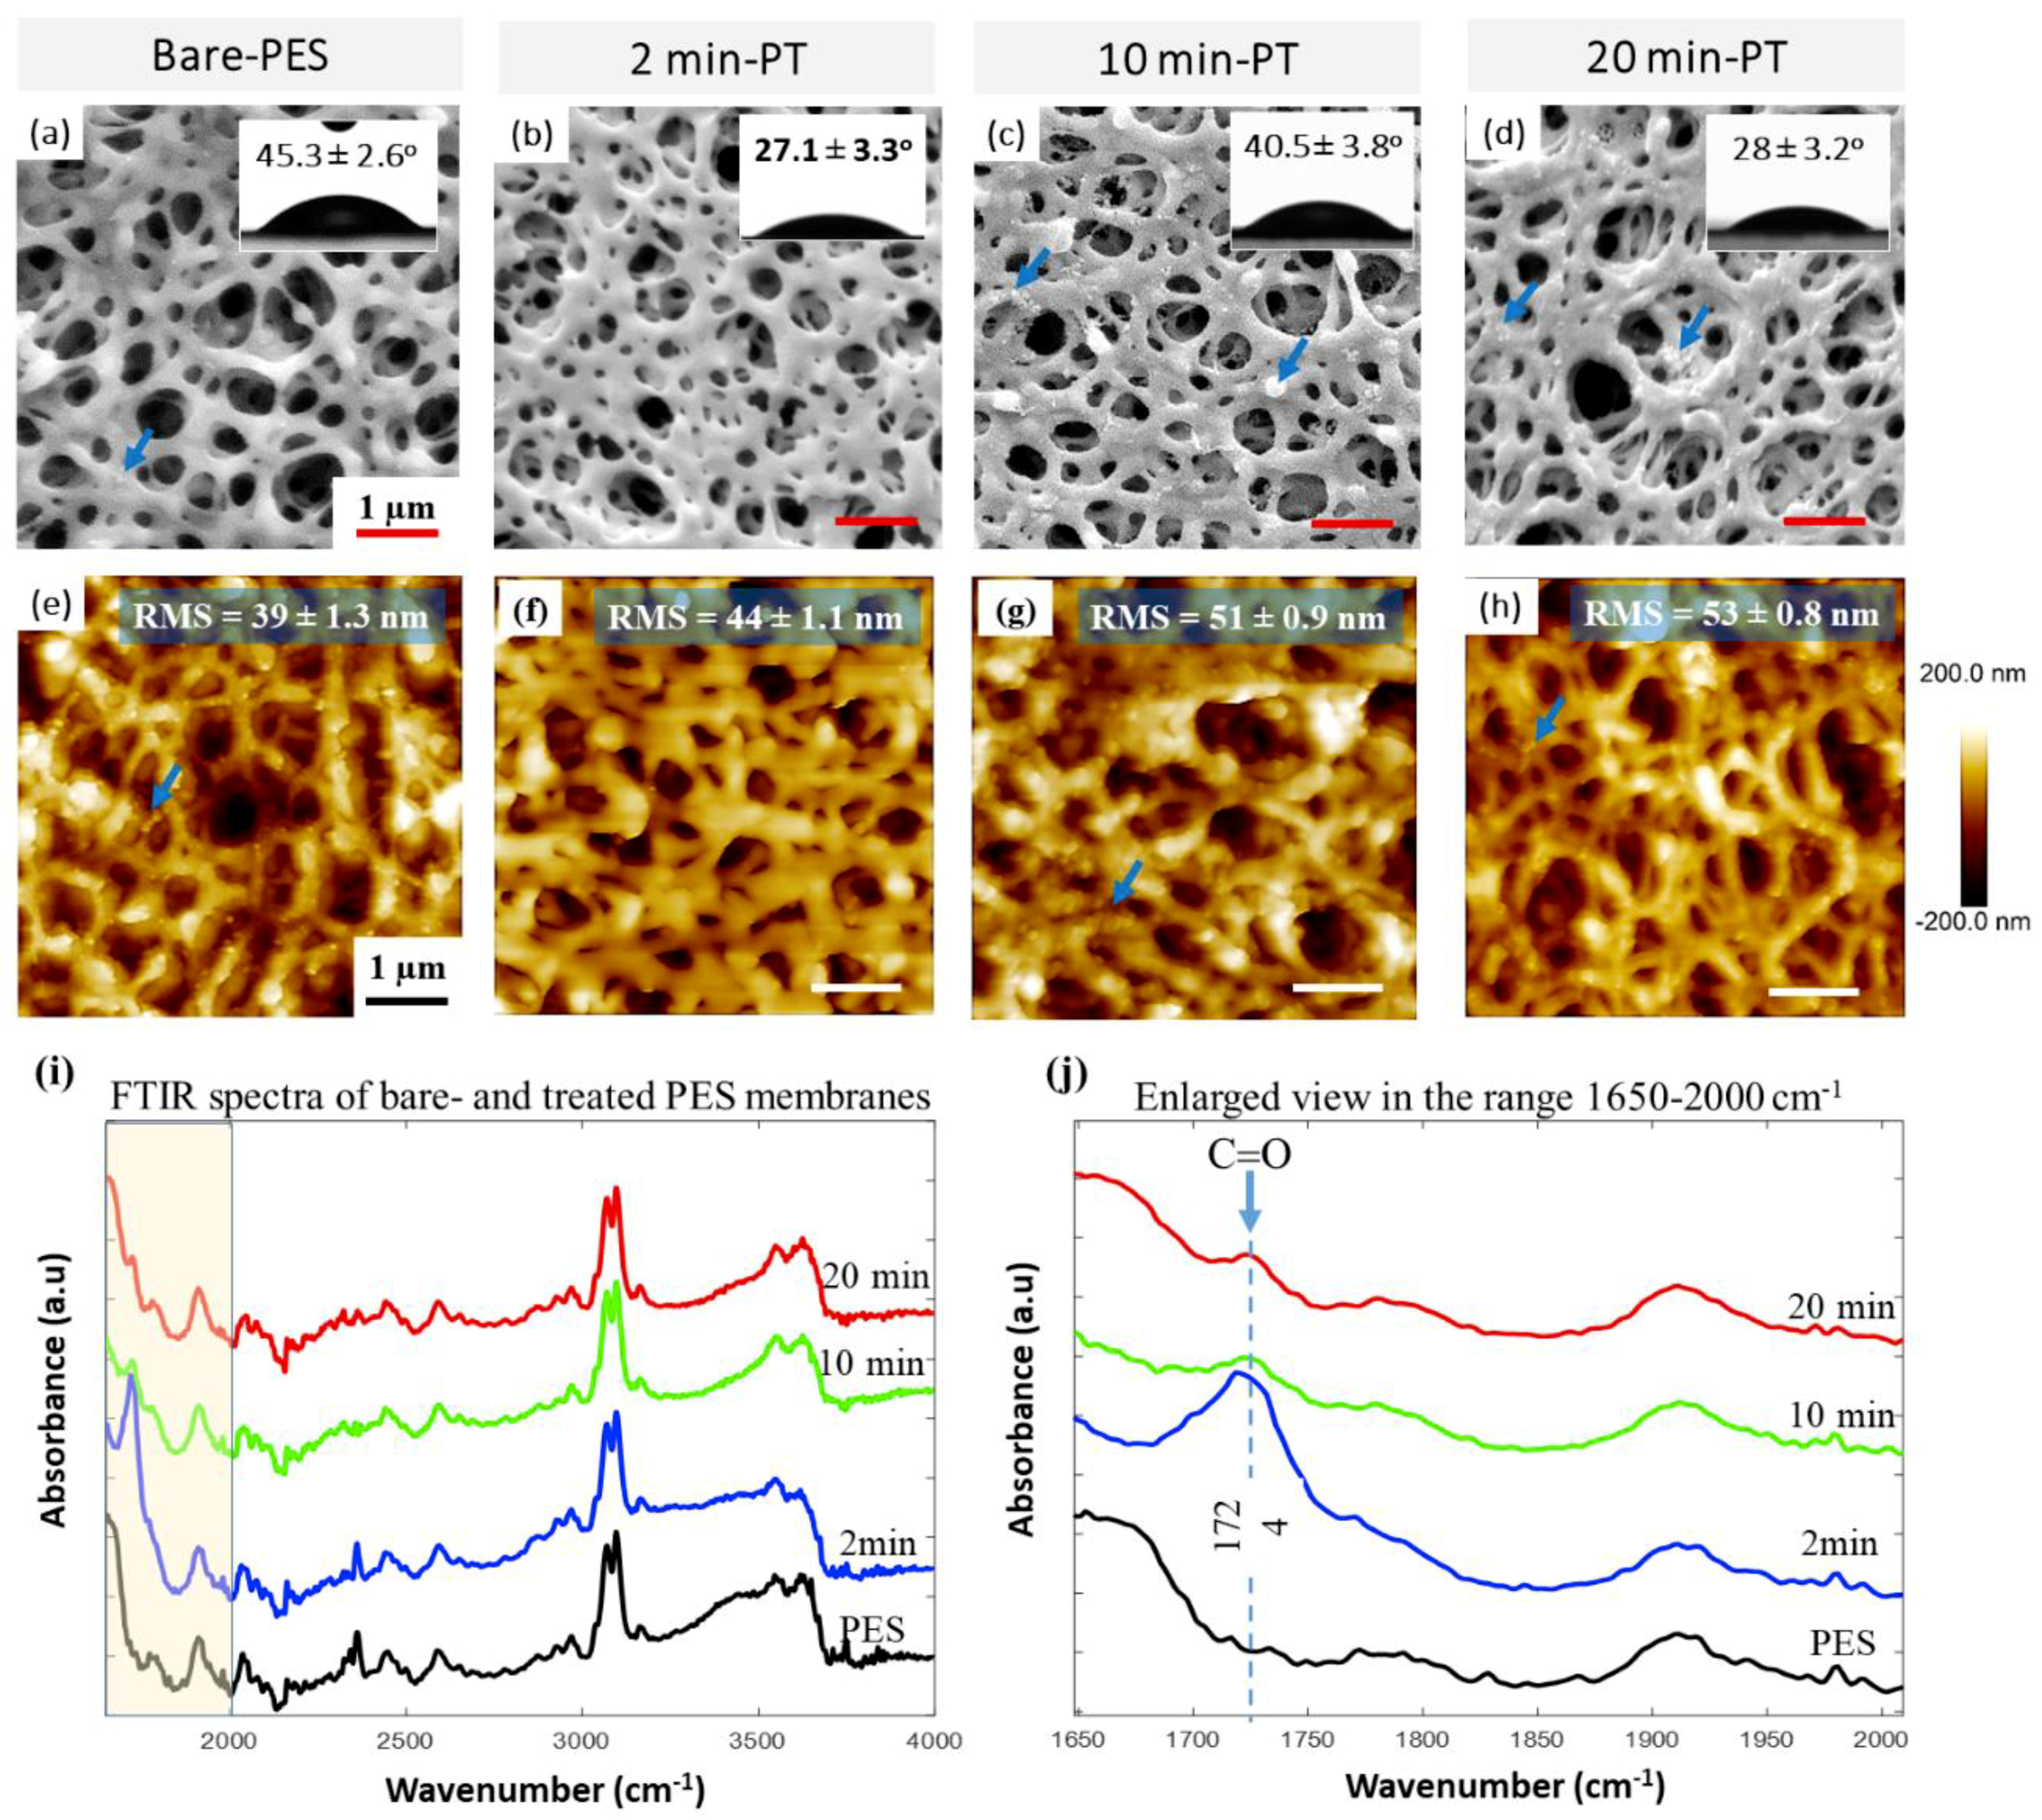
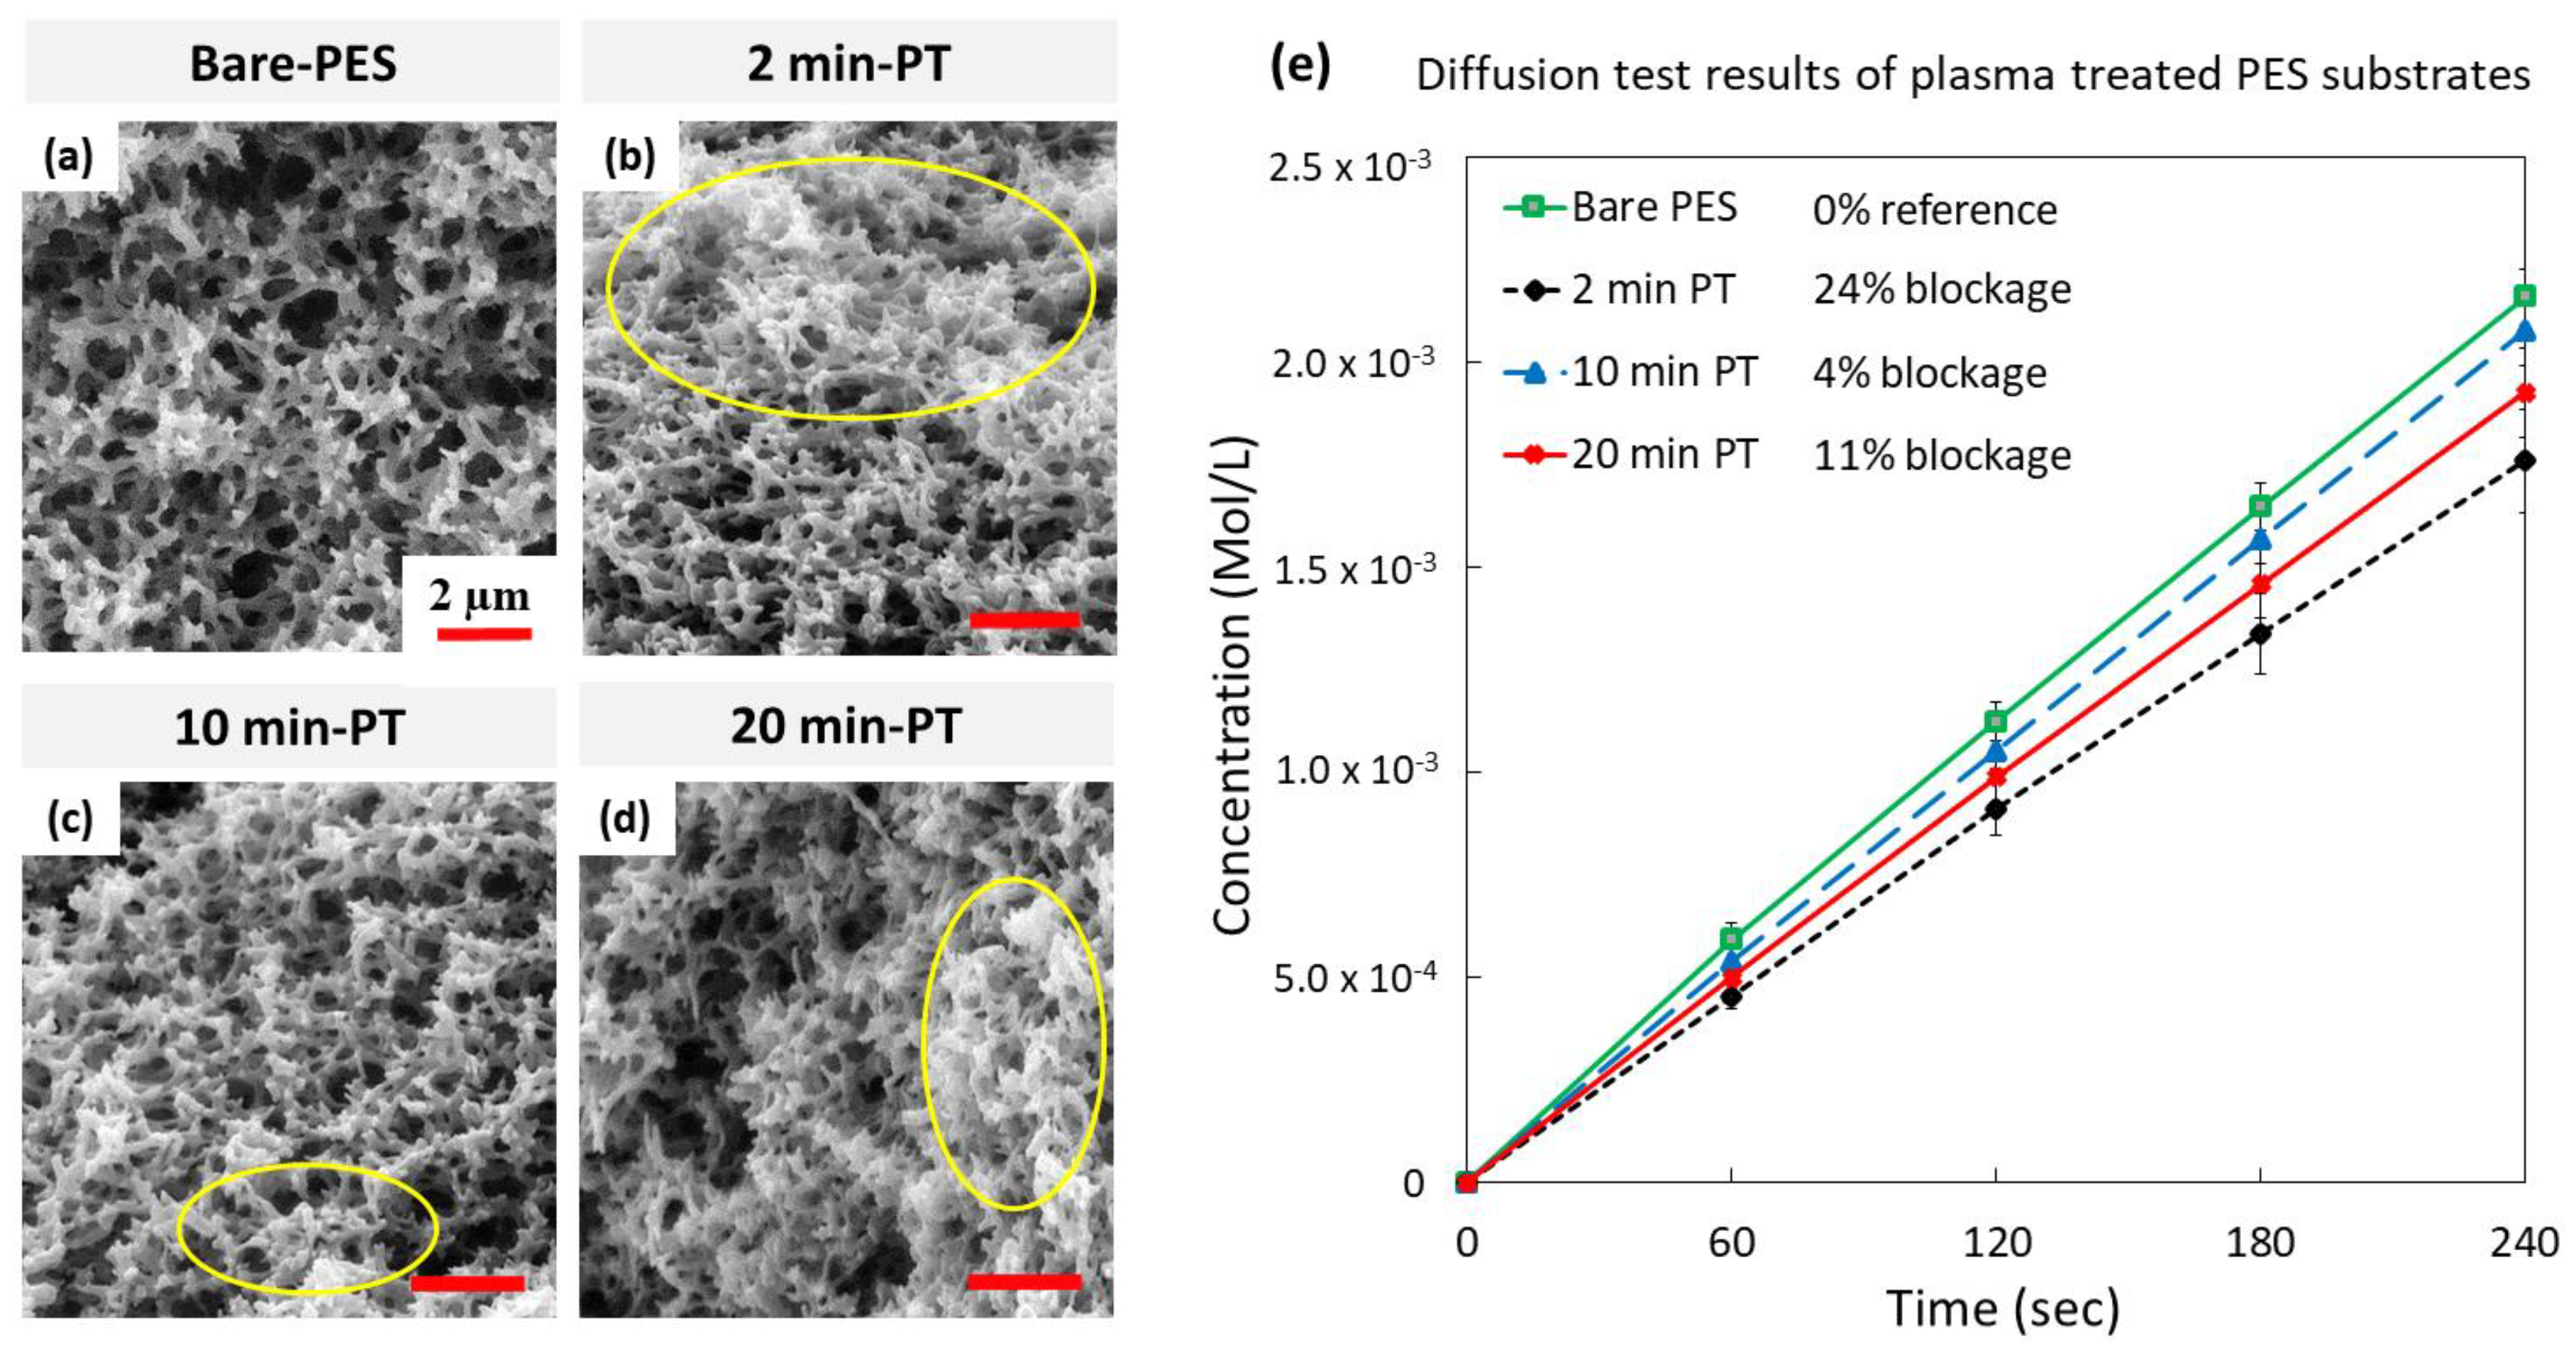
3.1. Modification of PES Surface by Plasma Treatment
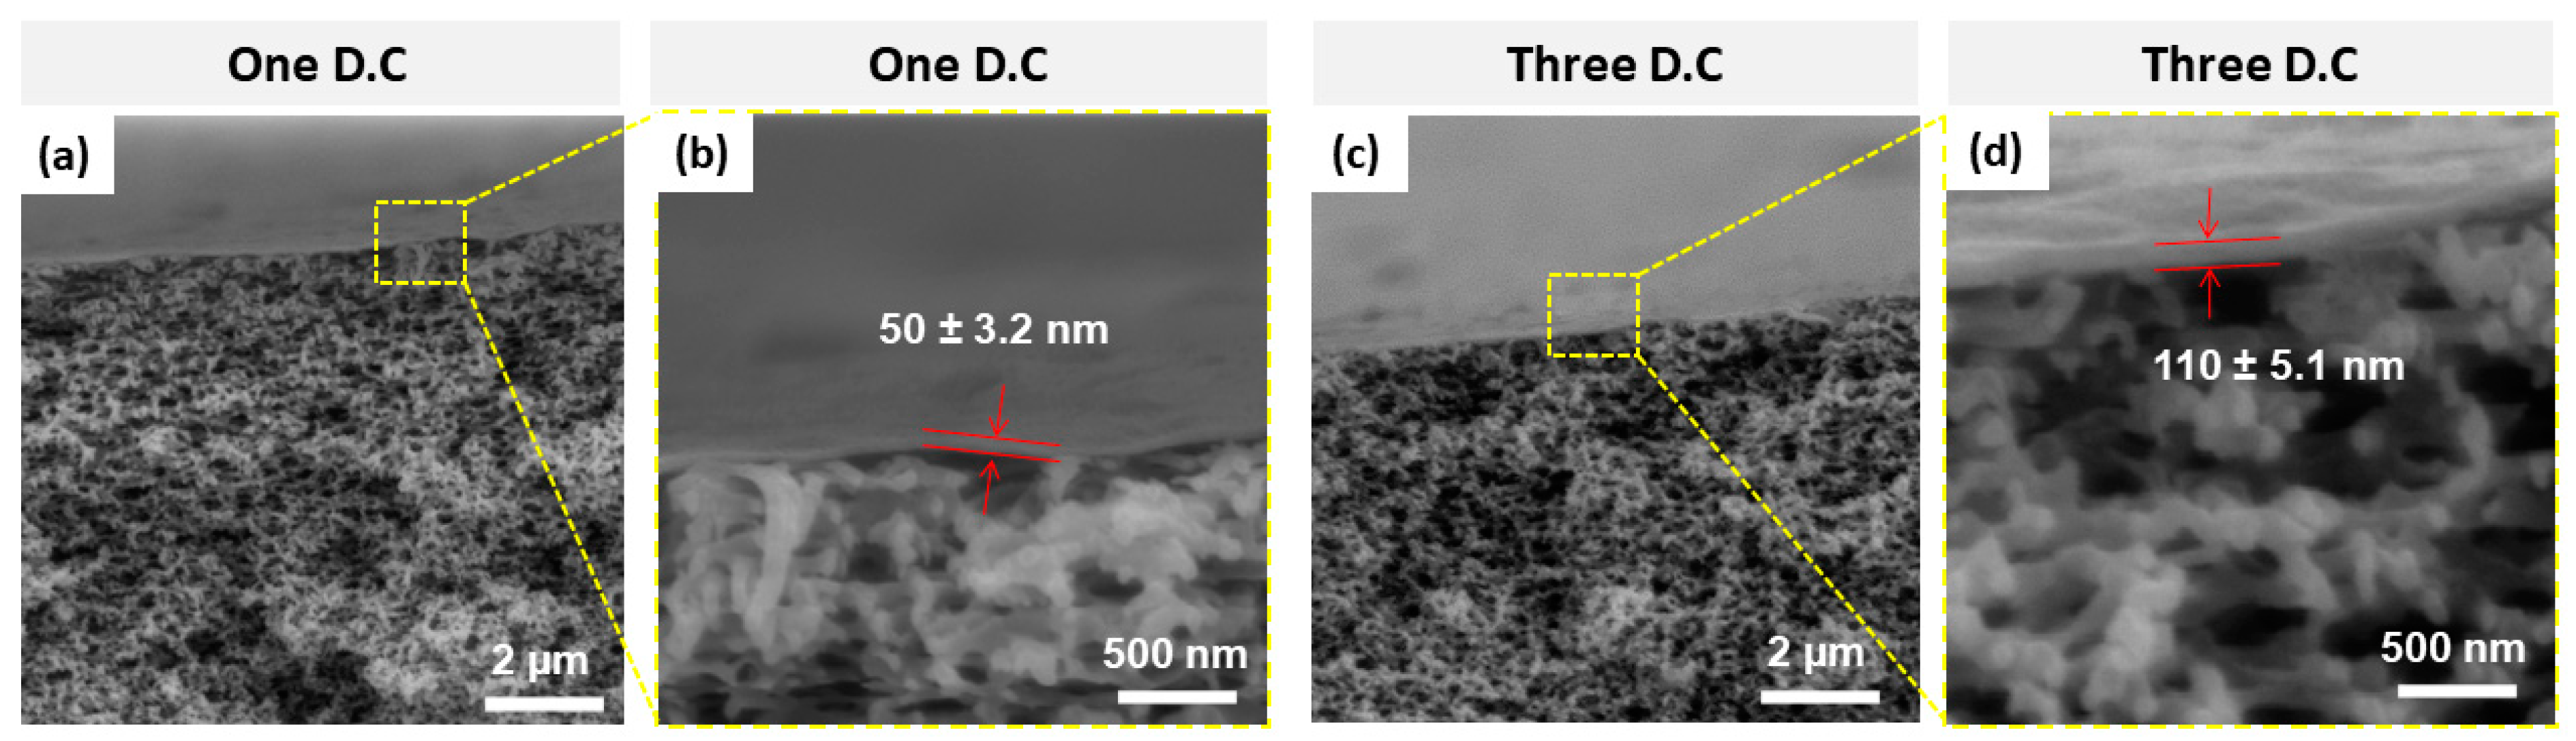
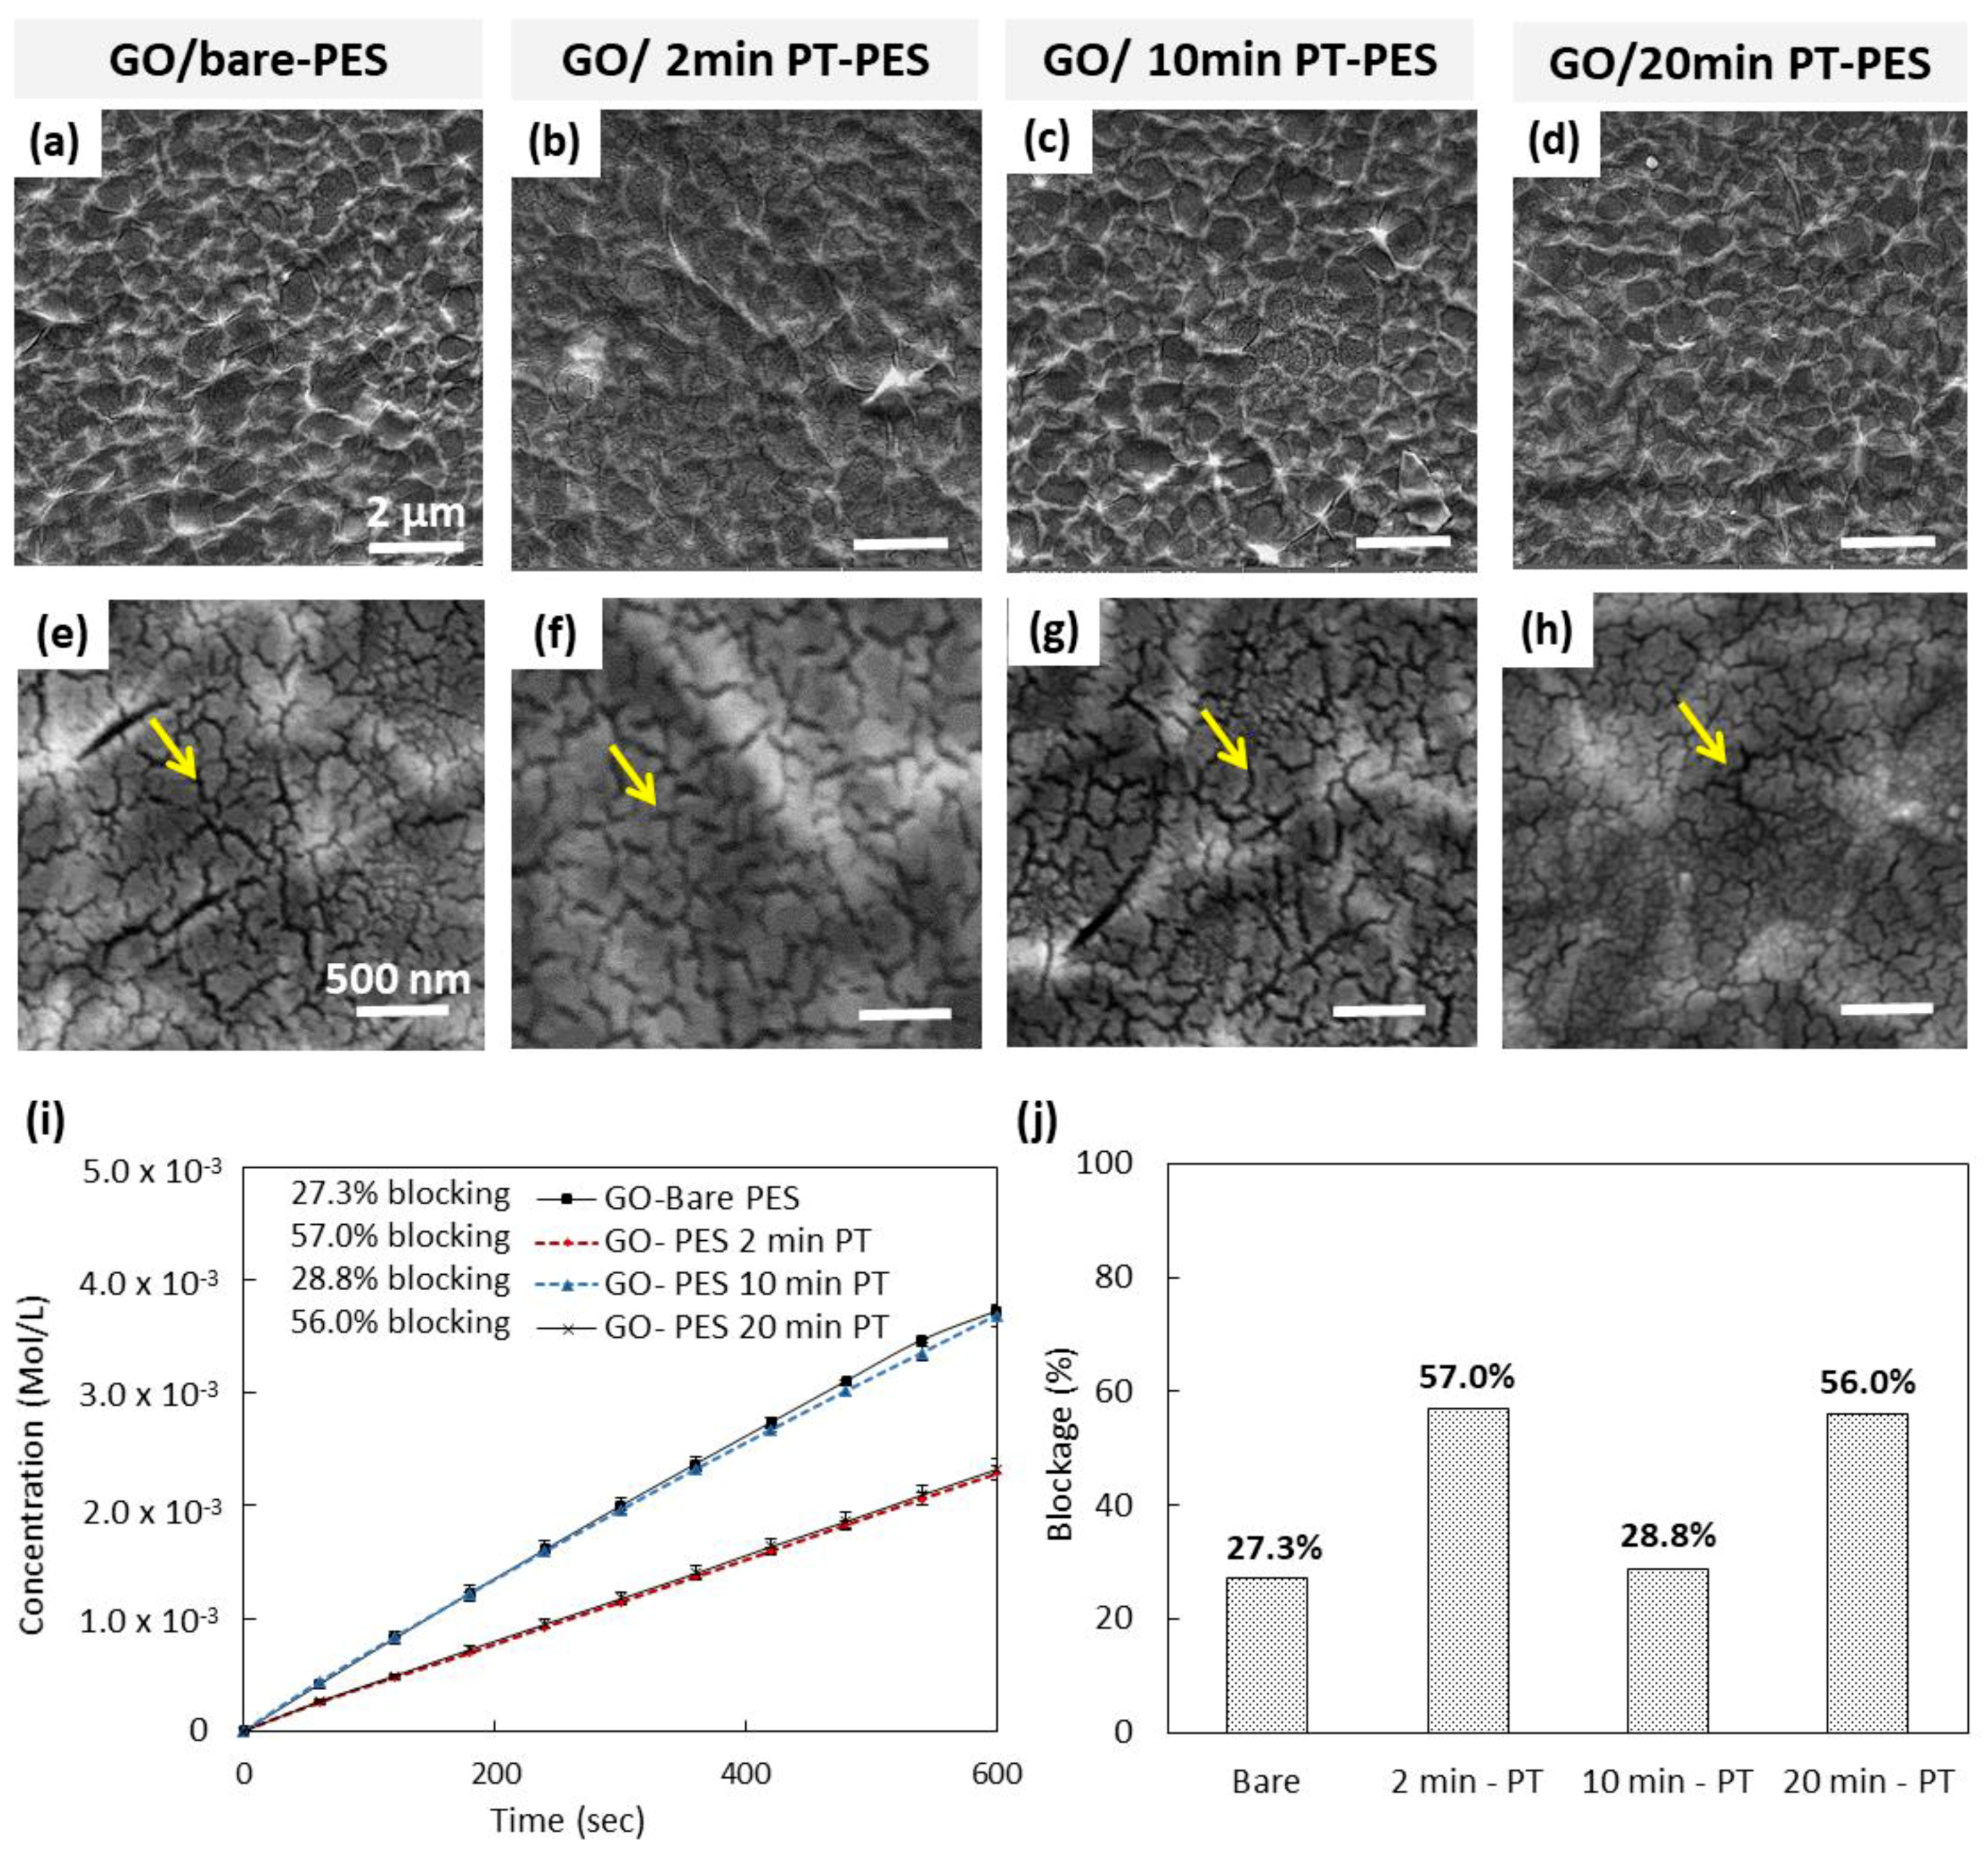
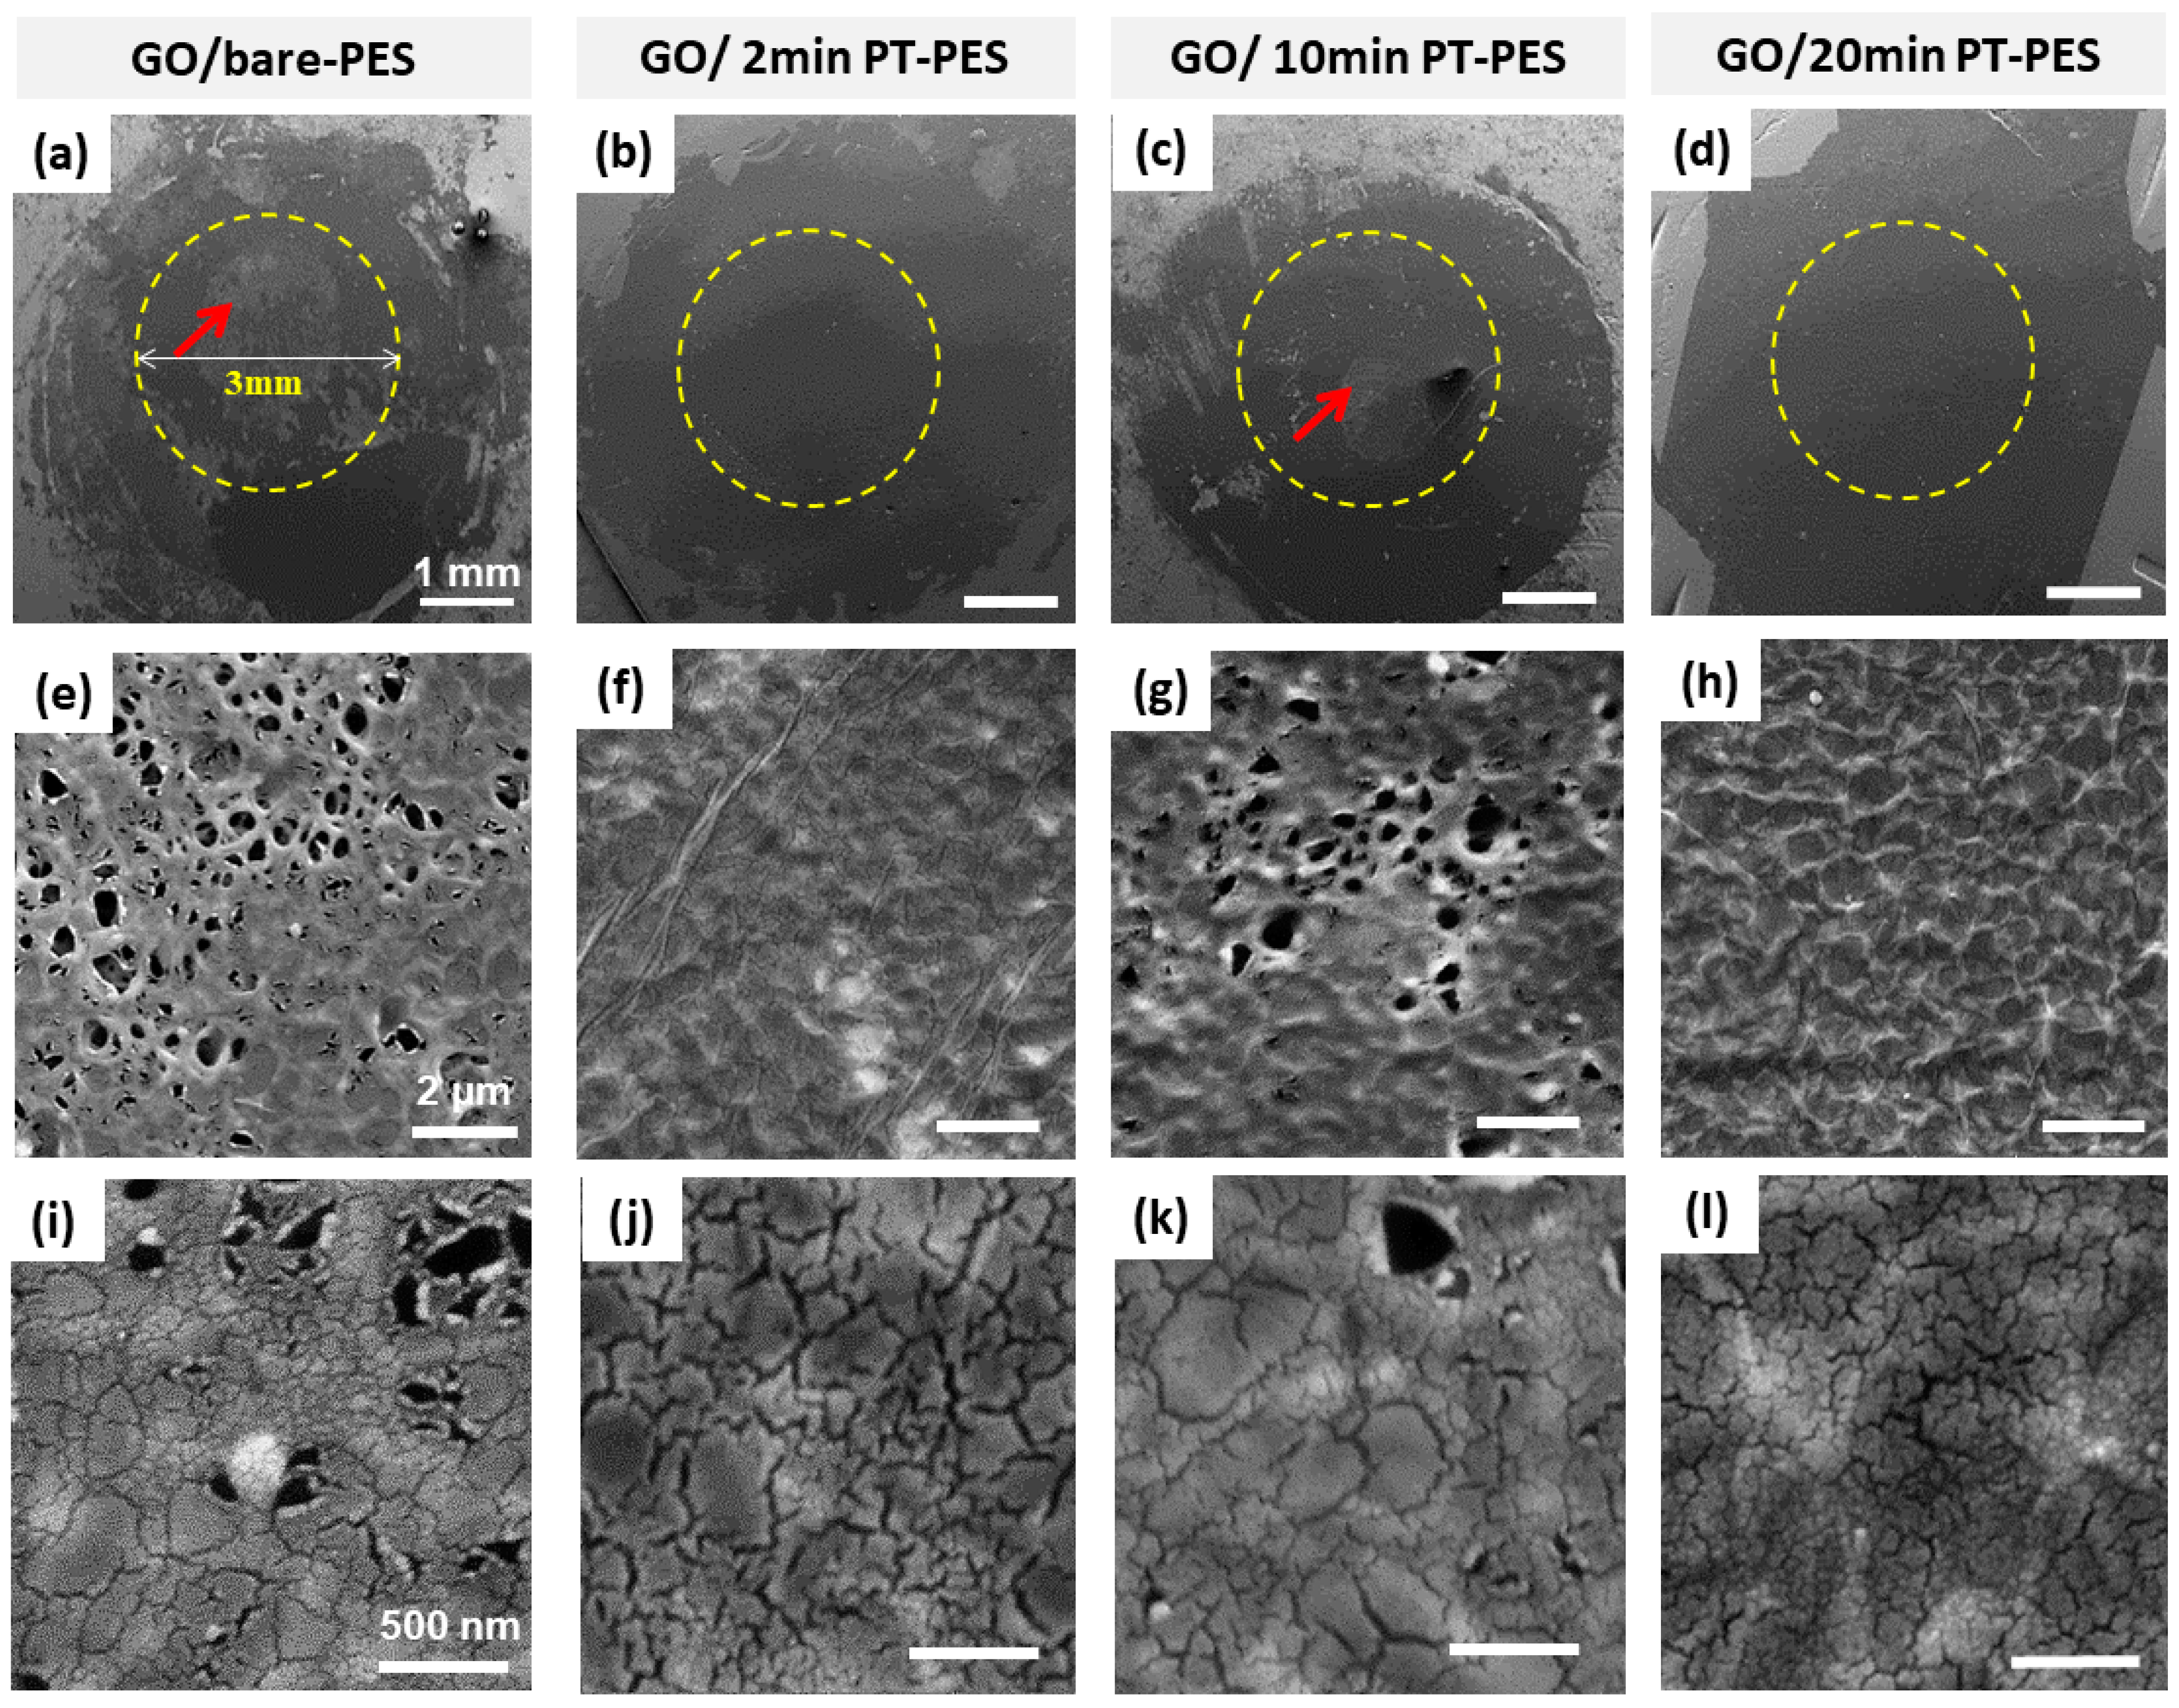
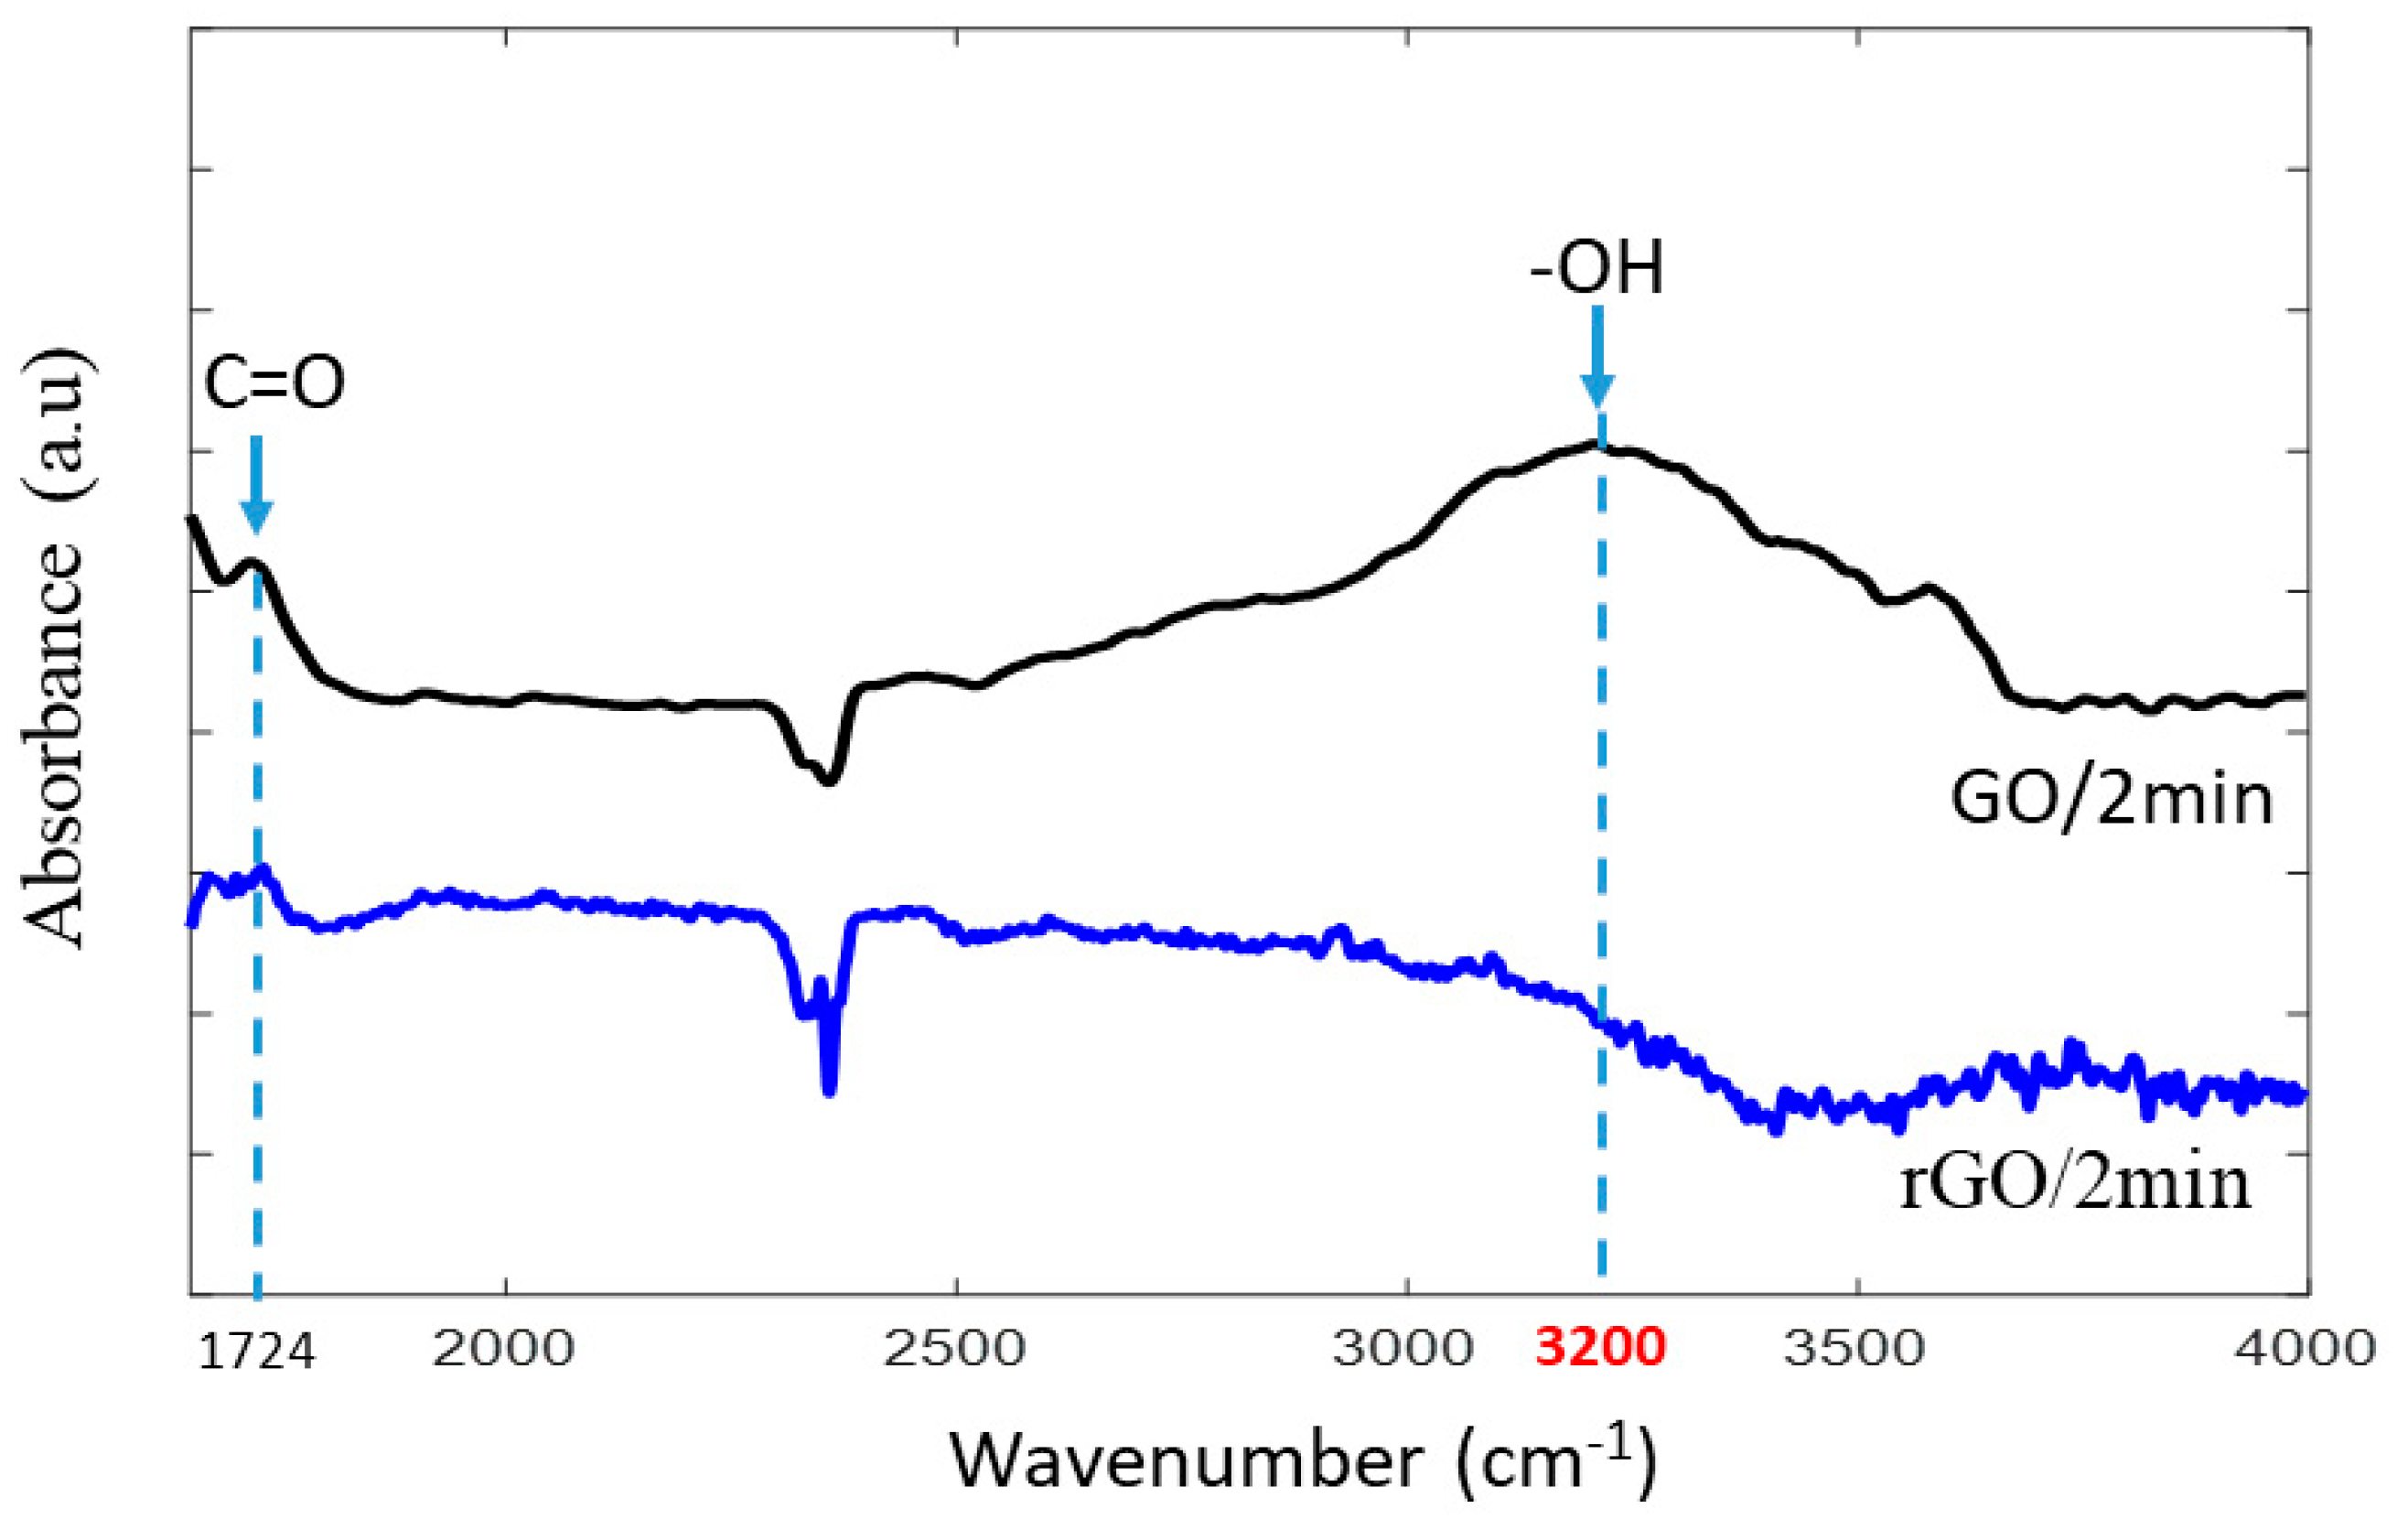
3.2. Synthesis and Characterization of GO/PES Membranes
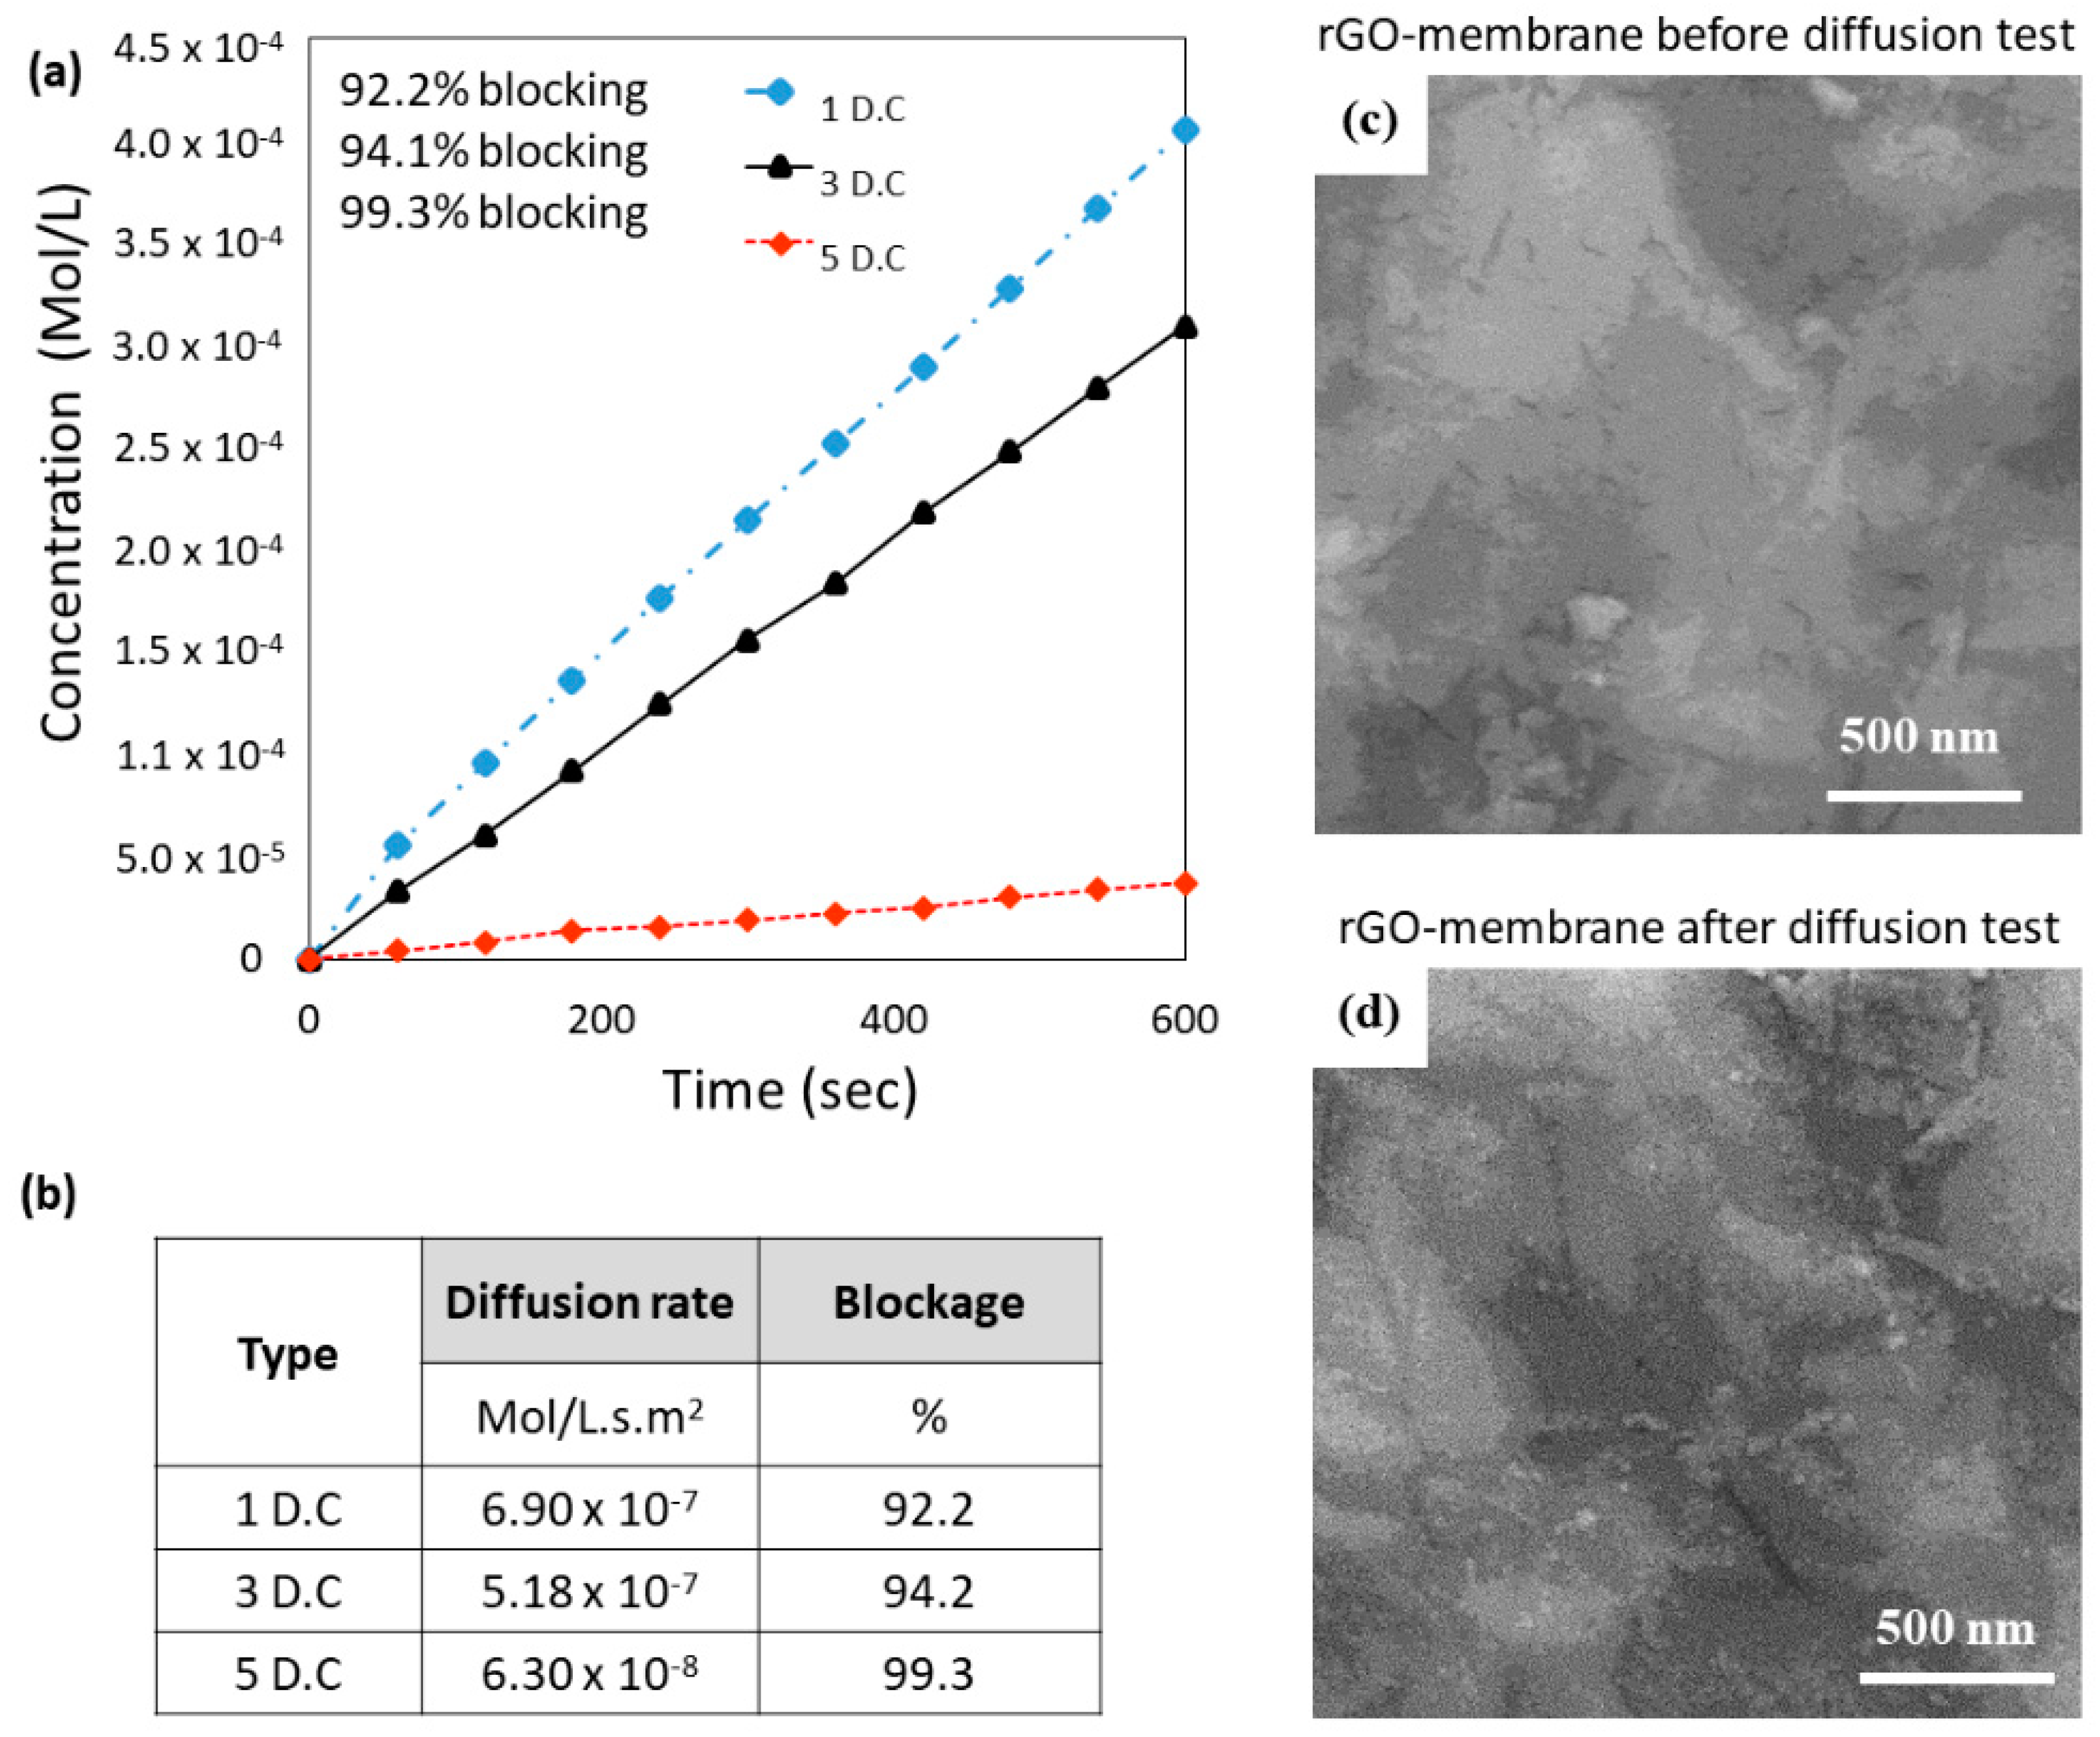
3.3. Performance of GO/PT-PES Membranes
4. Conclusions
Author Contributions
Funding
Acknowledgments
Conflicts of Interest
References
- Hung, W.-S.; An, Q.-F.; De Guzman, M.; Lin, H.-Y.; Huang, S.-H.; Liu, W.-R.; Hu, C.-C.; Lee, K.-R.; Lai, J.-Y. Pressure-assisted self-assembly technique for fabricating composite membranes consisting of highly ordered selective laminate layers of amphiphilic graphene oxide. Carbon 2014, 68, 670–677. [Google Scholar] [CrossRef]
- Yu, L.; Zhang, Y.; Zhang, B.; Liu, J.; Zhang, H.; Song, C. Preparation and characterization of HPEI-GO/PES ultrafiltration membrane with antifouling and antibacterial properties. J. Membr. Sci. 2013, 447, 452–462. [Google Scholar] [CrossRef]
- Yeh, C.-N.; Raidongia, K.; Shao, J.; Yang, Q.-H.; Huang, J. On the origin of the stability of graphene oxide membranes in water. Nat. Chem. 2015, 7, 166–170. [Google Scholar] [CrossRef] [PubMed]
- Hu, M.; Mi, B. Enabling Graphene Oxide Nanosheets as Water Separation Membranes. Environ. Sci. Technol. 2013, 47, 3715–3723. [Google Scholar] [CrossRef] [PubMed]
- Xu, Z.; Zhang, J.; Shan, M.; Li, Y.; Li, B.; Niu, J.; Zhou, B.; Qian, X. Organosilane-functionalized graphene oxide for enhanced antifouling and mechanical properties of polyvinylidene fluoride ultrafiltration membranes. J. Membr. Sci. 2014, 458, 1–13. [Google Scholar] [CrossRef]
- Bano, S.; Mahmood, A.; Kim, S.-J.; Lee, K.-H. Graphene oxide modified polyamide nanofiltration membrane with improved flux and antifouling properties. J. Mater. Chem. A 2015, 3, 2065–2071. [Google Scholar] [CrossRef]
- Lee, J.; Chae, H.-R.; Won, Y.J.; Lee, K.; Lee, C.-H.; Lee, H.H.; Kim, I.-C.; Lee, J.-M. Graphene oxide nanoplatelets composite membrane with hydrophilic and antifouling properties for wastewater treatment. J. Membr. Sci. 2013, 448, 223–230. [Google Scholar] [CrossRef]
- Barbolina, I.; Woods, C.R.; Lozano, N.; Kostarelos, K.; Novoselov, K.S.; Roberts, I.S. Purity of graphene oxide determines its antibacterial activity. 2D Mater. 2016, 3, 025025. [Google Scholar] [CrossRef] [Green Version]
- Nanda, S.S.; Yi, D.K.; Kim, K. Study of antibacterial mechanism of graphene oxide using Raman spectroscopy. Sci. Rep. 2016, 6, 28443. [Google Scholar] [CrossRef]
- Liu, S.; Zeng, T.H.; Hofmann, M.; Burcombe, E.; Wei, J.; Jiang, R.; Kong, J.; Chen, Y. Antibacterial Activity of Graphite, Graphite Oxide, Graphene Oxide, and Reduced Graphene Oxide: Membrane and Oxidative Stress. ACS Nano 2011, 5, 6971–6980. [Google Scholar] [CrossRef]
- Kim, S.G.; Hyeon, D.H.; Chun, J.H.; Chun, B.-H.; Kim, S.H. Novel thin nanocomposite RO membranes for chlorine resistance. Desalin. Water Treat. 2013, 51, 6338–6345. [Google Scholar] [CrossRef]
- Park, M.J.; Phuntsho, S.; He, T.; Nisola, G.M.; Tijing, L.D.; Li, X.-M.; Chen, G.; Chung, W.-J.; Shon, H.K. Graphene oxide incorporated polysulfone substrate for the fabrication of flat-sheet thin-film composite forward osmosis membranes. J. Membr. Sci. 2015, 493, 496–507. [Google Scholar] [CrossRef]
- Hu, M.; Mi, B. Layer-by-layer assembly of graphene oxide membranes via electrostatic interaction. J. Membr. Sci. 2014, 469, 80–87. [Google Scholar] [CrossRef]
- Zinadini, S.; Zinatizadeh, A.A.; Rahimi, M.; Vatanpour, V.; Zangeneh, H. Preparation of a novel antifouling mixed matrix PES membrane by embedding graphene oxide nanoplates. J. Membr. Sci. 2014, 453, 292–301. [Google Scholar] [CrossRef]
- Ganesh, B.M.; Isloor, A.M.; Ismail, A.F. Enhanced hydrophilicity and salt rejection study of graphene oxide-polysulfone mixed matrix membrane. Desalination 2013, 313, 199–207. [Google Scholar] [CrossRef]
- Park, S.; Dikin, D.A.; Nguyen, S.T.; Ruoff, R.S. Graphene Oxide Sheets Chemically Cross-Linked by Polyallylamine. J. Phys. Chem. C 2009, 113, 15801–15804. [Google Scholar] [CrossRef]
- Nair, R.R.; Wu, H.A.; Jayaram, P.N.; Grigorieva, I.V.; Geim, A.K. Unimpeded Permeation of Water Through Helium-Leak-Tight Graphene-Based Membranes. Science 2012, 335, 442–444. [Google Scholar] [CrossRef] [Green Version]
- Huang, T.; Zhang, L.; Chen, H.; Gao, C. A cross-linking graphene oxide–polyethyleneimine hybrid film containing ciprofloxacin: One-step preparation, controlled drug release and antibacterial performance. J. Mater. Chem. B Mater. Biol. Med. 2015, 3, 1605–1611. [Google Scholar] [CrossRef]
- Gao, Y.; Hu, M.; Mi, B. Membrane surface modification with TiO2–graphene oxide for enhanced photocatalytic performance. J. Membr. Sci. 2014, 455, 349–356. [Google Scholar] [CrossRef]
- Goh, K.; Setiawan, L.; Wei, L.; Si, R.; Fane, A.G.; Wang, R.; Chen, Y. Graphene oxide as effective selective barriers on a hollow fiber membrane for water treatment process. J. Membr. Sci. 2015, 474, 244–253. [Google Scholar] [CrossRef]
- Moon, I.K.; Kim, J.I.; Lee, H.; Hur, K.; Kim, W.C.; Lee, H. 2D Graphene Oxide Nanosheets as an Adhesive Over-Coating Layer for Flexible Transparent Conductive Electrodes. Sci. Rep. 2013, 3, 2673–2684. [Google Scholar] [CrossRef] [Green Version]
- Minář, J.; Brožek, J.; Michalcová, A.; Hadravová, R.; Slepička, P. Functionalization of graphene oxide with poly(ε-caprolactone) for enhanced interfacial adhesion in polyamide 6 nanocomposites. Compos. Part B Eng. 2019, 174, 107019. [Google Scholar] [CrossRef]
- Hammond, P.T. Recent explorations in electrostatic multilayer thin film assembly. Curr. Opin. Colloid Interface Sci. 1999, 4, 430–442. [Google Scholar] [CrossRef]
- Li, D.; Müller, M.B.; Gilje, S.; Kaner, R.B.; Wallace, G.G. Processable aqueous dispersions of graphene nanosheets. Nat. Nanotechnol. 2008, 3, 101–105. [Google Scholar] [CrossRef] [PubMed]
- Abdelkader, B.A.; Antar, M.A.; Laoui, T.; Khan, Z. Development of graphene oxide-based membrane as a pretreatment for thermal seawater desalination. Desalination 2019, 465, 13–24. [Google Scholar] [CrossRef]
- Liu, H.; Wang, H.; Zhang, X. Facile Fabrication of Freestanding Ultrathin Reduced Graphene Oxide Membranes for Water Purification. Adv. Mater. 2014, 27, 249–254. [Google Scholar] [CrossRef]
- Han, Y.; Xu, Z.; Gao, C. Ultrathin Graphene Nanofiltration Membrane for Water Purification. Adv. Funct. Mater. 2013, 23, 3693–3700. [Google Scholar] [CrossRef]
- Hegemann, D.; Brunner, H.; Oehr, C. Plasma treatment of polymers for surface and adhesion improvement. Nucl. Instrum. Methods Phys. Res. Sect. B Beam Interact. Mater. Atoms 2003, 208, 281–286. [Google Scholar] [CrossRef]
- Baldan, A. Adhesively-bonded joints and repairs in metallic alloys, polymers and composite materials: Adhesives, adhesion theories and surface pretreatment. J. Mater. Sci. 2004, 39, 1–49. [Google Scholar] [CrossRef]
- Yang, E.; Kim, C.-M.; Song, J.-H.; Ki, H.; Ham, M.-H.; Kim, I.S. Enhanced desalination performance of forward osmosis membranes based on reduced graphene oxide laminates coated with hydrophilic polydopamine. Carbon 2017, 117, 293–300. [Google Scholar] [CrossRef]
- Li, Z.; Wang, Y.; Han, M.; Wang, D.; Han, S.; Liu, Z.; Zhou, N.; Shang, R.; Xie, C. Graphene Oxide Incorporated Forward Osmosis Membranes With Enhanced Desalination Performance and Chlorine Resistance. Front. Chem. 2020, 7, 1–12. [Google Scholar] [CrossRef] [PubMed]
- Chu, P.K. Low Temperature Plasma Technology: Methods and Applications; An Imprint of Taylor & Francis; CRC Press: Boca Raton, FL, USA, 2013; ISBN 9781466509900. [Google Scholar]
- Pei, S.; Zhao, J.; Du, J.; Ren, W.; Cheng, H.-M. Direct reduction of graphene oxide films into highly conductive and flexible graphene films by hydrohalic acids. Carbon 2010, 48, 4466–4474. [Google Scholar] [CrossRef]
- Kong, L.B. Carbon Nanomaterials Based on Graphene Nanosheets; CRC Press: Boca Raton, FL, USA, 2017; ISBN 978-1-4987-2505-7. [Google Scholar]
- O’Hern, S.C.; Stewart, C.A.; Boutilier, M.S.H.; Idrobo, J.-C.; Bhaviripudi, S.; Das, S.K.; Kong, J.; Laoui, T.; Atieh, M.; Karnik, R. Selective Molecular Transport through Intrinsic Defects in a Single Layer of CVD Graphene. ACS Nano 2012, 6, 10130–10138. [Google Scholar] [CrossRef]
- O’Hern, S.C.; Boutilier, M.S.H.; Idrobo, J.-C.; Song, Y.; Kong, J.; Laoui, T.; Atieh, M.; Karnik, R. Selective Ionic Transport through Tunable Subnanometer Pores in Single-Layer Graphene Membranes. Nano Lett. 2014, 14, 1234–1241. [Google Scholar] [CrossRef] [PubMed] [Green Version]
- Kafiah, F.M.; Khan, Z.; Ibrahim, A.; Karnik, R.; Atieh, M.; Laoui, T. Monolayer graphene transfer onto polypropylene and polyvinylidenedifluoride microfiltration membranes for water desalination. Desalination 2016, 388, 29–37. [Google Scholar] [CrossRef]
- Mandolfino, C.; Lertora, E.; Gambaro, C. Effect of Cold Plasma Treatment on Surface Roughness and Bonding Strength of Polymeric Substrates. Key Eng. Mater. 2014, 1484–1493. [Google Scholar] [CrossRef]
- Reis, R.; Dumée, L.F.; Tardy, B.L.; Dagastine, R.; Orbell, J.D.; Schutz, J.A.; Duke, M.C. Towards Enhanced Performance Thin-film Composite Membranes via Surface Plasma Modification. Sci. Rep. 2016, 6, 29206. [Google Scholar] [CrossRef] [PubMed]
- Pal, S.; Ghatak, S.K.; De, S.; Dasgupta, S. Characterization of CO2 plasma treated polymeric membranes and quantification of flux enhancement. J. Membr. Sci. 2008, 323, 1–10. [Google Scholar] [CrossRef]
- Lai, J.; Sunderland, B.; Xue, J.; Yan, S.; Zhao, W.; Folkard, M.; Michael, B.D.; Wang, Y. Study on hydrophilicity of polymer surfaces improved by plasma treatment. Appl. Surf. Sci. 2006, 252, 3375–3379. [Google Scholar] [CrossRef]
- Steen, M.L.; Hymas, L.; Havey, E.D.; Capps, N.E.; Castner, D.G.; Fisher, E.R. Low temperature plasma treatment of asymmetric polysulfone membranes for permanent hydrophilic surface modification. J. Membr. Sci. 2001, 188, 97–114. [Google Scholar] [CrossRef]
- Steen, M.L.; Jordan, A.C.; Fisher, E.R. Hydrophilic modification of polymeric membranes by low temperature H2O plasma treatment. J. Membr. Sci. 2002, 204, 341–357. [Google Scholar] [CrossRef]
- Wavhal, D.S.; Fisher, E.R. Hydrophilic modification of polyethersulfone membranes by low temperature plasma-induced graft polymerization. J. Membr. Sci. 2002, 209, 255–269. [Google Scholar] [CrossRef]
- Tompkins, B.D.; Dennison, J.M.; Fisher, E.R. H2O plasma modification of track-etched polymer membranes for increased wettability and improved performance. J. Membr. Sci. 2013, 428, 576–588. [Google Scholar] [CrossRef]
- Hirvi, J.T.; Pakkanen, T.A. Enhanced Hydrophobicity of Rough Polymer Surfaces. J. Phys. Chem. B 2007, 111, 3336–3341. [Google Scholar] [CrossRef]
- Kasalkova, N.S.; Slepicka, P.; Kolska, Z.; Svorcik, V. Wettability and Other Surface Properties of Modified Polymers. In Wetting and Wettability; InTech: London, UK, 2015. [Google Scholar]
- France, R.M.; Short, R.D. Plasma Treatment of Polymers: The Effects of Energy Transfer from an Argon Plasma on the Surface Chemistry of Polystyrene, and Polypropylene. A High-Energy Resolution X-ray Photoelectron Spectroscopy Study. Langmuir 1998, 14, 4827–4835. [Google Scholar] [CrossRef]
- Pei, S.; Cheng, H.-M. The reduction of graphene oxide. Carbon 2012, 50, 3210–3228. [Google Scholar] [CrossRef]
- Viana, M.M.; Lima, M.C.F.S.; Forsythe, J.C.; Gangoli, V.S.; Cho, M.; Cheng, Y.; Silva, G.G.; Wong, M.S.; Caliman, V. Facile Graphene Oxide Preparation by Microwave-Assisted Acid Method. J. Braz. Chem. Soc. 2015. [Google Scholar] [CrossRef]
- Chua, C.K.; Pumera, M. Chemical reduction of graphene oxide: A synthetic chemistry viewpoint. Chem. Soc. Rev. 2014, 43, 291–312. [Google Scholar] [CrossRef] [PubMed]
- Yumura, T.; Yamasaki, A. Roles of water molecules in trapping carbon dioxide molecules inside the interlayer space of graphene oxides. Phys. Chem. Chem. Phys. 2014, 16, 9656. [Google Scholar] [CrossRef]


Publisher’s Note: MDPI stays neutral with regard to jurisdictional claims in published maps and institutional affiliations. |
© 2020 by the authors. Licensee MDPI, Basel, Switzerland. This article is an open access article distributed under the terms and conditions of the Creative Commons Attribution (CC BY) license (http://creativecommons.org/licenses/by/4.0/).
Share and Cite
Alnoor, O.; Laoui, T.; Ibrahim, A.; Kafiah, F.; Nadhreen, G.; Akhtar, S.; Khan, Z. Graphene Oxide-Based Membranes for Water Purification Applications: Effect of Plasma Treatment on the Adhesion and Stability of the Synthesized Membranes. Membranes 2020, 10, 292. https://doi.org/10.3390/membranes10100292
Alnoor O, Laoui T, Ibrahim A, Kafiah F, Nadhreen G, Akhtar S, Khan Z. Graphene Oxide-Based Membranes for Water Purification Applications: Effect of Plasma Treatment on the Adhesion and Stability of the Synthesized Membranes. Membranes. 2020; 10(10):292. https://doi.org/10.3390/membranes10100292
Chicago/Turabian StyleAlnoor, Omer, Tahar Laoui, Ahmed Ibrahim, Feras Kafiah, Ghaith Nadhreen, Sultan Akhtar, and Zafarullah Khan. 2020. "Graphene Oxide-Based Membranes for Water Purification Applications: Effect of Plasma Treatment on the Adhesion and Stability of the Synthesized Membranes" Membranes 10, no. 10: 292. https://doi.org/10.3390/membranes10100292