1. Introduction
Since the emergence of the COVID-19 pandemic in late 2019 [
1], public health services have taken a central position in global pandemic control [
2], facing a challenge never seen before [
3,
4]. Simultaneously, many private and public scientific groups have been working to develop safe and effective vaccines to alleviate this health crisis [
5]. After a few months, these objectives were met by some research groups, showing successful results in phase 3 clinical trials [
6,
7,
8,
9,
10,
11,
12], demonstrating the safety and efficacy of their respective vaccines to international organizations. To date, vaccines have demonstrated their capacity to reduce the spread of the pandemic, hospitalizations, and deaths in real-world conditions. Unfortunately, recent studies have examined some COVID-19 vaccines, reporting a considerable reduction in their effectiveness against contagion only a few months after completion of the vaccination schedule [
13,
14,
15]. In this situation, it would be necessary to administer several vaccines annually to ensure sustainable pandemic control. This challenge is untenable with current vaccine supply chains [
16].
In fact, vaccines are still not affordable for many countries to implement wide-access vaccination programs in their populations [
17]. International health organizations have identified this equity challenge as crucial for securing sustainable pandemic control [
18,
19,
20]. Although social restrictions have been proposed as an alternative to vaccination programs, showing their capacity to restrict the spread of the pandemic [
21], such restrictions usually produce economic repercussions or decrease the quality of life of the population [
22,
23]. Conversely, vaccines provide protection while requiring little effort from the population, offering a realistic solution for many countries that cannot afford the economic repercussions of mass social isolation.
Thus, strategies have been developed to improve the use of available vaccines while aiming to reduce confirmed cases, hospitalizations, and deaths [
24,
25,
26]. Among these strategies, classifying the population by exposure or vulnerability to severe COVID-19 is the most common approach. Thus, many countries try to ensure the availability of vaccines for the elderly population, medical staff, or those who are immunocompromised or have underlying health conditions [
27]. However, because vaccines have limited availability, improvements in prioritization strategies have been insufficient to allow many governments to offer universal access vaccination programs to target such objectives, even in developed countries [
19].
However, the strategies mentioned above made several assumptions, including the consideration of non-time-dependent vaccine efficacies [
24,
25,
26]. Unfortunately, several reports have demonstrated that after reaching maximum vaccine effectiveness, this parameter wanes as the time-from-vaccine increases (i.e., the time from the last dose application) [
28,
29,
30,
31]. Furthermore, a data-processing strategy that enables estimation of a time-dependent effectiveness smooth profile was recently proposed, characterizing the beneficial effects induced in a population group by its vaccination process [
32]. This strategy demonstrates quantitatively that, at least for the considered example case, vaccine effectiveness highly depends on the time-from-vaccine, and its efficacy may last only a few months (4–5 months) [
32].
Until now, scientific efforts have mainly focused on obtaining useful information to select a more convenient population group to be vaccinated. However, as will be shown, this work is focused on increasing the beneficial effect obtainable with each administered dose, by studying not who must be vaccinated, but how they must be vaccinated. On this topic, it must be mentioned that the developers of the BNT162b2 vaccine only tested one value for the time between doses (21 days) [
33,
34,
35,
36,
37,
38], using this value in their phase 3 clinical trial [
12]. In the case of the AZD1222 vaccine, most of the studies published by developers reported 4 weeks as the time between doses [
39,
40,
41,
42,
43]. However, another of their studies considered 8 weeks [
44], and other three studies classified the recruited subjects on time periods between doses that were as long as 45 weeks [
45,
46,
47]. In addition, some studies for the AZD1222 vaccine showed, at an exploratory level, that the antibody titers [
46] and the vaccine efficacy [
47] depend on the considered time between doses considered, highlighting the necessity of taking advantage of such dependence in the real context of vaccine shortage. In fact, a wide interval (up to 12 weeks) for the time between doses of the AZD1222 vaccine was considered at least in some countries [
48,
49]. Nevertheless, the doses were administered four weeks apart in the phase 3 clinical trial of this vaccine [
11]. The latter demonstrates that the time between doses is a promising parameter that has been insufficiently studied, as the available studies did not offer a systematic strategy to select a time between doses that adapts to the local requirements, aiming to maximize the impact of each dose administered.
Thus, the complementary approach proposed here can contribute to the aim of reducing the number of vaccines required to protect a population by increasing the protection period in each recipient in whom a minimum objective efficacy is maintained.
The proposed strategy studies the effects on the vaccine’s global efficacy profile, expectably producible by the variation in the number of days between doses on two-dose vaccines. The aim of performing such variations is to maximize the protection time (the time during which the vaccine effectiveness value is higher than a pre-established value) achievable by two-dose vaccination schemes for any pre-established minimal efficacy value. Thus, local public health institutions can design specific vaccination schemes that meet the local efficacy requirements. Such a design may consider local vaccine acceptance, social behaviors, pathogen spread, or other parameters that local authorities consider convenient to handle the disease better.
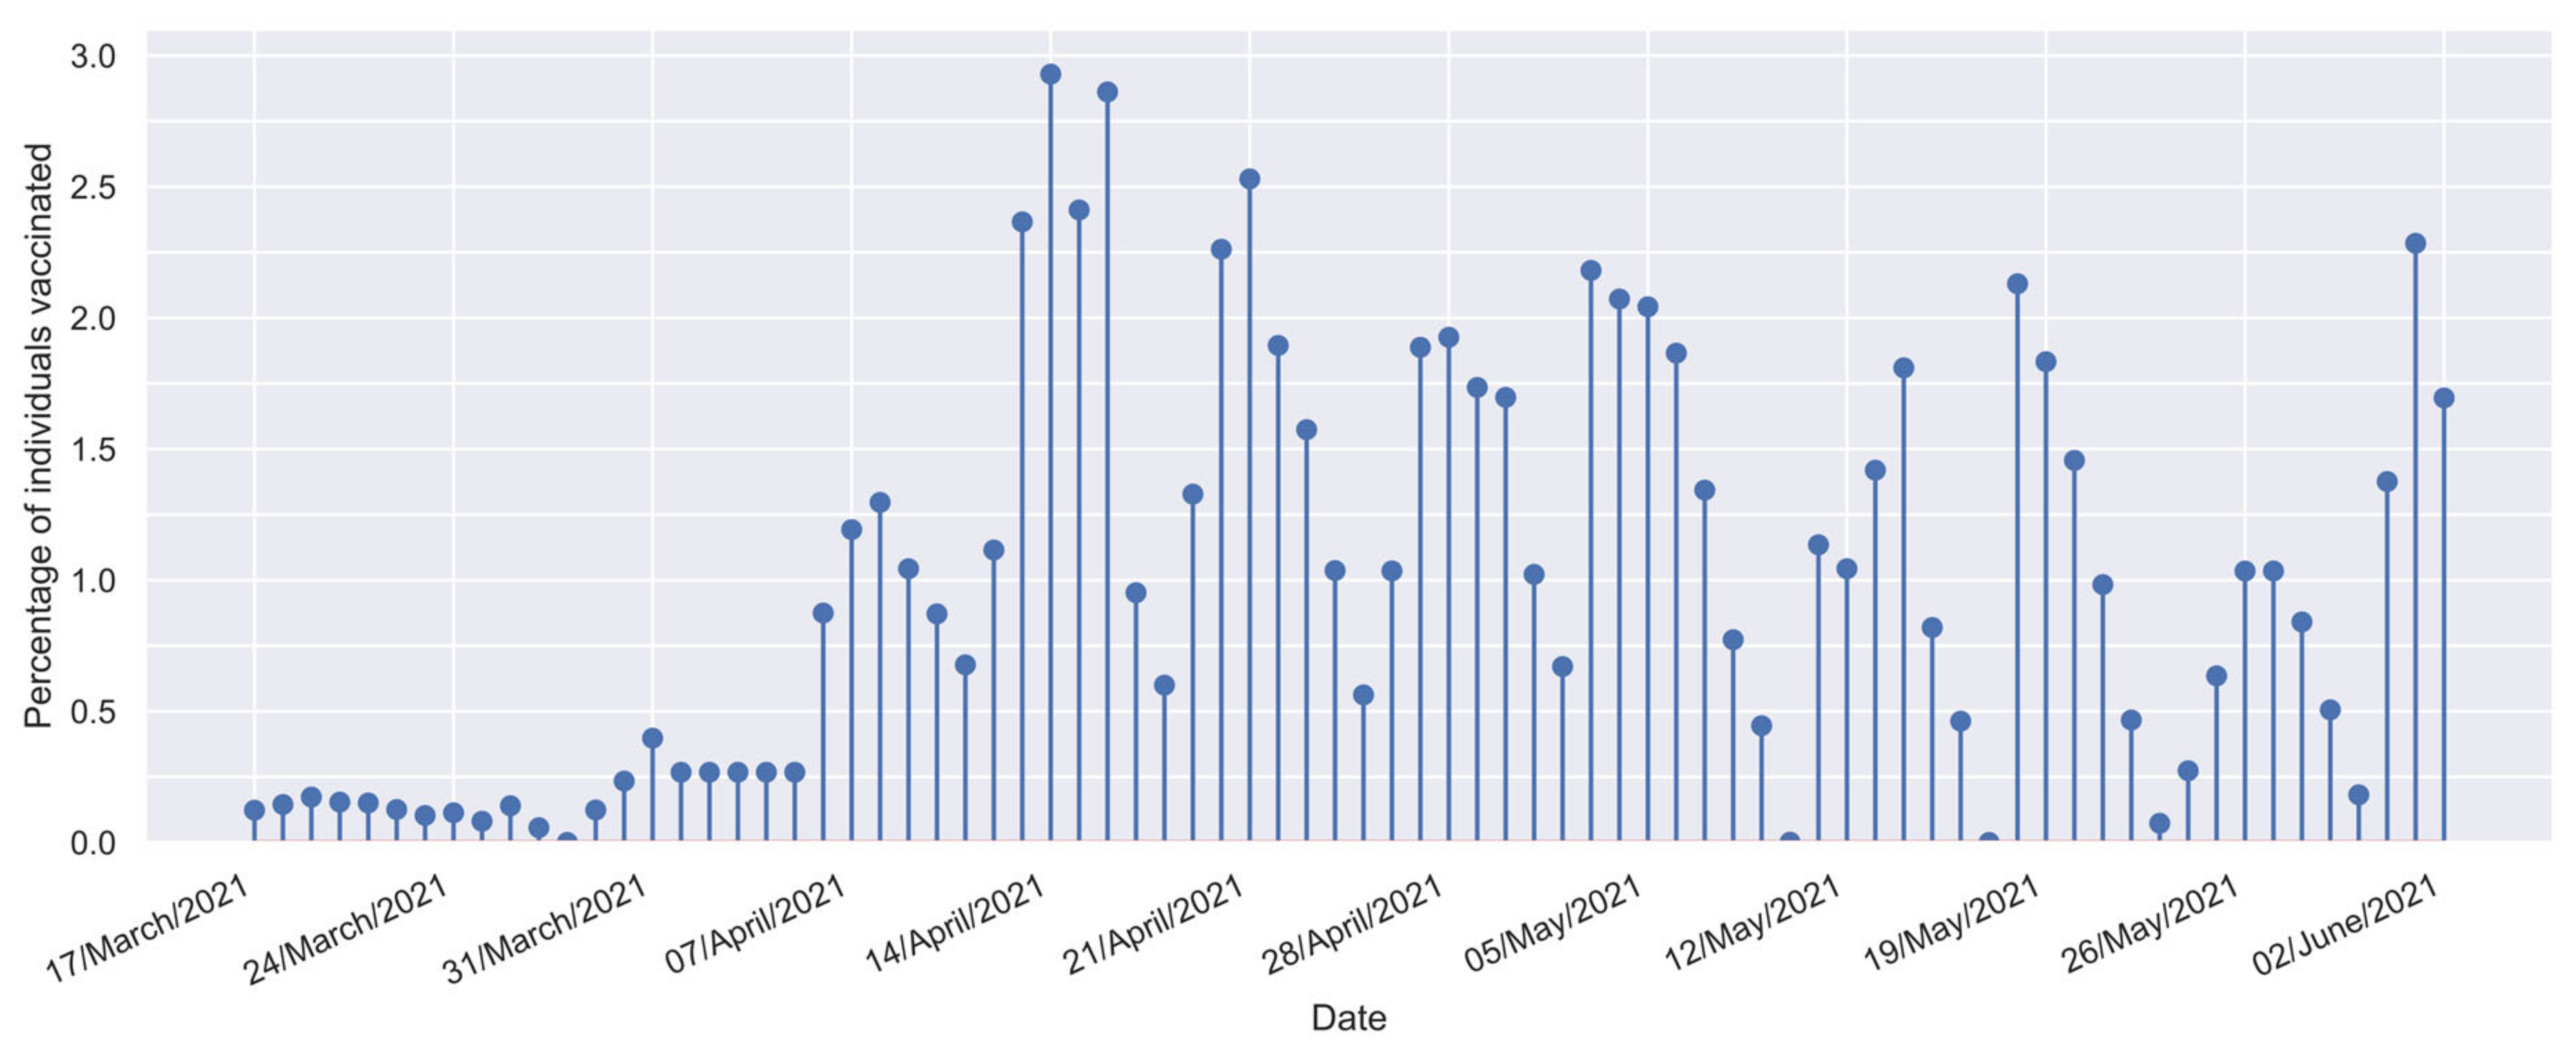
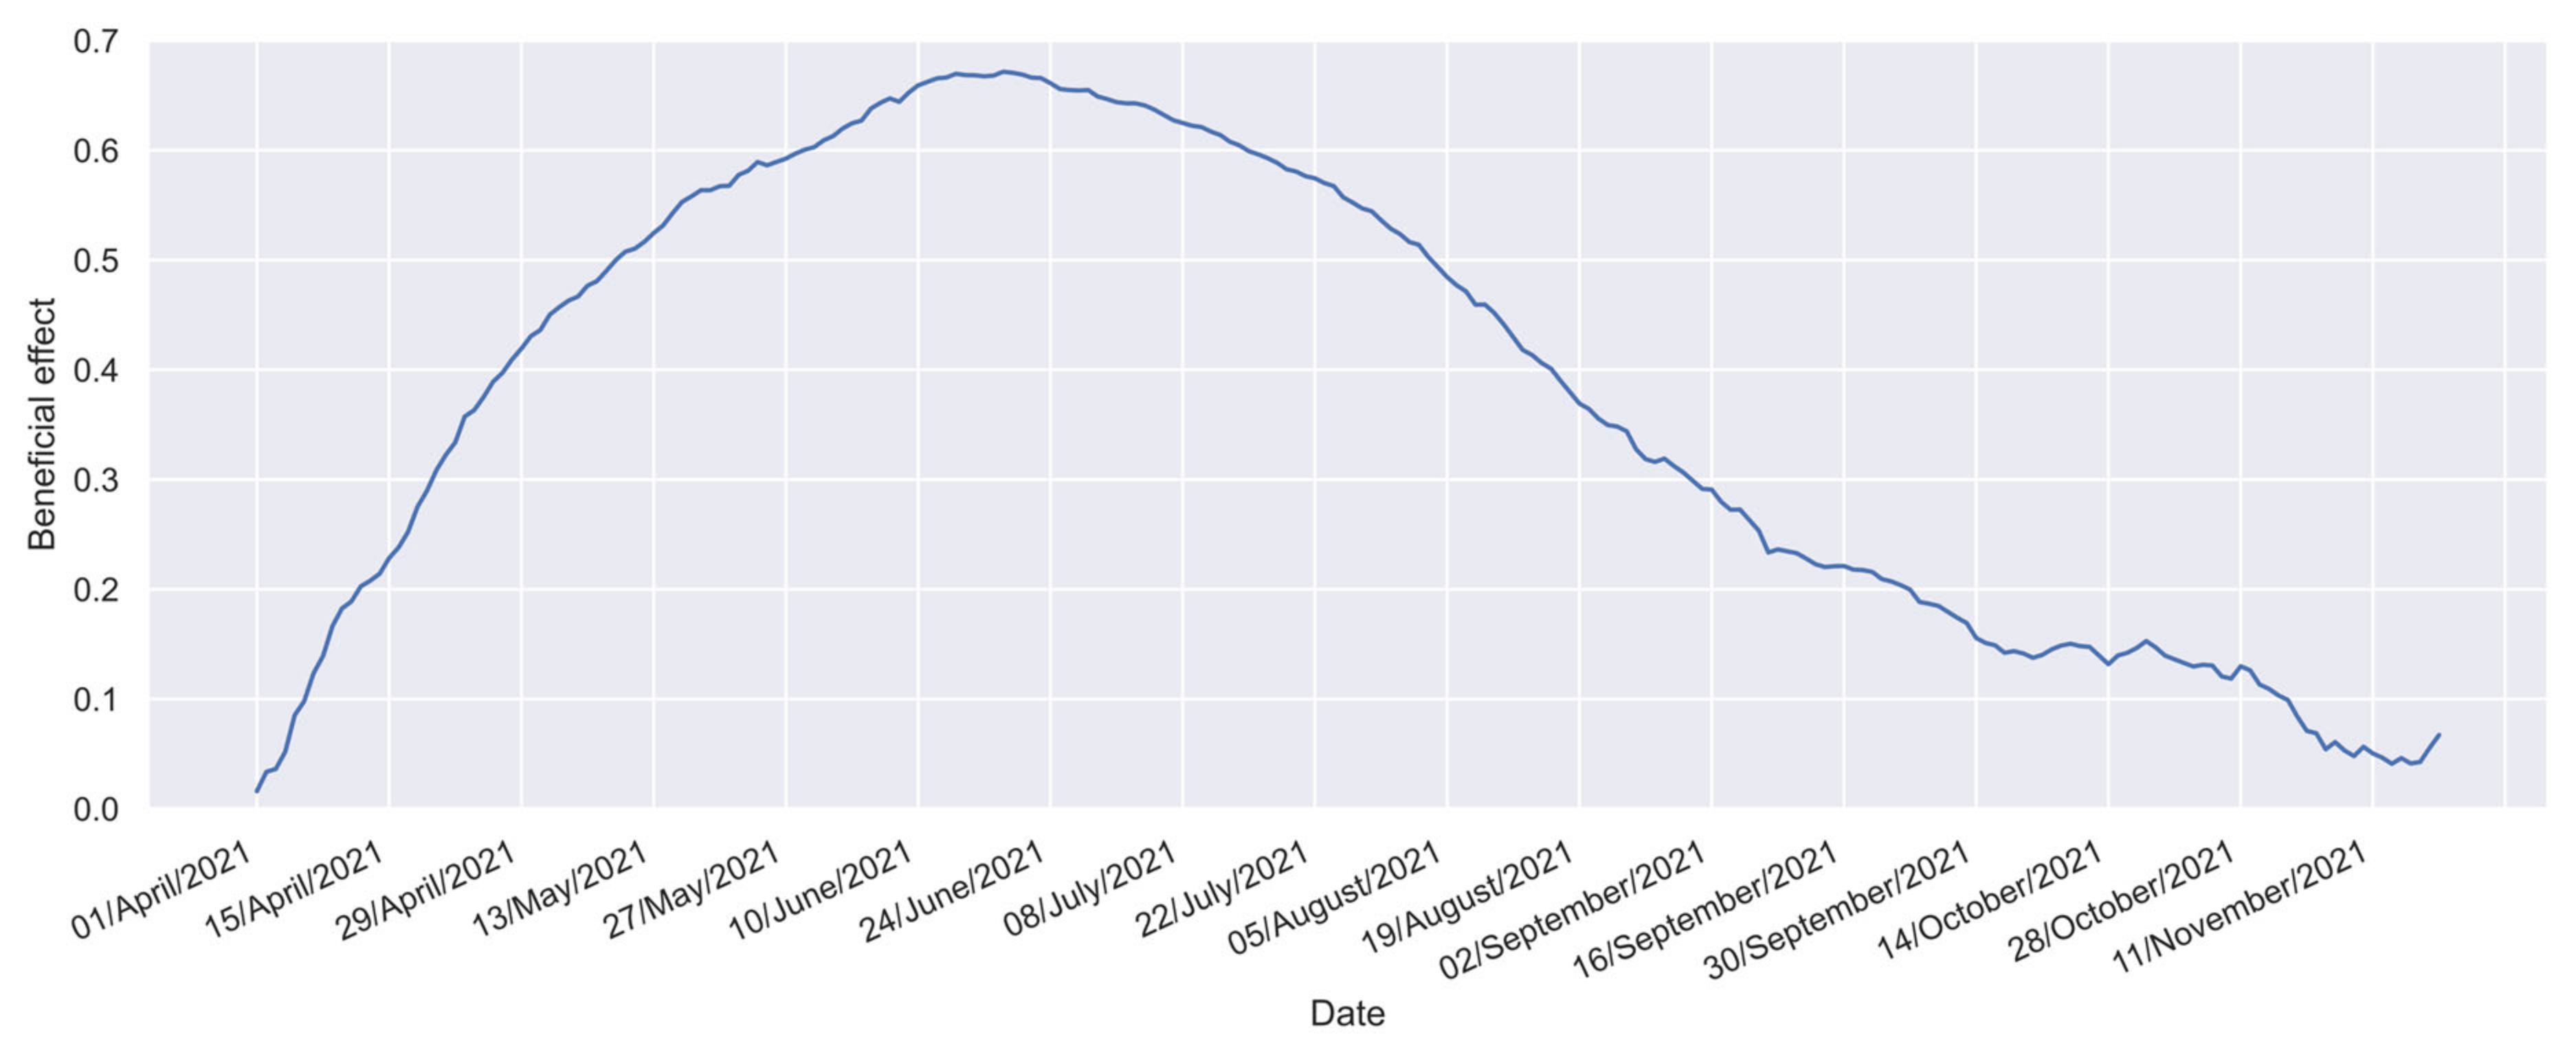
Accordingly, the inter-relationship of the following three parameters must be considered to estimate the vaccine’s effectiveness in a given population: (a) the beneficial effect profile (); (b) the vaccine effectiveness profile (); and (c) the vaccination profile of the population (). The beneficial effect profile () measures the relative incidence of confirmed cases in the study group compared with a reference group, providing a ratio that reflects the vaccine’s overall impact in reducing cases. The vaccine effectiveness profile () represents the time profile of protection offered by the vaccine, revealing how its effectiveness evolves over time and indicating any decline. The vaccination profile of the population () tracks the number of individuals vaccinated over time, offering a dynamic perspective on vaccination progress through the temporal distribution of inoculations.
From a mathematical point of view, the beneficial effect profile (
) can be modeled as a convolution between the vaccine effectiveness,
, and the vaccination profile of the population,
[
32]. As demonstrated in a previous study [
32], the traditional approach to determine the effectiveness from the quotient between the relative incidence of the confirmed cases in the vaccinated group and the equivalent relative incidence in the unvaccinated group is a particular case of such a convolution process, which can only be applied when the vaccine effectiveness is not time-dependent. Unfortunately, this condition was not fulfilled in the currently considered case, being required to apply a more complex procedure.
Convolution is a fundamental operation that allows us to characterize how the effectiveness of vaccines (
profile) interacts with the distribution and timing of vaccination efforts (
profile) to produce a reduction in the incidence of confirmed cases (
profile) [
32].
The used methodology takes advantage of the fact that the profile can be obtained from registers that track the incidence of confirmed cases in the study and reference groups, whereas the profile can be obtained from the temporal distribution of inoculations, which enables estimations of the vaccine effectiveness profile () by applying a process named deconvolution. Deconvolution, also known as inverse convolution, is the reverse of the convolution process. Convolution combines the functions and to produce a third function, , whereas deconvolution aims to recover the original element, , from the result of the convolution process (the output profile) and the known input profile ( profile).
Nevertheless, it must be considered that deconvolution is highly sensitive to noise (e.g., measurement errors or random fluctuations). Therefore, small changes in the inputs can significantly impact the obtained results. To handle this circumstance, in reference [
32], the deconvolution problem involved in obtaining the vaccine effectiveness (
) was addressed by defining continuous and smooth profiles to represent the vaccine effectiveness over time. These profiles offer a general understanding of how the vaccine’s effectiveness evolves after its administration. However, these profiles rely on a specific equation that omits the details that allow the separation of the effect of each vaccination dose, which is valuable information.
Thus, this study approached the deconvolution problem as an optimization process, where the task of recovering the unknown element, , from the observed output, , and the input, , was translated into finding the best approximation of that minimizes the deviation between the real-world profile and the estimated one.
To solve this optimization problem, a particle swarm optimization (PSO) algorithm was tailored for this application. PSO is a well-known classic method that can optimize continuous nonlinear functions [
50,
51,
52,
53,
54]. Its capabilities enable cost functions to be optimized even in highly dimensional spaces such as those considered in this study, where more than 200 parameters must be simultaneously fitted. By leveraging the strengths of PSO, the search space can be explored, looking for the deconvolved function
that best represents the original output,
, and input,
. By adopting this optimization-based approach, the proposed method offers flexible and contoured profiles that provide insights into the effect of each individual dose over time, named “malleable profiles.” These profiles offer a detailed understanding of the temporal dynamics of vaccine effectiveness, enhancing our ability to analyze and interpret the impact of each dose. Another important advantage of this approach is that treating the deconvolution problem as an optimization task can prevent the imposition of restrictions or assumptions on the data. This aspect is significant, as assumptions or restrictions can potentially introduce bias and disturb the results. By adopting a more flexible approach, the users obtain deconvolution results that are driven solely by the data and optimization process, leading to more accurate and reliable outcomes.
The remainder of this paper is organized as follows.
Section 2 contains a general overview of the whole method, as well as the required profiles to apply this methodology and an explanation of how such profiles were obtained.
Section 3 explains how to employ the profiles detailed in
Section 2 to estimate the longest time between doses that holds a minimal desired effectiveness for the maximum time period, and also contains a recommendation on how to select a desirable minimal effectiveness value for a given population. This section also compares the results of this methodology and previously reported methods.
Section 4 discusses the findings of this study and how such findings could help control the COVID-19 pandemic or any other future pandemic for which vaccines with two doses showing time-dependent efficacies have been developed. Finally, the conclusions are presented in
Section 5.
3. Results
Obtaining the proposed profiles followed a sequential procedure, as described in this section. Initially, the global vaccine effectiveness profile was estimated (as detailed in
Section 3.1). Subsequently, this profile was used to estimate the effect of each vaccination dose (
Section 3.2). Then, an exhaustive analysis of the effect of the time between doses had to be performed to determine the best scenario for obtaining the desired minimum effectiveness value during the longest possible time (
Section 3.3). In addition, because the desired effectiveness depends on the local conditions (e.g., the current or foreseeable virus spread level—
value—and the percentual vaccination coverage—
value—), in
Section 3.3.1, the inter-relationship among such variables is studied. Finally, a comparison between the proposed effectiveness profile and the equivalent information published previously is presented in
Section 3.4.
3.1. Estimation of the Global Vaccine Effectiveness Profile
As previously mentioned, to estimate the global vaccine effectiveness profile, it is required to consider the inter-relationship among the vaccine effectiveness profile (
), the beneficial effect profile (
), and the vaccination profile of the population (
), as expressed in Equation (2). In this case, convolution characterizes how the vaccine’s effectiveness (
) interacts with the distribution and timing of vaccination efforts (
) to induce a reduction in the relative incidence of confirmed cases in the studied population (
profile).
Equation (2) considers that the populational benefits observable on the macroscale (reductions in the relative incidence of confirmed cases;
profile) are composed of small contributions made by each subgroup (individuals vaccinated each day;
profile), weighted by the protection that the vaccines induce
days after each vaccination scheme is completed (the desired
profile); a more detailed description of Equation (2) was presented in a previous paper [
32].
However, considering that a physical phenomenon is being studied, the existence of perturbations in the measurements is expected. Therefore, obtaining the desired
profile implies executing the deconvolution of noisy data. As previously mentioned, classical methods to deconvolute signals tend to generate non-realistic solutions in noisy systems (owing to the high relation between variables that produce error accumulation in the system, making it unstable) [
60]. Several methods have been developed in the signal processing field to offer more realistic solutions and simultaneously reduce the deviation concerning the experimental data (for signals [
61] or images [
62]).
For vaccine characterization, a method that handles instabilities by proposing a general function that forces the system to generate smooth profiles that follow the expected global vaccine effectiveness profile shapes has been developed [
32]. Although this method offers an outline of the global vaccine effectiveness profile, it is incapable of characterizing the individual effects of each dose. Moreover, as such a profile can generate only one concavity in the estimated function, multimodal systems such as those expected in poly-dose schemes are beyond the capabilities of such a method.
Thus, this study proposes a novel strategy to address these limitations. A particle swarm optimization [
50,
51,
52,
53,
54] algorithm (PSO) tailored to this application is applied for this strategy. This algorithm considers each daily value of the
profile as a dimension for optimization (232 daily values were considered). In each iteration, this algorithm will propose a batch of candidate
profiles (50 candidates) that are convolved with the available vaccination profile (
), to identify a profile that deviates the least from the real-world beneficial effect profile (
).
Although a comprehensive overview of the PSO algorithm can be found in other sources [
54], key aspects of this methodology will be outlined here. The process begins by establishing a group of
profile candidates, which are randomly generated (in this study, 50 candidate profiles were created). Each profile is uniquely identified by the subscript
.
Later, each proposed profile is subsequently modified in each iteration, as indicated in Equation (3):
where
(the old value) and
(the new value) are the effectiveness values that the
candidate of the
profile assumes the vaccine will exhibit
days after administration of the second dose. Such values were sequentially assigned in the
and
iterations, respectively. In addition,
is the modification that each of such values will undergo in the
iteration.
The modification applicable to each previous candidate value can be calculated considering three terms that must be added, as indicated in Equation (4).
The first component of
in the PSO algorithm, known as the inertial term, focuses on the prior value of the modification to prevent abrupt changes. The second element, the cognitive term, guides candidate solutions towards their optimal historical performance. This encourages exploration of the search space to identify promising areas. The third, the social term, reflects the influence of the entire population on individual behavior, steering the search towards the best solution found within the group, thus refining the current top solution. Importantly, random numbers (
and
) influence the cognitive and social terms, meaning that their impact varies throughout the search process. Additionally, the significance of each term is determined by the relative magnitudes of the
,
, and
coefficients, with the latter two being adjusted in each iteration. For this study, two decreasing exponential functions were utilized to calculate these coefficients. After updating all effectiveness values,
, a moving average [
63] is applied. This step is essential for achieving smoother profiles at the end of each of the 1000 iterations considered in the process.
The pseudocode for the modified PSO scheme proposed in this study is shown in Algorithm S1, which is included in the
Supplementary Materials SM1.
In addition, to obtain a more realistic
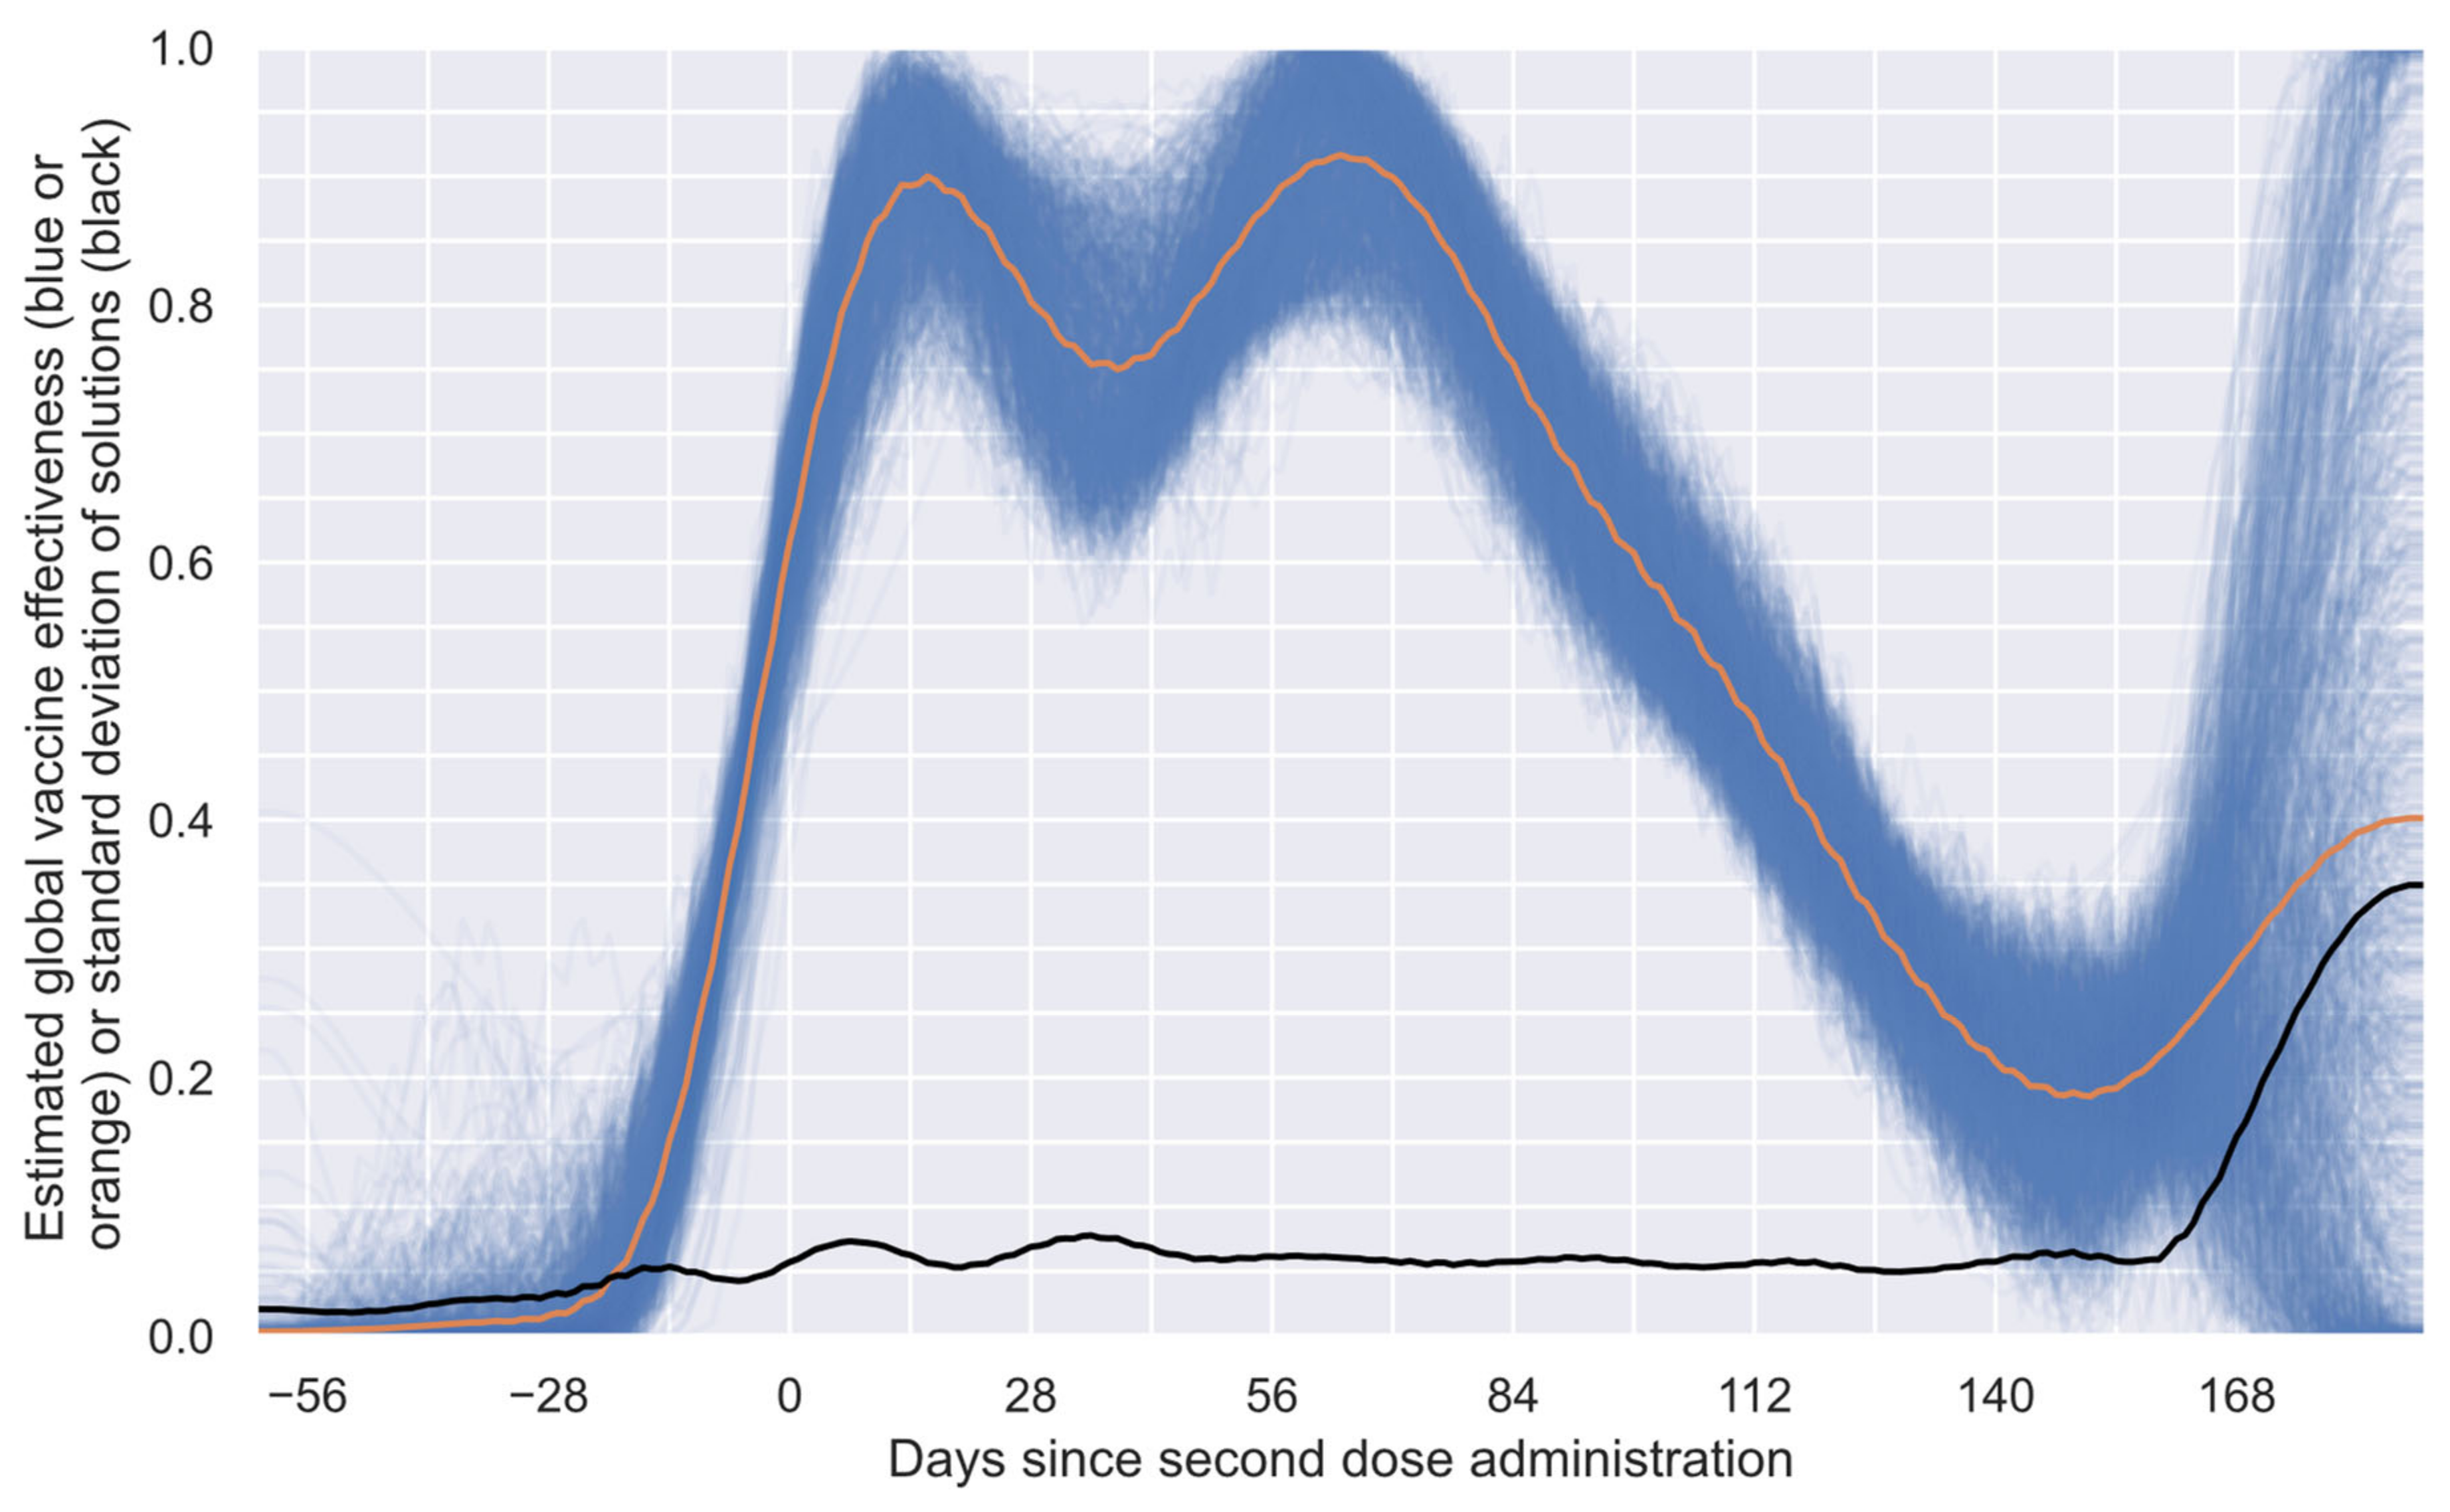
profile, the methodology was run 1000 times;
Figure 3 presents the 1000 obtained numerical estimations (blue curves), the mean solution of such numerical estimations (orange curve), and the standard deviation of the numerical solutions (black curve). In
Figure 3, it can be observed that most solutions show agree-shaped profiles on the first segment of the profile (approximately 85% of the considered period), with considerable differences only in the last part. This behavior can easily be explained by considering that the system has only a few subgroups with sufficient time to offer information for the last segment, making the profile inference blurry. This characteristic allows this algorithm to set, in an approximate way, the limit of the estimable profile by considering the available data. To generate the exact limit of the estimable profile, the standard deviation of the solutions (
Figure 3, black curve) and an algorithm that detects elbow/knee conditions can be used to determine the date when the system becomes unstable [
64].
In many engineering problems, it is necessary to determine the point at which a slight change in one variable implies a significant change in another. This problem is commonly known as an elbow or knee condition [
64]. Considering the intrinsic characteristics of the numerical estimations performed to obtain the results shown in
Figure 3, a knee condition was employed to estimate the last point, after which the system provided unreliable information. Thus, a general-purpose algorithm, known as “kneedle” [
64], was used to find such a point. This algorithm was selected because of its simplicity and generality [
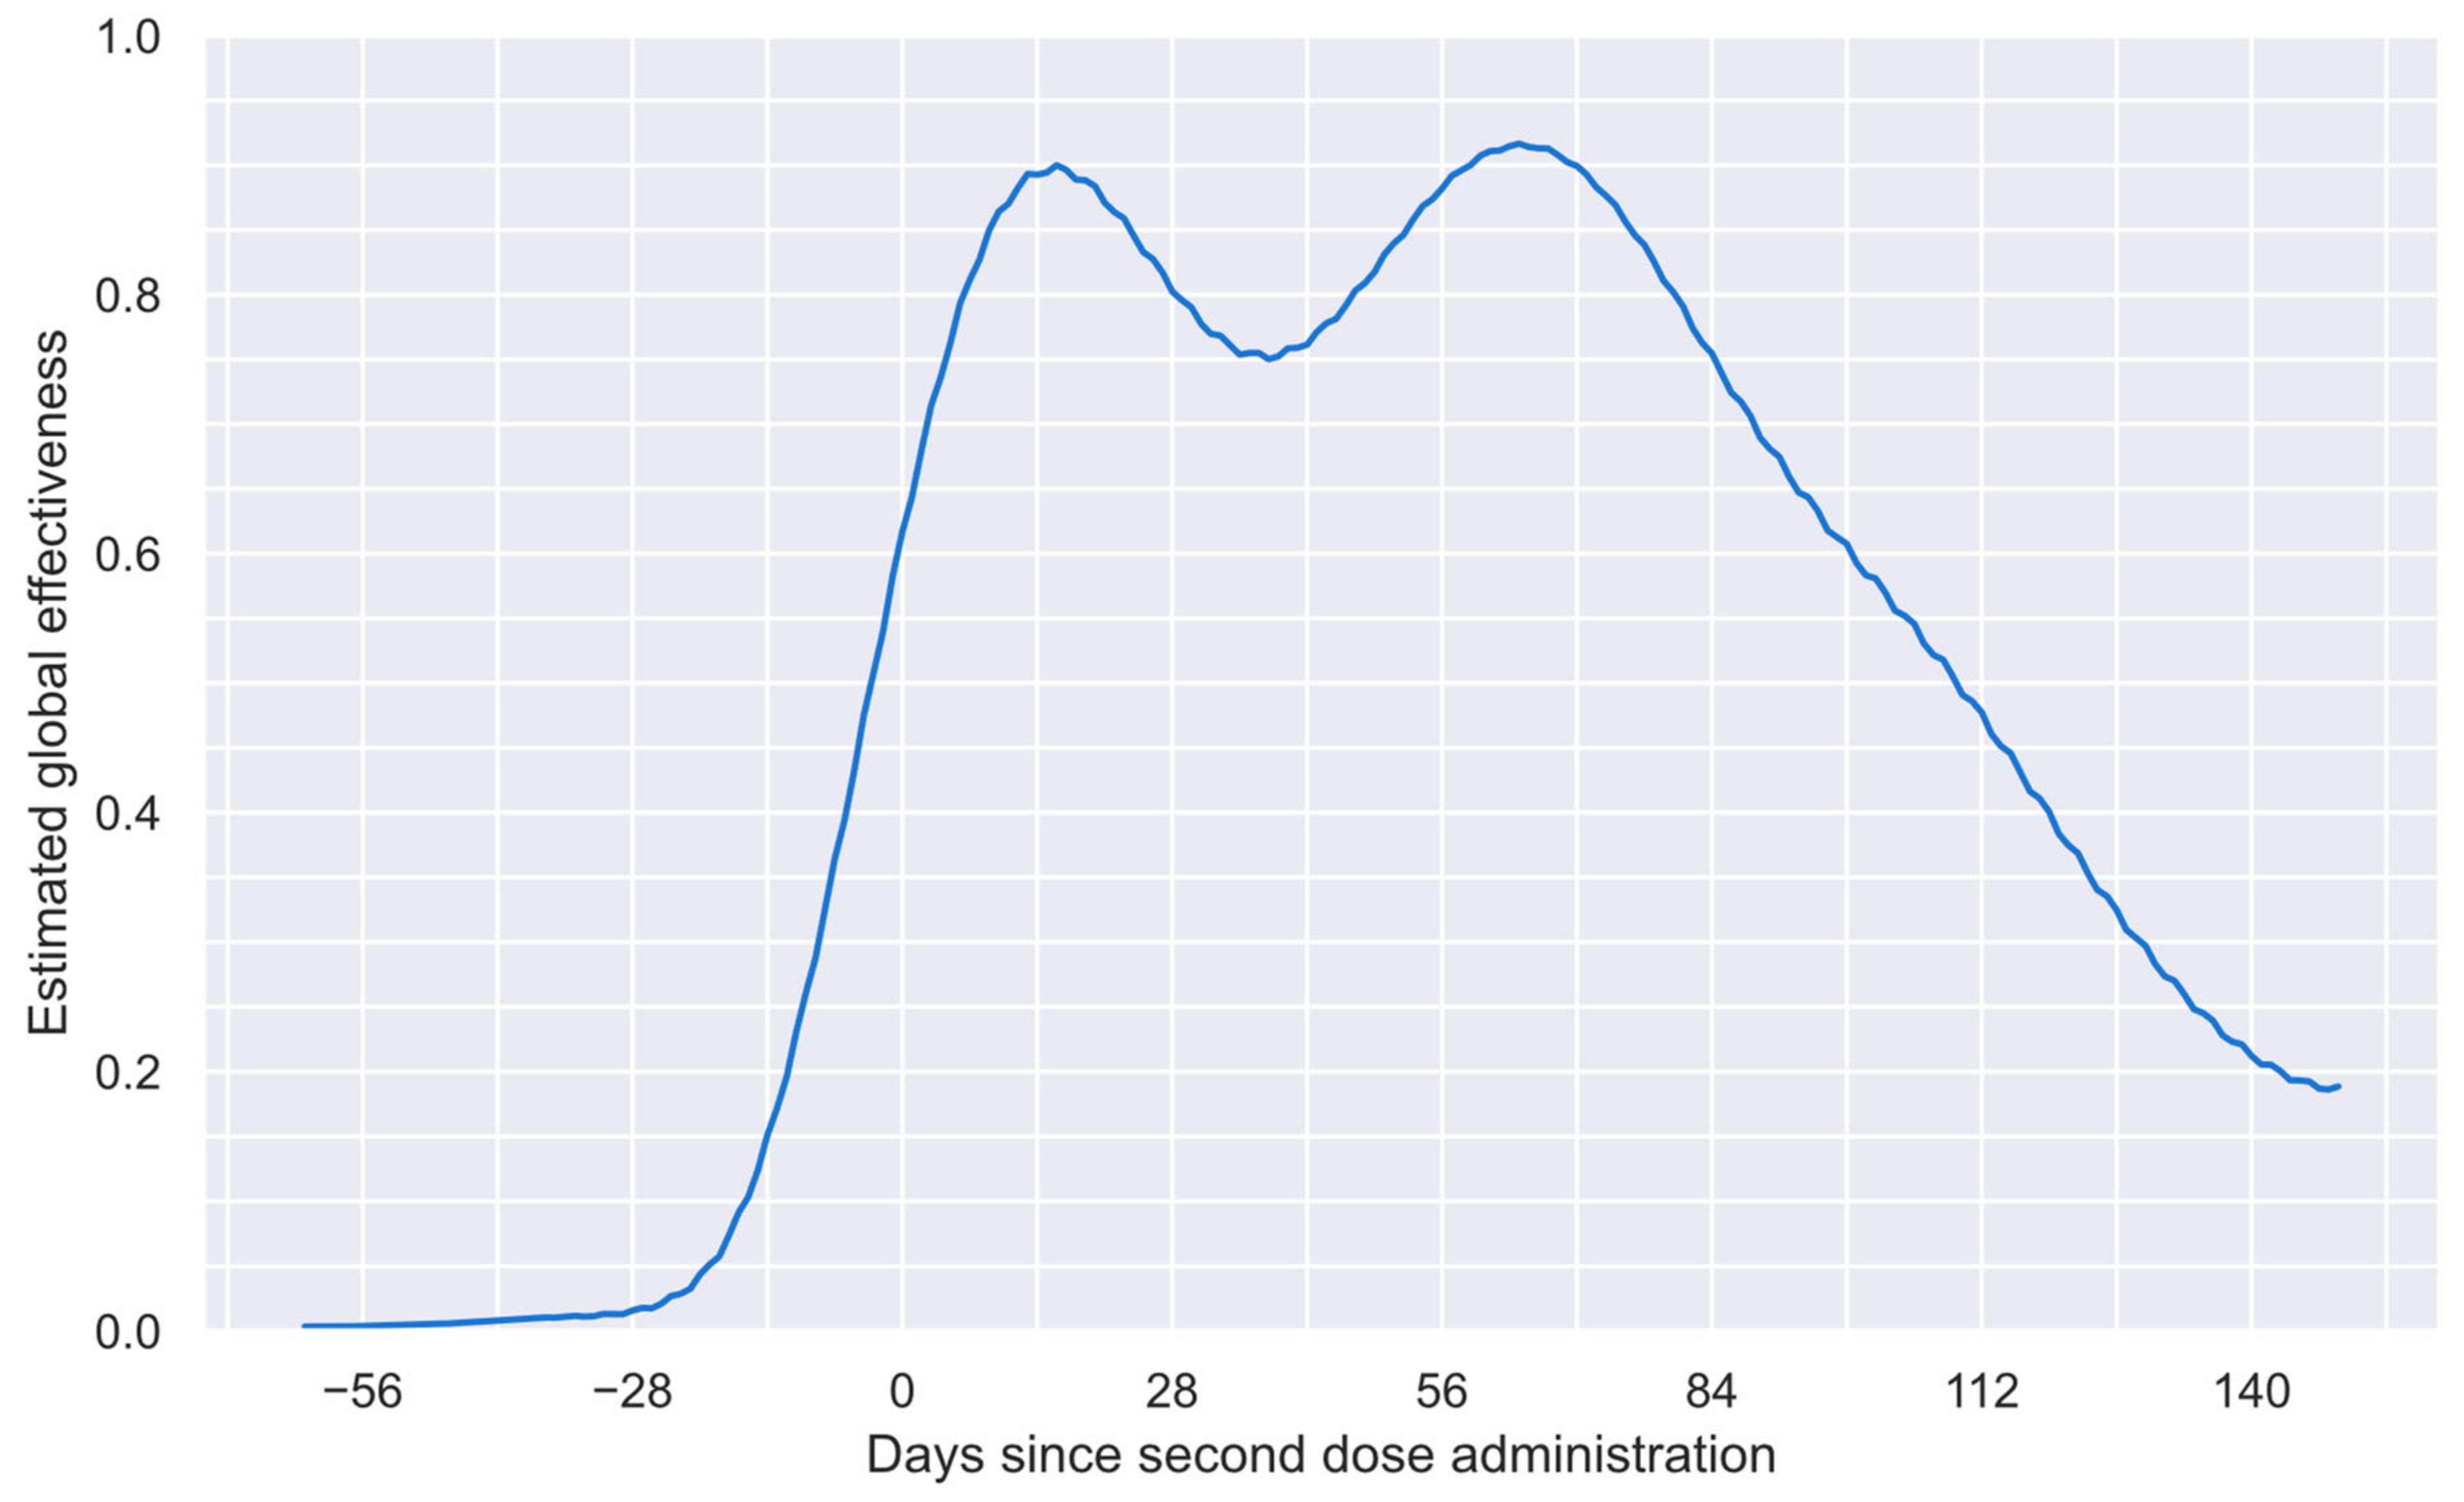
64]. After applying this algorithm, it was found that 149 days after the second dose was administered, the system offered a blurry solution based on the data considered. Thus, in
Figure 4, the reliable period for the estimated global vaccine effectiveness profile is shown. This profile comprises 212 values from 62 days before the second dose to 149 days after such a dose.
After determining the reliable period of the estimated global profile, as shown in
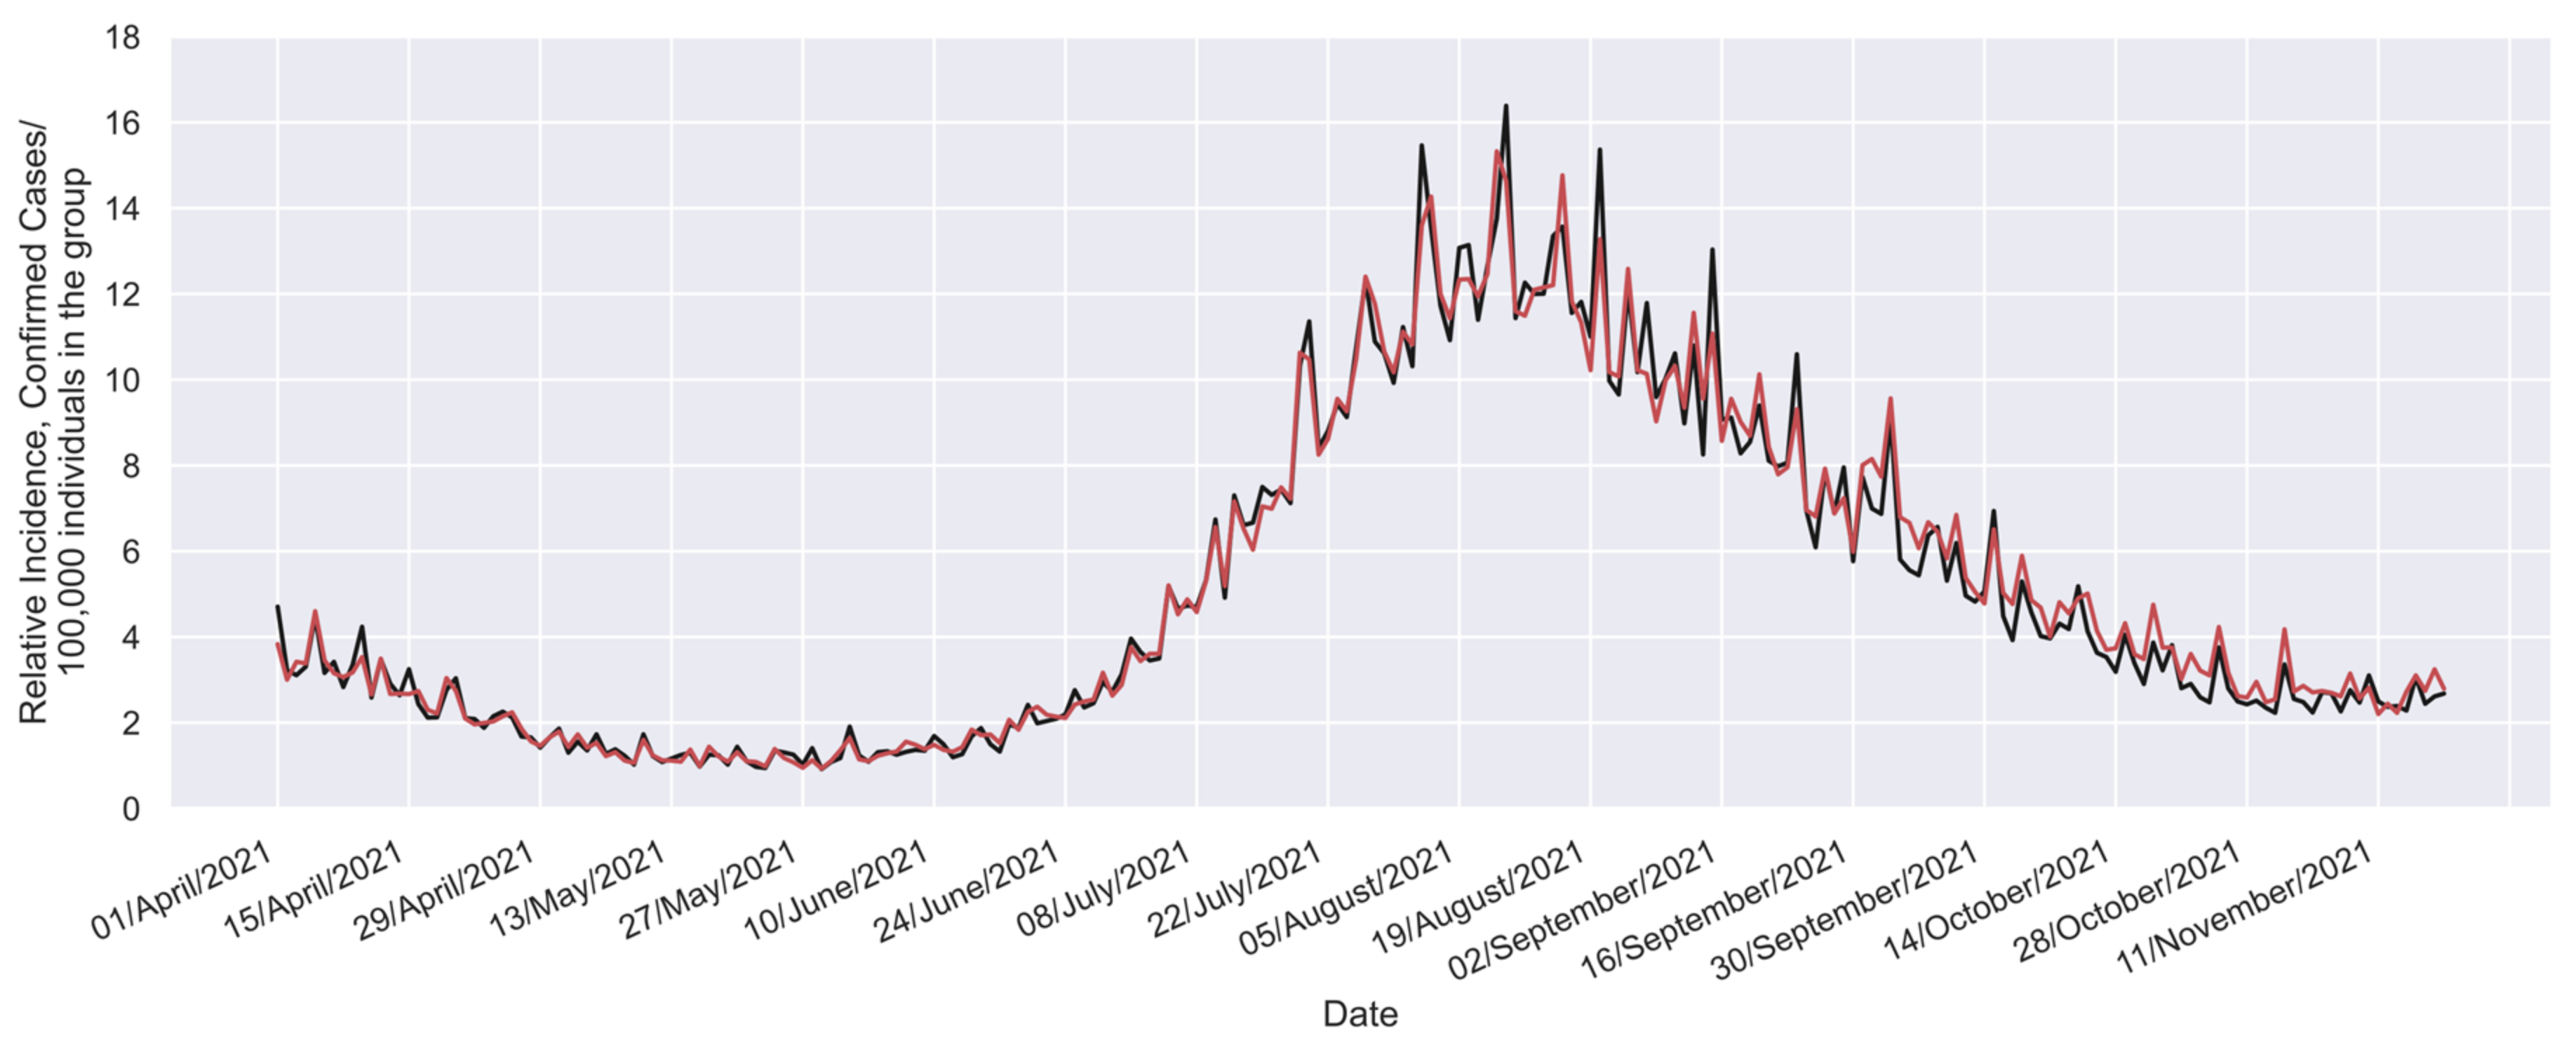
Figure 4, the next step is to validate its accuracy against the actual confirmed cases in the study group. To do this, it is helpful to use Equation (1) to solve for
, as outlined in Equation (5). Furthermore, by considering both Equations (2) and (5), we can formulate Equation (6).
Thus, the real-world data (
[
57,
59]) can be directly compared with the equivalent values (
), which can be calculated considering Equation (6), the available vaccination profile (
profile shown in
Figure 1), the
profile (
Figure 4), and the incidence in the reference group [
57,
59]. Such a comparison is shown in
Figure 5.
While minor discrepancies are noticeable when comparing the two profiles, these can largely be attributed to the inherent variability and noise characterizing real-world systems. Nonetheless, a clear and consistent overall trend is evident in both profiles. This shared pattern highlights the effectiveness of the proposed methodology in estimating the global vaccine effectiveness profile.
3.2. Extracting the Effectiveness Profile of Each Vaccine Dose
Although a global vaccine effectiveness profile is highly desirable for developing successful vaccination programs, knowing the effect of each independent vaccine opens up additional possibilities for surgical adaptation to local necessities. Considering this information, dynamic actions could be taken to address local public health challenges, such as reducing the numbers of confirmed cases, hospitalizations, and deaths, managing the economic impacts and social restrictions, and better protecting susceptible or vulnerable groups such as doctors or the elderly.
Thus, in this study, two basic interaction models were tested to determine the effect of each vaccine dose, which are represented by Equations (7) and (8). Nevertheless, the versatility of the proposed model allows for the consideration of more complex interactions between vaccines that could be used for other vaccines when necessary.
In Equations (7) and (8),
is the estimated global effectiveness profile (
Figure 4) and
is an effectiveness profile that represents only the global reduction in confirmed cases that would be induced by administration of the first dose. Notably, since
and
start their respective effects at the same time, in the used notation, both parameters must be expressed as a function of the same time scale (
). Additionally,
is an effectiveness profile representing only the global beneficial effect induced in recipients by the second dose. Since such an effect starts later, specifically
days later, in the adopted notation, the functionality with time must be expressed as
. Note that
is a fitting parameter that can coincide, or not, with the considered time between doses, as these curves are estimated from the induced effect perspective.
The best fit to the profile shown in
Figure 4 was obtained when the interaction model represented by Equation (8) was used (additional details are presented in
Supplementary Materials SM2). Therefore, such an interaction model was the only one considered in the process of obtaining the optimal time between doses. Nevertheless, further details about the fitting obtained with the other interaction model (in the two proposed versions) have been included in
Supplementary Materials SM3.
As many numerical profiles can satisfy the constraints of the proposed model, a smooth continuous equation that represents the time dependence of the effectiveness of each dose must be considered. Thus, a recently proposed equation for estimating the global effectiveness profile [
32] was considered in this study (Equation (9)). However, such an equation is now used to fit the effectiveness of each independent dose instead of considering it for the global effectiveness profile. This selection was made considering the high malleability of the family of profiles that can be generated with this equation. Thus,
Supplementary Materials SM4 presents two illustrative videos to appreciate such a malleability. There, an ordered sweep of each parameter is performed in the first video. In contrast, in the second video, a simultaneous random exploration of the eight parameters of such an equation is conducted. Thus, in the considered decoupling process, eighteen parameters must be fitted.
Here, a general optimization algorithm must fit both profiles (
and
)) to the data of the global vaccine effectiveness profile shown in
Figure 4 (
). This study used an algorithm known as GRG Nonlinear [
65,
66,
67,
68], which is available on the Microsoft Excel solver tool from Office 365. The recommended parameters and restrictions used for this optimization are shown in
Table SM5-1 of Supplementary Materials SM5. The mean square deviation was used as the element to be minimized (details of the fitting process can be analyzed on the spreadsheet used, which is included in
Supplementary Materials SM2, jointly with the information presented in the Supplementary Materials included in Ref. [
32]).
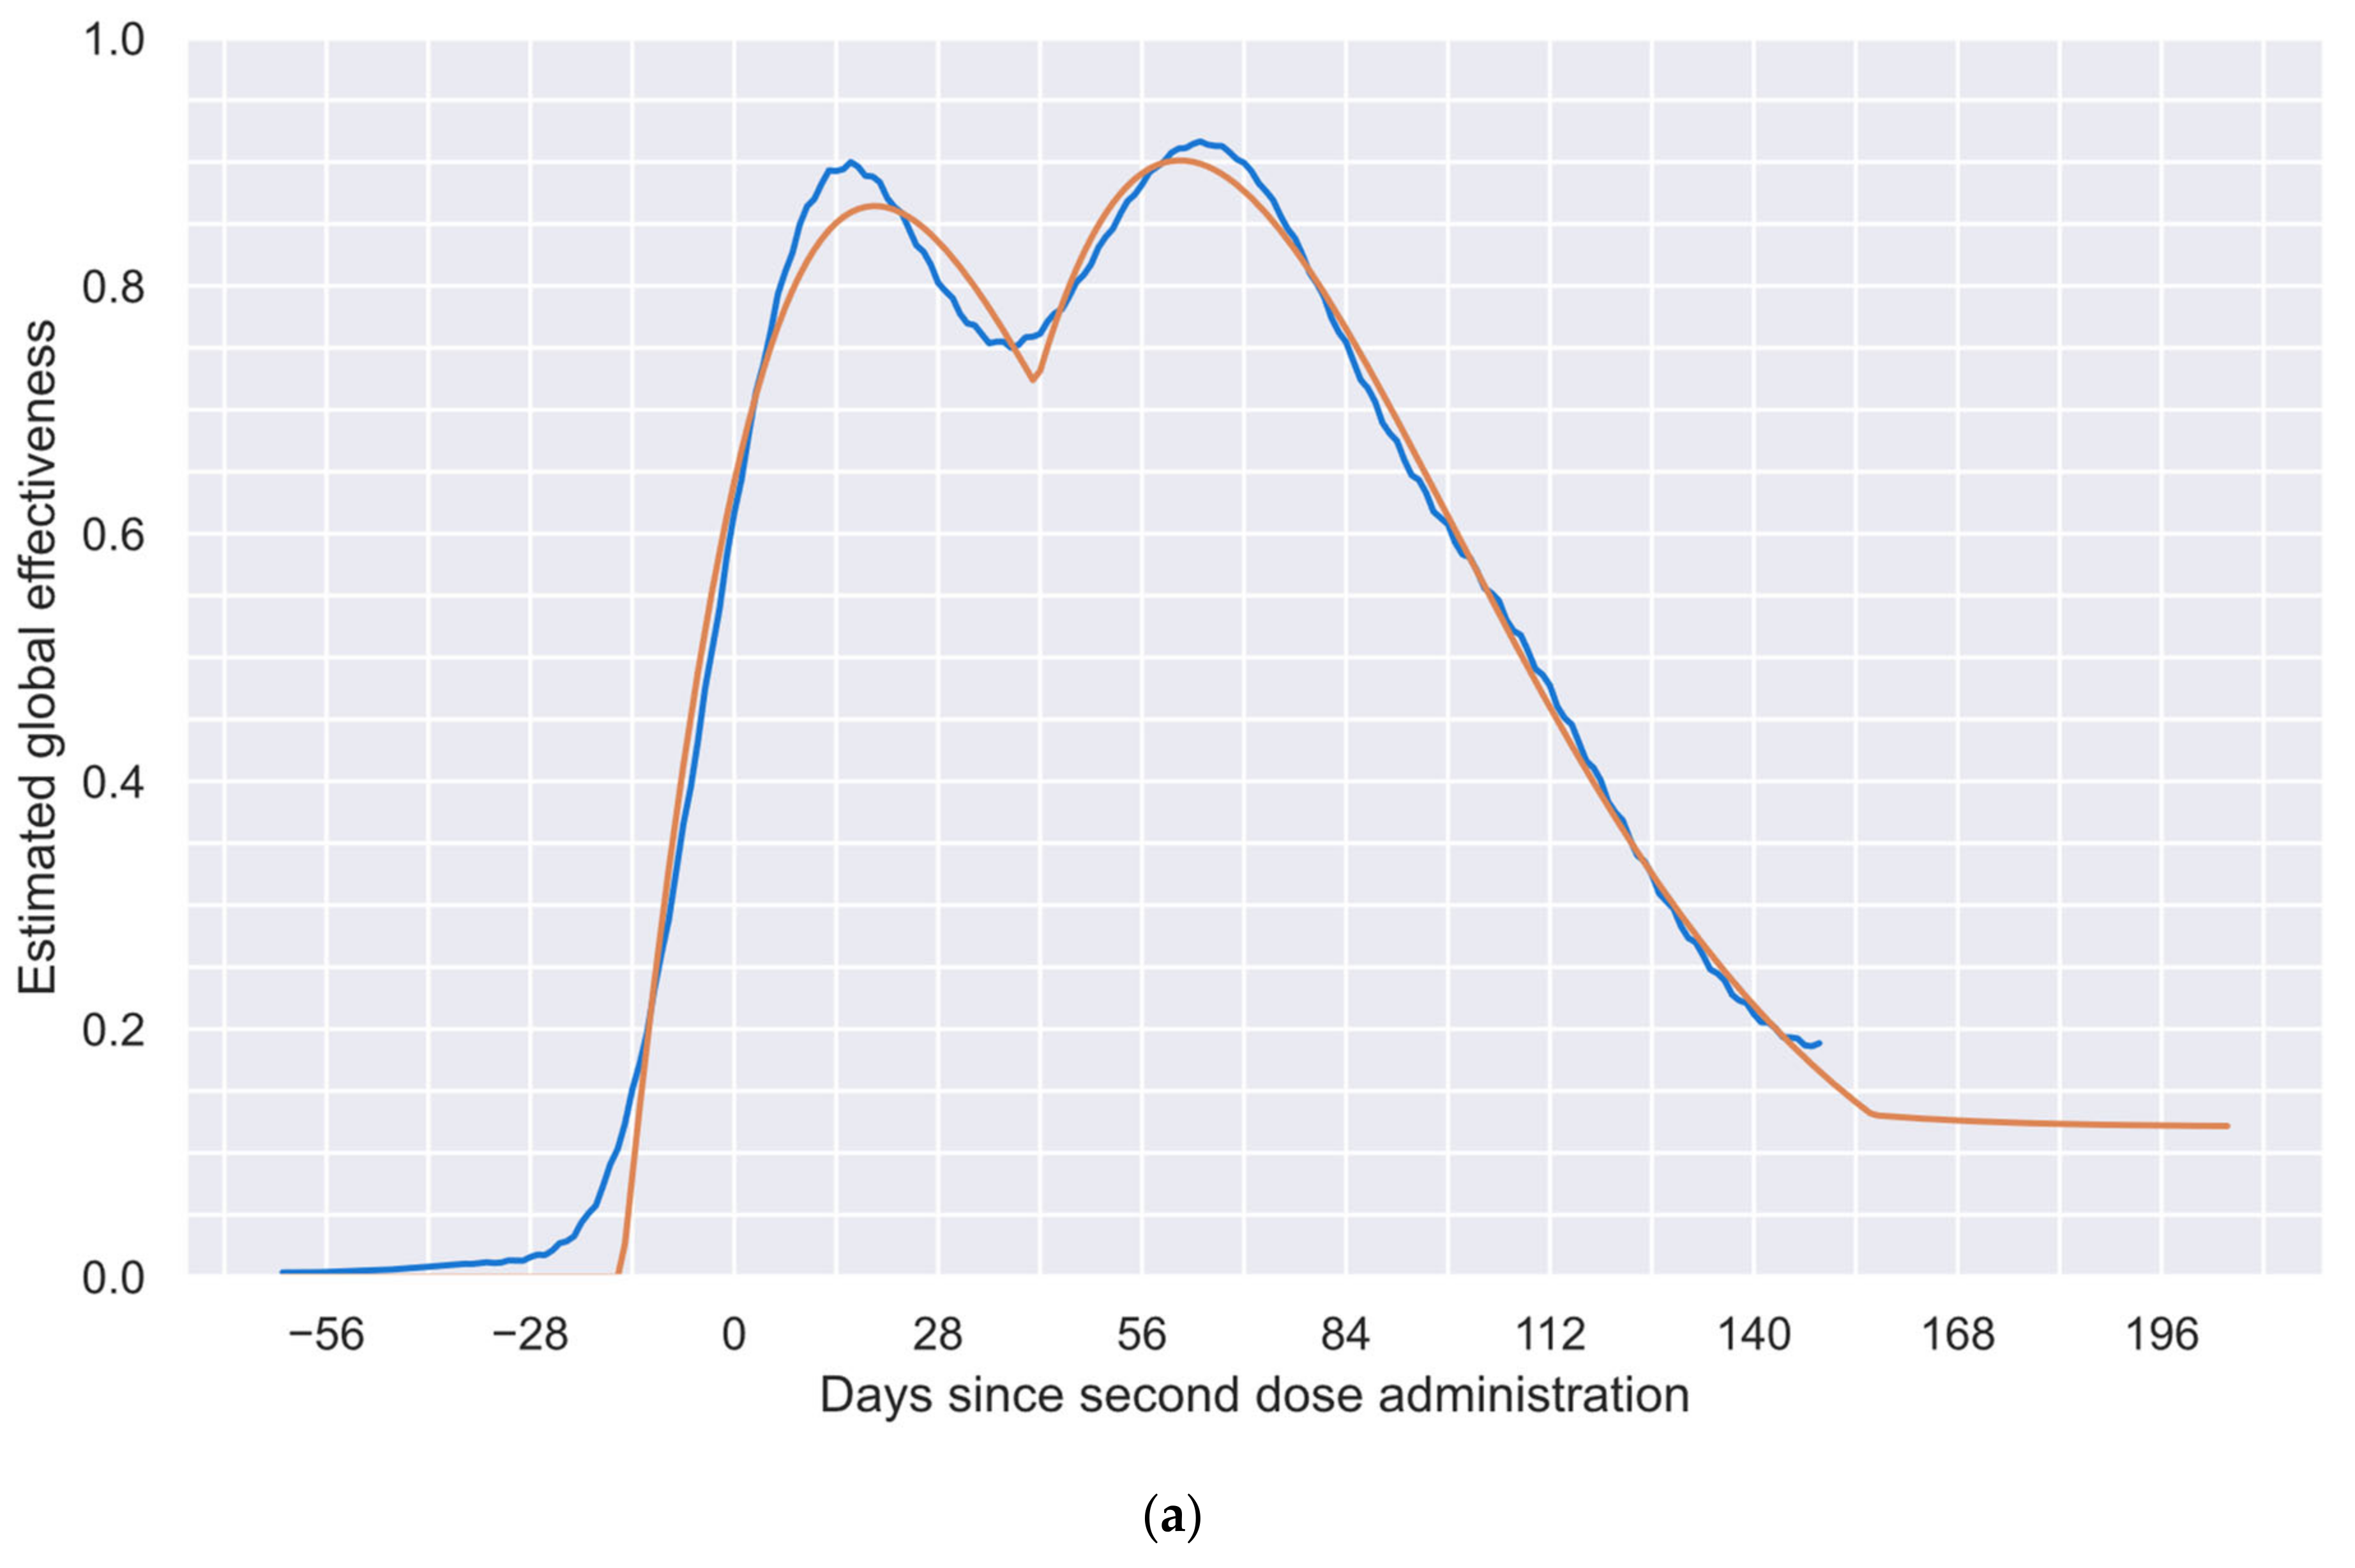
In
Figure 6, the results of the procedure described above are shown. In
Figure 6a, the blue curve represents the previously determined global vaccine effectiveness (reproduced from
Figure 4), and the orange curve represents the fitted profile, composed of the independent effect of each of the two doses; the mean square deviation between such profiles is
square units, which denotes a very good fit for a real-world phenomenon. In addition,
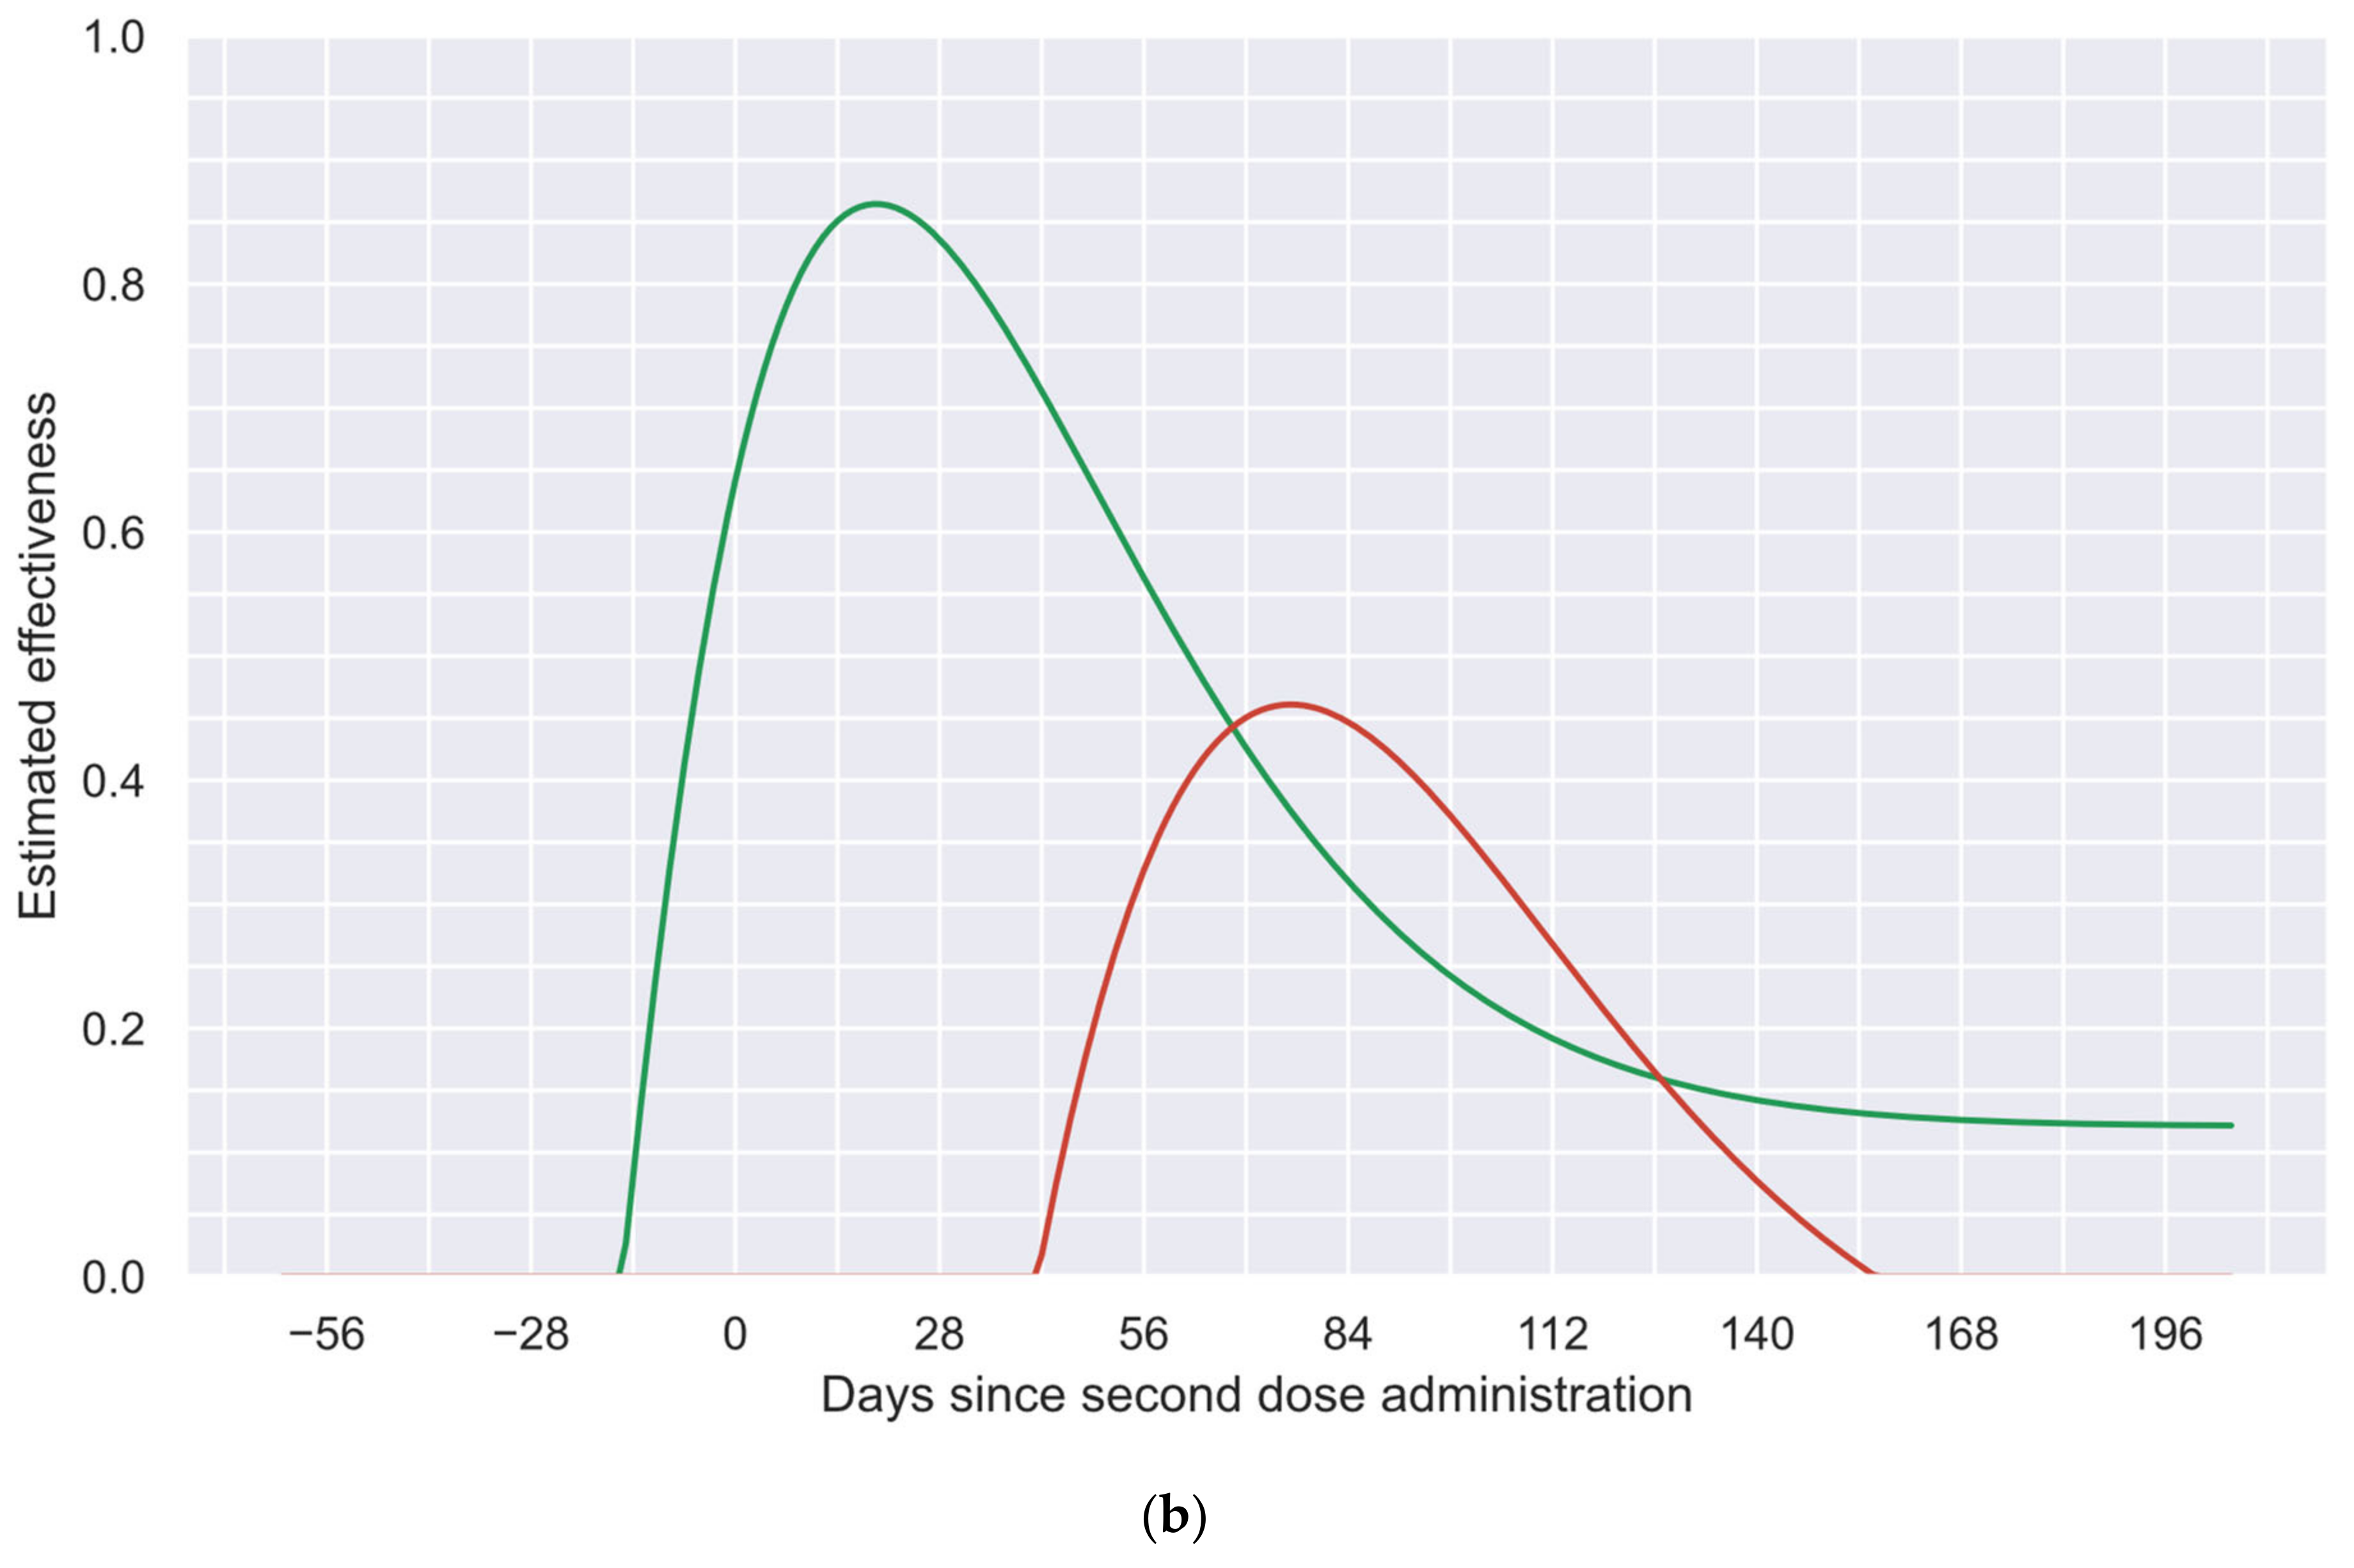
Figure 6b shows the estimated vaccine effectiveness profile of each dose. Importantly, these profiles were inferred from the induced effect perspective. Therefore, as previously mentioned, the time elapsed between the start of the effects of each dose may not be the same as the time between the administration of both doses.
In
Figure 6a, three different periods in the fitted global effectiveness profile (orange curve) can be distinguished: (a) the first one, where only the first dose induces an effect; (b) the second one, where both doses collaborate to increase the effectiveness; and (c) the third one, where only the long-term effects remain.
In the first period, as the second dose has not been applied or has not induced a perceptible effect (see
Figure 6b for details), only the first dose is acting. This period is responsible for the first local maximum and the first waning, as the second dose does not start its effect until day 42.
In the second period (from day 42 until day 156), the effects of the second dose not only compensate for the waning of the effectiveness of the first dose (which would have kept decreasing without the second dose), but its rapid increase allows for an increment in the overall global effectiveness profile. This period is responsible for the change in direction after the first local minimum and the generation of the second local maximum observable in
Figure 6a. In addition,
Figure 6b shows how the effects of both doses act during this period.
In the last period (after day 156), only the long-term effects are preserved, which are observable as a plateau at the end of the global effectiveness profile, as shown in
Figure 6a.
Thus, the contoured shape of the fitted global effectiveness profile presented in
Figure 6a demonstrates the capabilities achievable by this methodology, allowing for these interaction phenomena to be appreciated. This level of analysis is not achievable by traditional phase 3 clinical trial methodologies, which only allow for the estimation of “wide regions” instead of contoured precise profiles (as will be discussed later).
Finally, it is important to consider that the tailored PSO trends to generate contoured profiles, as shown in the blue curve of
Figure 6a. In counterpart, the method employed to independently estimate the effectiveness of each dose tends to estimate sharp changes attributed to each dose (as the green and red curves in
Figure 6b). Considering the inherent behaviors of both methodologies, the existence of certain limitations near to the first dose administration could be anticipated (day-31). As a consequence of such a limitation, small effectiveness values (<1%) are induced in the blue curve in
Figure 6a, before the application of the first dose. Nevertheless, it was numerically corroborated that their effects were practically imperceptible on the results of the following steps.
3.3. Recommended Time between Doses for a Given Effectiveness Value
As mentioned in the Introduction, the time between doses is a promising parameter that enables leverage of each couple of doses in a better way [
46,
47]. However, in the case of COVID-19 vaccines, to date, such an opportunity has not been explored practically. Considering the few clinical trials performed to test different times between doses, the different scenarios that countries face, and the diverse local pandemic contention strategies implemented, it is logical to expect that the same time between doses will not be optimal in every situation.
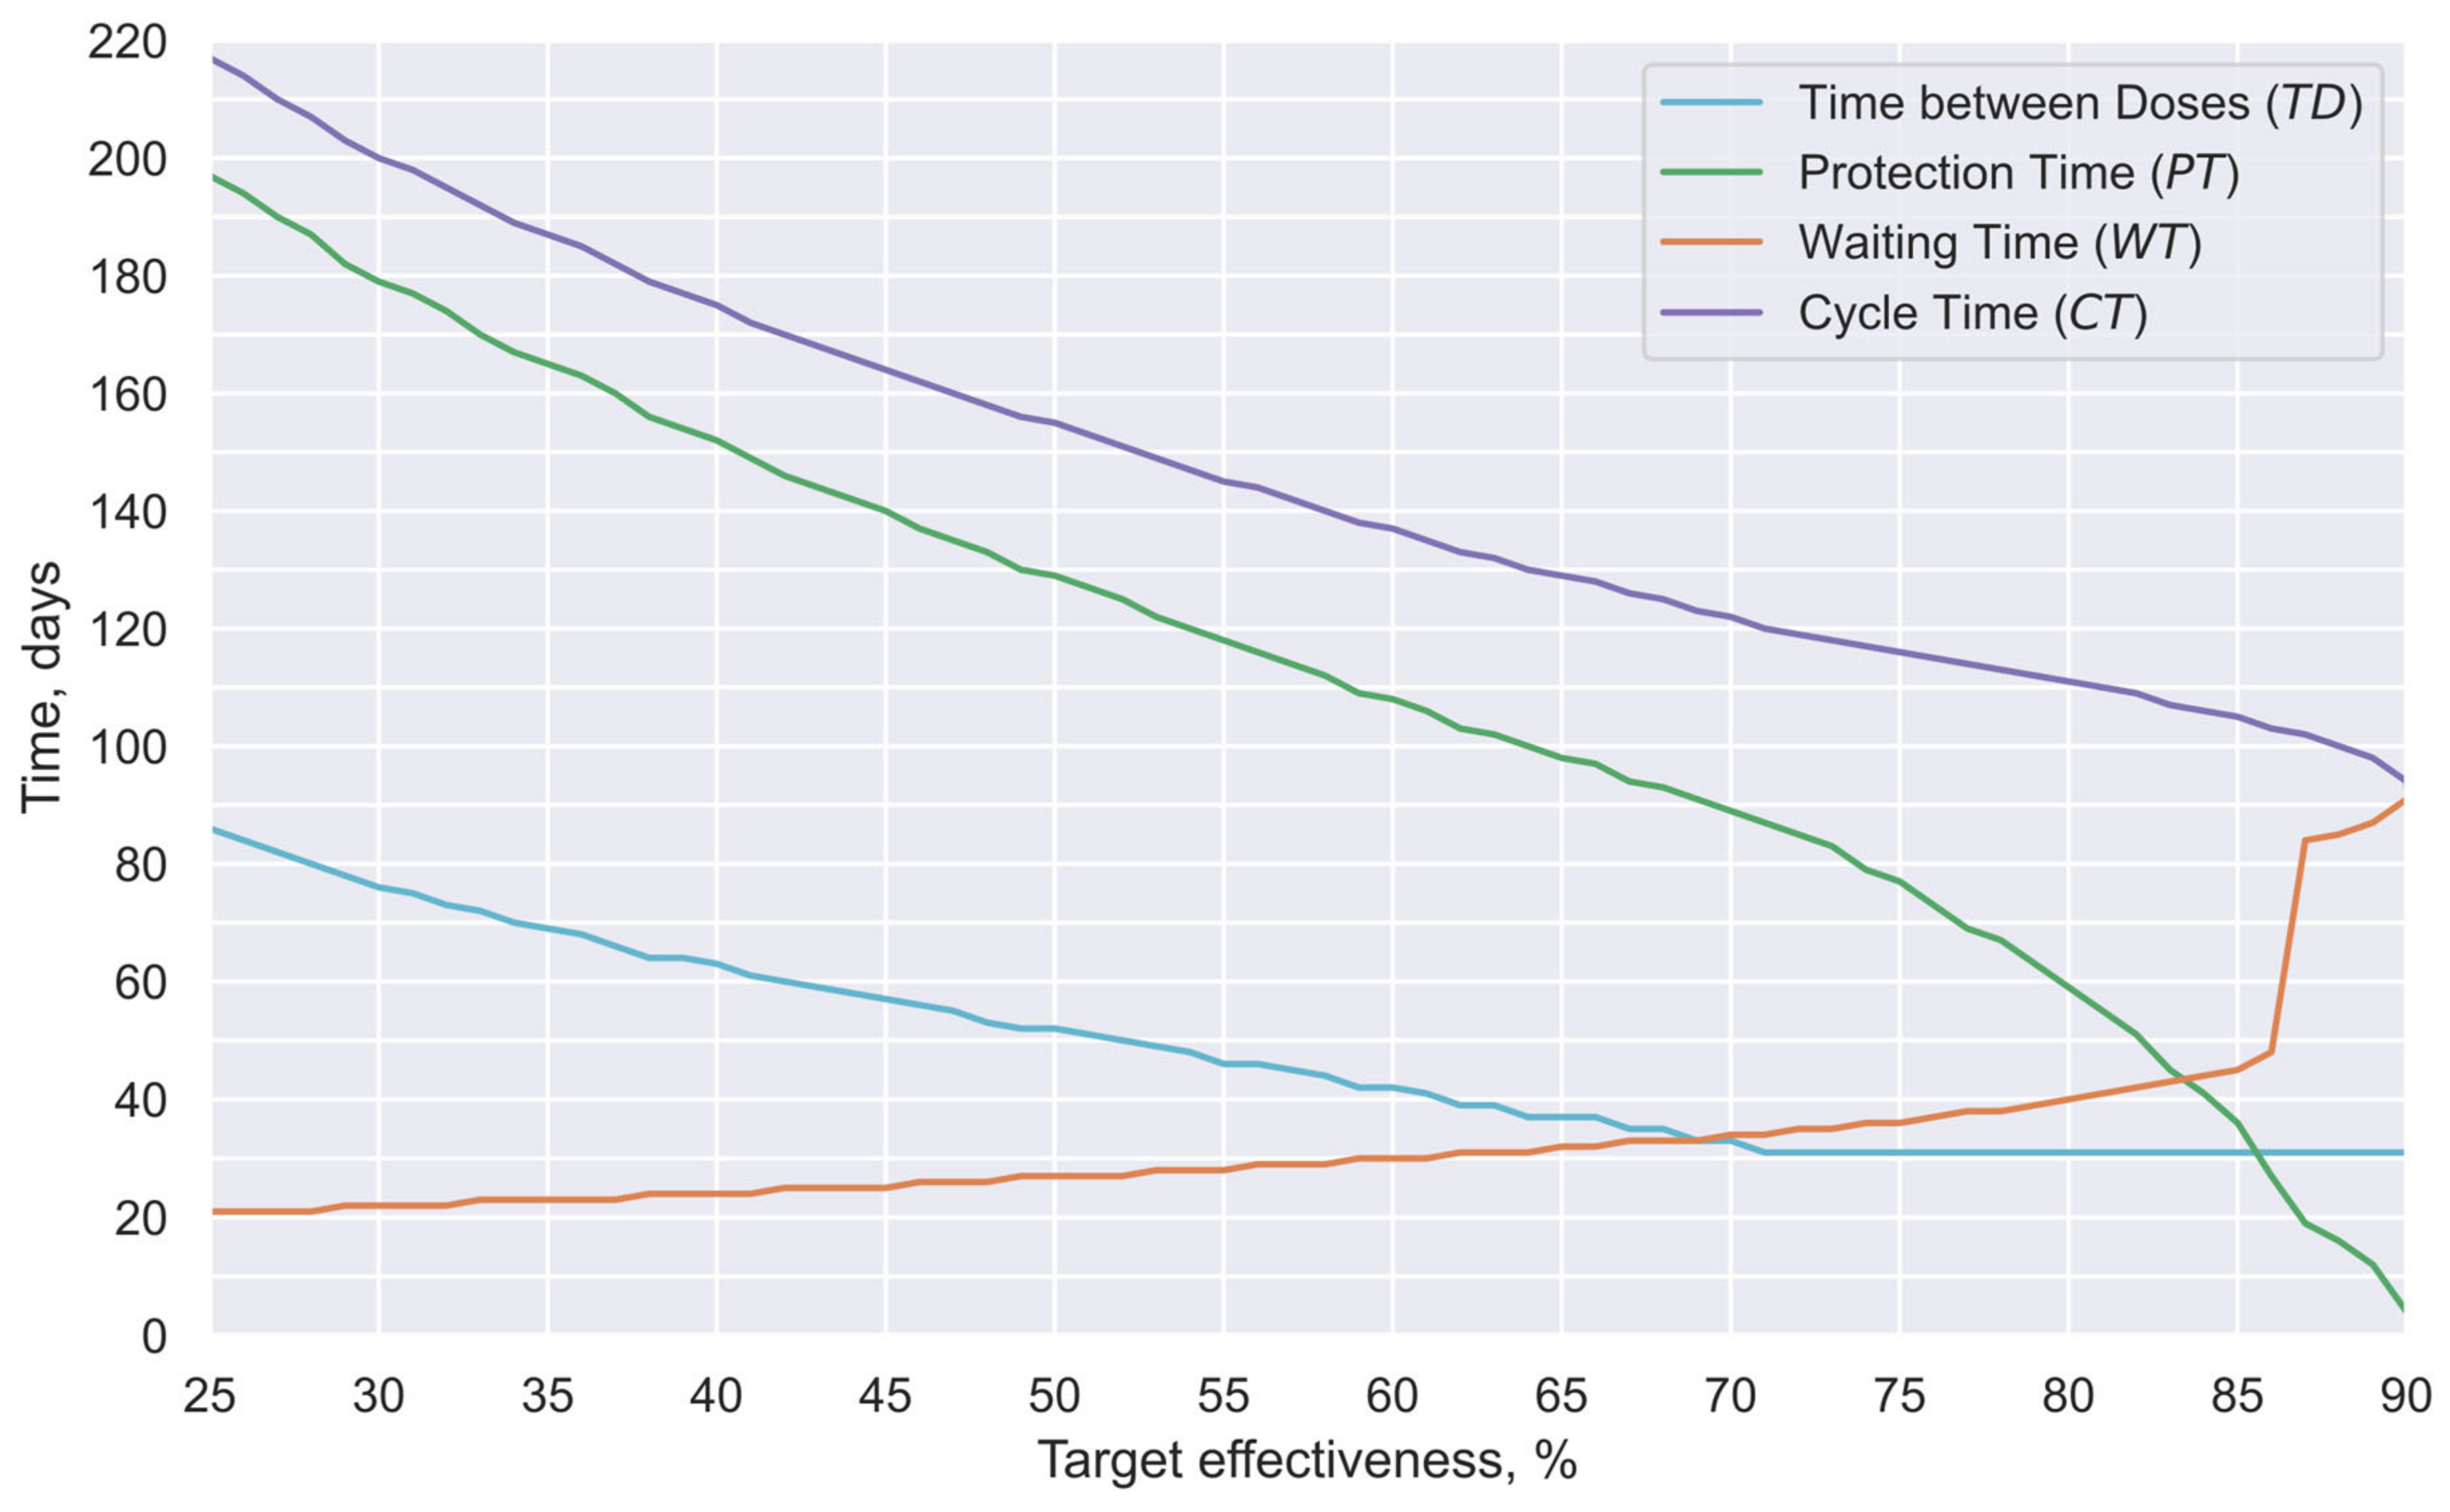
Thus, this study estimated the time between doses that could offer the most extended protection period for a given minimal desirable effectiveness; the results of such estimations are presented in
Figure 7. Such analysis was performed by considering the possible combinations of times between doses and minimal effectiveness targets. Thus, the proposed basic interaction model (Equation (8)) and the previously characterized vaccine effectiveness profiles for each of the two doses were considered (
Figure 6b).
Notably, in a previous study [
32], the estimated number of days prior to the application of the second dose during which the first dose effects were perceptible in the group studied here (
value) was 31 days. Thus, it could be expected that the
value approximately represents the mean time between doses used in the studied group. Therefore, in this study, the optimal time between doses was searched considering only times longer than 31 days. Such a value is slightly longer than the respective times between doses used by manufacturers in their respective phase 3 clinical trials [
11,
12]. This approach is based on the assumption that prolonging the interval between doses is likely to maintain or reduce adverse effects, rather than increase them.
Thus, in
Figure 7, the cyan curve represents the number of days between doses that offer the most extended protection period for each given effectiveness (time between doses:
). The green curve shows the number of days in which the obtained effectiveness is estimated to be greater than the target effectiveness (protection time:
). The orange curve shows the time between the first vaccine application and the first day under the target protection (waiting time:
). Finally, the purple curve shows the number of days between the first dose application and the last day under the target protection (cycle time:
). Complementarily, in
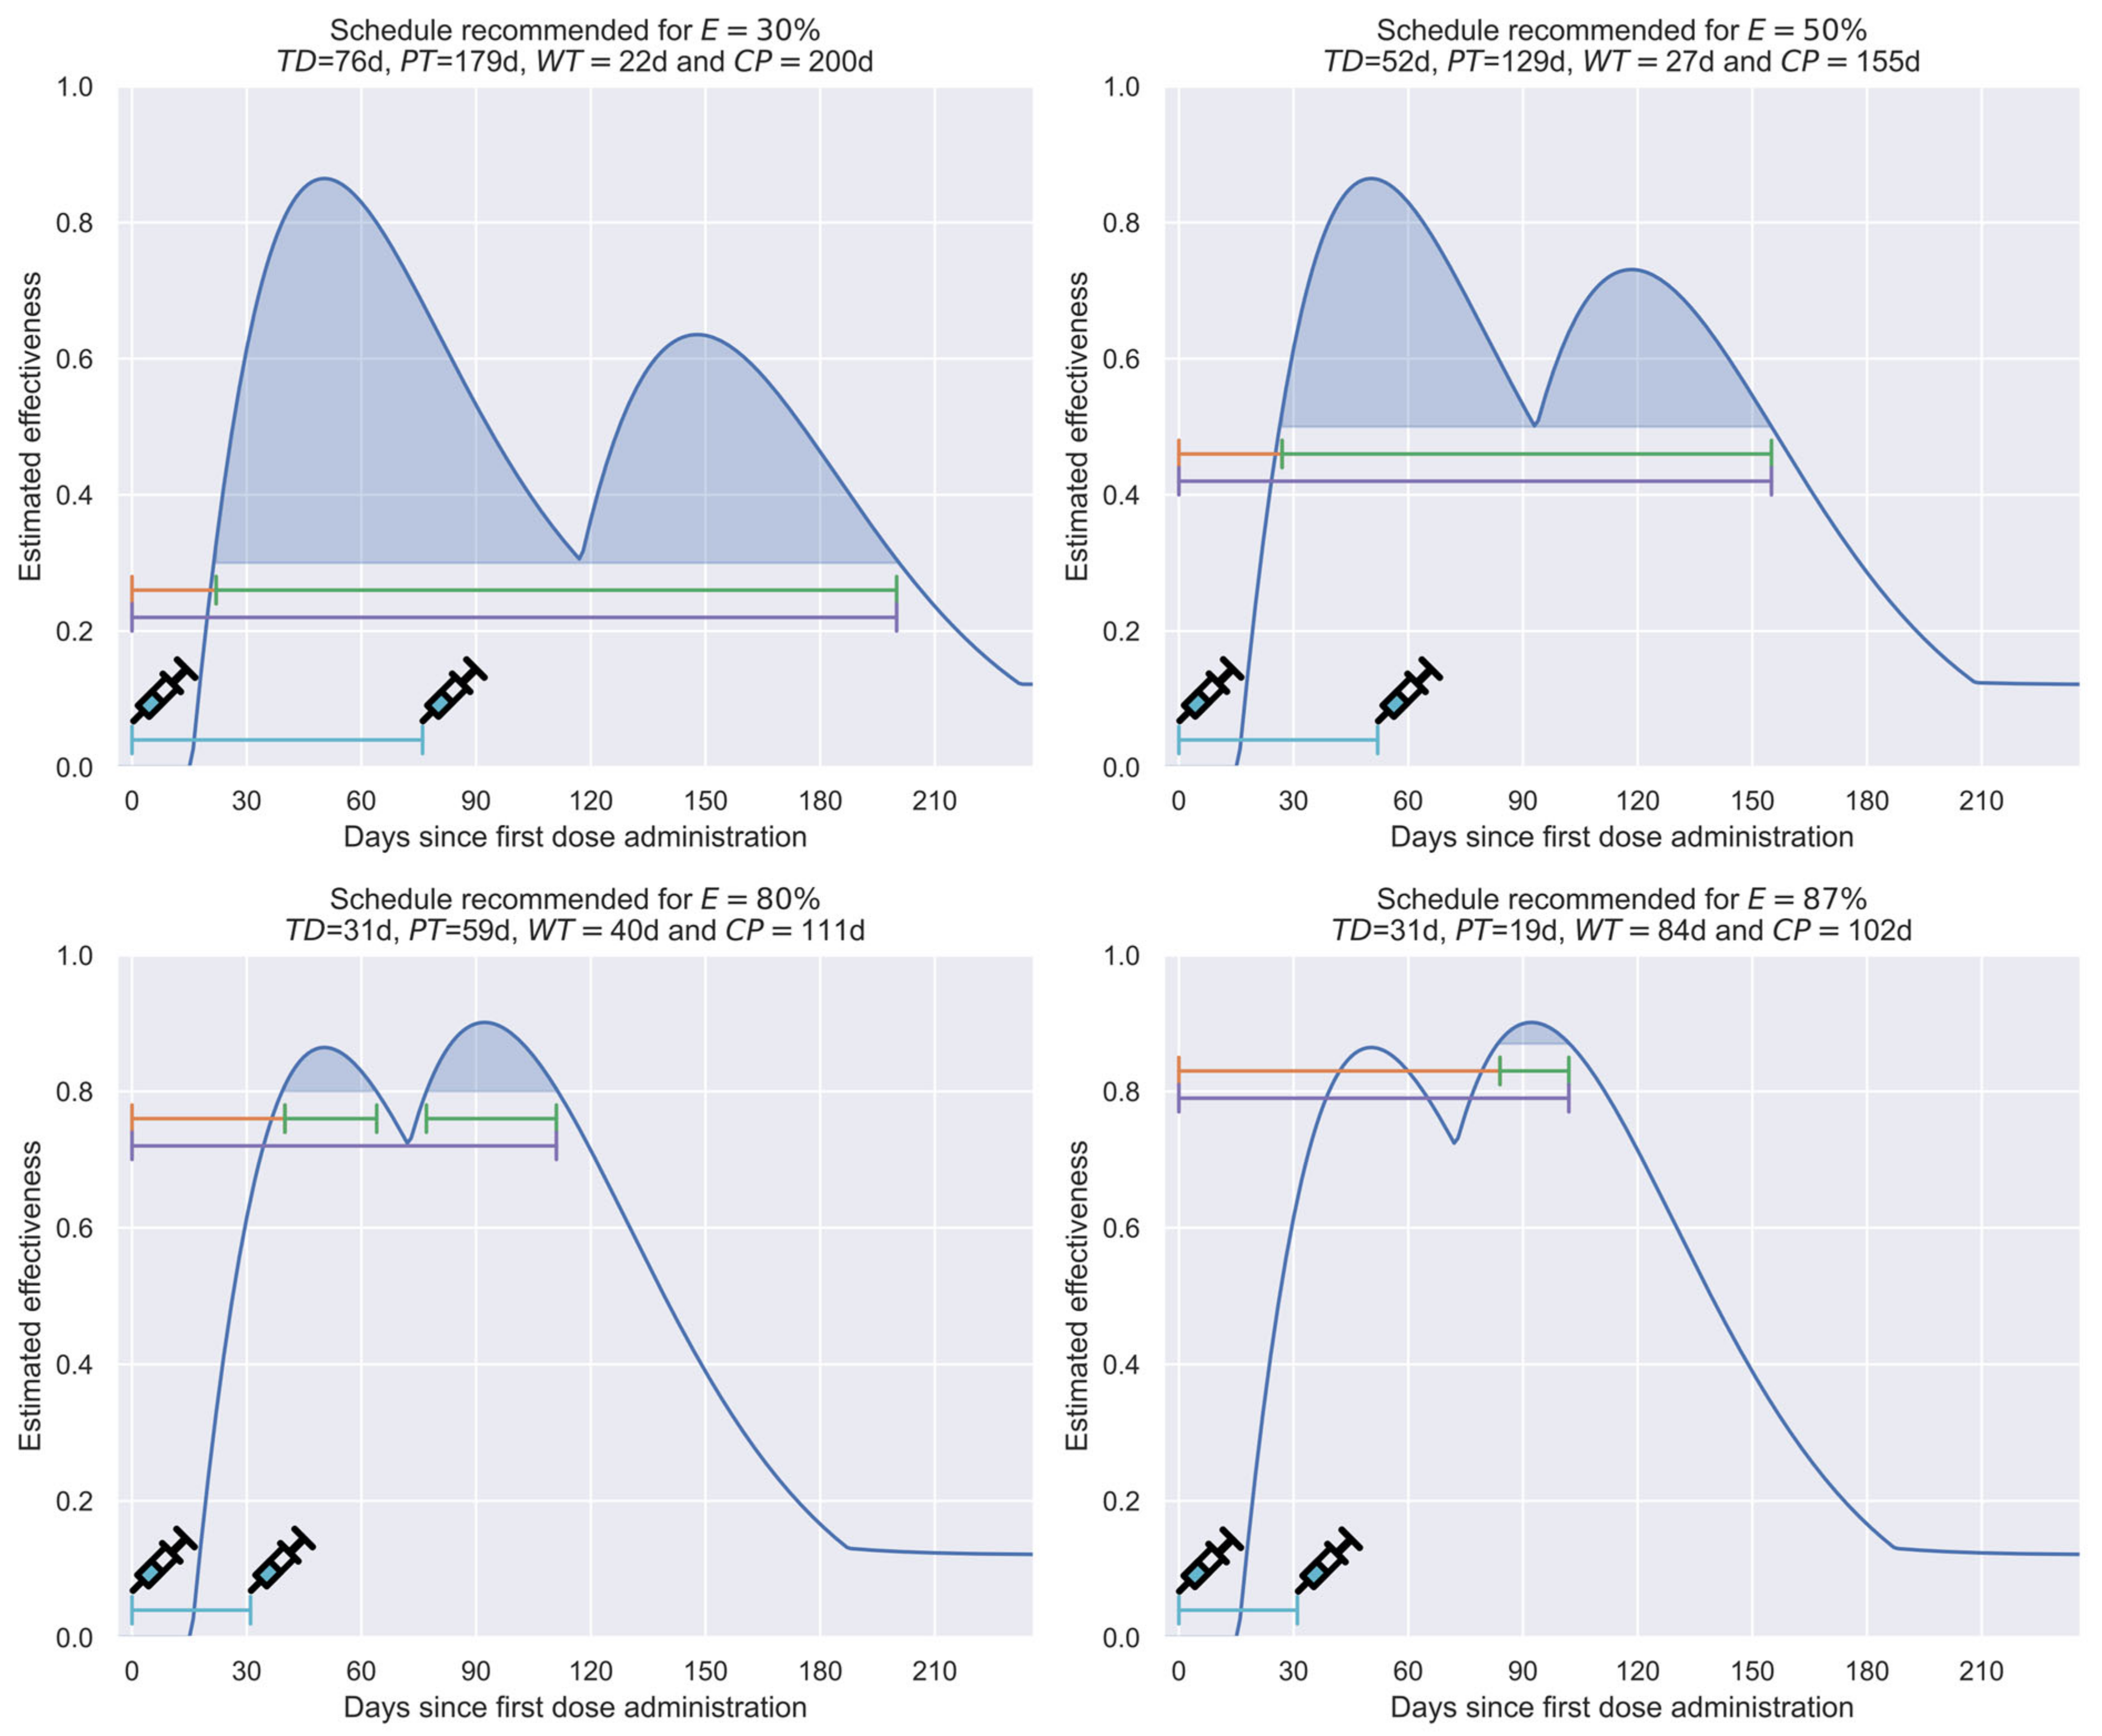
Figure 8, an illustrative comparison of the effectiveness evolution in four recommended scenarios for the target minimum effectiveness values of 30%, 50%, 80%, or 87% is presented.
Although selecting priority groups to be vaccinated is a strategy that promotes the efficient use of available vaccines, selecting how these groups will be vaccinated also offers a window of opportunity that can have significant impacts in multiple scenarios. Thus,
Figure 7 shows how the recommended time between doses decreases as the minimum target efficacy increases (cyan curve). In fact, for objectives more demanding than 70% effectiveness, it is necessary to limit this reduction to the minimum predefined time between doses (31 days), which, as previously mentioned, was selected to eliminate the risk of increasing adverse effects. Consequently, cycle times (purple curve) in these scenarios are comparatively short (<120 days for a 70% minimal effectiveness target vs. 200 days for a 30% target).
Nevertheless, it is even more important that the times under protection (, green curve) present a quasilinear relationship in the first segment of the curve. However, in the last section (>70% effectiveness), this curve presents a noticeable decrement in its slope, indicating that it is necessary to sacrifice the length of the period under protection to achieve the most demanding effectiveness values. In scenarios of vaccine shortages, such as those existing during the COVID-19 pandemic, such a phenomenon is highly inconvenient.
Finally, it is convenient to indicate that the waiting time (, orange curve) presents a quasilinear behavior, with relatively low values during the first segment of the curve (21–45 days). However, when the target effectiveness is greater than 85%, an abrupt increase occurs in the ordinates of the curve (e.g., 84 days for an objective of 87% effectiveness).
To exemplify, in
Figure 8, a comparison among the recommended schemes for effectiveness values of 80% or 87% can be performed. There, while in the first scenario, the waiting time is relatively short and the protection is of medium duration (
= 40 days and
= 59 days), in the second scenario, the waiting time is more prolonged, and the protection time is notably shorter (
= 84 days and
= 19 days), since the value of the first cusp is lower than the target efficacy.
In addition, in
Figure 8, it can be noted that the time elapsed between doses induces a notorious effect in the shape of the efficacy profile obtained, generating systems with long cycle times, but low target effectiveness (schedule recommended for
= 30%); systems that balance duration and the target effectiveness value (schedule recommended for
= 50%); or systems that sacrifice duration in order to achieve high target effectiveness (schedule recommended for
= 80% or
= 87%).
Finally, it is convenient to indicate that the target effectiveness value is the minimum value that the effectiveness profile will have throughout the protection time. For example, of the 179 days in which the recommended profile for = 30% will offer protection 30%, only three regions will present values close to 30% (less than ten days); most of the time, such a profile will offer significantly higher values, having an average effectiveness of 57%, and even reaching maximum effectiveness values of above 80%. Thus, the profiles generated employing this strategy will allow rapid convergence, since the average effectiveness will be, in most cases, notoriously higher than the threshold effectiveness.
3.3.1. Basic Reproduction Number,
In epidemiological vigilance, one of the most significant parameters to quantify the social dissemination rate of a disease is the basic reproduction number, usually known as
[
69]. This parameter is typically defined using Equation (10), where
represents the number of individuals infected by a disease in a given period and
represents the number of individuals recovered in the same period.
Practically, this parameter estimates the average number of infected individuals directly contaminated by a single case. Thus, if the parameter is smaller than one, the number of active confirmed cases will decrease (as more persons recover from the disease than those becoming infected). However, if this value exceeds one, the number of active confirmed cases will progressively increase.
For the example case, considering a recovery period of 14 days, the
parameter can be estimated by dividing the number of active cases contaminated during such a period (
) by the corresponding number of original active cases (
), as shown in Equation (11).
In the present case, the data required in Equation (11) can be obtained from daily cases reported in the Mexican national COVID-19 database published by the Epidemiology General Direction (DGE, by its initials in Spanish) [
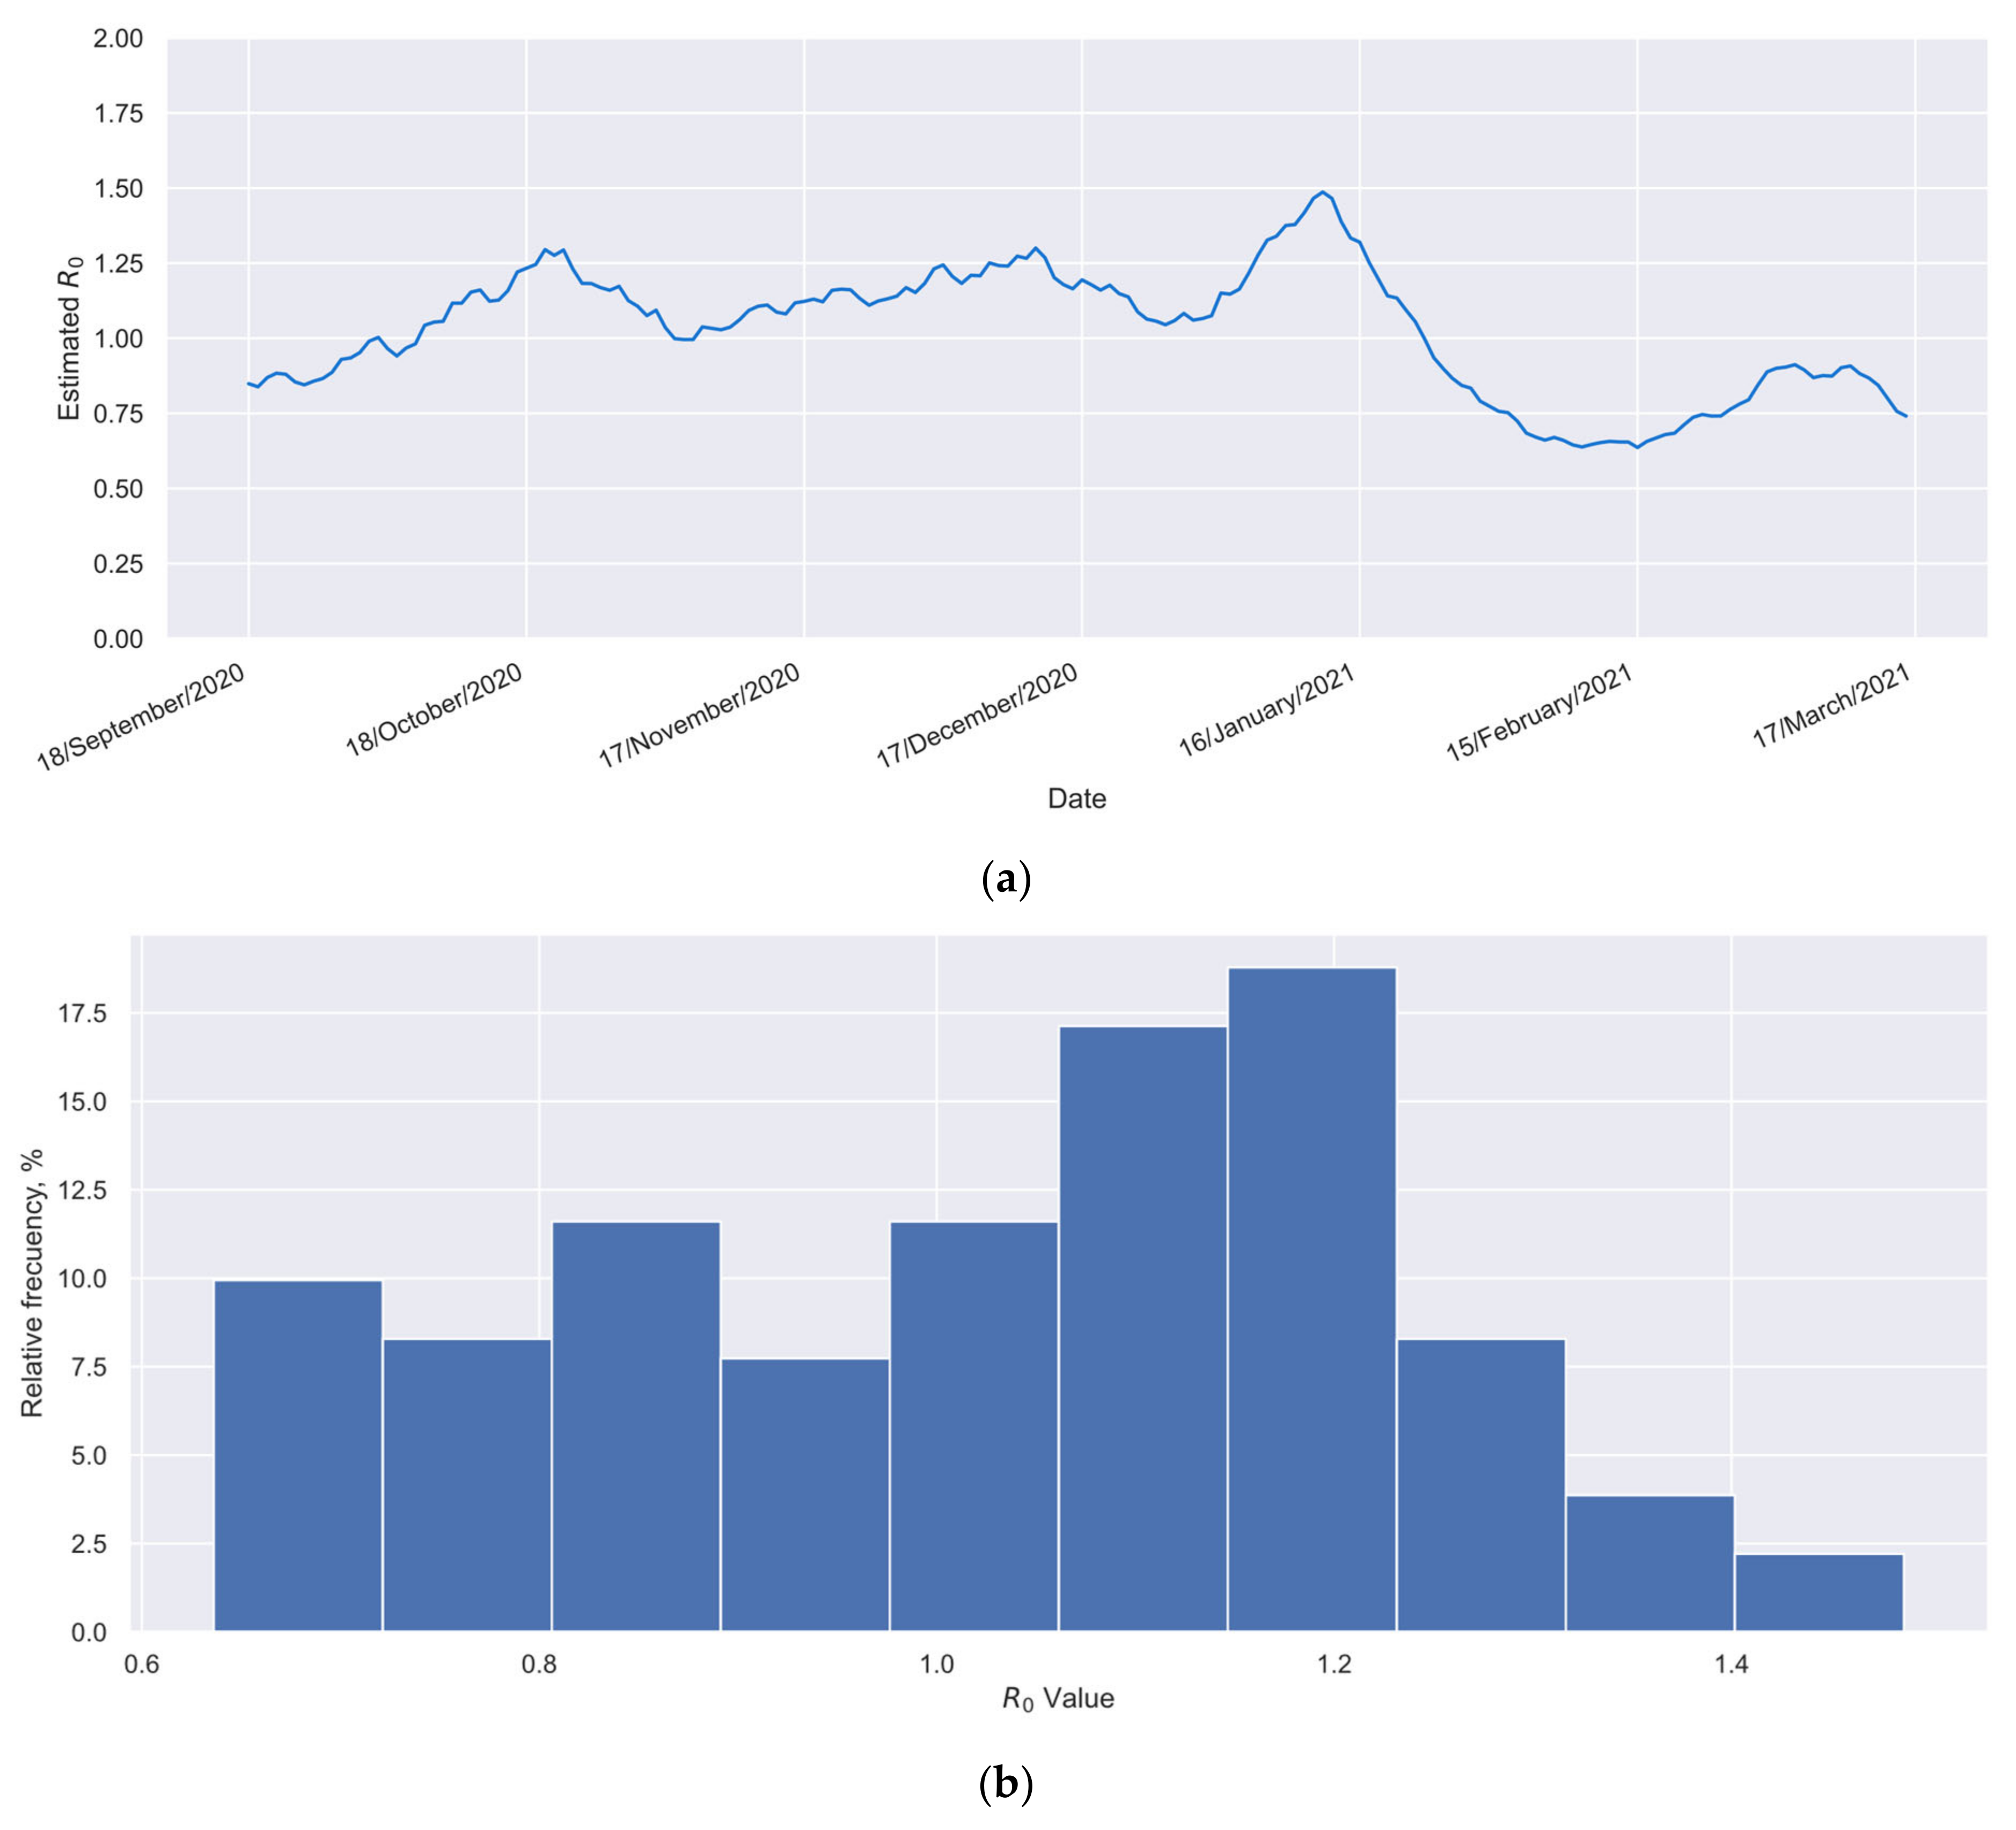
59]. For a worst-case scenario analysis,
Figure 9a presents the time series of the
index for the reference group over a six-month period. During this time, the group remained unvaccinated, and only a minimal level of vaccination coverage had been achieved in the Mexican population. These data were calculated using Equation (11). Additionally,
Figure 9b shows a histogram built with such values. From the information presented in
Figure 9, the average
value for the reference group can be obtained (
), as could its range, which was 0.64 to 1.49.
Among other applications, one of the benefits of knowing the value of
for a specific population is that, when the percentage of vaccinated individuals in such a population (
) is available, Equation (12) [
70] enables calculation of the minimum value of effectiveness (
) required to decrease the value of
to values smaller than one, which promotes a progressive reduction in confirmed cases (additional details about the obtainment of Equation (12) are available in
Supplementary Materials SM6).
Equation (12) assumes the fulfillment of the following conditions [
70]: (a) individuals in the study population mix homogeneously; (b) the distribution of individuals protected through vaccination (and, where relevant, previous infection) is uniform; and (c) all unprotected individuals are fully susceptible. Traditionally, Equation (12) is used for time-independent effectiveness values, but it also applies to time-dependent parameters, as in this study. In the latter case, the
parameter represents the instantaneous
value, measured
days after the second dose administration. Thus, when the instantaneous
value is higher than the value calculated with the right member of Equation (12), the convergence of the confirmed cases is forced in the system, and the number of active cases progressively decreases in the considered population group. In one previous study [
70], the behavior of Equation (12) was widely analyzed, considering traditional systems where the effectiveness is not time-dependent. There, it was demonstrated that high vaccination coverages (e.g.,
) and high effectiveness values (e.g.,
) must be achieved to force the convergence on systems that show high
values (e.g.,
). The
value in a locality reflects the balance between the infectiousness of the prevalent variant and the effectiveness of both pharmacological and non-pharmacological protective measures in place. This emphasizes the importance of implementing such protective actions to prevent high
values, which can be challenging to manage solely through vaccination in real-world conditions.
Thus, Equation (12) allows us to determine the recommendable minimum effectiveness value required to produce a progressive reduction in confirmed cases in the considered location. For the example case (elderly Mexicans during the period September 2020 to April 2021), considering that 95% of the historical values of
were lower than 1.33 (
Figure 9), and 78% of the interest group became vaccinated (
Figure 1), an
value of at least 32% could be considered appropriate, as shown by Equation (13). Therefore, considering such effectiveness and the profiles of
Figure 7, a time of 73 days between doses could be considered appropriate for the example case.
In this case, the more prolonged separation between doses (73 days instead of 31 days) would produce a significant increment in the protective time, increasing the protection time from a few more than 19 weeks with the schedule administrated (
days;
Figure 8), to practically 25 weeks with the new vaccination schedule (
days; green curve in
Figure 7). Thus, adequate implementation of the proposed schedule would yield, with the same doses, protection to more than 25% additional individuals in a similar way, which is a relevant achievement in shortage scenarios.
Additionally, it is relevant to note that in this calculation, the recursive effect described as follows occurs. Since the new schedule allows a portion of the doses to be used to vaccinate new individuals, the vaccination coverage will increase, and the value calculated by substituting the new values into the right side of Equation (12) will decrease. Thus, a lower effectiveness limit value will be required in the new conditions, which implies that the protection time in the new conditions will increase. Consequently, a certain number of doses can be used in new individuals, which again generates the previously described effect. Thus, as a final result of this recursive effect, the increment in the time between doses will generate an even more significant beneficial effect than that calculated when Equation (12) is only applied the first time.
Notably, in systems showing time-dependent effectiveness values, the parameter in Equation (12) is now considered the inferior threshold of effectiveness that must be fulfilled, instead of the unique effectiveness value that characterizes a non-time-dependent system. Therefore, the current restriction is considerably stricter than those considered in systems with time-independent effectiveness; for the majority of the protection time, the effectiveness will be noticeably higher than the minimal required threshold, and only in comparatively few days will it be near to the minimal value. Therefore, it could be expected that a more accelerated convergence process than in the traditional systems (time-independent) can be achieved in the current case.
Nevertheless, it must be noted that prior to applying Equation (12) to a specific case, the following non-trivial caveat must be considered: the
may change sharply with changes in social behaviors or the emergence of new variants that could be more infectious. Thus, it must be highlighted that the
value used in Equation (13) is only valid for the local social behaviors and the variants that circulated during the studied period among elderly Mexicans. On this matter, international evaluations have identified high heterogeneity in the
value, even within a country [
71]. However, mean estimations range from 2.9 for the ancestral strain [
71] to 9.5 for the Omicron variant [
72]. Therefore, to anticipate possible changes in social behaviors or variants after vaccination is applied, a generous protection margin should be considered for the
value to be used in Equation (12).
As previously mentioned, a broad analysis of the behavior of Equation (12) can be found in [
70]. However, to evidence the real achievements that can be obtained when only the vaccination is used as a protective strategy,
Table 1 considers the relationship among the parameters included in such formulae. Thus,
Table 1 presents the minimum effectiveness required to induce a convergent behavior in the local evolution of the pandemic (reduction in the locally confirmed cases), corresponding to some representative combinations of values of
, and vaccination coverages in the population (
).
Table 1 shows that for all tested
values, the required minimum effectiveness (
) sharply increases as the
value increases. However, such an increment is less sharp when the vaccination coverage is high. It is important to note that even with moderate vaccination coverage levels, such as 60% or 70%, there are scenarios where vaccination efforts alone are insufficient to achieve convergence. Furthermore, in certain cases, particularly when
exceeds 5, even high vaccination coverage (
) may demand exceptionally high vaccine effectiveness (
) to facilitate convergence.
Lastly, it is crucial to understand that the protection times () are strongly determined by the required minimum effectiveness (), with decreasing as increases. Such a decrease becomes even more pronounced when surpasses 70%. Thus, as previously mentioned, when the and values are limited, convergence can hardly be achieved in systems showing high values. Furthermore, when the required values are comparatively high, the afforded duration of the protection only lasts some weeks.
3.4. Comparison against Previously Available Information
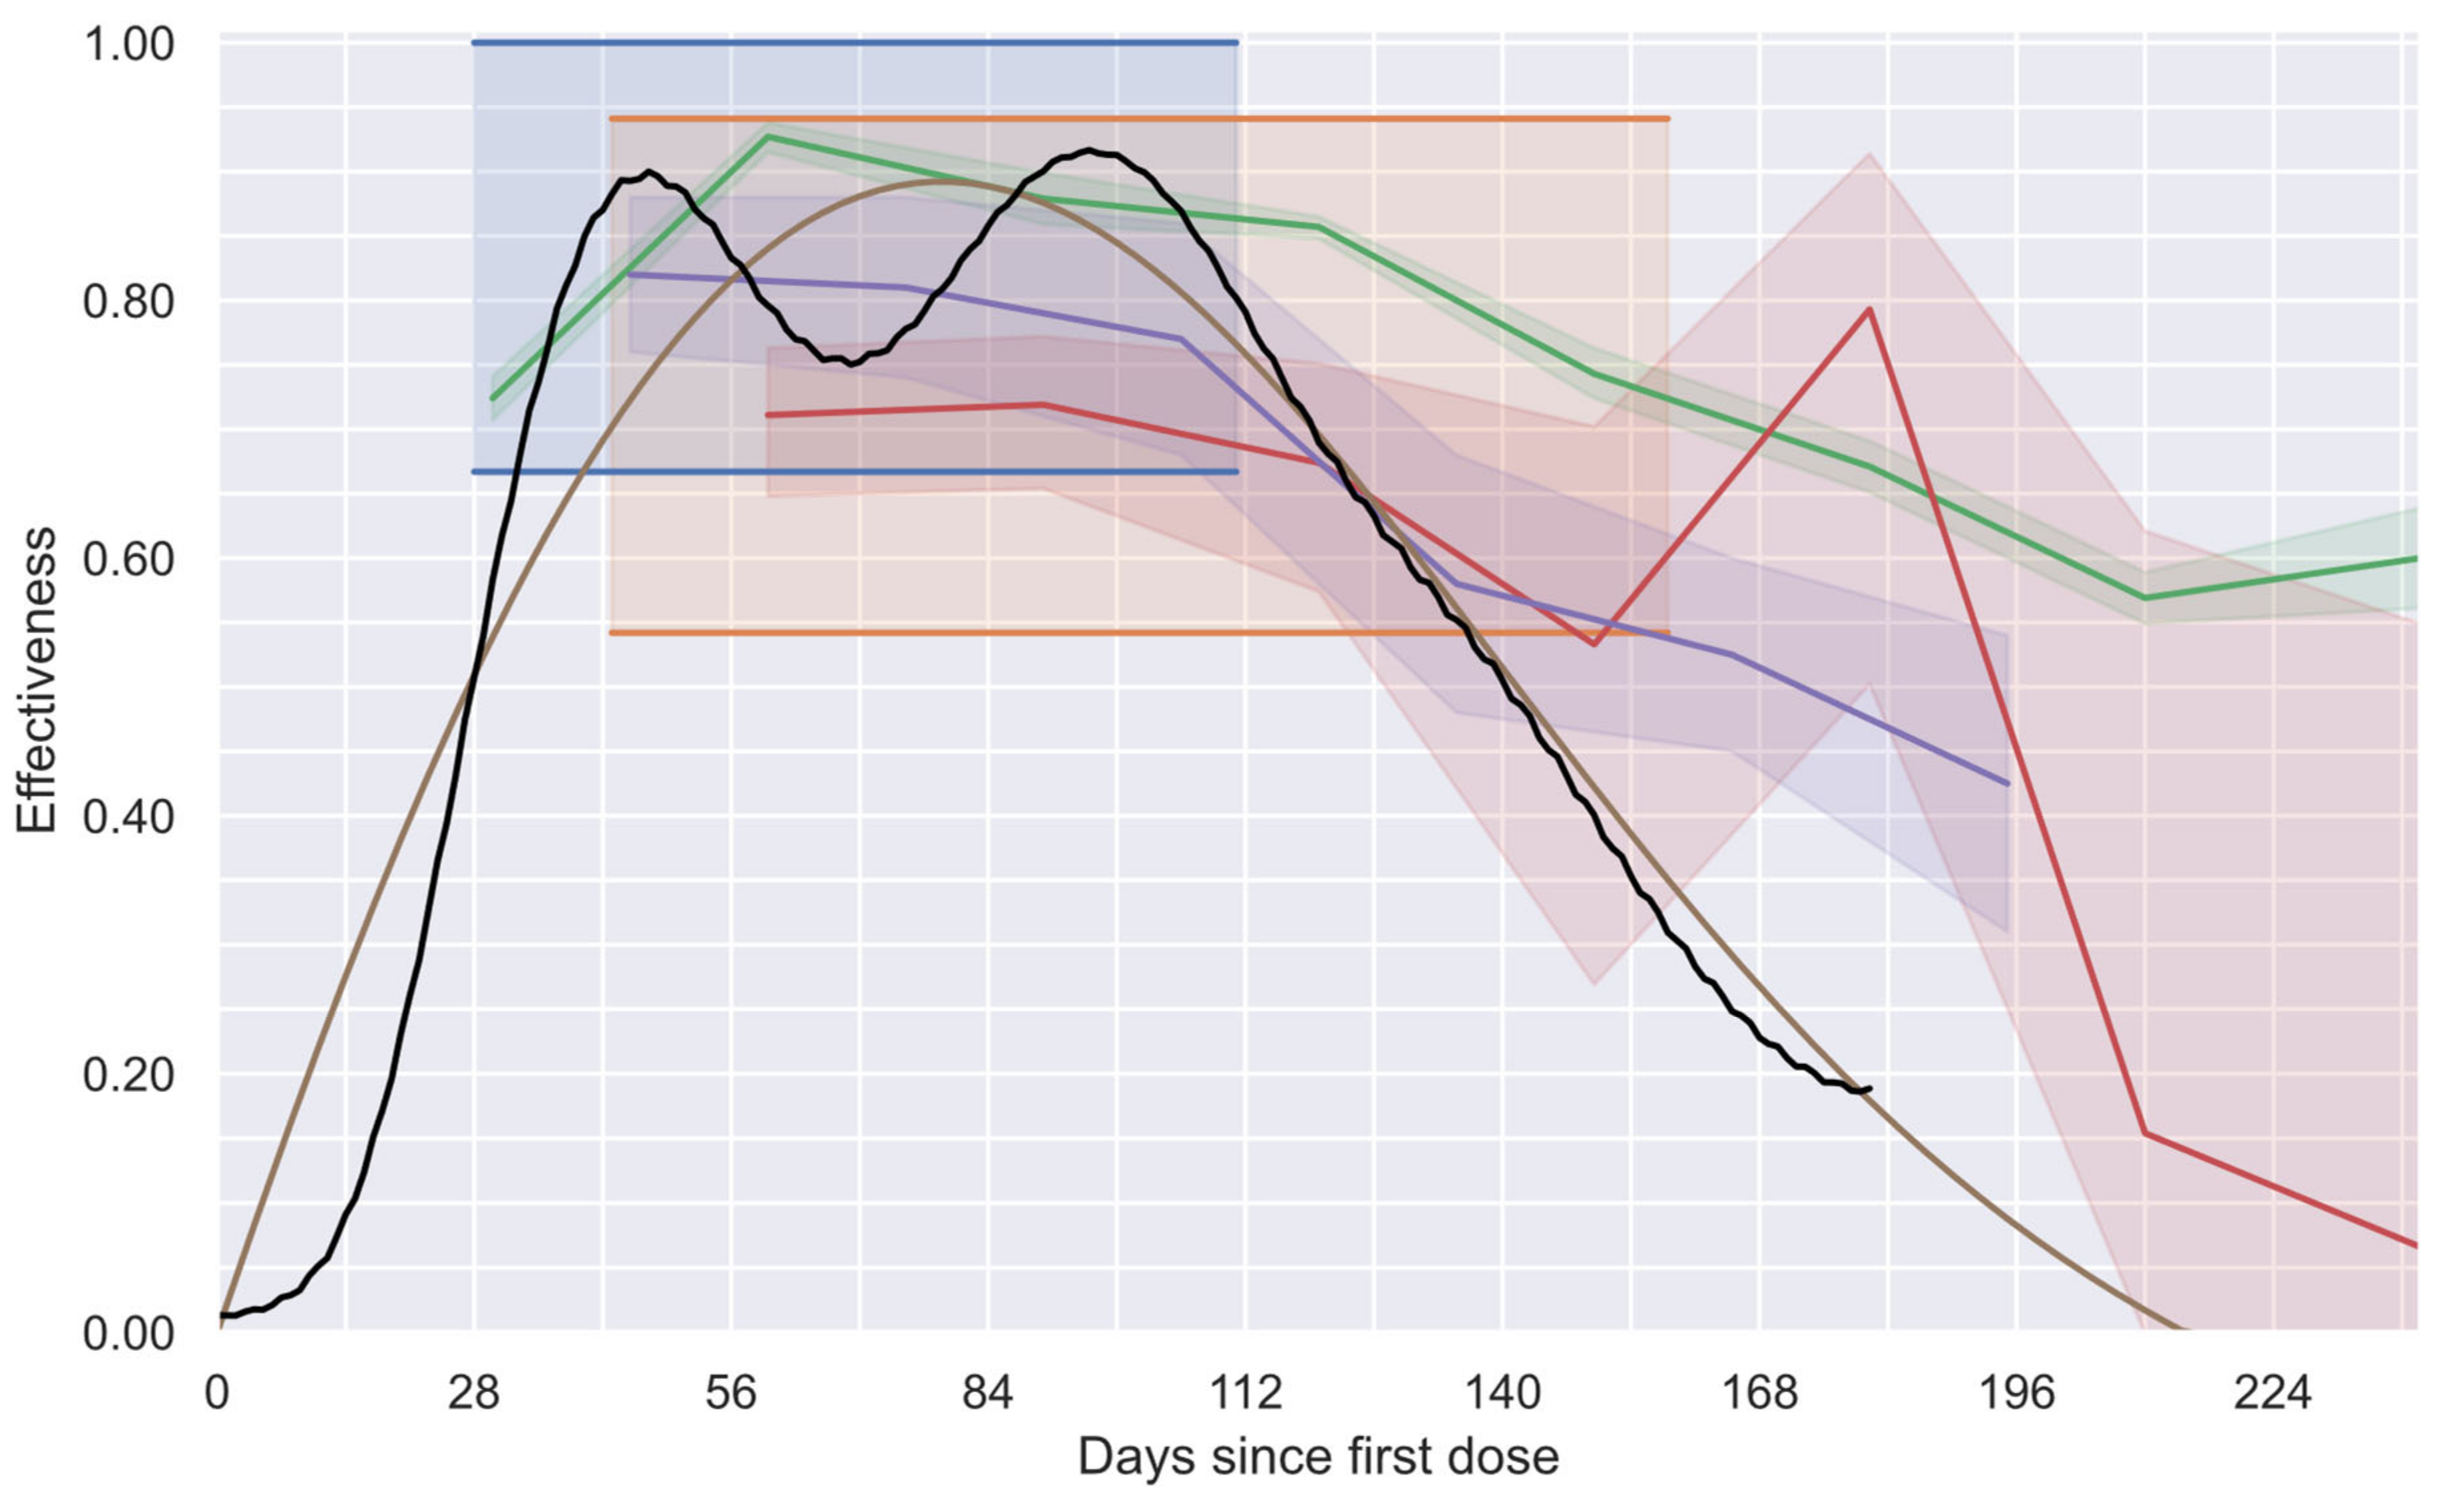
Concerning the effectiveness profiles, in
Figure 10, the proposed global vaccine effectiveness profile (black line) and the profiles obtained with three alternative methodologies previously proposed are shown. The first alternative methodology is the one used in phase 3 clinical trials performed by the manufacturers of the vaccines administrated to most of the individuals in the studied group (BNT162b2 [
12] and AZD1222 [
11] vaccines). Thus, the 95% confidence intervals (95% CI), the only values each manufacturer offers for their study groups, which were assumed to be valid during the complete study, are presented in
Figure 10 as shadowed regions in blue and orange, respectively. The second alternative considers the equivalent results of three independent studies [
13,
14,
15] that estimated the evolution of the effectiveness of the BNT162b2 vaccine over time, reporting monthly values of effectiveness with their respective 95% CI. To estimate such values, the individuals had to be classified by their time from vaccination (usually, monthly groups were considered). To better appreciate their results, in
Figure 10, a line connecting their effectiveness values and a shadowed region to observe their connected 95% CI were added (purple [
13], red [
14], and green [
15]). Finally, the third alternative to be compared considers the profile obtained using a deconvolution process that forces the system to generate smooth profiles with eight degrees of freedom (“smooth deconvolution” [
32]). The obtained continuous profile and its respective 95% CI are shown in brown. It is important to note that such a study and the current study (black line) had almost imperceptible 95% CI due to the colossal number of individuals considered in these studies (more than 15 million in the study group and more that 18 million in the reference group).
Qualitative agreement between all studies during the first five months after the first dose administration can be observed in
Figure 10. The observed minor discrepancies can be attributable, among other reasons, to the slight differences among the groups considered. Note that in references [
14,
32], the group 60+ (individuals older than 60 years) was considered, while in other studies [
11,
12,
13,
15], groups 65+ were considered. In addition, in the current study and in reference [
32], a group vaccinated with more than one type of vaccine was considered, whereas in the other studies, only the BNT162b2 vaccine was used (except in reference [
11], which considered the AZD1222 vaccine). On the other hand, this study’s results and those reported in studies considering the time evolution of the vaccine effectiveness [
13,
14,
15,
32] demonstrate a progressive decrement in such a parameter after a maximum value is reached, corroborating the waning of the vaccine effectiveness after a few months of having administrated the first dose.
Complementarily, a quantitative comparison of the proposed profile with the other options confirms that: (a) the current profile provides a more precise description of the vaccine effectiveness compared with the original single value offered by the vaccine manufacturers (blue [
12] and orange [
11]); (b) the length of the 95% CI obtained with the current strategy is negligible compared with those obtained with some of the other equivalent methodologies (purple [
13], red [
14], and green [
15]); (c) since the current methodology does not require the consideration of confirmed cases with different times from vaccination as if they were equivalent, the involved bias is eliminated; and (d) although the smooth profile proposed by Gonzalez-Sanchez (brown [
32]) accomplishes the aforementioned benefits, the low number of degrees of freedom used only allowed the generation of smooth profiles that are incapable of describing the real behavior of two-dose vaccination schemes with enough fidelity, preventing the characterization of the individual effects of each dose, which can be achieved with the proposed methodology.
Thus, the proposed methodology is the best available option for generating global effectiveness profiles for two-dose schemes. Moreover, to the best of our knowledge, this is the only study that has generated profiles that can be quickly processed to extract the effectiveness of each vaccine individually.
4. Discussion
The global health quandary generated by the COVID-19 pandemic and its persistence for more than three years has implied many challenges not seen in other pandemics [
3,
4,
22,
23]. Global interconnections and the international transit of goods and persons have generated a pandemic in which all countries depend on each other to control their infections [
73]. Considering this panorama, the international availability of vaccines could be viewed as a primary public health requirement for the pandemic contention [
27].
Regarding vaccine availability, the limited production capacity of this resource [
17,
19] has motivated the development of strategies to use available vaccines efficiently. The strategies range from vaccinating the most vulnerable groups (e.g., the elderly) or the most exposed individuals (e.g., doctors), up to prioritization of potential super-spreaders (e.g., teachers and public transport drivers). Additionally, several research groups have developed models to study different strategies for prioritizing vaccines, aiming to reduce the numbers of confirmed cases, hospitalizations, and deaths [
24,
25,
26]. However, many of these strategies consider unrealistic assumptions, including the consideration of a time-independent vaccine effectiveness value. This assumption implies non-negligible deviations, which could lead to the design of ineffective public health strategies.
The traditional vaccine efficacy estimation method assumes the use of vaccines with time-independent efficacies, i.e., vaccines that induce an immunological response preserved for extensive periods. Nevertheless, this assumption has been proven wrong for at least some COVID-19 vaccines, which demonstrate effectiveness with strong waning as the time from the last dose increases [
28,
29,
30,
31,
74]. Concerning this methodological bias, several research groups have studied the evolution of COVID-19 vaccine effectiveness by considering monthly values instead of a single value to represent the effectiveness of each vaccine type [
13,
14,
15]. However, the limited number of confirmed cases considered in these studies generates biased and imprecise profiles, preventing its use in successful public health strategies. In a previous study [
32], the limitations characterizing these methodologies were deeply analyzed, mentioning that, to surpass such limitations, it is required to recruit at least 1000 times more individuals than in traditional phase 3 clinical trials (for the current case, more than 33 million of individuals were considered), which is an impractical challenge. Fortunately, national databases represent a suitable alternative that can be used, as in this case, when vaccines have been broadly distributed.
Thus, the proposed novel approach uses information grouped in national databases containing data from millions of individuals. The availability of information concerning millions of individuals improves the resolution of the effectiveness profile without reducing statistical robustness. In addition, the proposed method solves the limitations of its predecessor method [
32] by stabilizing a system with more degrees of freedom (212 instead of 8). The noticeable increment in the number of degrees of freedom and the consideration of a general interaction model gives the generated profile enough flexibility to be split into two independent effectiveness profiles (one for each dose), which is impossible to achieve with the precedent procedure [
32].
The split of the respective effectiveness profiles (one for each dose) opened the possibility of evaluating the effect of increasing the time between doses proposed by pharmaceutical companies, looking to enlarge the protection time of the complete vaccination scheme but maintaining effectiveness levels higher than a pre-established threshold value. Although, in this study, such a threshold was defined to promote local convergence to zero on the number of confirmed cases, taking advantage of the fact that this threshold could be calculated considering the current conditions in the considered locality (the basic reproduction number—— and the vaccination coverage——), this methodology can also be adapted to achieve other aims (e.g., finding a sweet spot between the protection time and minimum effectiveness value, or looking for a high effectiveness value during local celebrations). Thus, the schedules recommended in this study aim to maintain a desired minimum effectiveness for the longest possible time. Therefore, this methodology could reduce the number of doses required to protect a given population.
Thus, the availability of a method to vary the desired effectiveness facilitates the design of surgical public health strategies based on local conditions of the pandemic. Therefore, by strategically modulating the time between dose administrations, local public health systems can improve the pandemic contention and dynamically address emergent challenges.
Moreover, this method enables vaccine manufacturers to quickly re-estimate the effectiveness of their vaccines against circulating variants, which can help detect evasive pathogen mutations. This analysis could help increase the utility of each dose, based on real-world information, without performing long and expensive clinical trials.
Concerning the limitations of this method, it is worth mentioning that it relies heavily on the availability of real-world data. Therefore, national or international databases with information about millions of individuals are required. Additionally, these databases must not have biases, as these perturbations to real-world data induce errors that could lead to the estimation of highly deviated vaccine effectiveness profiles. The final consideration may be a motivation for public health organizations to establish robust and trustworthy national databases not only for COVID-19, but for any other disease. In addition, although this study used the most general interaction model to extract the independent effect of each dose, the methodology can easily be adapted to consider more elaborate interactions or model the responses of vaccines designed against other diseases.


 , FODECYTJAL 2022, folio 10300, for the support in performing this investigation; and the authors thank the University of Guadalajara for the use of their facilities and support to perform this investigation.


