Oxidative Stress and Pro-Inflammatory Status in Patients with Non-Alcoholic Fatty Liver Disease

 ,
,  ,
,  , , ,
, , ,
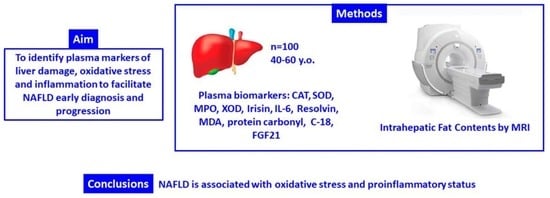
Abstract
:
1. Introduction
2. Materials and Methods
2.1. Design and Participants
2.2. General Data
2.3. Diagnosis of NAFLD
2.4. Anthropometric Characterization
2.5. Blood Collection and Analysis
2.6. Protein Carbonyl Determination
2.7. Enzymatic Determinations
2.8. Malondialdehyde Assay
2.9. Immunoassay Kits
2.10. Statistics
3. Results
3.1. Anthropometric and Haematological Parameters
3.2. Oxidative Stress and Inflammatory Biomarkers
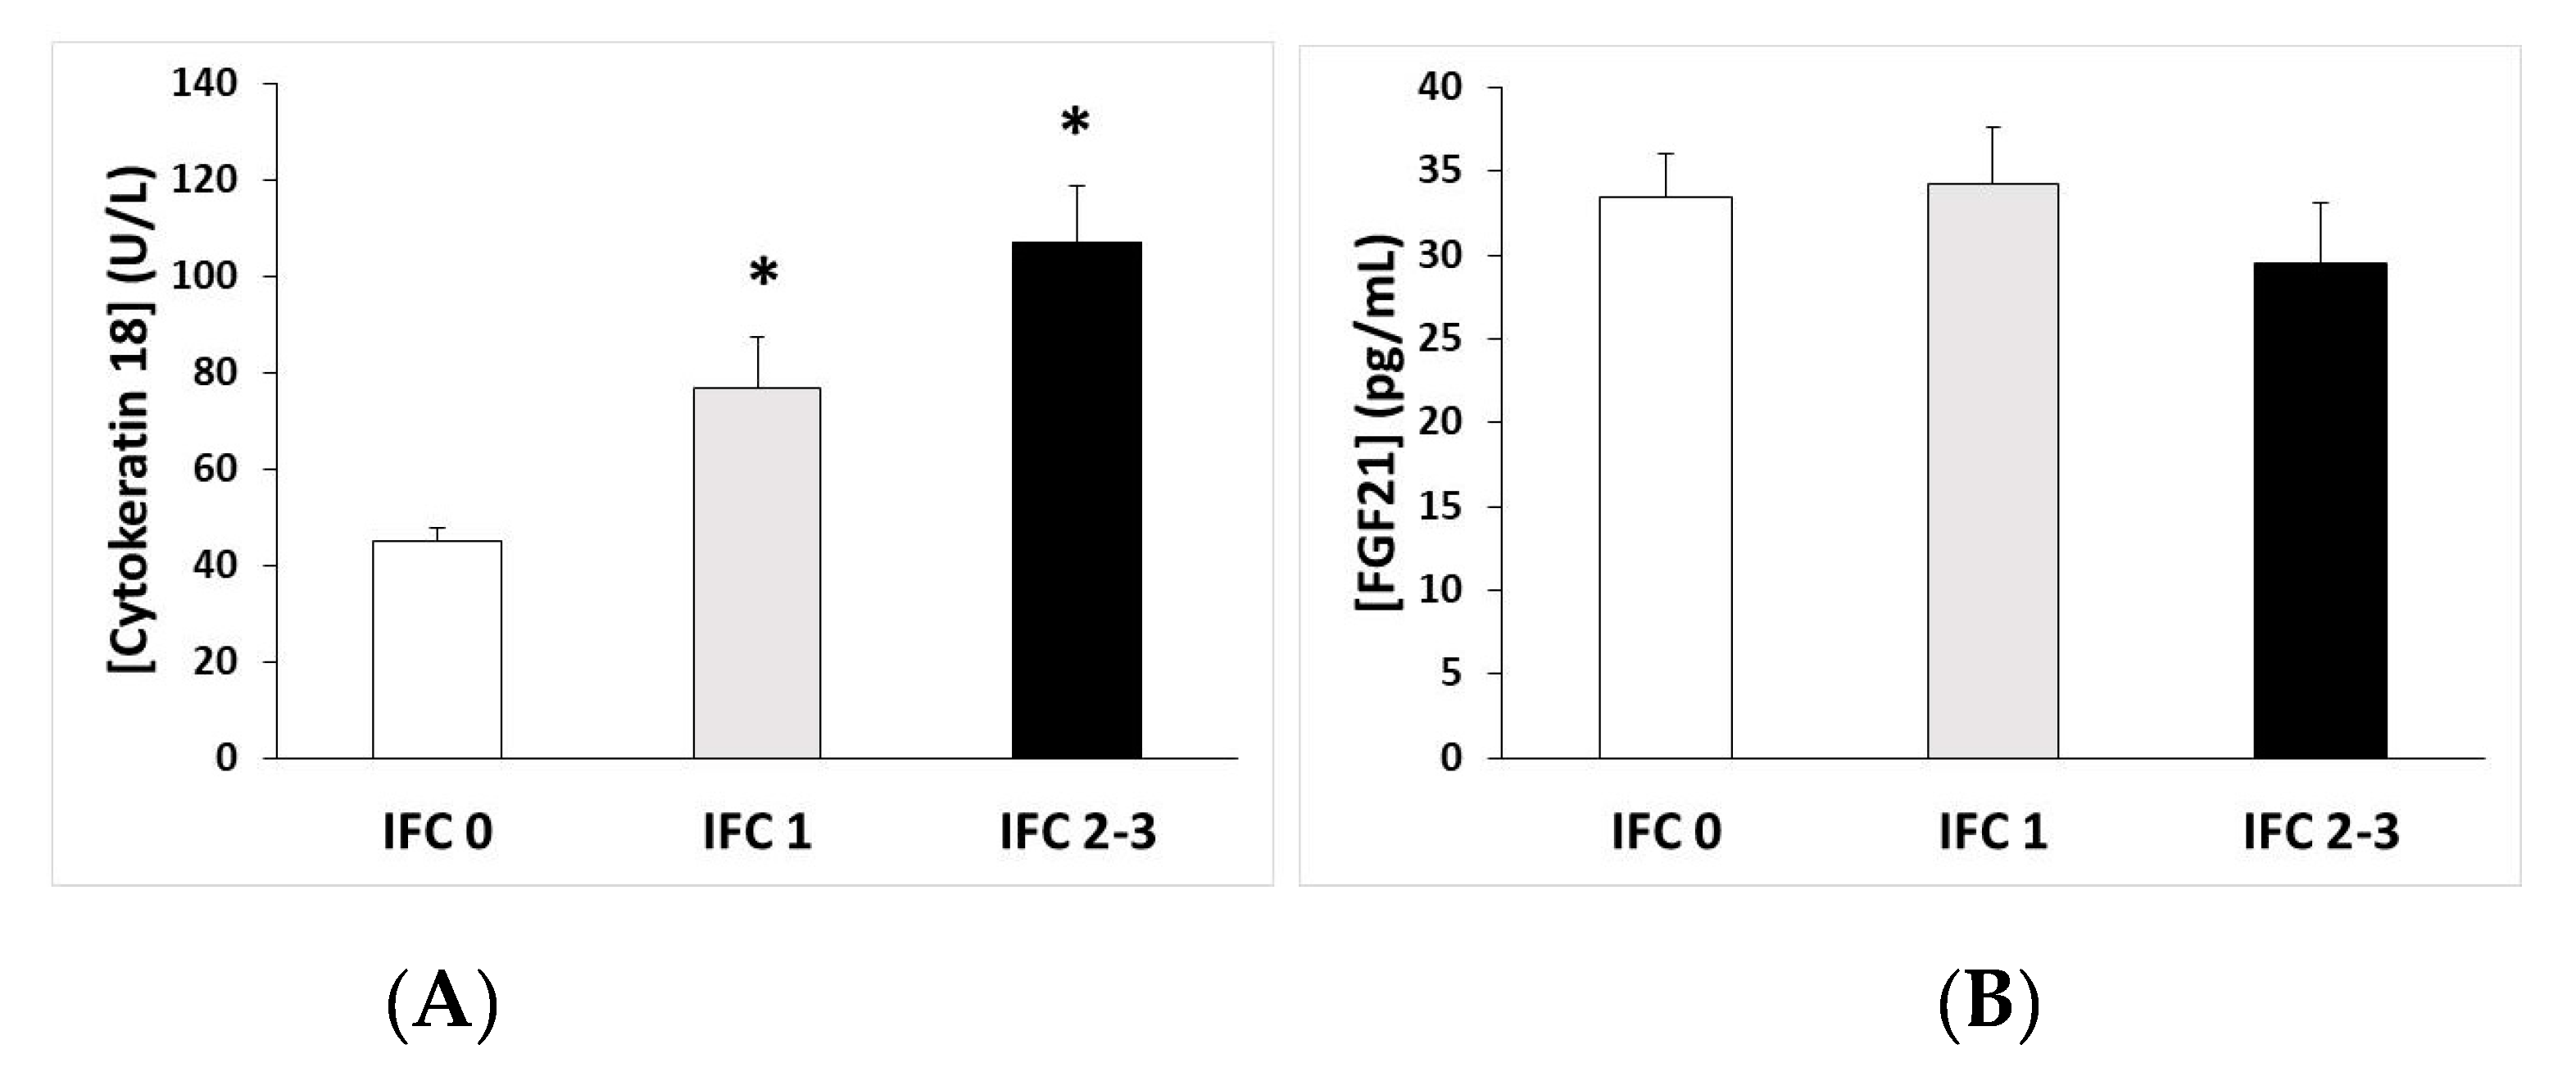
3.3. CK-18 and FGF21 Levels
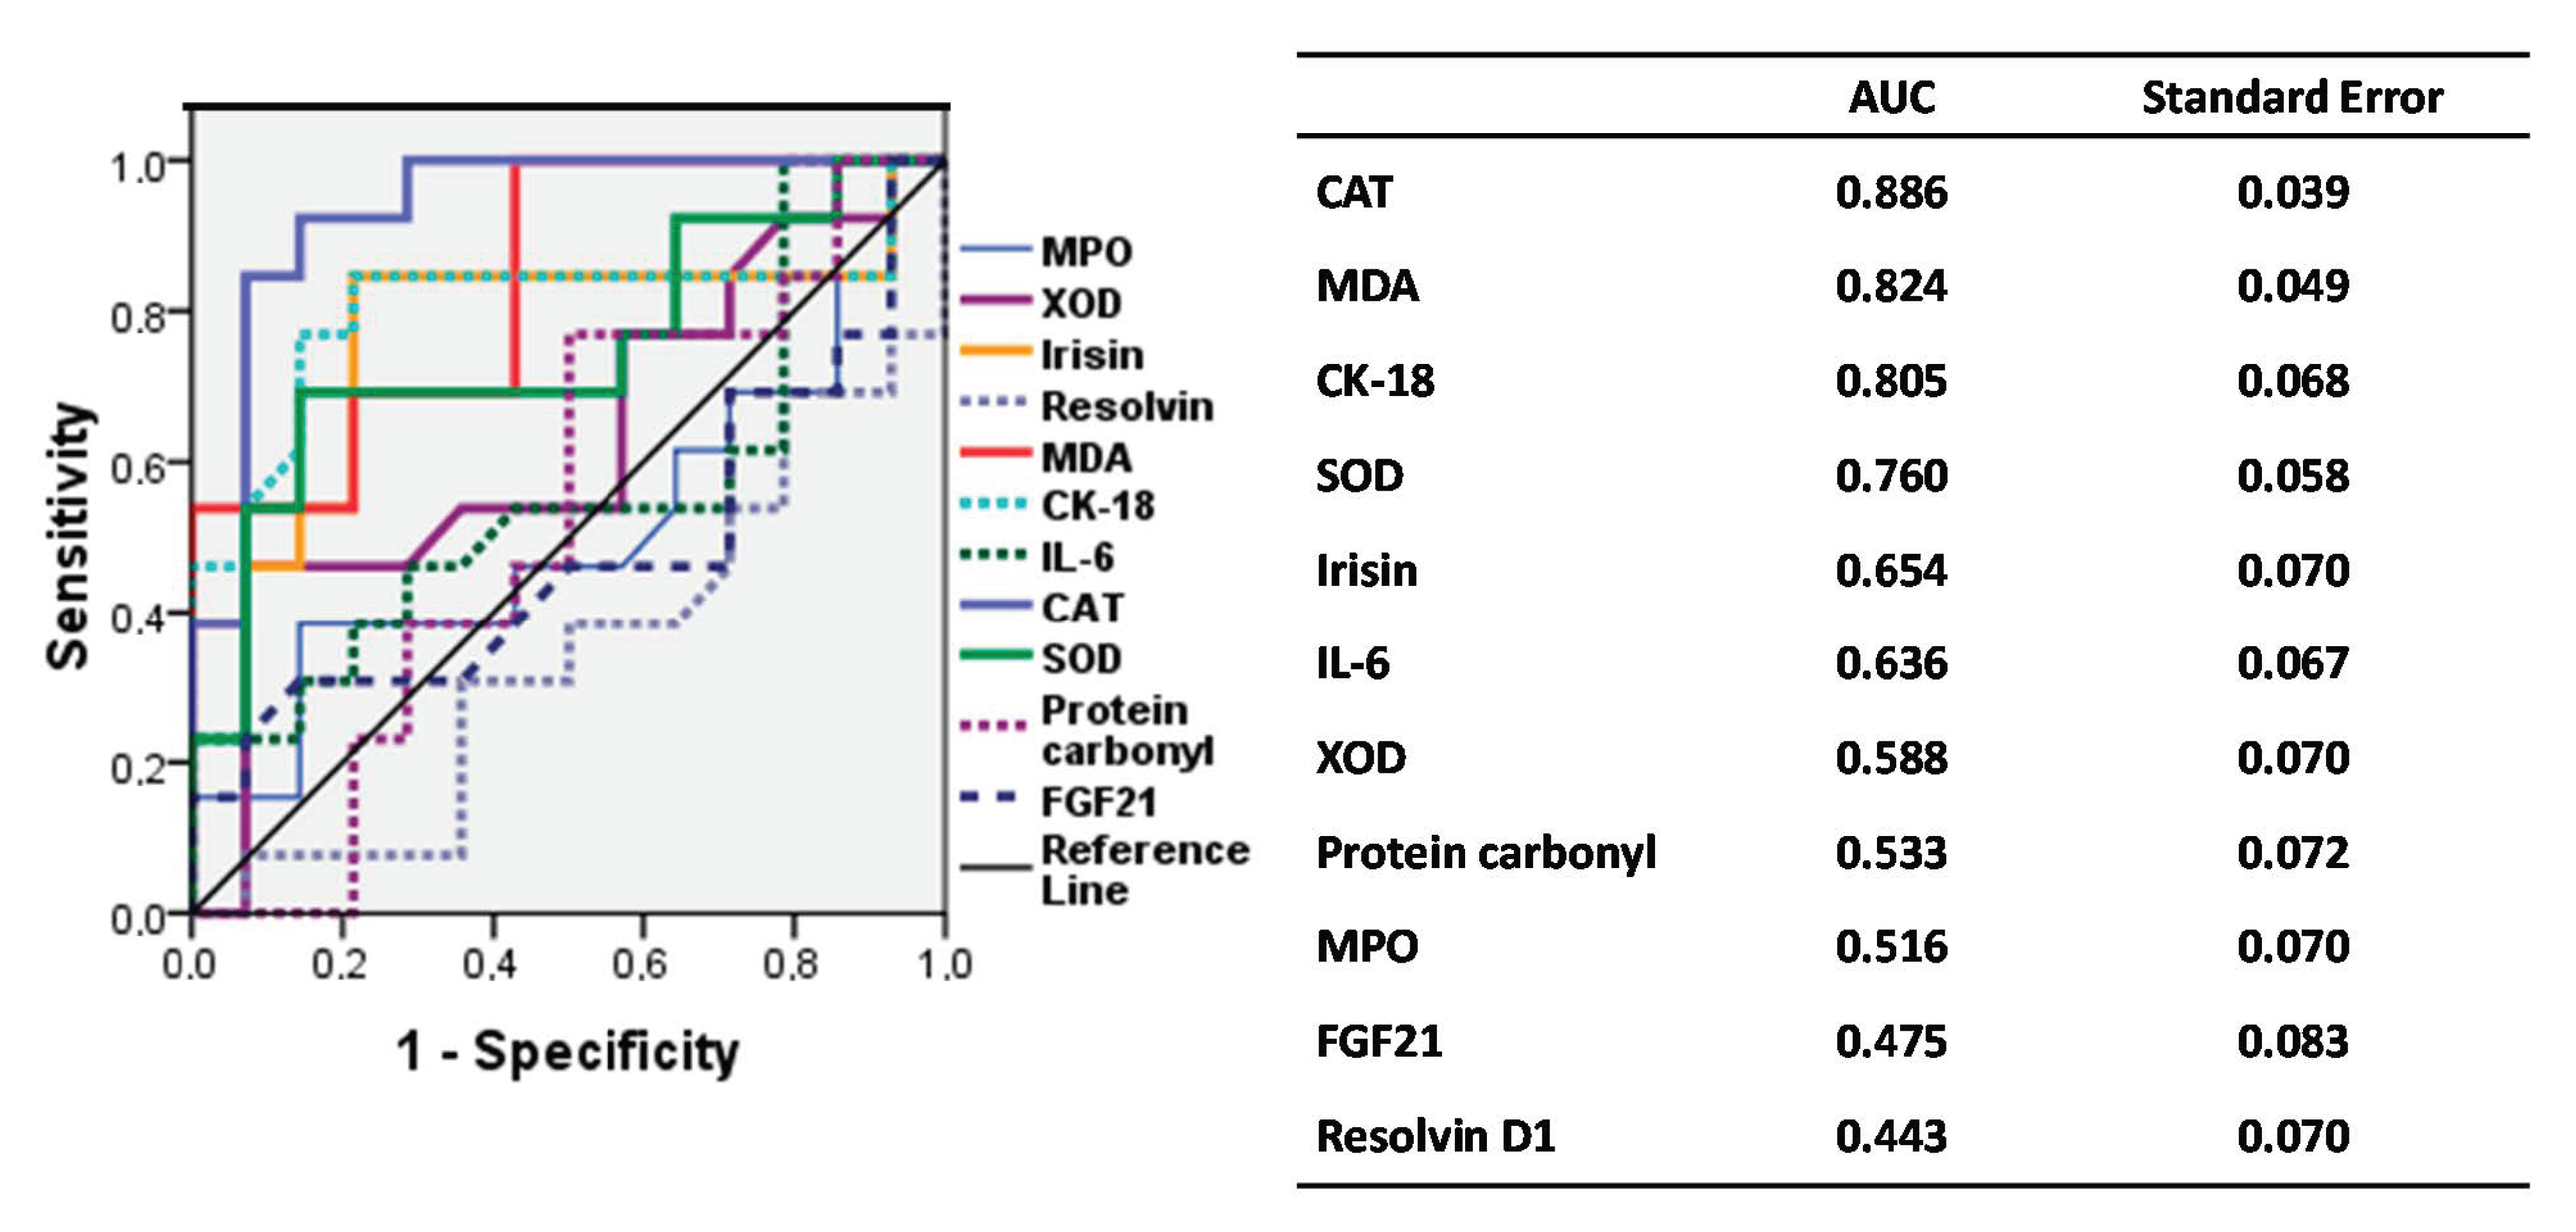
3.4. ROC Curve of Biomarkers According to IFC
3.5. Association of Biomarkers and Intrahepatic Fat Content (IFC)
4. Discussion
5. Strengths and Limitations
6. Conclusions
Author Contributions
Funding
Acknowledgments
Conflicts of Interest
References
- Younossi, Z.M. Non-alcoholic fatty liver disease—A global public health perspective. J. Hepatol. 2019, 70, 531–544. [Google Scholar] [CrossRef] [PubMed] [Green Version]
- Harrison, S.A.; Oliver, D.; Arnold, H.L.; Gogia, S.; Neuschwander-Tetri, B.A. Development and validation of a simple NAFLD clinical scoring system for identifying patients without advanced disease. Gut 2008, 57, 1441–1447. [Google Scholar] [CrossRef] [PubMed]
- Finck, B.N. Targeting metabolism, insulin resistance, and diabetes to treat nonalcoholic steatohepatitis. Diabetes 2018, 67, 2485–2493. [Google Scholar] [CrossRef] [PubMed] [Green Version]
- Than, N.N.; Newsome, P.N. Non-alcoholic fatty liver disease: When to intervene and with what. Clin. Med. 2015, 15, 186–190. [Google Scholar] [CrossRef] [Green Version]
- Vernon, G.; Baranova, A.; Younossi, Z.M. Systematic review: The epidemiology and natural history of non-alcoholic fatty liver disease and non-alcoholic steatohepatitis in adults. Aliment. Pharmacol. Ther. 2011, 34, 274–285. [Google Scholar] [CrossRef]
- VanWagner, L.B.; Rinella, M.E. Extrahepatic Manifestations of Nonalcoholic Fatty Liver Disease. Curr. Hepatol. Rep. 2016, 15, 75–85. [Google Scholar] [CrossRef] [Green Version]
- Tana, C.; Ballestri, S.; Ricci, F.; Di Vincenzo, A.; Ticinesi, A.; Gallina, S.; Giamberardino, M.A.; Cipollone, F.; Sutton, R.; Vettor, R.; et al. Cardiovascular risk in non-alcoholic fatty liver disease: Mechanisms and therapeutic implications. Int. J. Environ. Res. Public Health 2019, 16, 3104. [Google Scholar] [CrossRef] [Green Version]
- Marcuccilli, M.; Chonchol, M. NAFLD and chronic kidney disease. Int. J. Mol. Sci. 2016, 17, 562. [Google Scholar] [CrossRef] [Green Version]
- Bhatt, H.B.; Smith, R.J. Fatty liver disease in diabetes mellitus. Hepatobiliary Surg. Nutr. 2015, 4, 101–108. [Google Scholar]
- Sookoian, S.; Castaño, G.O.; Scian, R.; Gianotti, T.F.; Dopazo, H.; Rohr, C.; Gaj, C. Serum aminotransferases in nonalcoholic fatty liver disease are a signature of liver metabolic perturbations at the amino acid and Krebs cycle level. Am. J. Clin. Nutr. 2016, 103, 422–434. [Google Scholar] [CrossRef] [Green Version]
- Yasutake, K.; Kohjima, M.; Kotoh, K.; Nakashima, M.; Nakamuta, M.; Enjoji, M. Dietary habits and behaviors associated with nonalcoholic fatty liver disease. World J. Gastroenterol. 2014, 20, 1756. [Google Scholar] [CrossRef] [PubMed]
- Perdomo, C.M.; Frühbeck, G.; Escalada, J. Impact of nutritional changes on nonalcoholic fatty liver disease. Nutrients 2019, 11, 677. [Google Scholar] [CrossRef] [PubMed] [Green Version]
- Machado, M.V.; Cortez-Pinto, H. Non-invasive diagnosis of non-alcoholic fatty liver disease. A critical appraisal. J. Hepatol. 2013, 58, 1007–1019. [Google Scholar] [CrossRef] [PubMed] [Green Version]
- Hadefi, A.; Degré, D.; Trépo, E.; Moreno, C. Noninvasive diagnosis in alcohol-related liver disease. Health Sci. Rep. 2020, 3, e146. [Google Scholar] [CrossRef]
- Tong, J.; Guo, J.J. Key molecular pathways in the progression of non-alcoholic steatohepatitis. Eur. Rev. Med. Pharmacol. Sci. 2019, 23, 8515–8522. [Google Scholar]
- Masarone, M.; Rosato, V.; Dallio, M.; Gravina, A.G.; Aglitti, A.; Loguercio, C.; Federico, A.; Persico, M. Role of Oxidative Stress in Pathophysiology of Nonalcoholic Fatty Liver Disease. Oxid. Med. Cell. Longev. 2018, 2018, 9547613. [Google Scholar] [CrossRef]
- Milagro, F.I.; Campión, J.; Martíez, J.A. Weight gain induced by high-fat feeding involves increased liver oxidative stress. Obesity 2006, 14, 1118–1123. [Google Scholar] [CrossRef]
- Alessio, H.M. Lipid peroxidation in healthy and diseased models: Influence of different types of exercise. In Handbook of Oxidants and Antioxidants in Exercise; Sen, C.K., Packer, L., Hänninen, O.O.P., Eds.; Elsevier: Amsterdam, The Netherlands, 2000; Part III, Chapter 5; pp. 115–127. [Google Scholar]
- Tirosh, O.; Reznick, A.Z. Chemical bases and biological relevance of protein oxidation. In Handbook of Oxidants and Antioxidants in Exercise; Sen, C.K., Packer, L., Hänninen, O.O.P., Eds.; Elsevier: Amsterdam, The Netherlands, 2000; Part III, Chapter 4; pp. 89–114. [Google Scholar]
- Hartmann, A.; Niess, A.M. Oxidative DNA damage in exercise. Pathophysiology 1998, 5, 112. [Google Scholar] [CrossRef]
- Alkhouri, N.; Dixon, L.J.; Feldstein, A.E. Lipotoxicity in nonalcoholic fatty liver disease: Not all lipids are created equal. Expert Rev. Gastroenterol. Hepatol. 2009, 3, 445–451. [Google Scholar] [CrossRef] [Green Version]
- Aronis, A.; Madar, Z.; Tirosh, O. Mechanism underlying oxidative stress-mediated lipotoxicity: Exposure of J774.2 macrophages to triacylglycerols facilitates mitochondrial reactive oxygen species production and cellular necrosis. Free Radic. Biol. Med. 2005, 38, 1221–1230. [Google Scholar] [CrossRef]
- Videla, L.A.; Rodrigo, R.; Orellana, M.; Fernandez, V.; Tapia, G.; Quiñones, L.; Varela, N.; Contreras, J.; Lazarte, R.; Csendes, A.; et al. Oxidative stress-related parameters in the liver of non-alcoholic fatty liver disease patients. Clin. Sci. 2004, 106, 261–268. [Google Scholar] [CrossRef] [PubMed] [Green Version]
- Geering, B.; Stoeckle, C.; Conus, S.; Simon, H.-U. Living and dying for inflammation: Neutrophils, eosinophils, basophils. Trends Immunol. 2013, 34, 398–409. [Google Scholar] [CrossRef] [PubMed]
- Minihane, A.M.; Vinoy, S.; Russell, W.R.; Baka, A.; Roche, H.M.; Tuohy, K.M.; Teeling, J.L.; Blaak, E.E.; Fenech, M.; Vauzour, D.; et al. Low-grade inflammation, diet composition and health: Current research evidence and its translation. Br. J. Nutr. 2015, 114, 999–1012. [Google Scholar] [CrossRef] [PubMed] [Green Version]
- Brunt, E.M.; Tiniakos, D.G. Histopathology of nonalcoholic fatty liver disease. World J. Gastroenterol. 2010, 16, 5286–5296. [Google Scholar] [CrossRef] [PubMed]
- Clinical Trials.gov. US National Library of Medicine. Prevention and Reversion of NAFLD in Obese Patients With Metabolic Syndrome by Mediterranean Diet and Physical Activity (FLIPAN). Available online: https://clinicaltrials.gov/ct2/show/NCT04442620 (accessed on 22 June 2020).
- Reeder, S.B.; Sirlin, C.B. Quantification of liver fat with magnetic resonance imaging. Magn. Reson. Imaging Clin. N. Am. 2010, 18, 337–357. [Google Scholar] [CrossRef] [PubMed] [Green Version]
- Eskreis-Winkler, S.; Corrias, G.; Monti, S.; Zheng, J.; Capanu, M.; Krebs, S.; Fung, M.; Reeder, S.; Mannelli, L. IDEAL-IQ in an oncologic population: Meeting the challenge of concomitant liver fat and liver iron. Cancer Imaging 2018, 18, 51. [Google Scholar] [CrossRef]
- Tang, A.; Tan, J.; Sun, M.; Hamilton, G.; Bydder, M.; Wolfson, T.; Gamst, A.C.; Middleton, M.; Brunt, E.M.; Loomba, R.; et al. Nonalcoholic fatty liver disease: MR imaging of liver proton density fat fraction to assess hepatic steatosis. Radiology 2013, 267, 422–431. [Google Scholar] [CrossRef] [Green Version]
- Cantero, I.; Elorz, M.; Abete, I.; Marin, B.A.; Herrero, J.I.; Monreal, J.I.; Benito, A.; Quiroga, J.; Martínez, A.; Huarte, M.P.; et al. Ultrasound/elastography techniques, lipidomic and blood markers compared to magnetic resonance imaging in non-alcoholic fatty liver disease adults. Int. J. Med. Sci. 2019, 16, 75–83. [Google Scholar] [CrossRef] [Green Version]
- Cantero, I.; Abete, I.; Babio, N.; Arós, F.; Corella, D.; Estruch, R.; Fitó, M.; Hebert, J.R.; Martínez-González, M.Á.; Pintó, X.; et al. Dietary Inflammatory Index and liver status in subjects with different adiposity levels within the PREDIMED trial. Clin. Nutr. 2018, 37, 1736–1743. [Google Scholar] [CrossRef] [Green Version]
- Bradford, M. A Rapid and Sensitive Method for the Quantitation of Microgram Quantities of Protein Utilizing the Principle of Protein-Dye Binding. Anal. Biochem. 1976, 72, 248–254. [Google Scholar] [CrossRef]
- Aebi, H. Catalase in vitro. Methods Enzymol. 1984, 105, 121–126. [Google Scholar] [PubMed]
- McCord, J.M.; Fridovich, I. Superoxide dismutase. An enzymic function for erythrocuprein (hemocuprein). J. Biol. Chem. 1969, 244, 6049–6055. [Google Scholar] [PubMed]
- Santilli, F.; Blardi, P.; Scapellato, C.; Bocchia, M.; Guazzi, G.; Terzuoli, L.; Tabucchi, A.; Silvietti, A.; Lucani, B.; Gioffrè, W.R.; et al. Decreased plasma endogenous soluble RAGE, and enhanced adipokine secretion, oxidative stress and platelet/coagulative activation identify non-alcoholic fatty liver disease among patients with familial combined hyperlipidemia and/or metabolic syndrome. Vascul. Pharmacol. 2015, 72, 16–24. [Google Scholar] [CrossRef]
- Świderska, M.; Maciejczyk, M.; Zalewska, A.; Pogorzelska, J.; Flisiak, R.; Chabowski, A. Oxidative stress biomarkers in the serum and plasma of patients with non-alcoholic fatty liver disease (NAFLD). Can plasma AGE be a marker of NAFLD? Oxidative stress biomarkers in NAFLD patients. Free Radic. Res. 2019, 53, 841–850. [Google Scholar] [CrossRef] [PubMed]
- Kühn, T.; Nonnenmacher, T.; Sookthai, D.; Schübel, R.; Quintana Pacheco, D.A.; von Stackelberg, O.; Graf, M.E.; Johnson, T.; Schlett, C.L.; Kirsten, R.; et al. Anthropometric and blood parameters for the prediction of NAFLD among overweight and obese adults. BMC Gastroenterol. 2018, 18, 113. [Google Scholar] [CrossRef] [Green Version]
- Tian, J.; Zhong, R.; Liu, C.; Tang, Y.; Gong, J.; Chang, J.; Lou, J.; Ke, J.; Li, J.; Zhang, Y.; et al. Association between bilirubin and risk of Non-Alcoholic Fatty Liver Disease based on a prospective cohort study. Sci. Rep. 2016, 6, 31006. [Google Scholar] [CrossRef]
- Chang, Y.; Ryu, S.; Zhang, Y.; Son, H.J.; Kim, J.-Y.; Cho, J.; Guallar, E. A Cohort Study of Serum Bilirubin Levels and Incident Non-Alcoholic Fatty Liver Disease in Middle Aged Korean Workers. PLoS ONE 2012, 7, e37241. [Google Scholar] [CrossRef] [Green Version]
- Ashraf, N.U.; Sheikh, T.A. Endoplasmic reticulum stress and Oxidative stress in the pathogenesis of Non-alcoholic fatty liver disease. Free Radic. Res. 2015, 49, 1405–1418. [Google Scholar] [CrossRef]
- Videla, L.A.; Rodrigo, R.; Araya, J.; Poniachik, J. Oxidative stress and depletion of hepatic long-chain polyunsaturated fatty acids may contribute to nonalcoholic fatty liver disease. Free Radic. Biol. Med. 2004, 37, 1499–1507. [Google Scholar] [CrossRef]
- Koroglu, E.; Canbakan, B.; Atay, K.; Hatemi, I.; Tuncer, M.; Dobrucali, A.; Sonsuz, A.; Gultepe, I.; Senturk, H. Role of oxidative stress and insulin resistance in disease severity of non-alcoholic fatty liver disease. Turkish J. Gastroenterol. 2016, 27, 361–366. [Google Scholar] [CrossRef]
- Han, J.; Kaufman, R.J. The role of ER stress in lipid metabolism and lipotoxicity. J. Lipid Res. 2016, 57, 1329–1338. [Google Scholar] [CrossRef] [PubMed] [Green Version]
- Borradaile, N.M.; Han, X.; Harp, J.D.; Gale, S.E.; Ory, D.S.; Schaffer, J.E. Disruption of endoplasmic reticulum structure and integrity in lipotoxic cell death. J. Lipid Res. 2006, 47, 2726–2737. [Google Scholar] [CrossRef] [PubMed] [Green Version]
- Rong, X.; Albert, C.J.; Hong, C.; Duerr, M.A.; Chamberlain, B.T.; Tarling, E.J.; Ito, A.; Gao, J.; Wang, B.; Edwards, P.A.; et al. LXRs regulate ER stress and inflammation through dynamic modulation of membrane phospholipid composition. Cell Metab. 2013, 18, 685–697. [Google Scholar] [CrossRef] [PubMed] [Green Version]
- Kumar, A.; Sharma, A.; Duseja, A.; Das, A.; Dhiman, R.K.; Chawla, Y.K.; Kohli, K.K.; Bhansali, A. Patients with Nonalcoholic Fatty Liver Disease (NAFLD) have Higher Oxidative Stress in Comparison to Chronic Viral Hepatitis. J. Clin. Exp. Hepatol. 2013, 3, 12–18. [Google Scholar] [CrossRef] [PubMed] [Green Version]
- Rensen, S.S.; Slaats, Y.; Nijhuis, J.; Jans, A.; Bieghs, V.; Driessen, A.; Malle, E.; Greve, J.W.; Buurman, W.A. Increased hepatic myeloperoxidase activity in obese subjects with nonalcoholic steatohepatitis. Am. J. Pathol. 2009, 175, 1473–1482. [Google Scholar] [CrossRef] [Green Version]
- Rensen, S.S.; Bieghs, V.; Xanthoulea, S.; Arfianti, E.; Bakker, J.A.; Shiri-Sverdlov, R.; Hofker, M.H.; Greve, J.W.; Buurman, W.A. Neutrophil-Derived Myeloperoxidase Aggravates Non-Alcoholic Steatohepatitis in Low-Density Lipoprotein Receptor-Deficient Mice. PLoS ONE 2012, 7, e52411. [Google Scholar] [CrossRef] [Green Version]
- Wang, B.; Yang, R.N.; Zhu, Y.R.; Xing, J.C.; Lou, X.W.; He, Y.J.; Ding, Q.L.; Zhang, M.Y.; Qiu, H. Involvement of xanthine oxidase and paraoxonase 1 in the process of oxidative stress in nonalcoholic fatty liver disease. Mol. Med. Rep. 2017, 15, 387–395. [Google Scholar] [CrossRef] [Green Version]
- Morita, M.; Ishida, N.; Uchiyama, K.; Yamaguchi, K.; Itoh, Y.; Shichiri, M.; Yoshida, Y.; Hagihara, Y.; Naito, Y.; Yoshikawa, T.; et al. Fatty liver induced by free radicals and lipid peroxidation. Free Radic. Res. 2012, 46, 758–765. [Google Scholar] [CrossRef]
- Feldman, A.; Eder, S.K.; Felder, T.K.; Paulweber, B.; Zandanell, S.; Stechemesser, L.; Schranz, M.; Strebinger, G.; Huber-Schönauer, U.; Niederseer, D.; et al. Clinical and metabolic characterization of obese subjects without non-alcoholic fatty liver: A targeted metabolomics approach. Diabetes Metab. 2019, 45, 132–139. [Google Scholar] [CrossRef]
- Hendy, O.M.; Elsabaawy, M.M.; Aref, M.M.; Khalaf, F.M.; Moaty Oda, A.A.; El Shazly, H.M.; Khalaf, F.A. Evaluation of circulating zonulin as a potential marker in the pathogenesis of non-alcoholic fatty liver disease. Bull. Egypt. Soc. Physiol. Sci 2016, 36, 20–29. [Google Scholar] [CrossRef]
- Monserrat-Mesquida, M.; Quetglas-Llabrés, M.; Capó, X.; Bouzas, C.; Mateos, D.; Pons, A.; Tur, J.A.; Sureda, A. Metabolic Syndrome is Associated with Oxidative Stress and Proinflammatory State. Antioxidants 2020, 9, 236. [Google Scholar] [CrossRef] [PubMed] [Green Version]
- Feldstein, A.E.; Wieckowska, A.; Lopez, A.R.; Liu, Y.C.; Zein, N.N.; McCullough, A.J. Cytokeratin-18 fragment levels as noninvasive biomarkers for nonalcoholic steatohepatitis: A multicenter validation study. Hepatology 2009, 50, 1072–1078. [Google Scholar] [CrossRef] [PubMed] [Green Version]
- Wu, G.; Li, H.; Fang, Q.; Zhang, J.; Zhang, M.; Zhang, L.; Wu, L.; Hou, X.; Lu, J.; Bao, Y.; et al. Complementary Role of Fibroblast Growth Factor 21 and Cytokeratin 18 in Monitoring the Different Stages of Nonalcoholic Fatty Liver Disease. Sci. Rep. 2017, 7, 5095. [Google Scholar] [CrossRef] [PubMed]
- Naugler, W.E.; Sakurai, T.; Kim, S.; Maeda, S.; Kim, K.; Elsharkawy, A.M.; Karin, M. Gender disparity in liver cancer due to sex differences in MyD88-dependent IL-6 production. Science 2007, 317, 121–124. [Google Scholar] [CrossRef] [Green Version]
- Sander, L.E.; Trautwein, C.; Liedtke, C. Is interleukin-6 a gender-specific risk factor for liver cancer? Hepatology 2007, 46, 1304–1305. [Google Scholar] [CrossRef]
- Musso, G.; Gambino, R.; Cassader, M.; Pagano, G. Meta-analysis: Natural history of non-alcoholic fatty liver disease (NAFLD) and diagnostic accuracy of non-invasive tests for liver disease severity. Ann. Med. 2011, 43, 617–649. [Google Scholar] [CrossRef]
- Kawanaka, M.; Nishino, K.; Nakamura, J.; Urata, N.; Oka, T.; Goto, D.; Suehiro, M.; Kawamoto, H.; Yamada, G. Correlation between serum cytokeratin-18 and the progression or regression of non-alcoholic fatty liver disease. Ann. Hepatol. 2015, 14, 837–844. [Google Scholar] [CrossRef]
- Choi, E.S.; Kim, M.K.; Song, M.K.; Kim, J.M.; Kim, E.S.; Chung, W.J.; Park, K.S.; Cho, K.B.; Hwang, J.S.; Jang, B.K. Association between serum irisin levels and non-alcoholic fatty liver disease in health screen examinees. PLoS ONE 2014, 9, e110680. [Google Scholar] [CrossRef]
- Pardo, M.; Crujeiras, A.B.; Amil, M.; Aguera, Z.; Jiménez-Murcia, S.; Baños, R.; Botella, C.; de la Torre, R.; Estivill, X.; Fagundo, A.B.; et al. Association of irisin with fat mass, resting energy expenditure, and daily activity in conditions of extreme body mass index. Int. J. Endocrinol. 2014, 2014, 857270. [Google Scholar] [CrossRef] [Green Version]
- Shoukry, A.; Shalaby, S.M.; El-Arabi Bdeer, S.; Mahmoud, A.A.; Mousa, M.M.; Khalifa, A. Circulating serum irisin levels in obesity and type 2 diabetes mellitus. IUBMB Life 2016, 68, 544–556. [Google Scholar] [CrossRef]
- Canivet, C.M.; Bonnafous, S.; Rousseau, D.; Leclere, P.S.; Lacas-Gervais, S.; Patouraux, S.; Sans, A.; Luci, C.; Bailly-Maitre, B.; Iannelli, A.; et al. Hepatic FNDC5 is a potential local protective factor against Non-Alcoholic Fatty Liver. Biochim. Biophys. Acta Mol. Basis Dis. 2020, 1866, 165705. [Google Scholar] [CrossRef] [PubMed]
- Titos, E.; Rius, B.; López-Vicario, C.; Alcaraz-Quiles, J.; García-Alonso, V.; Lopategi, A.; Dalli, J.; Lozano, J.J.; Arroyo, V.; Delgado, S.; et al. Signaling and Immunoresolving Actions of Resolvin D1 in Inflamed Human Visceral Adipose Tissue. J. Immunol. 2016, 197, 3360–3370. [Google Scholar] [CrossRef] [PubMed] [Green Version]
- Ke, Y.; Xu, C.; Lin, J.; Li, Y. Role of hepatokines in non-alcoholic fatty liver disease. J. Transl. Intern. Med. 2020, 7, 143–148. [Google Scholar] [CrossRef] [PubMed] [Green Version]
- Qian, L.-L.; Wu, L.; Zhang, L.; Zhang, J.; Zhou, J.; Li, Y.-H.; Fang, Q.-C.; Li, H.-T.; Jia, W.-P. Serum biomarkers combined with ultrasonography for early diagnosis of non-alcoholic fatty liver disease confirmed by magnetic resonance spectroscopy. Acta Pharmacol. Sin. 2020, 41, 554–560. [Google Scholar] [CrossRef] [PubMed]
- Yilmaz, Y.; Eren, F.; Yonal, O.; Kurt, R.; Aktas, B.; Celikel, C.A.; Ozdogan, O.; Imeryuz, N.; Kalayci, C.; Avsar, E. Increased serum FGF21 levels in patients with nonalcoholic fatty liver disease. Eur. J. Clin. Investig. 2010, 40, 887–892. [Google Scholar] [CrossRef] [PubMed]
- Li, H.; Dong, K.; Fang, Q.; Hou, X.; Zhou, M.; Bao, Y.; Xiang, K.; Xu, A.; Jia, W. High serum level of fibroblast growth factor 21 is an independent predictor of non-alcoholic fatty liver disease: A 3-year prospective study in China. J. Hepatol. 2013, 58, 557–563. [Google Scholar] [CrossRef]
- Woo, Y.C.; Xu, A.; Wang, Y.; Lam, K.S.L. Fibroblast Growth Factor 21 as an emerging metabolic regulator: Clinical perspectives. Clin. Endocrinol. (Oxf.) 2013, 78, 489–496. [Google Scholar] [CrossRef]
- Maratos-Flier, E. Fatty liver and FGF21 physiology. Exp. Cell Res. 2017, 360, 2–5. [Google Scholar] [CrossRef]
- Zarei, M.; Pizarro-Delgado, J.; Barroso, E.; Palomer, X.; Vázquez-Carrera, M. Targeting FGF21 for the Treatment of Nonalcoholic Steatohepatitis. Trends Pharmacol. Sci. 2020, 41, 199–208. [Google Scholar] [CrossRef]
- Targher, G.; Byrne, C.D.; Lonardo, A.; Zoppini, G.; Barbui, C. Non-alcoholic fatty liver disease and risk of incident cardiovascular disease: A meta-analysis. J. Hepatol. 2016, 65, 589–600. [Google Scholar] [CrossRef] [Green Version]
- Lonardo, A.; Nacimbeni, F.; Mantovani, A.; Targher, G. Hypertension, diabetes, atherosclerosis and NASH: Cause or consequence? J. Hepatol. 2018, 68, 335–352. [Google Scholar] [CrossRef] [PubMed]
- Ballestri, S.; Mantovani, A.; Nascimbeni, F.; Lugari, S.; Lonardo, A. Extra-hepatic manifestations and complications of nonalcoholic fatty liver disease. Future Med. Chem. 2019, 11, 2171–2192. [Google Scholar] [CrossRef] [PubMed]
- Tariq, R.; Axley, P.; Singal, A.K. Extra-Hepatic Manifestations of Nonalcoholic Fatty Liver Disease: A Review. J. Clin. Exp. Hepatol. 2020, 10, 81–87. [Google Scholar] [CrossRef]
- González, M.; Bibiloni, M.M.; Pons, A.; Llompart, I.; Tur, J.A. Inflammatory markers and metabolic syndrome among adolescents. Eur. J. Clin. Nutr. 2012, 66, 1141–1145. [Google Scholar] [CrossRef] [PubMed]
- Bibiloni, M.M.; Maffeis, C.; Llompart, I.; Pons, A.; Tur, J.A. Dietary factors associated with subclinical inflammation among girls. Eur. J. Clin. Nutr. 2013, 67, 1264–1270. [Google Scholar] [CrossRef] [PubMed]
- Sureda, A.; Bibiloni, M.M.; Martorell, M.; Buil-Cosiales, P.; Marti, A.; Pons, A.; Tur, J.A.; Martínez-González, M.A. Mediterranean diets supplemented with virgin olive oil and nuts enhance plasmatic antioxidant capabilities and decrease xanthine oxidase activity in people with metabolic syndrome: The PREDIMED study. Mol. Nutr. Food Res. 2016, 60, 2654–2664. [Google Scholar] [CrossRef]
- Moreno, B.; Monereo, S.; Álvarez, J. Obesity in the third millenium. In La obesidad en el Tercer Milenio, 3rd ed.; Editorial Panamericana: Madrid, Spain, 2004; p. 395. [Google Scholar]
- Cachofeiro, V.; Miana, M.; Martín-Fernández, B.; de las Heras, N.; Lahera, V. Obesity, inflammation and endothelial dysfunction [Obesidad, inflamación y disfunción endotelial]. Rev. Esp. Obes. 2006, 4, 195–204. [Google Scholar]
- Moreno-Aliaga, M.J.; Campion, J.; Milagro, F.; Berjon, A.; Martinez, J.A. Adiposity and proinflammatory state: The chicken or the egg. Adipocytes 2005, 1, 1–13. [Google Scholar]
- Rana, J.S.; Nieuwdorp, M.; Jukema, J.W.; Kastelein, J.J. Cardiovascular metabolic syndrome—An interplay of, obesity, inflammation, diabetes and coronary heart disease. Diabetes Obes. Metab. 2007, 9, 218–232. [Google Scholar] [CrossRef]
- Zimmet, P.; Magliano, D.; Matsuzawa, Y.; Alberti, G.; Shaw, J. The metabolic syndrome: A global public health problem and a new definition. J. Atheroscler. Thromb. 2005, 12, 295–300. [Google Scholar] [CrossRef] [Green Version]


| Sociodemographic and Clinical Characteristics | Reference Values | IFC = 0 (n = 30) | IFC = 1 (n =35) | IFC ≥ 2 (n = 35) | p-Value |
|---|---|---|---|---|---|
| Age (years) | 52.5 ± 1.1 | 53.5 ± 1.2 | 51.7 ± 1.1 | 0.510 | |
| Female [n (%)] | 16 (54.5) | 17 (48.6) | 14 (40.7) | 0.136 | |
| Male [n (%)] | 14 (45.5) | 18 (50.0) | 21 (59.3) | ||
| Currently smoking [n (%)] | 3 (9.3) | 4 (12.5) | 1 (3.7) | 0.138 | |
| Currently alcohol consumption [n (%)] | 5 (16.3) | 6 (17.5) | 4 (11.1) | 0.912 | |
| Hypoglycaemic drugs [n (%)] | 7 (23.1) | 8 (23.7) | 10 (29.6) | 0.869 | |
| Antihypertensive drugs [n (%)] | 14 (46.2) | 15 (42.1) | 16 (44.4) | 0.507 | |
| Lipid-lowering drugs [n (%)] | 14 (46.2) | 9 (26.3) | 13 (37.0) | 0.231 | |
| Other drugs [n (%)] | 21 (69.2) | 24 (68.4) | 22 (63.0) | 0.507 | |
| Weight (kg) | 88.0 ± 2.5 | 94.2 ± 2.5 | 95.1 ± 1.9 | 0.073 | |
| Height (cm) | 164.5 ± 1.5 | 168.8 ± 1.7 | 166.2 ± 1.6 | 0.165 | |
| BMI (kg/m2) | 32.4 ± 0.7 | 33.0 ± 0.7 | 34.3 ± 0.6 | 0.109 | |
| Systolic blood pressure (mmHg) | <130 | 131.3 ± 2.0 | 134.4 ± 1.9 | 140.9 ± 1.9 * | 0.003 |
| Diastolic blood pressure (mmHg) | <85 | 74.3 ± 1.1 | 80.7 ± 0.9 * | 84.3 ± 1.1 * # | <0.001 |
| Glucose (mg/dL) | 70–110 | 99.9 ± 3.4 | 109.3 ± 3.6 | 121.7 ± 6.2 * | 0.005 |
| Hb1Ac (%) | 3.8–6.2 | 5.68 ± 0.09 | 5.80 ± 0.15 | 7.14 ± 0.65 * # | 0.015 |
| Triglycerides (mg/dL) | <149 | 132.1 ± 8.6 | 207.6 ± 19.5 | 254.5 ± 42.4 * | 0.010 |
| HDL-cholesterol (mg/dL) | ≥60 | 51.0 ± 1.3 | 42.8 ± 1.1 * | 41.3 ± 0.9 * | <0.001 |
| LDL-cholesterol (mg/dL) | <100 | 142.5 ± 3.5 | 126.2 ± 3.6 * | 133.5 ± 3.9 | 0.007 |
| Cholesterol total (mg/dL) | <200 | 219.7 ± 4.2 | 209.7 ± 5.1 | 221.4 ± 6.7 | 0.254 |
| Bilirubin (mg/dL) | 0.2–1.2 | 0.703 ± 0.337 | 0.713 ± 0.427 | 0.654 ± 0.047 | 0.571 |
| AST (U/L) | 5–34 | 22.6 ± 1.8 | 25.0 ± 1.7 | 28.9 ± 1.8 * | 0.045 |
| ALT (U/L) | 0–55 | 27.8 ± 2.2 | 33.2 ± 4.4 | 45.2 ± 3.1 * # | 0.002 |
| GGT (U/L) | 12–64 | 48.5 ± 5.9 | 48.2 ± 5.4 | 49.5 ± 5.2 | 0.983 |
| CRP (mg/dL) | 0.0–0.5 | 0.438 ± 0.073 | 0.523 ± 0.068 | 0.552 ± 0.074 | 0.524 |
| Haematocrit (%) | 40.0–50.0 | 43.6 ± 0.4 | 44.4 ± 0.3 | 43.7 ± 0.5 | 0.243 |
| Erythrocytes (106/μL) | 4.50–5.80 | 4.86 ± 0.05 | 5.00 ± 0.04 | 4.89 ± 0.05 | 0.088 |
| Leukocytes (103/μL) | 4.00–11.00 | 7.06 ± 0.20 | 7.46 ± 0.18 | 7.31 ± 0.23 | 0.377 |
| Platelets (103/μL) | 150.0–400.0 | 232.9 ± 6.2 | 229.8 ± 4.5 | 245.1 ± 6.0 | 0.117 |
| IFC = 0 (n = 30) | IFC = 1 (n = 35) | IFC ≥ 2 (n = 35) | p-Value | |
|---|---|---|---|---|
| (Mean ± SEM) | (Mean ± SEM) | (Mean ± SEM) | ||
| Enzymatic Activities | ||||
| CAT (kat/L sang) | 28.3 ± 0.8 | 39.4 ± 0.9 * | 60.0 ± 1.7 * # | <0.001 |
| Women | 31.8 ± 1.2 | 51.9 ± 4.3 | 60.8 ± 1.0 | |
| Men | 29.9 ± 1.6 | 42.1 ± 1.6 | 50.3 ± 2.1 | |
| p-value † | 0.355 | 0.015 | 0.002 | |
| SOD (pkat/L sang) | 277 ± 9 | 271 ± 9 | 307 ± 8 * # | 0.011 |
| Women | 281 ± 9 | 269 ± 7 | 330 ± 26 | |
| Men | 261 ± 13 | 294 ± 14 | 257 ± 32 | |
| p-value † | 0.214 | 0.218 | 0.182 | |
| ELISA Assays | ||||
| MPO (ng/mL) | 5.55 ± 0.52 | 5.01 ± 0.37 | 5.12 ± 0.61 | 0.708 |
| Women | 4.77 ± 0.45 | 5.29 ± 0.66 | 7.12 ± 2.26 | |
| Men | 6.09 ± 0.84 | 4.55 ± 0.38 | 7.91 ± 1.46 | |
| p-value † | 0.151 | 0.302 | 0.777 | |
| XOD (ng/mL) | 0.398 ± 0.017 | 0.382 ± 0.014 | 0.396 ± 0.021 | 0.747 |
| Women | 0.378 ± 0.021 | 0.429 ± 0.037 | 0.323 ± 0.048 | |
| Men | 0.395 ± 0.021 | 0.395 ± 0.020 | 0.372 ± 0.048 | |
| p-value † | 0.566 | 0.379 | 0.513 | |
| Irisin (ng/mL) | 60.7 ± 10.2 | 92.6 ± 15.3 | 107.2 ± 12.7 * | 0.041 |
| Women | 74.8 ± 17.8 | 103.1 ± 22.6 | 129.1 ± 51.0 | |
| Men | 55.9 ± 11.2 | 95.2 ± 16.9 | 99.8 ± 41.4 | |
| p-value † | 0.387 | 0.781 | 0.286 | |
| IL-6 (pg/mL) | 10.5 ± 1.1 | 14.4 ± 2.3 | 21.3 ± 4.6 * | 0.041 |
| Women | 13.3 ± 0.8 | 15.4 ± 2.2 | 22.1 ± 4.2 | |
| Men | 6.7 ± 0.6 | 16.1 ± 2.9 | 9.6 ± 1.3 | |
| p-value † | 0.001 | 0.870 | 0.094 | |
| Resolvin D1 (pg/mL) | 157.5 ± 5.4 | 142.8 ± 4.6 | 137.9 ± 4.2 * | 0.011 |
| Women | 154.5 ± 32.6 | 132.7 ± 8.6 | 102.0 ± 26.1 | |
| Men | 157.9 ± 8.5 | 154.0 ± 6.3 | 139.2 ± 14.0 | |
| p-value † | 0.727 | 0.053 | 0.189 | |
| Oxidative Damage | ||||
| MDA (nM) | 1.05 ± 0.09 | 1.95 ± 0.10 * | 2.04 ± 0.11 * | <0.001 |
| Women | 0.94 ± 0.08 | 2.03 ± 0.13 | 1.47 ± 0.10 | |
| Men | 1.32 ± 0.13 | 1.67 ± 0.10 | 2.38 ± 0.30 | |
| p-value † | 0.016 | 0.080 | 0.038 | |
| Protein carbonyl (%) | 30.1 ± 3.4 | 34.1 ± 3.7 | 35.3 ± 3.0 | 0.614 |
| Women | 29.2 ± 4.5 | 38.8 ± 6.1 | 24.7 ± 6.2 | |
| Men | 31.3 ± 3.9 | 30.6 ± 3.0 | 19.8 ± 2.8 | |
| p-value † | 0.742 | 0.219 | 0.410 |
| Biomarkers | IFC = 0 | IFC ≥1 | p-Value |
|---|---|---|---|
| Catalase | 1.00 (ref.) | 1.208 (1.138–1.281) | <0.001 |
| Malondialdehyde | 1.00 (ref.) | 4.013 (3.693–5.320) | <0.001 |
| Cytokeratin 18 | 1.00 (ref.) | 1.030 (1.017–1.044) | <0.001 |
| Superoxide dismutase | 1.00 (ref.) | 1.004 (1.000–1.009) | 0.046 |
| Irisin | 1.00 (ref.) | 1.004 (0.001–0.008) | 0.024 |
| Interleukin-6 | 1.00 (ref.) | 1.037 (1.003–1.071) | 0.031 |
| Xanthine oxidase | 1.00 (ref.) | 0.593 (0.213–3.909) | 0.650 |
| Protein carbonyl | 1.00 (ref.) | 1.007 (0.991–1.024) | 0.401 |
| Myeloperoxidase | 1.00 (ref.) | 0.985 (0.915–1.060) | 0.688 |
| Fibroblast Growth Factor 21 | 1.00 (ref.) | 0.998 (0.985–1.011) | 0.732 |
| 1/Resolvin D1 | 1.00 (ref.) | 1.445 (1.347–1.602) | 0.012 |
© 2020 by the authors. Licensee MDPI, Basel, Switzerland. This article is an open access article distributed under the terms and conditions of the Creative Commons Attribution (CC BY) license (http://creativecommons.org/licenses/by/4.0/).
Share and Cite
Monserrat-Mesquida, M.; Quetglas-Llabrés, M.; Abbate, M.; Montemayor, S.; Mascaró, C.M.; Casares, M.; Tejada, S.; Abete, I.; Zulet, M.A.; Tur, J.A.; et al. Oxidative Stress and Pro-Inflammatory Status in Patients with Non-Alcoholic Fatty Liver Disease. Antioxidants 2020, 9, 759. https://doi.org/10.3390/antiox9080759
Monserrat-Mesquida M, Quetglas-Llabrés M, Abbate M, Montemayor S, Mascaró CM, Casares M, Tejada S, Abete I, Zulet MA, Tur JA, et al. Oxidative Stress and Pro-Inflammatory Status in Patients with Non-Alcoholic Fatty Liver Disease. Antioxidants. 2020; 9(8):759. https://doi.org/10.3390/antiox9080759
Chicago/Turabian StyleMonserrat-Mesquida, Margalida, Magdalena Quetglas-Llabrés, Manuela Abbate, Sofía Montemayor, Catalina M. Mascaró, Miguel Casares, Silvia Tejada, Itziar Abete, Maria Angeles Zulet, Josep A. Tur, and et al. 2020. "Oxidative Stress and Pro-Inflammatory Status in Patients with Non-Alcoholic Fatty Liver Disease" Antioxidants 9, no. 8: 759. https://doi.org/10.3390/antiox9080759