3.2. Milk Powder Colour Analysis
The L* (lightness), a* (green-to-red colour), and b* (blue-to-yellow colour) values were statistically different (
p ≤ 0.001) between the samples (
Table S2). The L* and b* values were significantly (
p ≤ 0.001) higher in FFWMP samples than in SMP and IMF samples regardless of the storage treatments. The a* values were negative across all samples with significantly (
p ≤ 0.001) higher values observed for SMP than FFWMP and IMF samples across all treatments with the highest a* value observed in the SMP stored at 37 °C (–5.83). As expected, significantly (
p ≤ 0.001) higher b* (yellowness) values were observed in FFWMP samples, due to the increased fat content [
27]. Increased b* values (blue-to-yellow colour) in dairy products as observed in the FFWMP powder samples have previously been associated with β-carotene content [
18], which has been linked with dairy products produced from pasture [
28]. The significantly (
p ≤ 0.001) higher a* value (green-to-red colour) observed in SMP samples analysed in this study could be due to the Tyndall effect; the scattering of light as it passes through a colloid. The higher casein content in SMP (2.79% compared with 2.31% and 1.07% for FFWMP and IMF, respectively) scattered more blue light than red. Furthermore, β-carotene is lost when milk is skimmed, removing the source of the yellow colour observed in FFWMP and IMF samples [
29]. The L* (lightness) values were also significantly (
p ≤ 0.001) different between the samples. Several other factors such as the modification of particle size, Maillard reactions forming brownish pigments during heat treatment [
30], storage time, and temperature could all have contributed to the differences in colour.
3.3. Fatty Acid Analysis
Significant differences were observed for 19 of the 27 FA analysed based on sample type (C4:0, C6:0, C10:0, C12:0, C13:0, C14:0, C14:1 c9, C15:0, C16:0, C17:0, C18:1 n9c, C18:2 n6c, C18:2 n6t, C18:3 n3, C20:0, C20:1, C24:1 n9, C20:5, and CLA C18:2 c9t11), as shown in
Table 1.
The FA composition of milk is generally derived from two primary sources,
via uptake of existing FA from the diet (and rumen bio-hydrogenation) or through de novo synthesis [
31]. C4:0-C14:0 and some C16:0 are synthesised de novo by the cow’s mammary gland, which uses acetate and ß-hydroxybutyrate as substrates [
31]. The remaining C16:0 and the long-chain FA originate from dietary lipids and from lipolysis of adipose tissue triacylglycerols [
32]. Bovine diet has been shown to impact the FA profile of milk significantly [
33,
34], and subsequently that of milk powder. The FA with an odd number of carbons such as pentadecanoic acid (C15:0) and heptadecanoic acid (C17:0) are synthesised by microflora in the rumen [
35]. The FA profile of the FFWMP and the IMF varied more than the SMP. Less FA was detected in SMP due to the low fat content. FFWMP contained significantly (
p ≤ 0.05) higher proportions of palmitic acid (C16:0) than the SMP and IMF samples. The IMF sample contained higher proportions of linoleic acid (C18:2 n6c) and α-linolenic acid (C18:3 n3) than the FFWMP, likely due to fortification. The FA C20:2, C20:3 n6, C24:1 n9, and C20:5 were identified only in the IMF sample. Some of these FA are found in fish oils [
36] and vegetable oils [
37,
38], and thus, these were the likely sources in the IMF sample and were added during processing. The probable FA sources for the 13 compounds of interest are outlined in
Table 2.
3.5. Sensory Evaluation
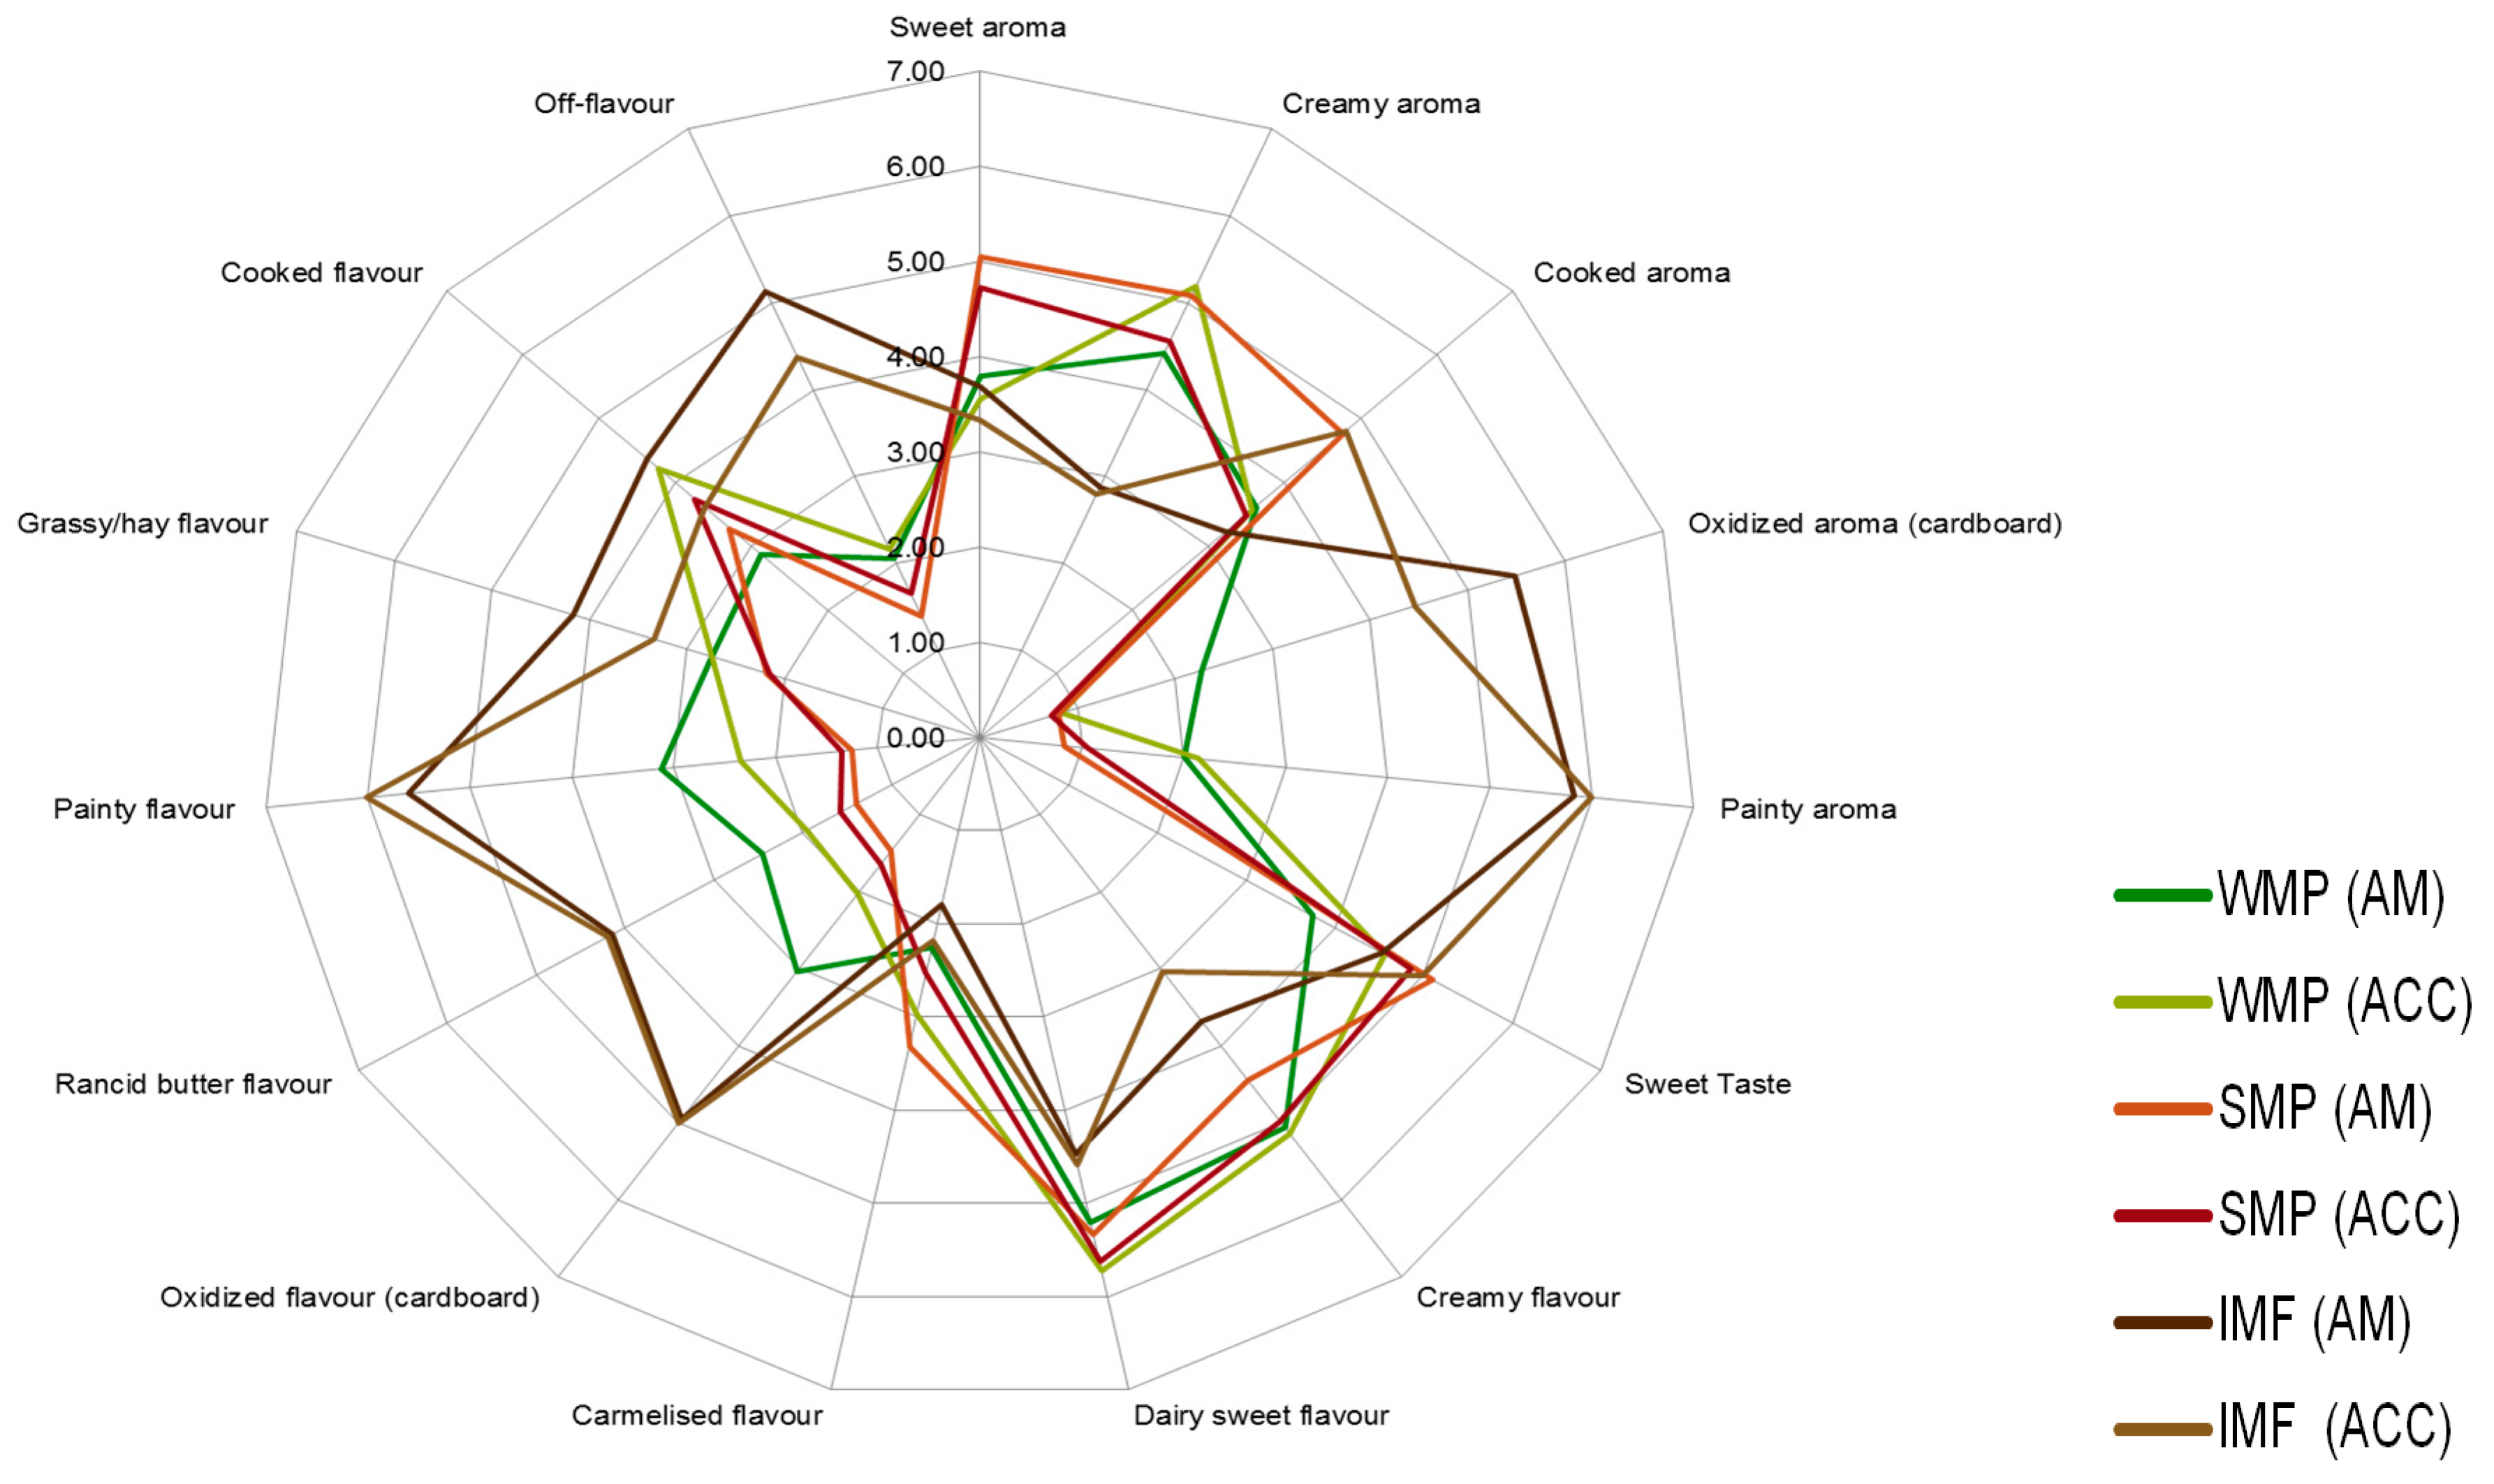
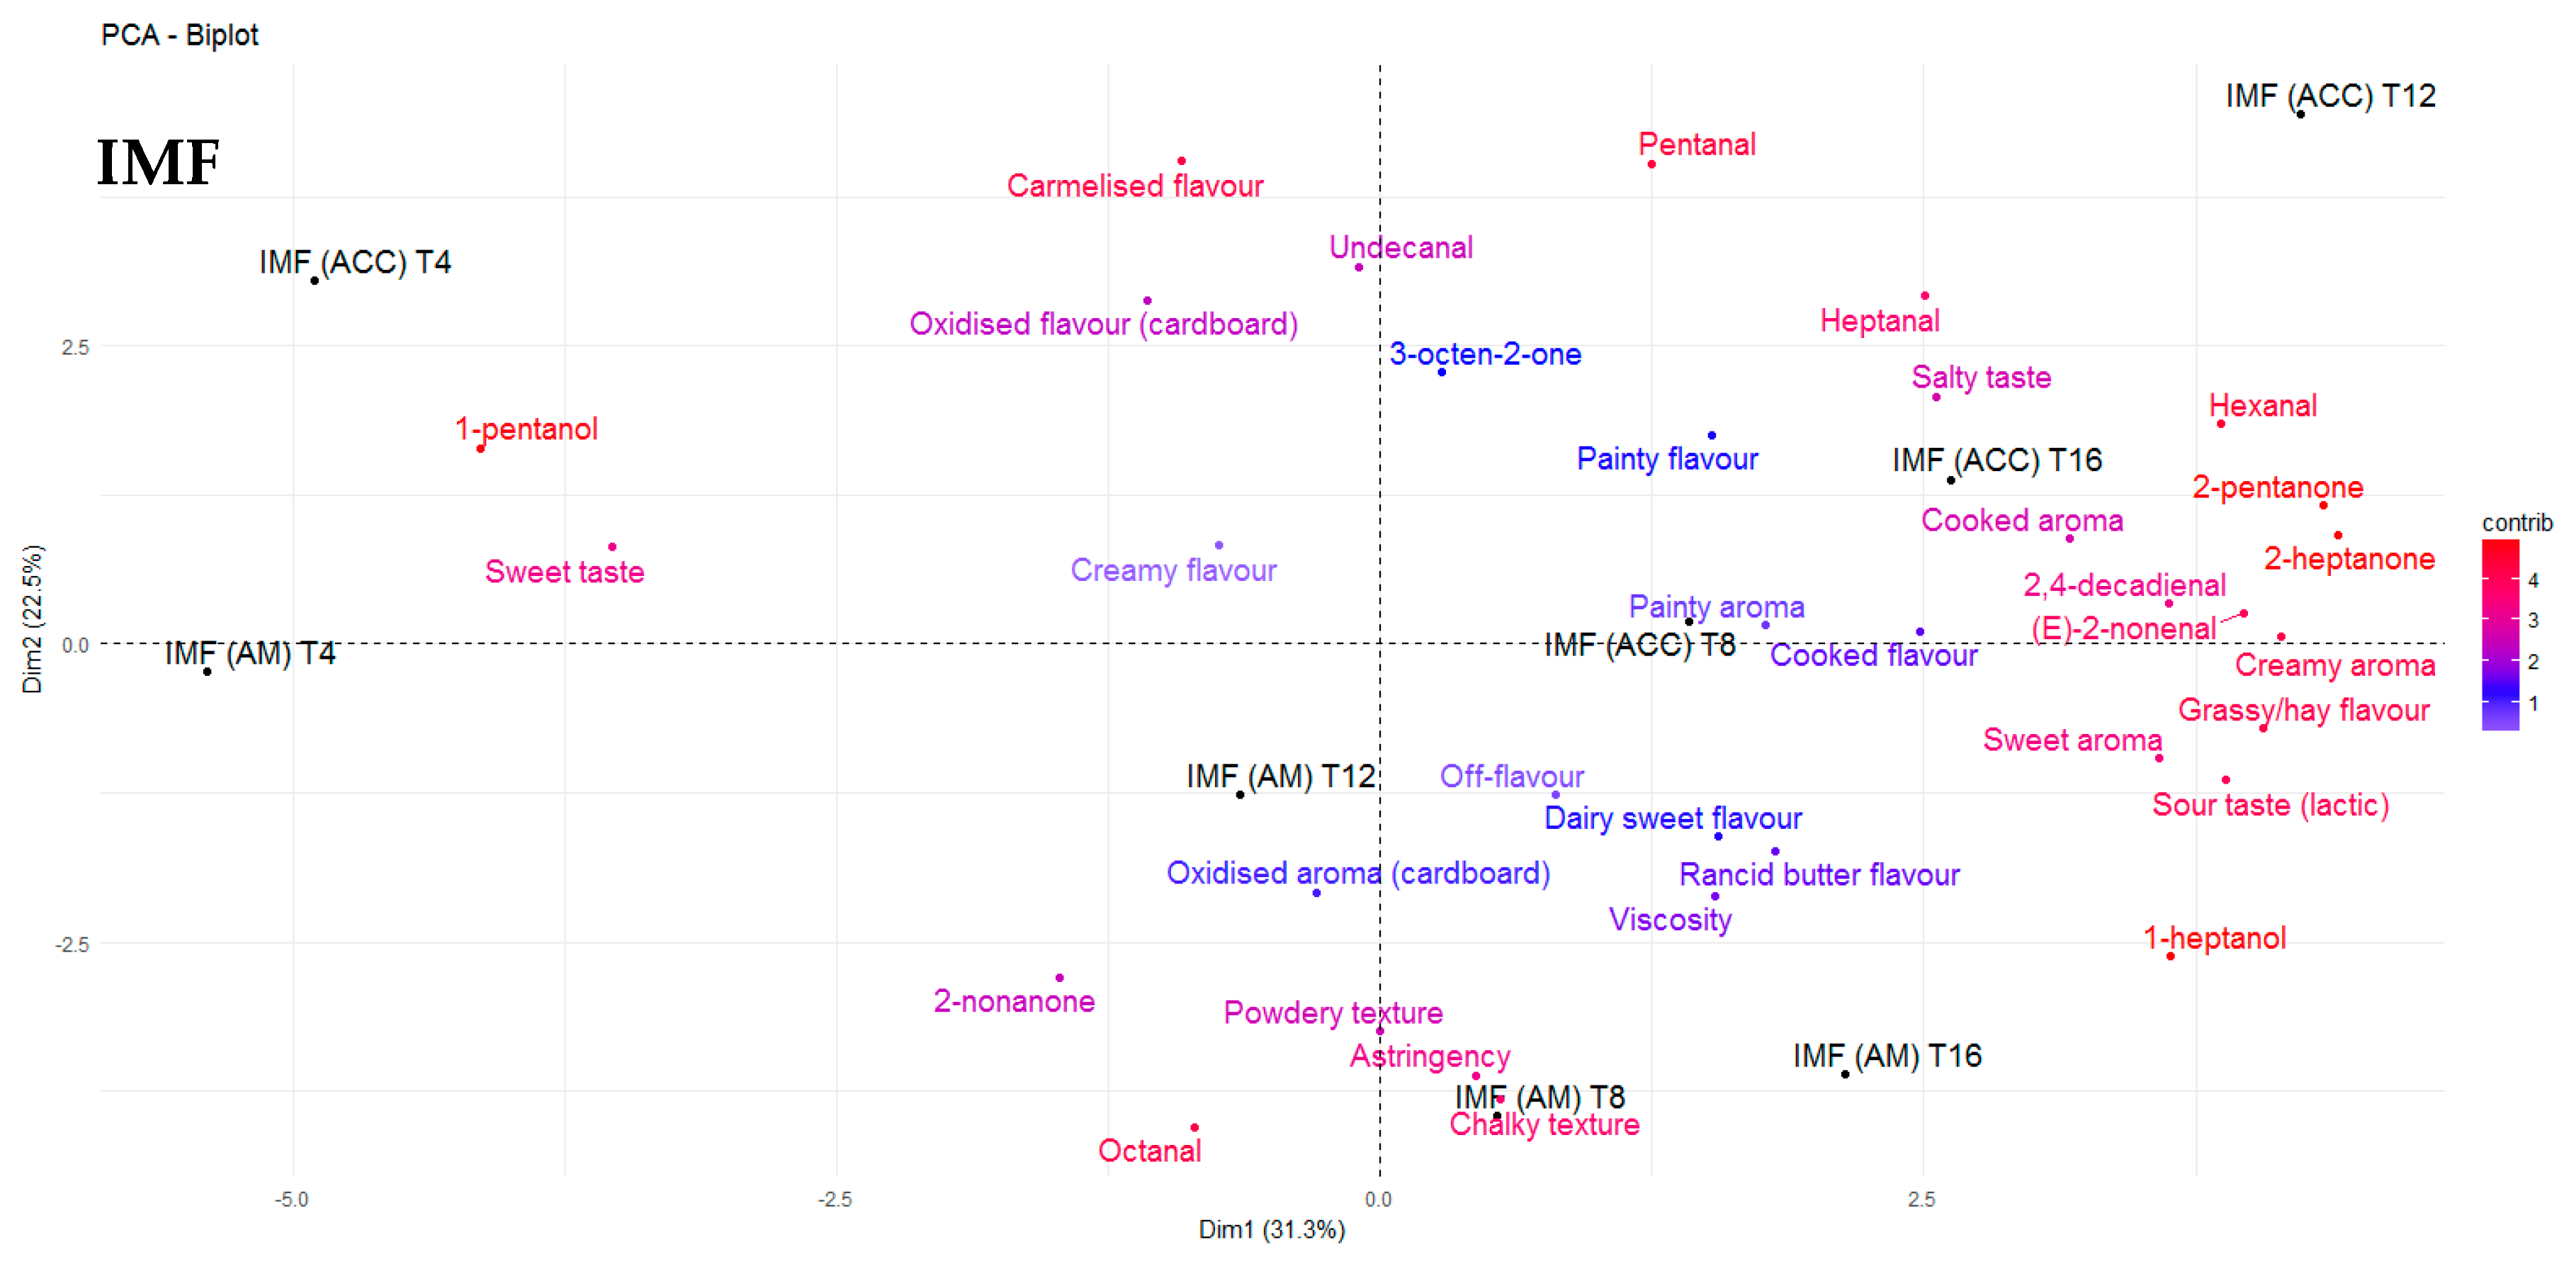
No significant differences were observed between the FFWMP or SMP samples for hedonic assessment over the storage period. Significant differences were found between “liking of flavour” and “overall acceptability” for the IMF samples. The IMF samples scored lowest for “overall acceptability” across all time points and storage treatments. At T4, significant differences were observed between the FFWMP, SMP, and IMF samples for “liking of appearance”, “liking of aroma”, “liking of flavour”, “overall acceptability”, “colour”, “creamy aroma”, “oxidised aroma”, “painty aroma”, “powdery texture”, “oxidised flavour”, and “off-flavour”. Again, at T8, differences between the samples were observed for “liking of appearance”, “liking of aroma”, “liking of flavour”, and “overall acceptability”, with IMF samples scoring the lowest for “liking of aroma”, “liking of flavour”, and “overall acceptability” and highest for “liking of appearance”. SMP samples scored highest for “liking of aroma”, “liking of flavour”, and “overall acceptability”. In the RDA, differences were again observed for “oxidised aroma”, “painty aroma”, “powdery texture”, and “off-flavour” in addition to “rancid butter flavour” and “painty flavour”, all of which were more correlated with IMF samples except for “powdery texture”, which was more correlated with FFWMP samples. Finally, at T16, significant differences were observed for “creamy aroma”, “oxidised aroma”, “painty aroma”, “painty flavour”, and “off-flavour” (
Figure 1). This study demonstrated the ability of panellists to identify and rate the intensity of “painty” and “oxidised” attributes in powders with high levels of LO volatiles. When the samples were compared based on treatment type, fewer differences were observed, suggesting the differences were based on sample type regardless of the storage conditions.
The odour threshold of many volatile compounds is greater in oil and fat matrices when compared with water and air, generally due to the complexity of the matrix and possible matrix binding [
44]. In the present study, FFWMP samples contained hexanal at 380 ppm and pentanal at 56 ppm, but remained acceptable to the sensory panellists. Decker et al. [
40] reported an odour threshold (ppm) in oil of 320, 240, 55, and 10 for hexanal, pentanal, octanal, and 2,4–decadienal, respectively. The increased levels of numerous compounds above their odour thresholds in IMF samples compared to FFWMP and SMP samples was likely responsible for the unacceptable scores of panellists for these IMF samples. Additionally, certain compounds such as (E)-2-octenal (linoleic acid degradation), (Z)-2-heptenal (linoleic acid degradation), (E)-2-hexenal (linolenic acid degradation), 2,4-heptadienal (linolenic acid degradation), 4-pentenal, and (E,E)- 3,5-octadien-2-one (arachidonic and linoleic acid degradation) were identified only in IMF samples. 2,4–Decadienal, an oxidation product of linoleic acid, has been described as having a “frying” or “fried” odour and is reported to have a pleasant association with high quality fried foods, and it is only when the concentrations are excessive that a product becomes unacceptable to the consumer [
40], as the odour changes to a more rancid off-note. 2,4-Decadienal was found to be correlated with “rancid butter flavour” in FFWMP samples from T8 to T16, where the concentrations ranged from 15–61 ppm. However, 2,4–decadienal was also found to be correlated with “painty aroma” and “painty flavour”. Karahadian and Lindsay [
45] reported that 2,4–decadienal can cause “painty flavours” in fish oils, and this may also apply for dairy powders once the concentrations reach a certain level. Furthermore, similar volatiles could have the same descriptors in different products. For example, 2,4-decadienal and undecanal could both be descriptors of “oxidised flavour” in FFWMP and IMF, respectively. 3-Octen-2-one was again highest in IMF samples followed by FFWMP and SMP samples. PCA analysis showed that 3-octen-2-one was correlated with “caramelised flavour” and “sweet taste” in FFWMP and “oxidised flavour” and “painty flavour” in IMF. Overall, relative humidity did not significantly affect the levels of any LO volatile compound as samples stored at HUM were comparable to those stored at AM. Most differences were observed between samples stored at AM and ACC; thus, for clarity, we only focussed on AM and ACC samples in
Figure 2,
Figure 3,
Figure 4 and
Figure 5.
Many significant differences were observed for the hedonic and RDA scores, particularly between SMP and IMF samples, but also within SMP and IMF samples stored in different conditions at different time points. FFWMP remained stable and acceptable throughout the 16 week storage period despite increases in LO volatile compounds. This suggested that although these compounds were present at levels above their odour thresholds, and thus potentially perceivable, they did not adversely impact sensory perception, presumably because they were not concentrated enough in the FFWMP matrix. SMP samples remained acceptable throughout storage, also scoring highest for “overall acceptability” across the storage treatments. The IMF samples were found to be unacceptable at each time point.
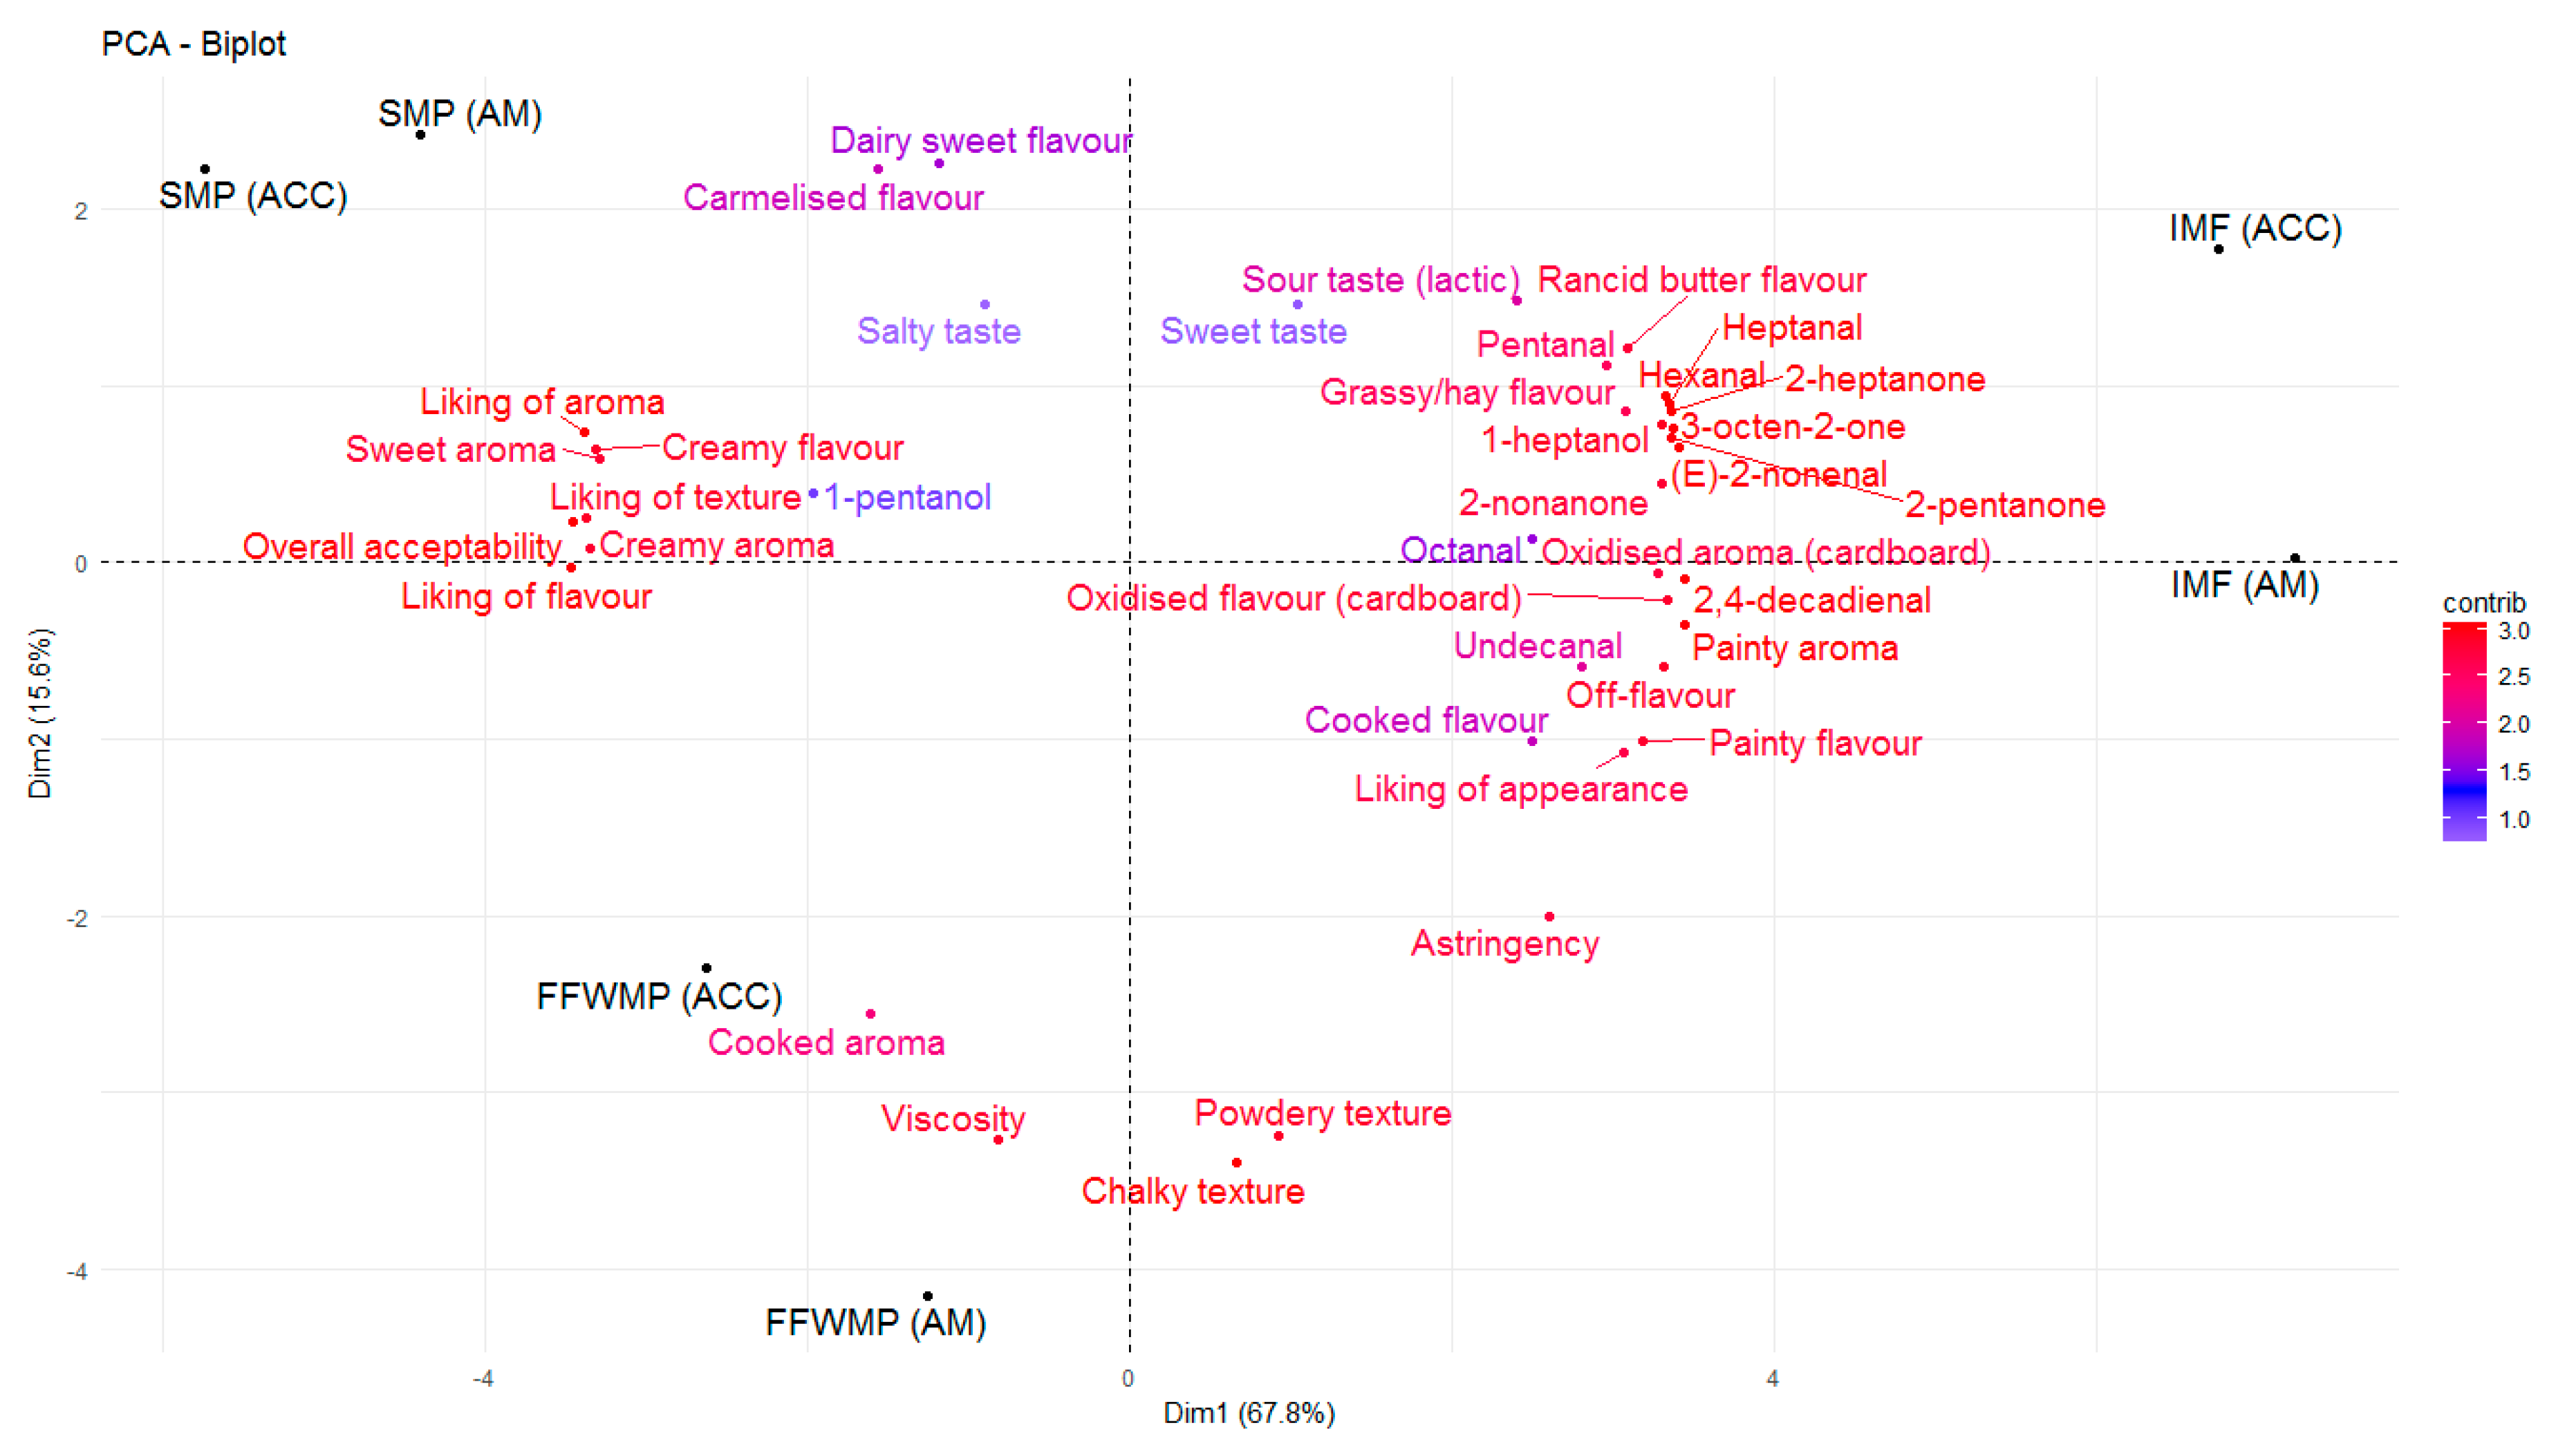
Levels of the oxidation products hexanal, pentanal, and heptanal were present at 5986, 1209, and 861 ppm, respectively in IMF samples at T0 with significant increases over storage. As previously mentioned, the level of sensory acceptability for IMF samples remained the same from T4 to T16, which suggested that once LO products reached certain levels above their odour thresholds, panellists deemed the product as “unsatisfactory”. Many of the descriptors commonly used to describe off-flavours associated with LO in dairy products were most correlated with IMF samples (
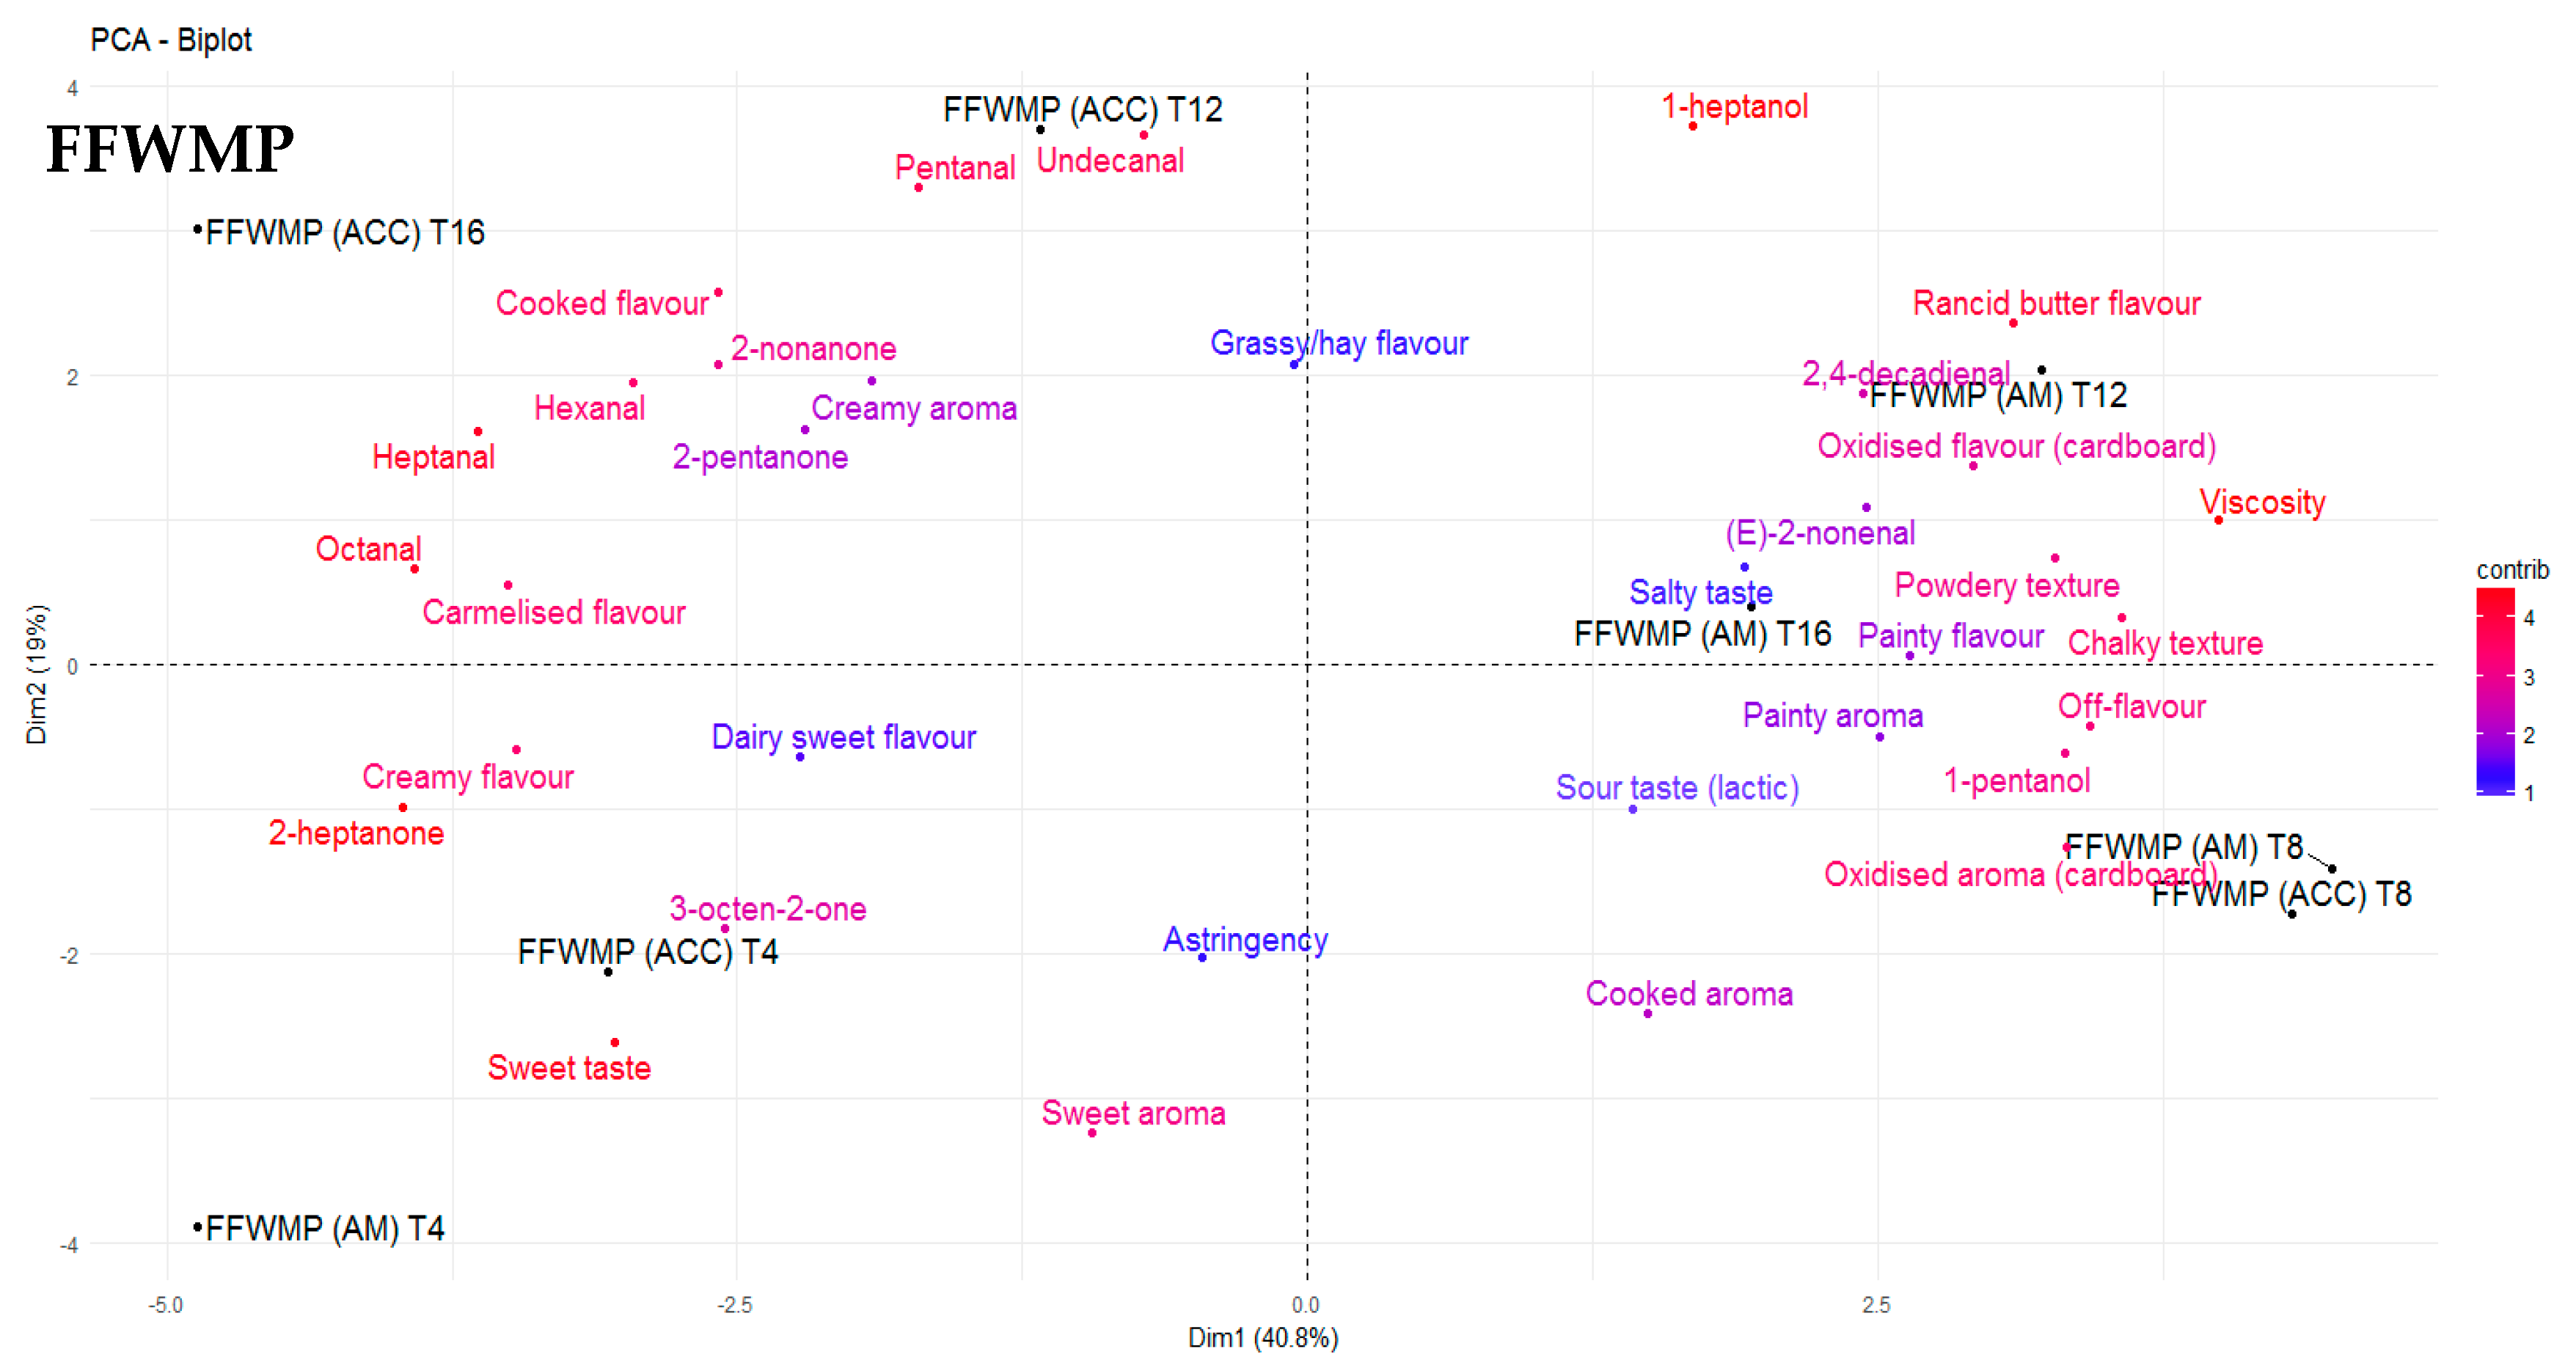
Figure 2). Correlations between sensory data and volatile profiles for FFWMP, SMP, and IMF are displayed in
Figure 3,
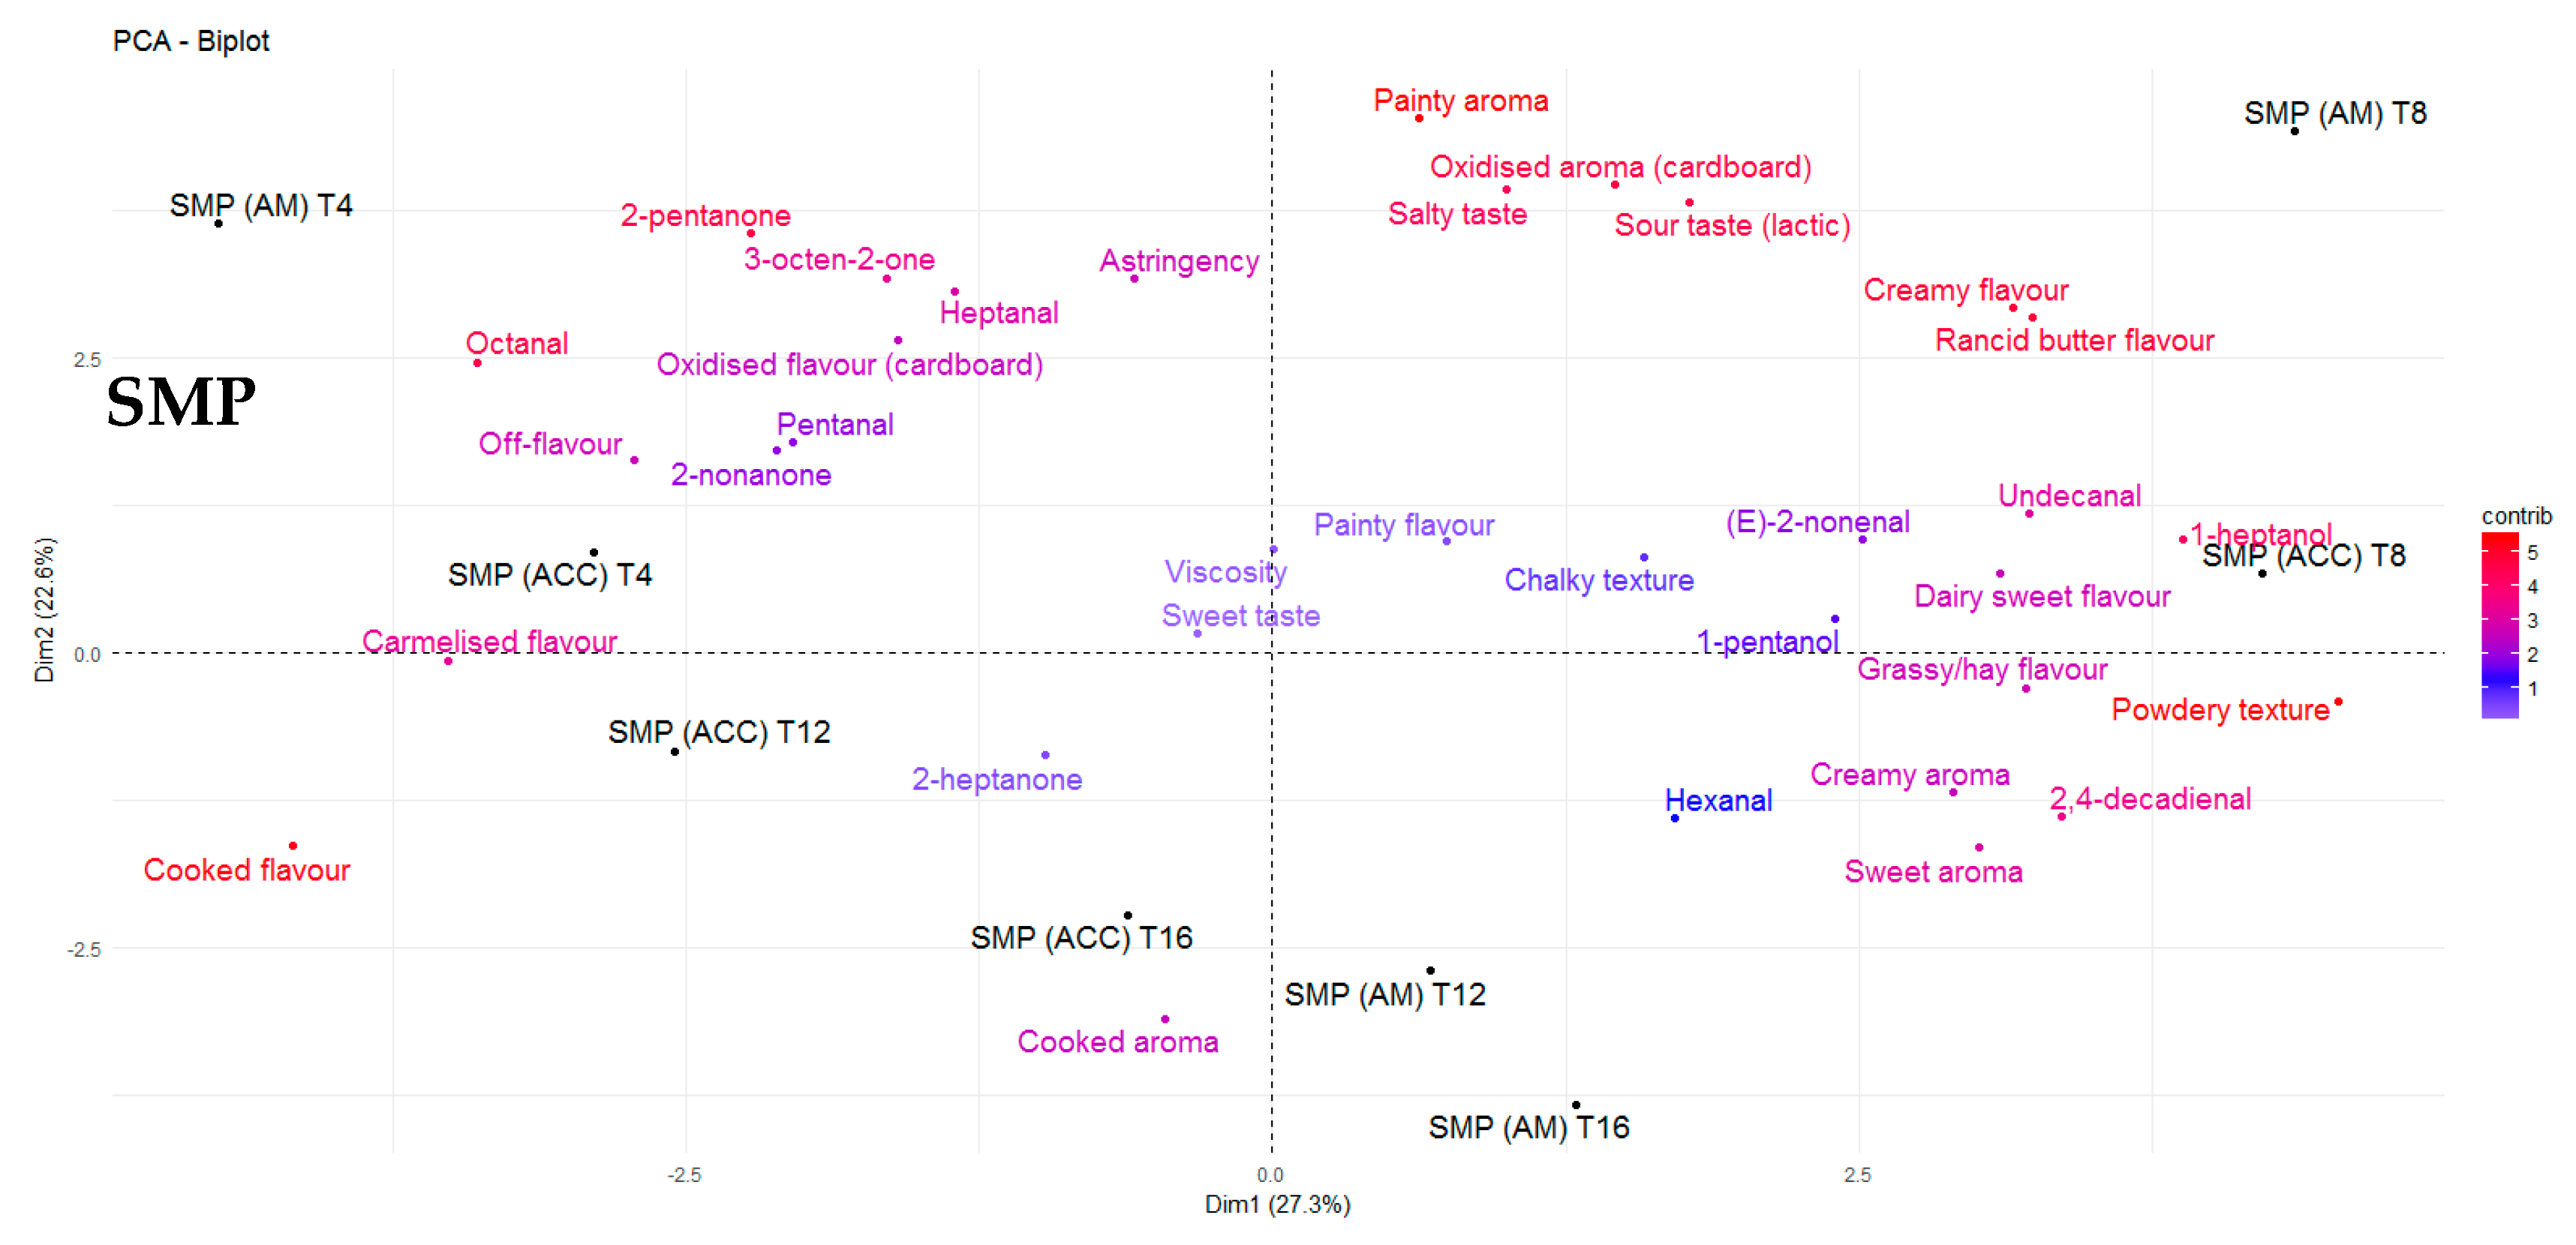
Figure 4 and
Figure 5, respectively. “Painty”, “oxidised”, “rancid butter”, and “off-flavours” were most correlated with the IMF samples at T12 and T16, corresponding with increases in hexanal, heptanal, and pentanal (
Figure 5).
The ability of the sensory panel to perceive differences in many sensory attributes in SMP was unexpected as it is typically less susceptible to LO due to its low-fat content. However, the lipid phase of WMP and other high-fat dairy powders could act as a solvent for LO compounds [
46]; thus, the lack of fat in SMP could mean that any oxidation products were more readily released and therefore were more easily perceived. It is difficult to compare the sensory perception of IMF to that of FFWMP and SMP for a number of reasons: (i) the differences in manufacturing processes and the addition of PUFA to IMF samples; (ii) the adult panellists employed in the study were not familiar with the consumption of IMF; and (iii) it was impossible to gather information from the proposed consumers of IMF (infants and babies) on sensory perception. However, it is not unusual to see higher levels of LO products in IMF when compared to conventional milk powders. Cesa et al. [
12] reported the levels of malondialdehyde (MDA), a common indicator of the LO process, up to five times higher in IMF compared to bovine milk samples. Furthermore, Jia et al. [
13] conducted an accelerated stability study on milk based IMF stored at 42 and 50 °C for 90 days. Results demonstrated little change in the FA profile of the IMF during storage except for docosahexaenoic acid (C22:0). However, differences in the volatile profiles were observed, and an unpleasant “oxidised flavour” was observed in IMF samples stored at 50 °C. Samples stored at 50 °C were found to have increased peroxide values and decreased headspace oxygen after 90 days of storage. As little or no changes in the FA profile were evident, it suggested that the susceptibility of IMF to LO depended mainly on the FA composition directly after manufacture and subsequently on the rate at which the FA oxidised.
Correlation relationships were observed between volatile compounds and sensory perception and between the concentrations of individual LO volatile compounds. The main correlation relationships observed in FFWMP samples are outlined in
Table 4. Furthermore, “sweet taste” decreased as “rancid butter flavour” increased in the AM FFWMP samples throughout storage. Less correlation was evident in SMP samples; however, “cooked flavour” was negatively correlated with undecanal (–0.83). In the IMF samples, “grassy/hay flavour” was positively correlated with 1-heptanol (
r = 0.74) and 1-pentanol (
r = 0.74), and “off-flavours” were positively correlated with (E)-2-nonenal. “Overall acceptance” was negatively correlated with “oxidised aroma” (–0.53) in IMF samples, and there was no correlation between “overall acceptability” and sensory attributes in the FFWMP and SMP samples. Lloyd et al. [
6] reported similar correlations for hexanal and heptanal and “painty flavour” and “grassy flavours” in WMP. That study [
6] concluded that the optimum shelf-life of WMP was approximately 12 weeks from a sensory standpoint.
In the present study, freshly opened WMP and SMP remained acceptable to the sensory panel for the whole 16 weeks of storage despite levels of primary oxidation products being present above their odour thresholds. Storing samples in ACC versus AM accelerated the formation of LO compounds, which contradicted the results of Cesa et al. [
12], which stated that 40 °C was too low a temperature to perform accelerated oxidation studies and that the levels of MDA in samples stored at 40 °C were comparable to those stored at 20 °C after 12 weeks of storage. The study by Cesa et al. [
12] recommended a temperature of 55 °C for performing acceleration studies. However, in the present study, differences in the volatile profiles were evident in FFWMP and SMP samples stored in AM and ACC. MDA quantification also had limitations [
47,
48], as other compounds could interfere with the assay and also that it was specific for only one LO chemical class. Therefore, accurate quantification of LO volatile compounds by HS-SPME GCMS as preformed in this study is a much more reliable indicator of powder quality.
3.6. Range of Lipid Oxidation in Six Retail Infant Milk Formula Products
The amount of total fat as outlined by the manufacturers did not vary significantly between the IMF retail brands (
Table 5); however, the FA profile, including the levels of PUFA, did (
Table S3).
The levels of the aldehydes hexanal, pentanal, heptanal, and octanal were significantly (
p ≤ 0.001) higher in Brand 1 compared to the other four brands of IMF powdered samples (Brand 2–5); the same was observed for the alcohol compounds 1-heptanol and 1-pentanol.
Trans-2-nonenal and 2,4–decadienal were significantly higher in Brands 3, 4, and 5 when compared to Brands 1 and 2. 2-Heptanone was significantly higher in Brand 2 compared with Brands 1, 3, 4, and 5. Levels of undecanal, 2-nonanone, 2-pentanone, and 3-octen-2-one did not vary significantly between the samples (
Table 6). The ultra-heat treated (UHT) ready-made IMF (Brand 6) contained increased levels of pentanal, hexanal, heptanal, and 2-heptanone present at 4549, 317, 269, and 174 ppm, respectively. The other nine LO compounds of interest (octanal, undecanal, (E)-2-nonenal, 2,4-decadienal, 2-penanone, 2-nonanone, 3-octen-2-one, 1-heptanol, 1-pentanol) were not detected. A total of 25 FA were quantified in the IMF samples, 20 of which varied significantly.
Brand 5 contained the highest percentage of palmitic acid (C16:0) (24.36 ± 1.72) and oleic acid (C18:1) n9c (30.36 ± 1.52). Brands 2, 3, and 4 contained significantly higher proportions of lauric acid (C12:0) compared to Brands 1 and 5. The total FA contents of IMF Brands 1–5 are shown in
Table S3.
The increased concentrations of certain volatile compounds observed in the six retail IMF samples likely related to the significant differences in FA profile. The FA potentially originating from the addition of fish and vegetable oils (C20:2, C20:3 n6, C24:1 n9, and C20:5) were likely some of the main contributors to the observed oxidative state of the IMF powders. The significantly higher levels of primary aldehyde and secondary alcohol compounds in Brand 1 compared to the other brands indicated issues in relation to the fat component of this product, which resulted in more LO products present immediately after manufacture. The level of long-chain PUFA was slightly higher in Brand 1, however unlikely to be responsible for the significantly higher levels of short- and medium-chain aldehydes. The compounds (E,E)–2,4-heptadienal, (E,E)–2,4-nonadienal (derived from linolenic and linoleic acid degradation), and 2-pentylfuran (derived from linoleic acid degradation) were only identified in Brand 1. These compounds have been shown to be high-impact flavour compounds in edible oils with relative odour activity values ≥ 1 [
49]. Compounds with relative odour activity values ≥ 1 significantly contribute to aroma and are considered key volatile components. Brand 6, the UHT ready-made IMF, contained less oxidation compounds than the powdered products (Brands 1–5). UHT is used in the dairy industry as a means of preparing milk for long-term storage without the need for refrigeration. Ajmal et al. [
50] found that the level of short-, medium-, and long-chain FA decreased in UHT milk compared to raw milk, and the FA profile of UHT milk remained stable during 30 days of storage. However, studies have reported Maillard reaction products present in milk post UHT processing [
51], and “sulphury flavours” in milk have also been reported as a result of UHT processing [
52]. Dimethyl disulfide and dimethyl trisulfide were also identified in Brand 6 in this study.
The antioxidant capacity of dairy powders is mainly determined by the levels of sulphur containing amino acids such as cysteine, but also levels of phosphate, carotenoids, zinc, selenium, and vitamins A and E [
53]. Depending on their concentration and polarity, the natural occurrence of these antioxidants in milk, as well as supplementation during processing play a role in the rate at which LO progresses. Antioxidants work by scavenging free radicals and donating hydrogen, potentially slowing the LO cascade mechanism [
54]. However, the levels of antioxidants were comparable across all brands of IMF, which provided further evidence that processing conditions were the main factor behind the rate of LO observed, especially evident for Brand 1. IMF is generally produced by wet mixing, dry blending, or a combination of both [
55]. Studies have shown that the oxidative stability of IMF is influenced by the quality of the blended emulsion prior to spray drying and that un-homogenised emulsions can result in higher levels of free fat in the final product [
56]. In addition to antioxidant addition, encapsulation of PUFA has been employed as a secondary approach to protect them against oxidation in IMF [
57]. Some of the materials available for carriers of PUFA and other lipids are plant polysaccharides, proteins, and peptides [
58]. The quality and source of the milk from which the IMF is produced is also likely to impact the LO susceptibility of the final product as bovine diet has also been proven to impact the milk’s FA profile [
33,
34].


