Hydroxycinnamyl Derived BODIPY as a Lipophilic Fluorescence Probe for Peroxyl Radicals


Abstract
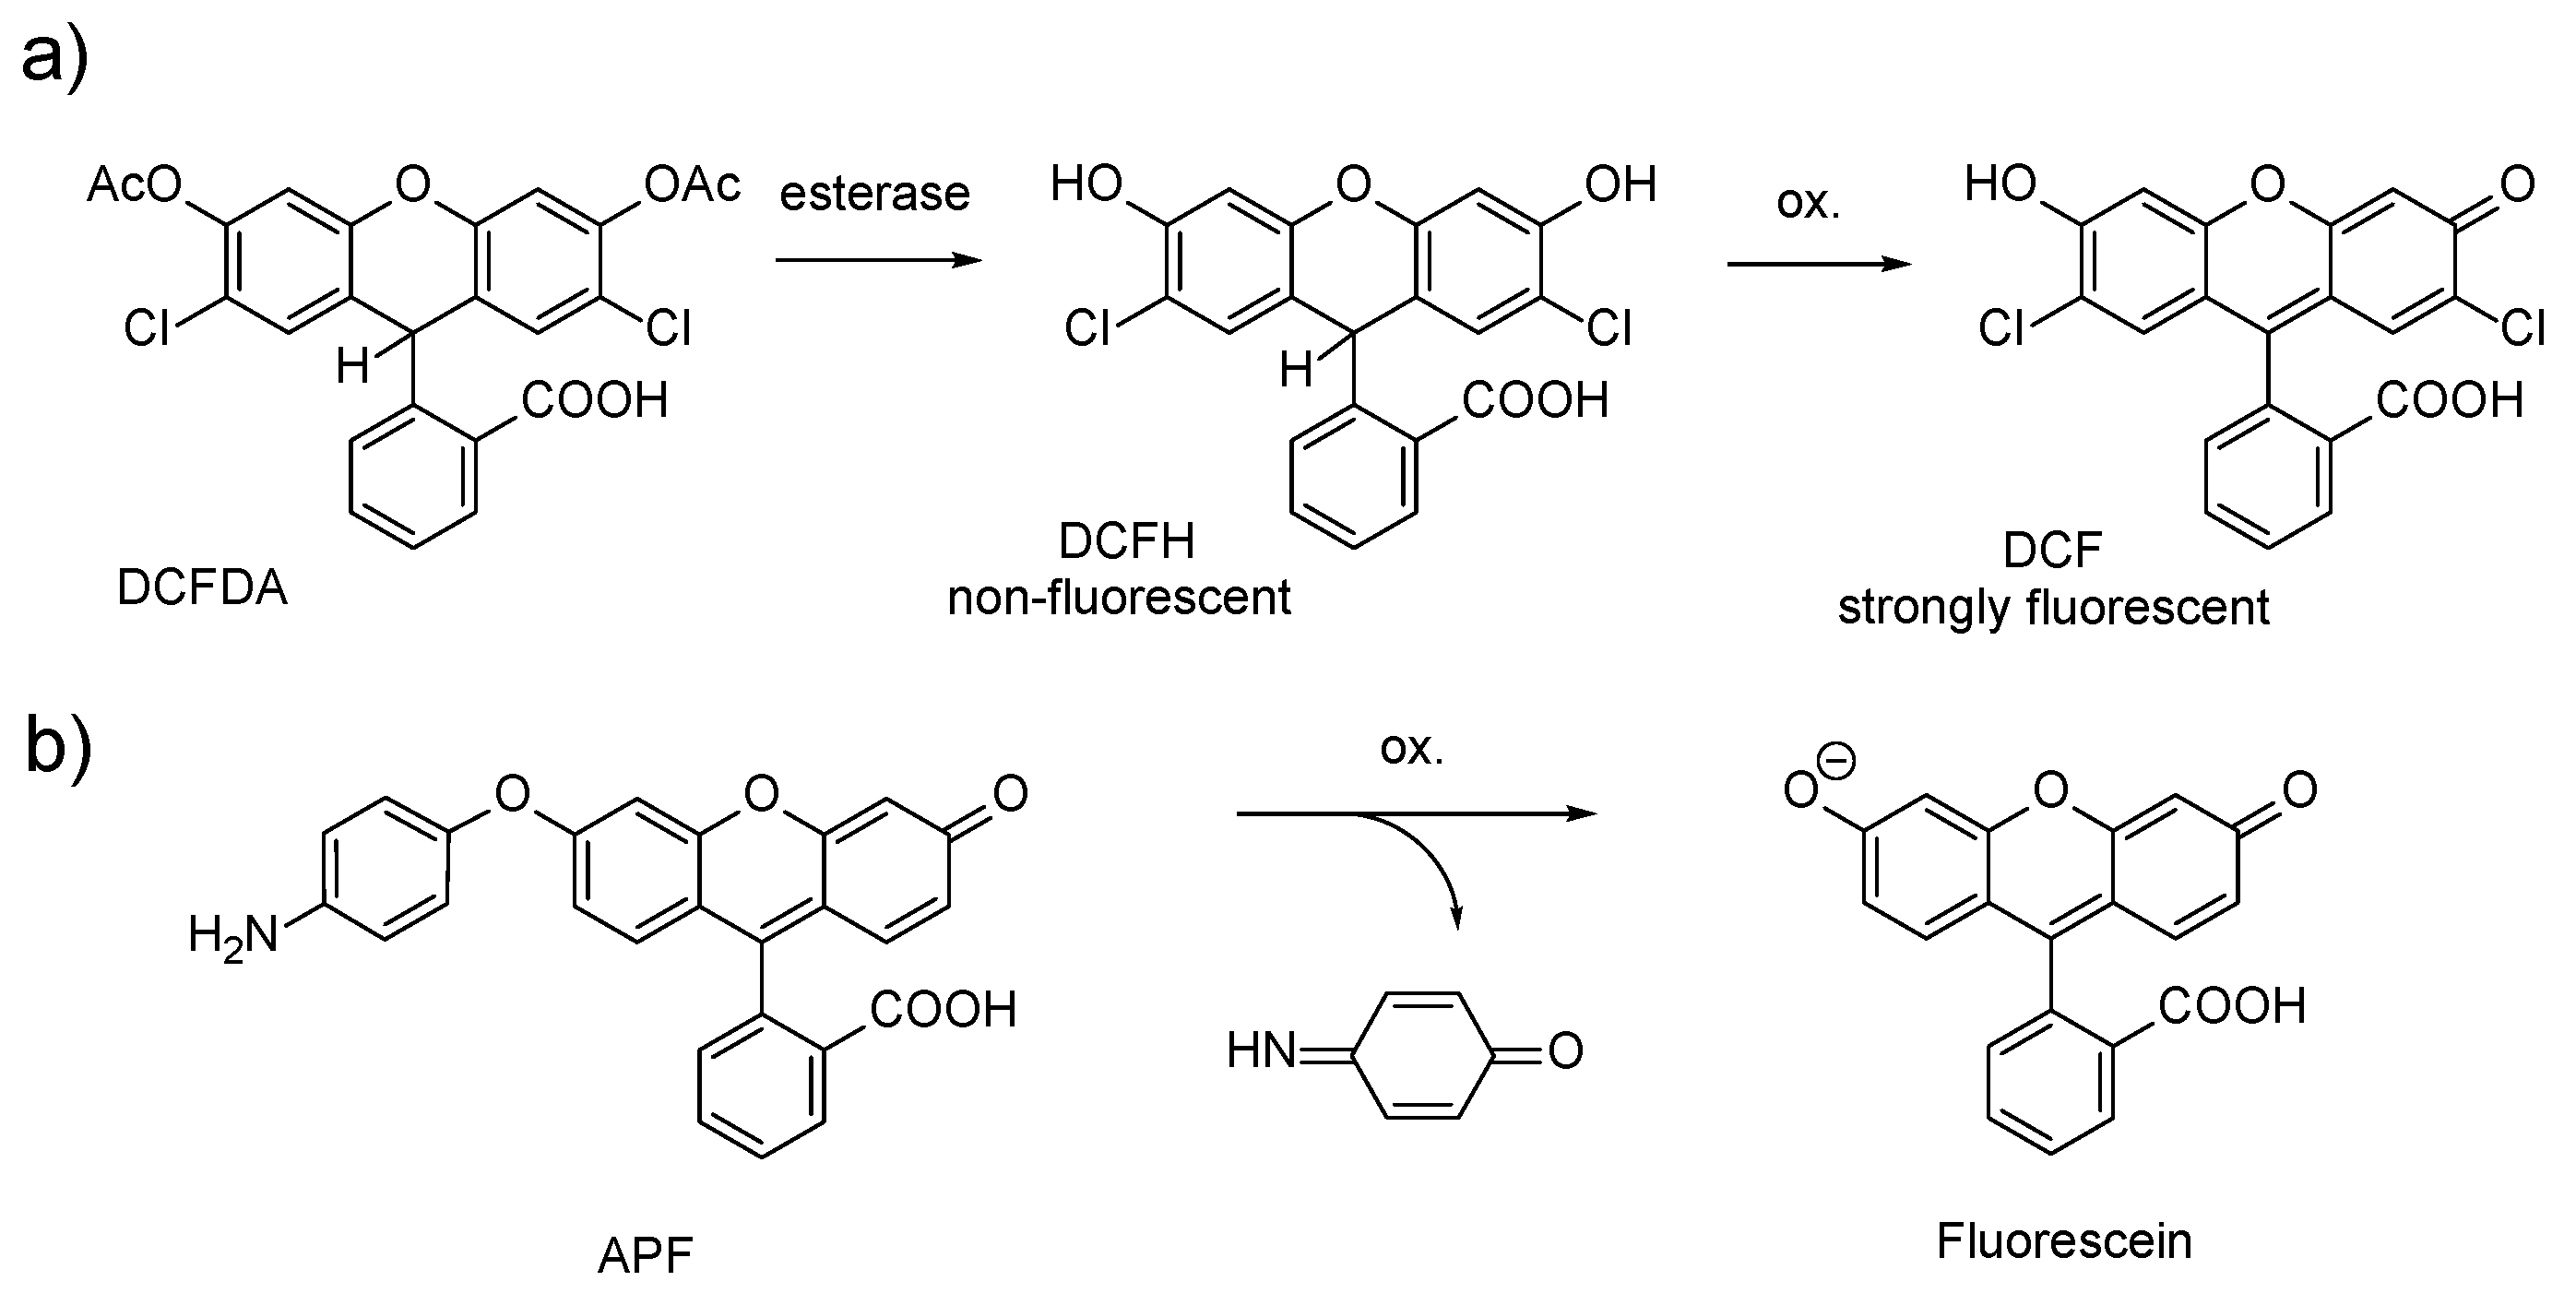
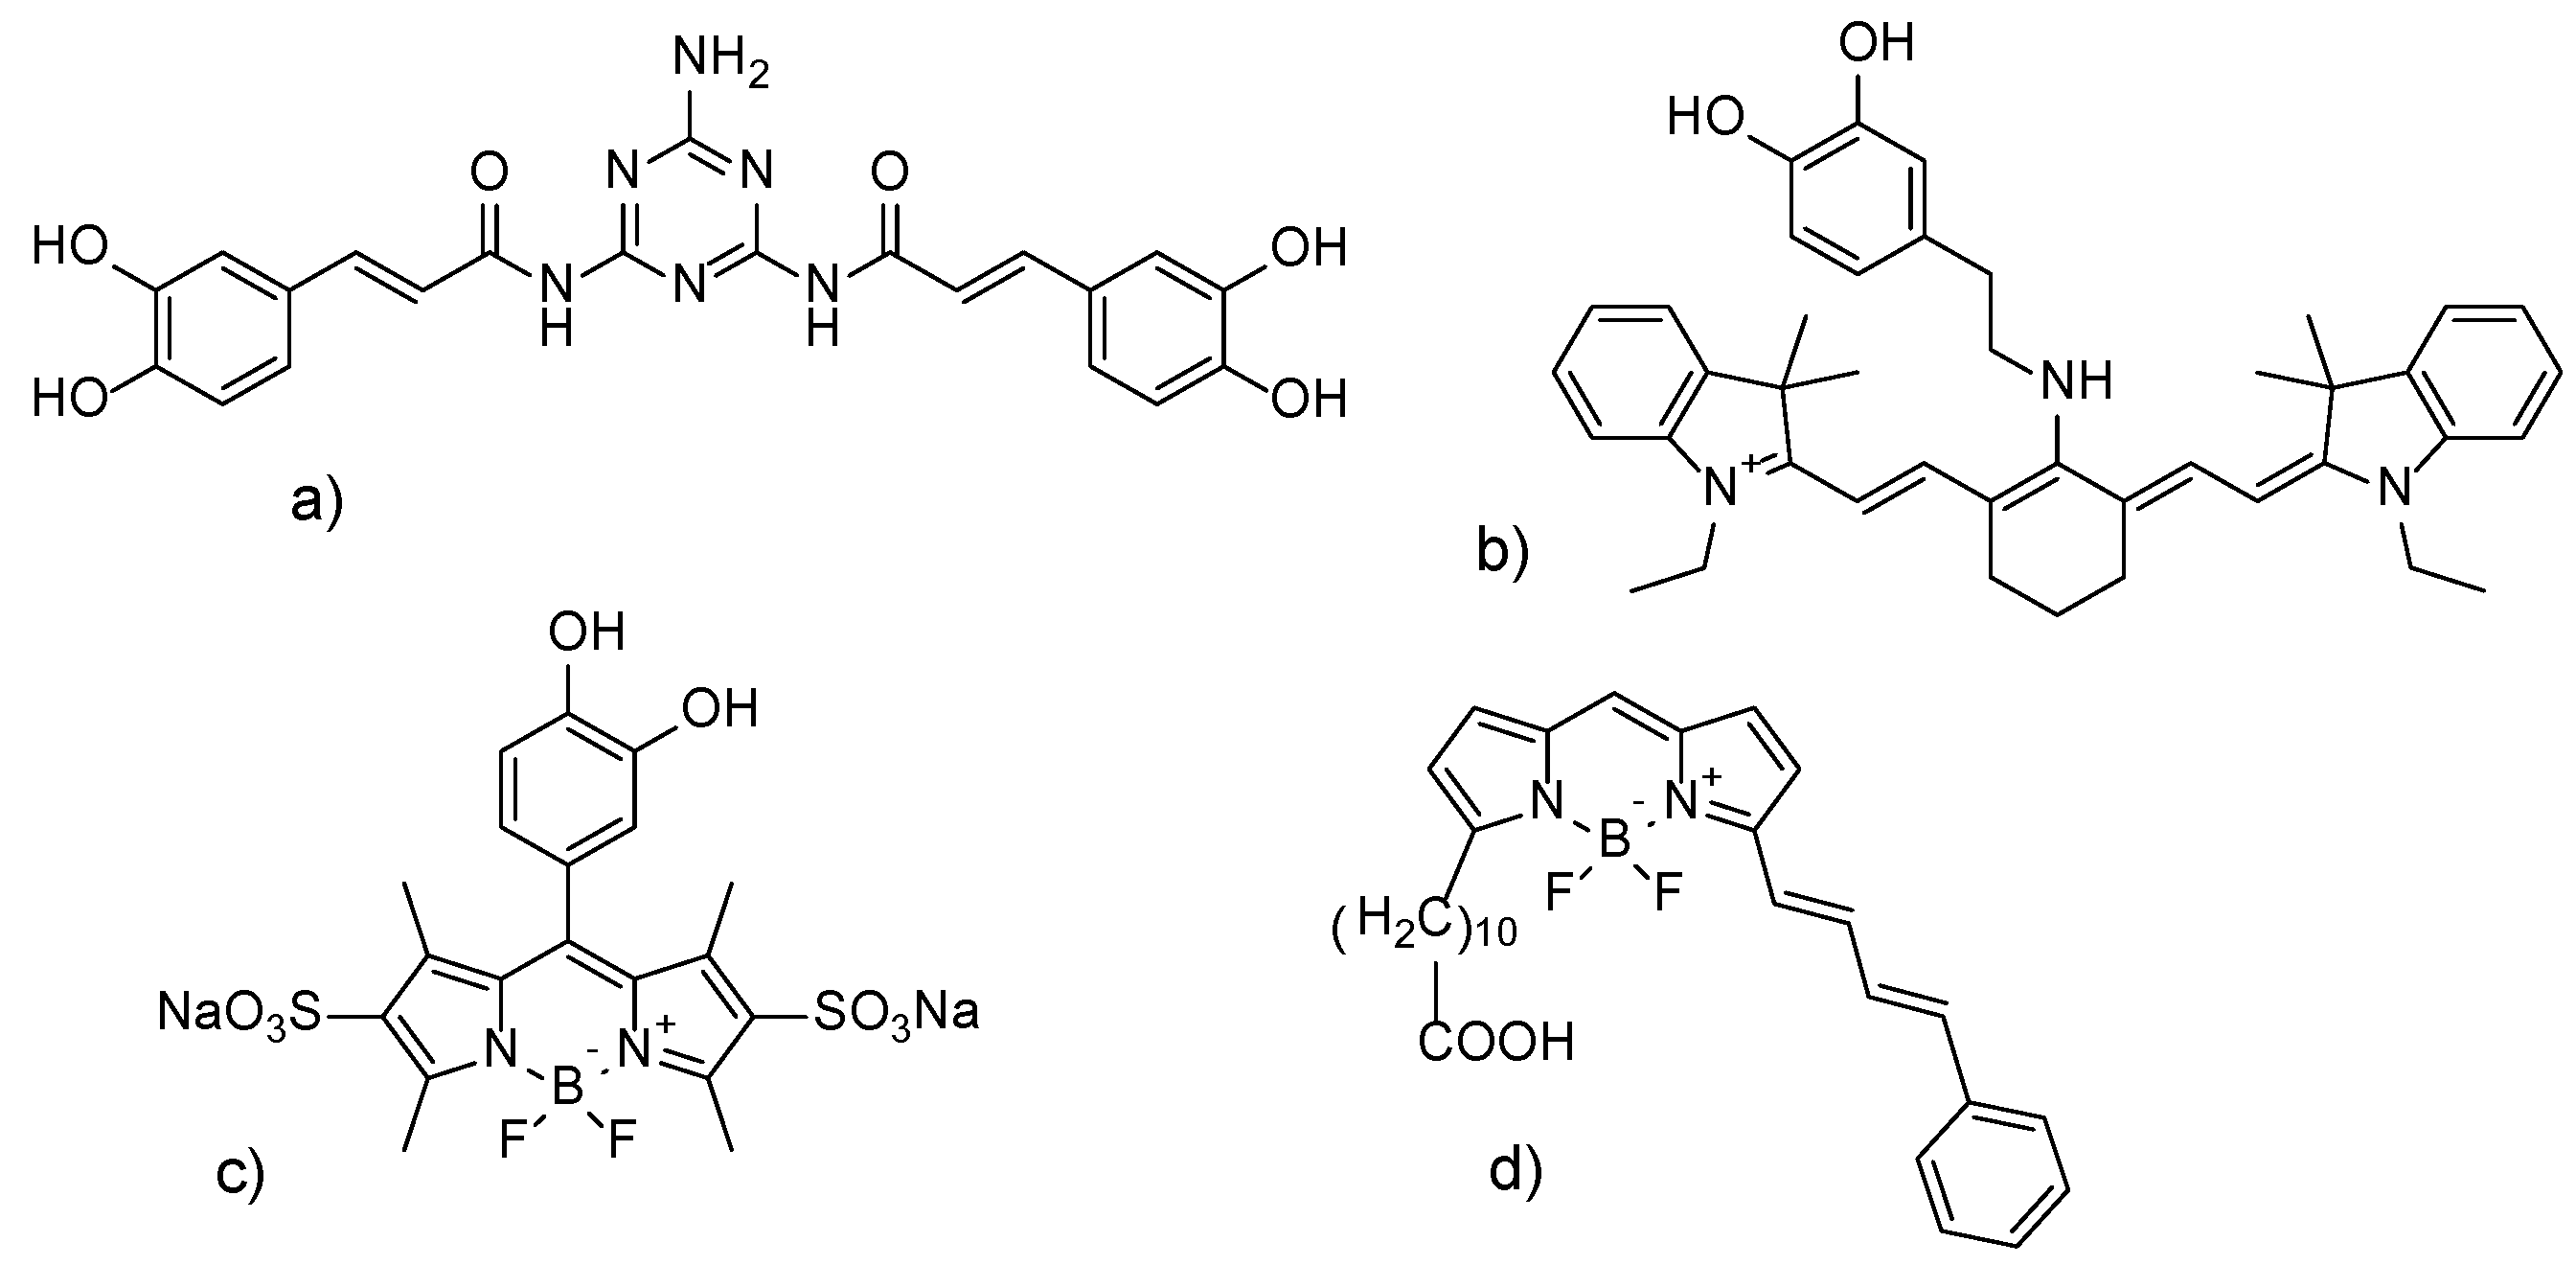
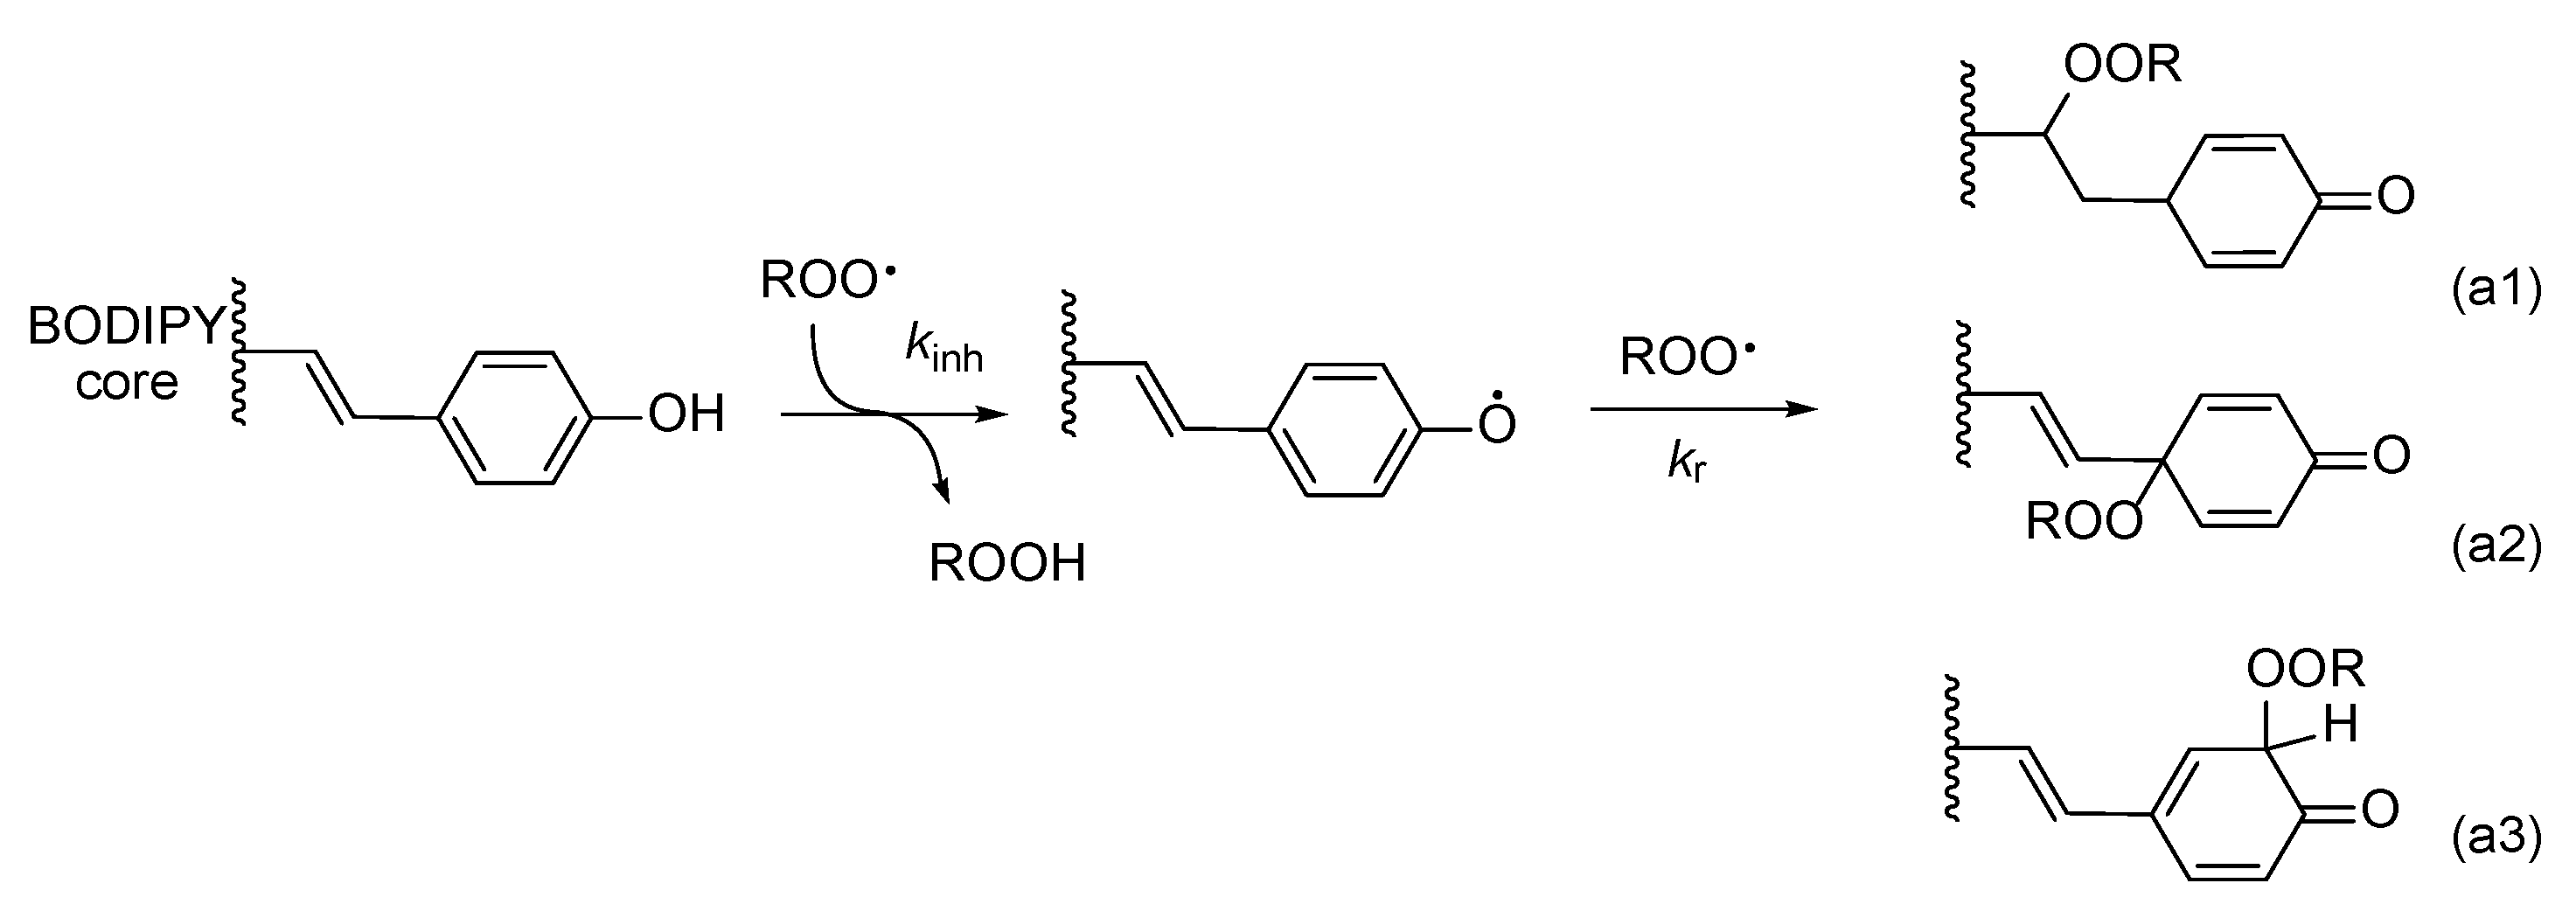
:1. Introduction
2. Materials and Methods
2.1. Chemicals and Reagents
2.2. General Information
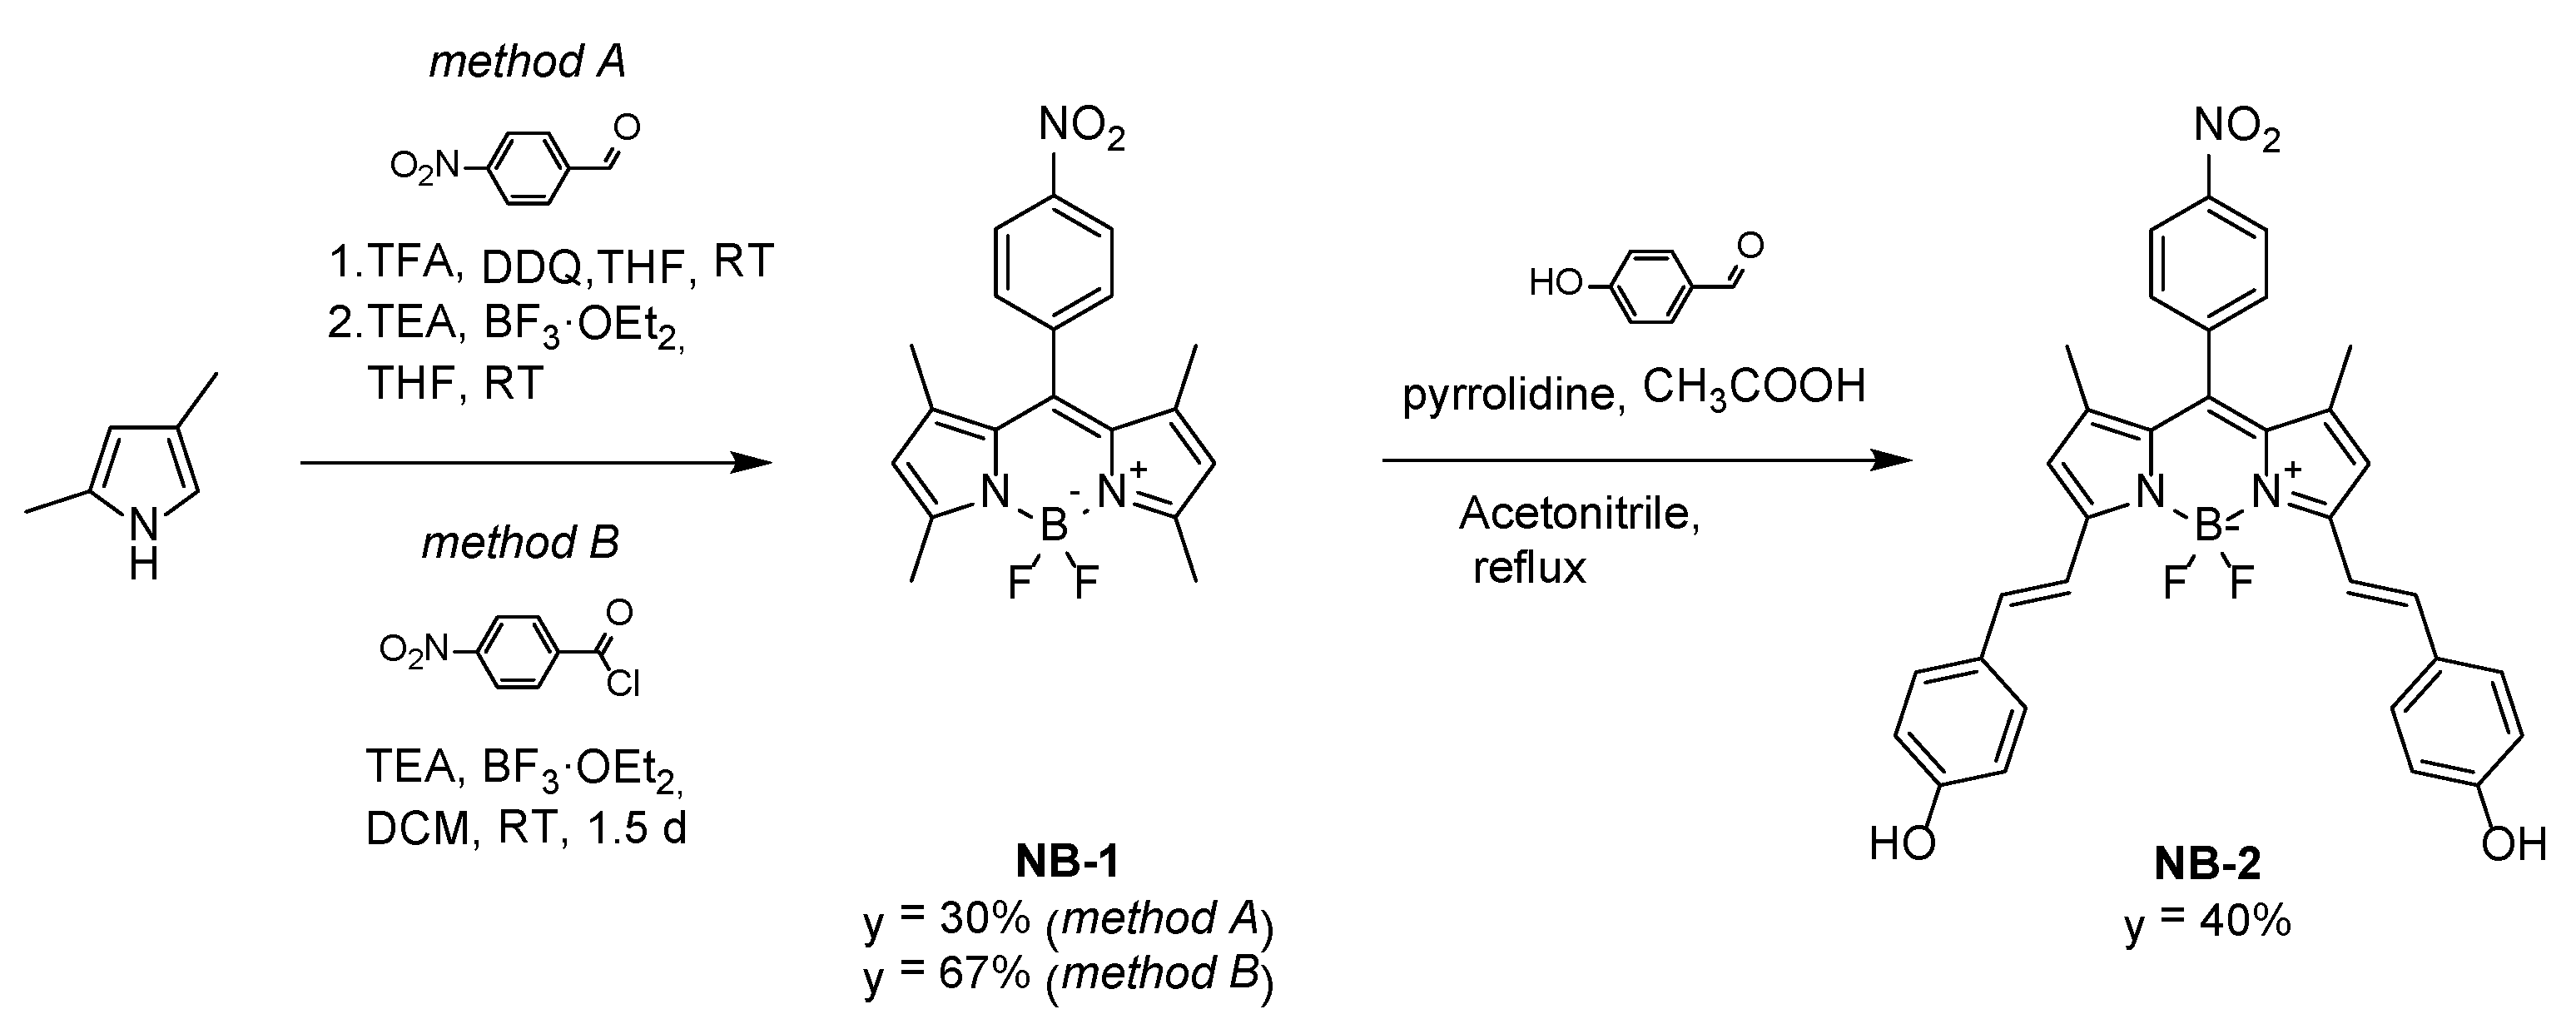
2.3. Synthesis Procedures
2.4. Preparation of Micelles
2.5. Methodology of Autoxidation Measurements
2.6. UV-vis Studies of Stability and Reactivity in Methanol and in Micelles
2.7. Spectrofluorometric Measurements
2.8. Photolysis of AIBN
3. Results and Discussion
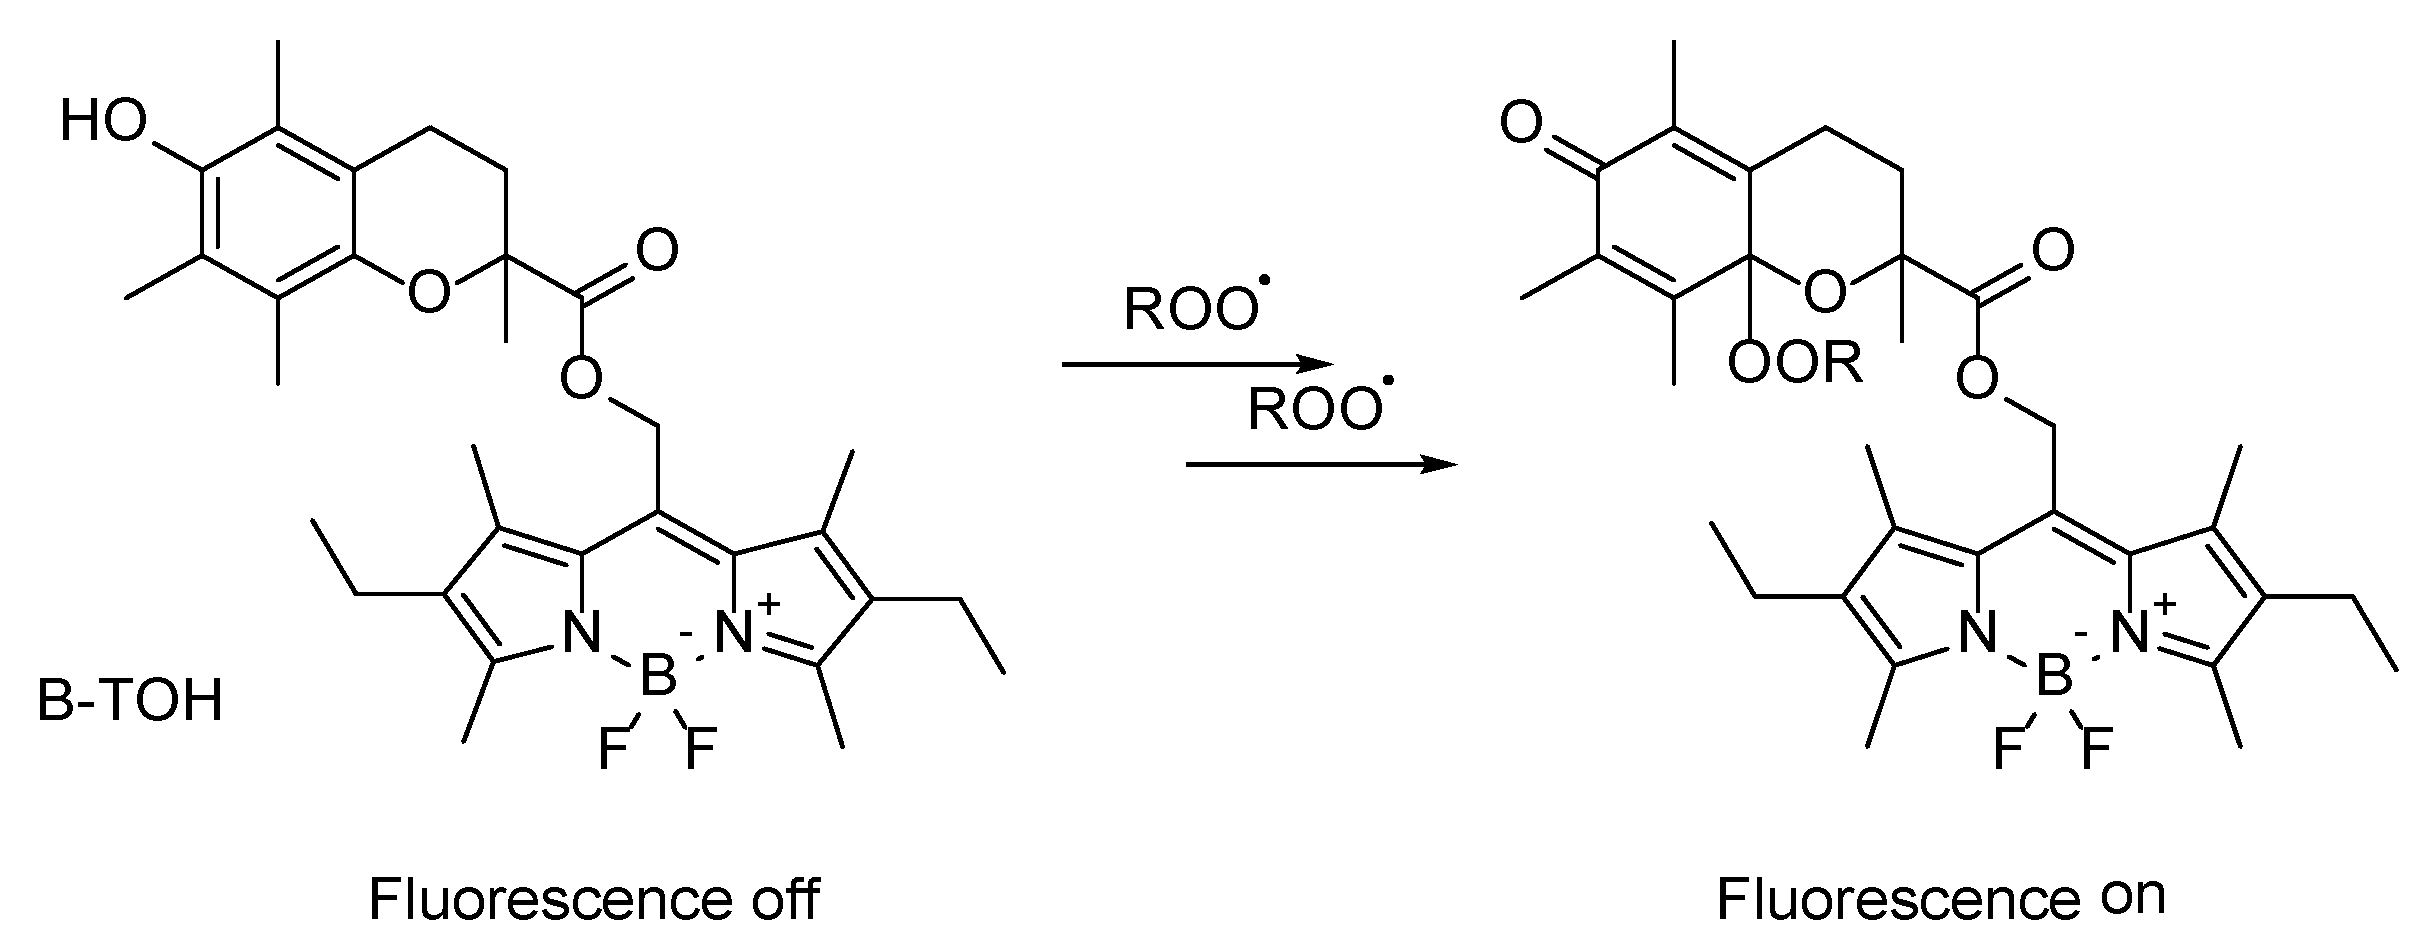
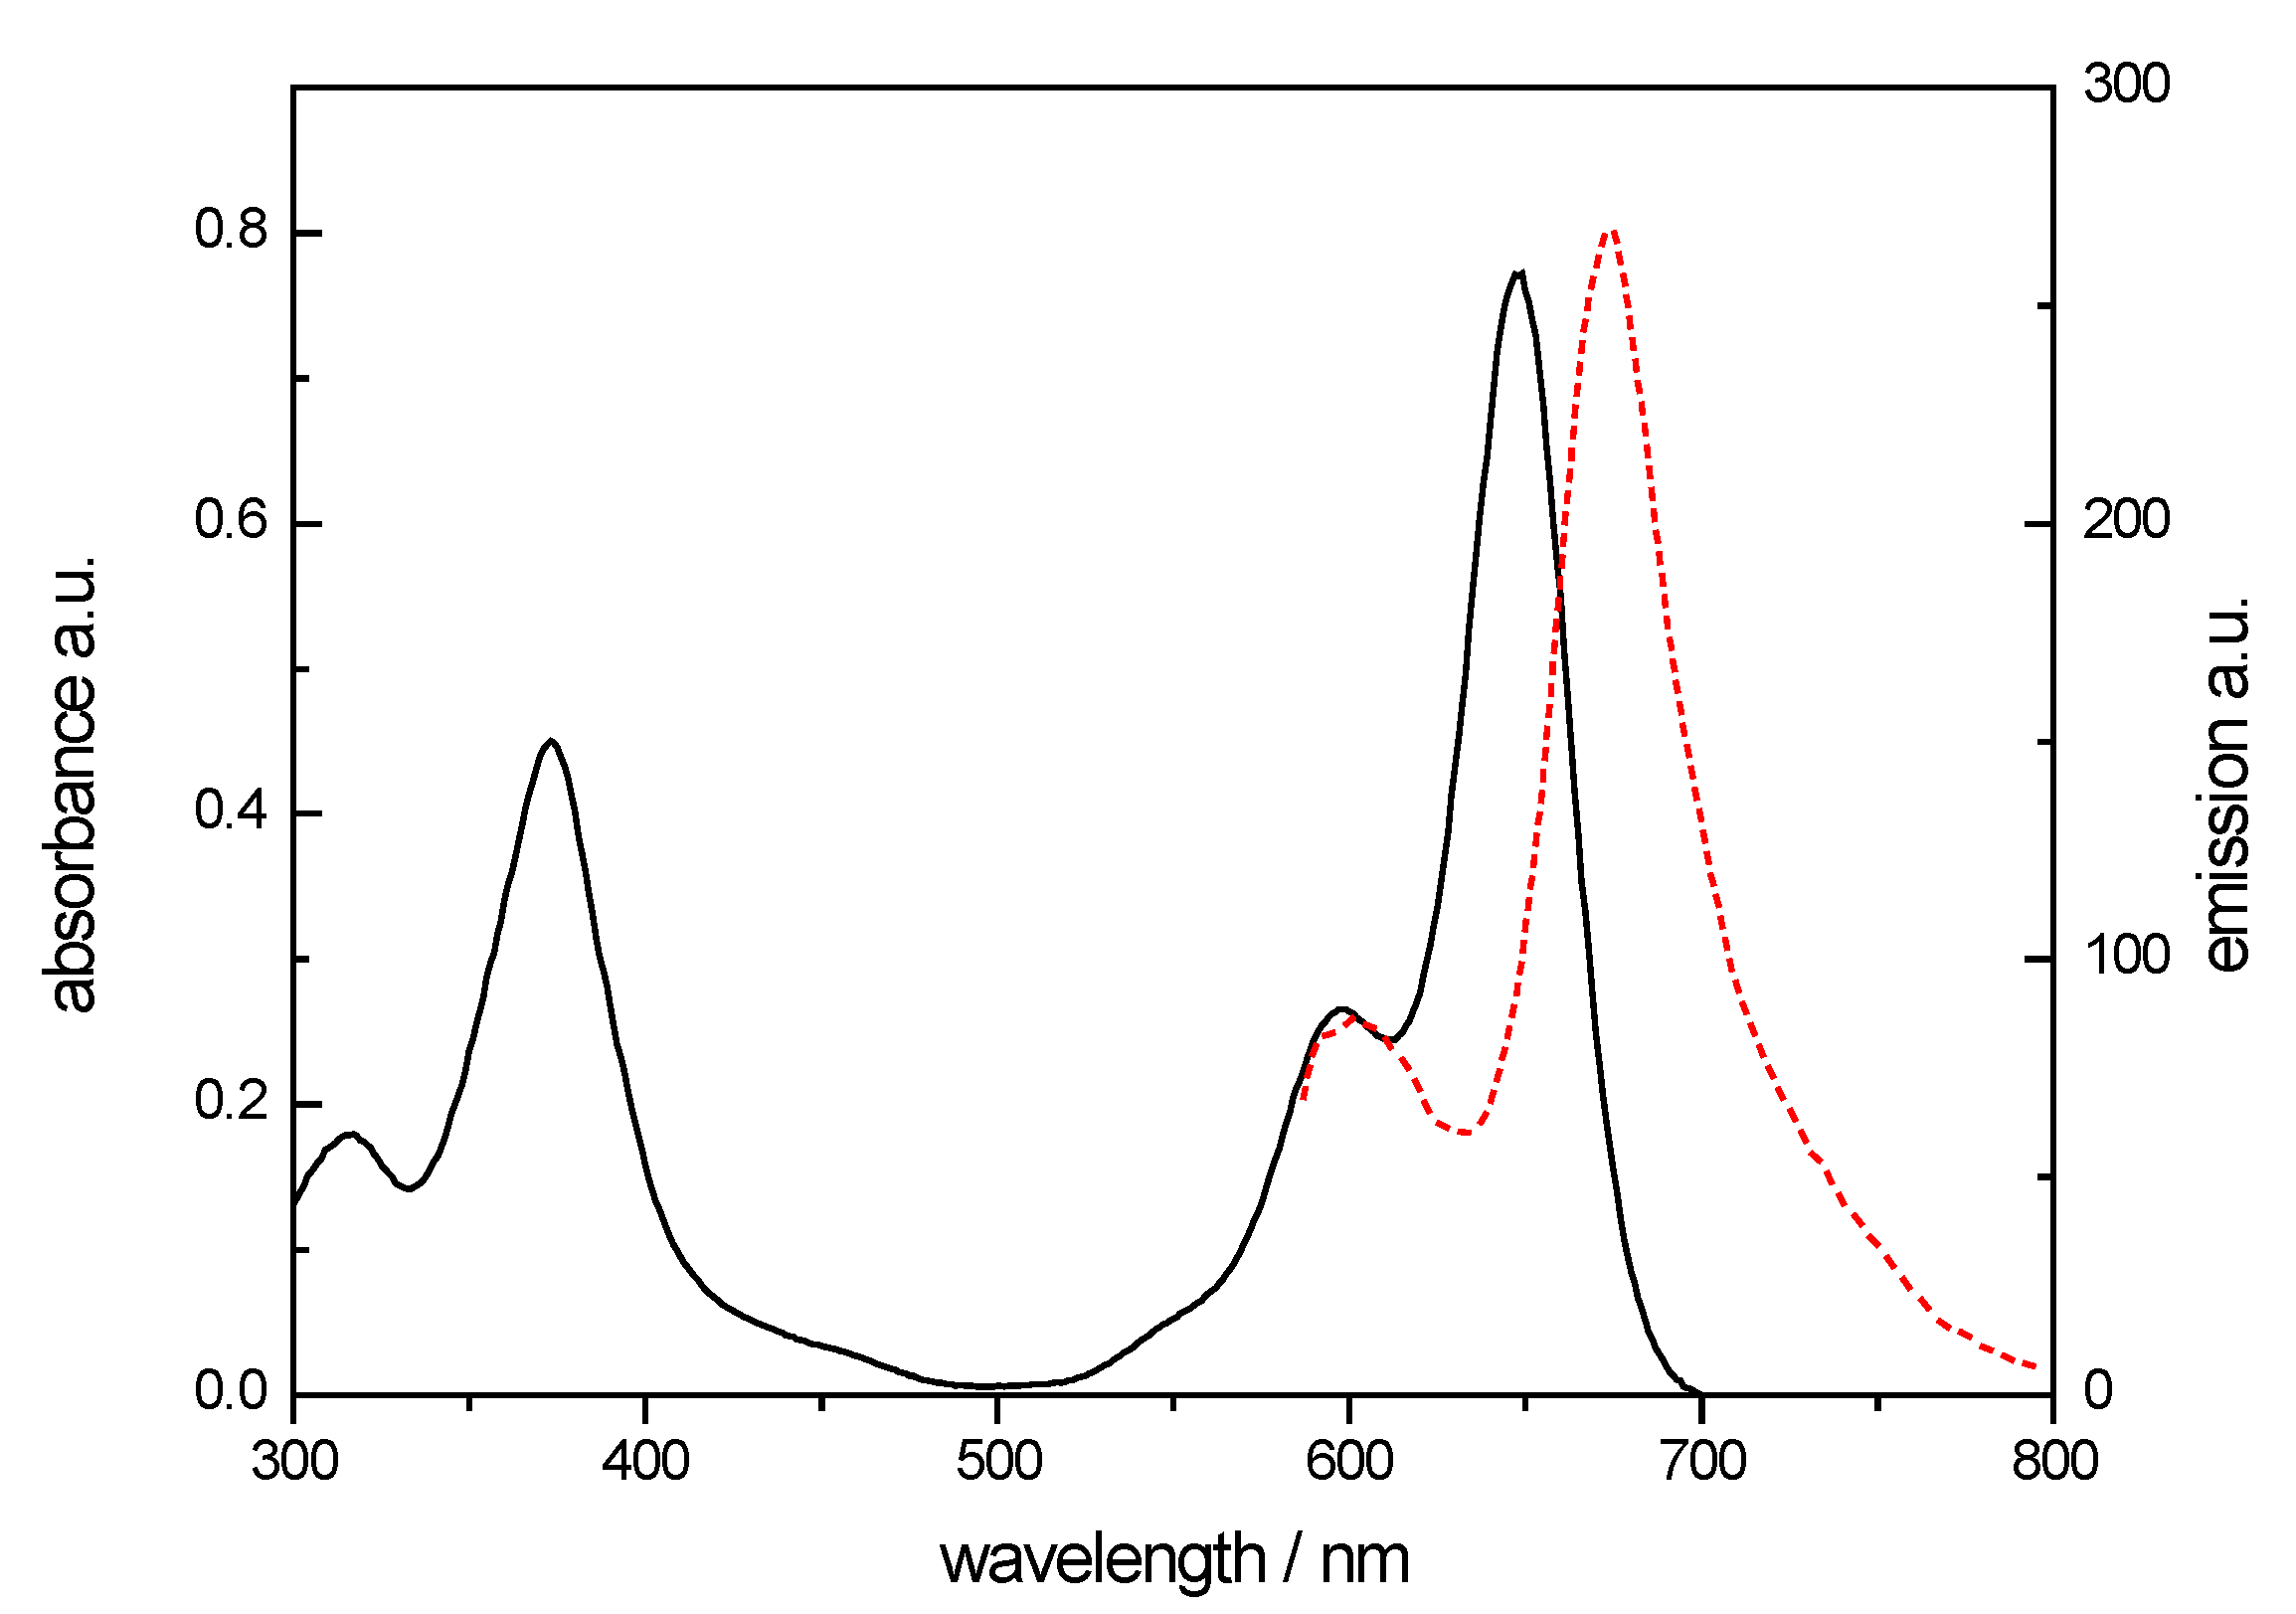
3.1. Synthesis and Spectral Chracteristics of NB-2
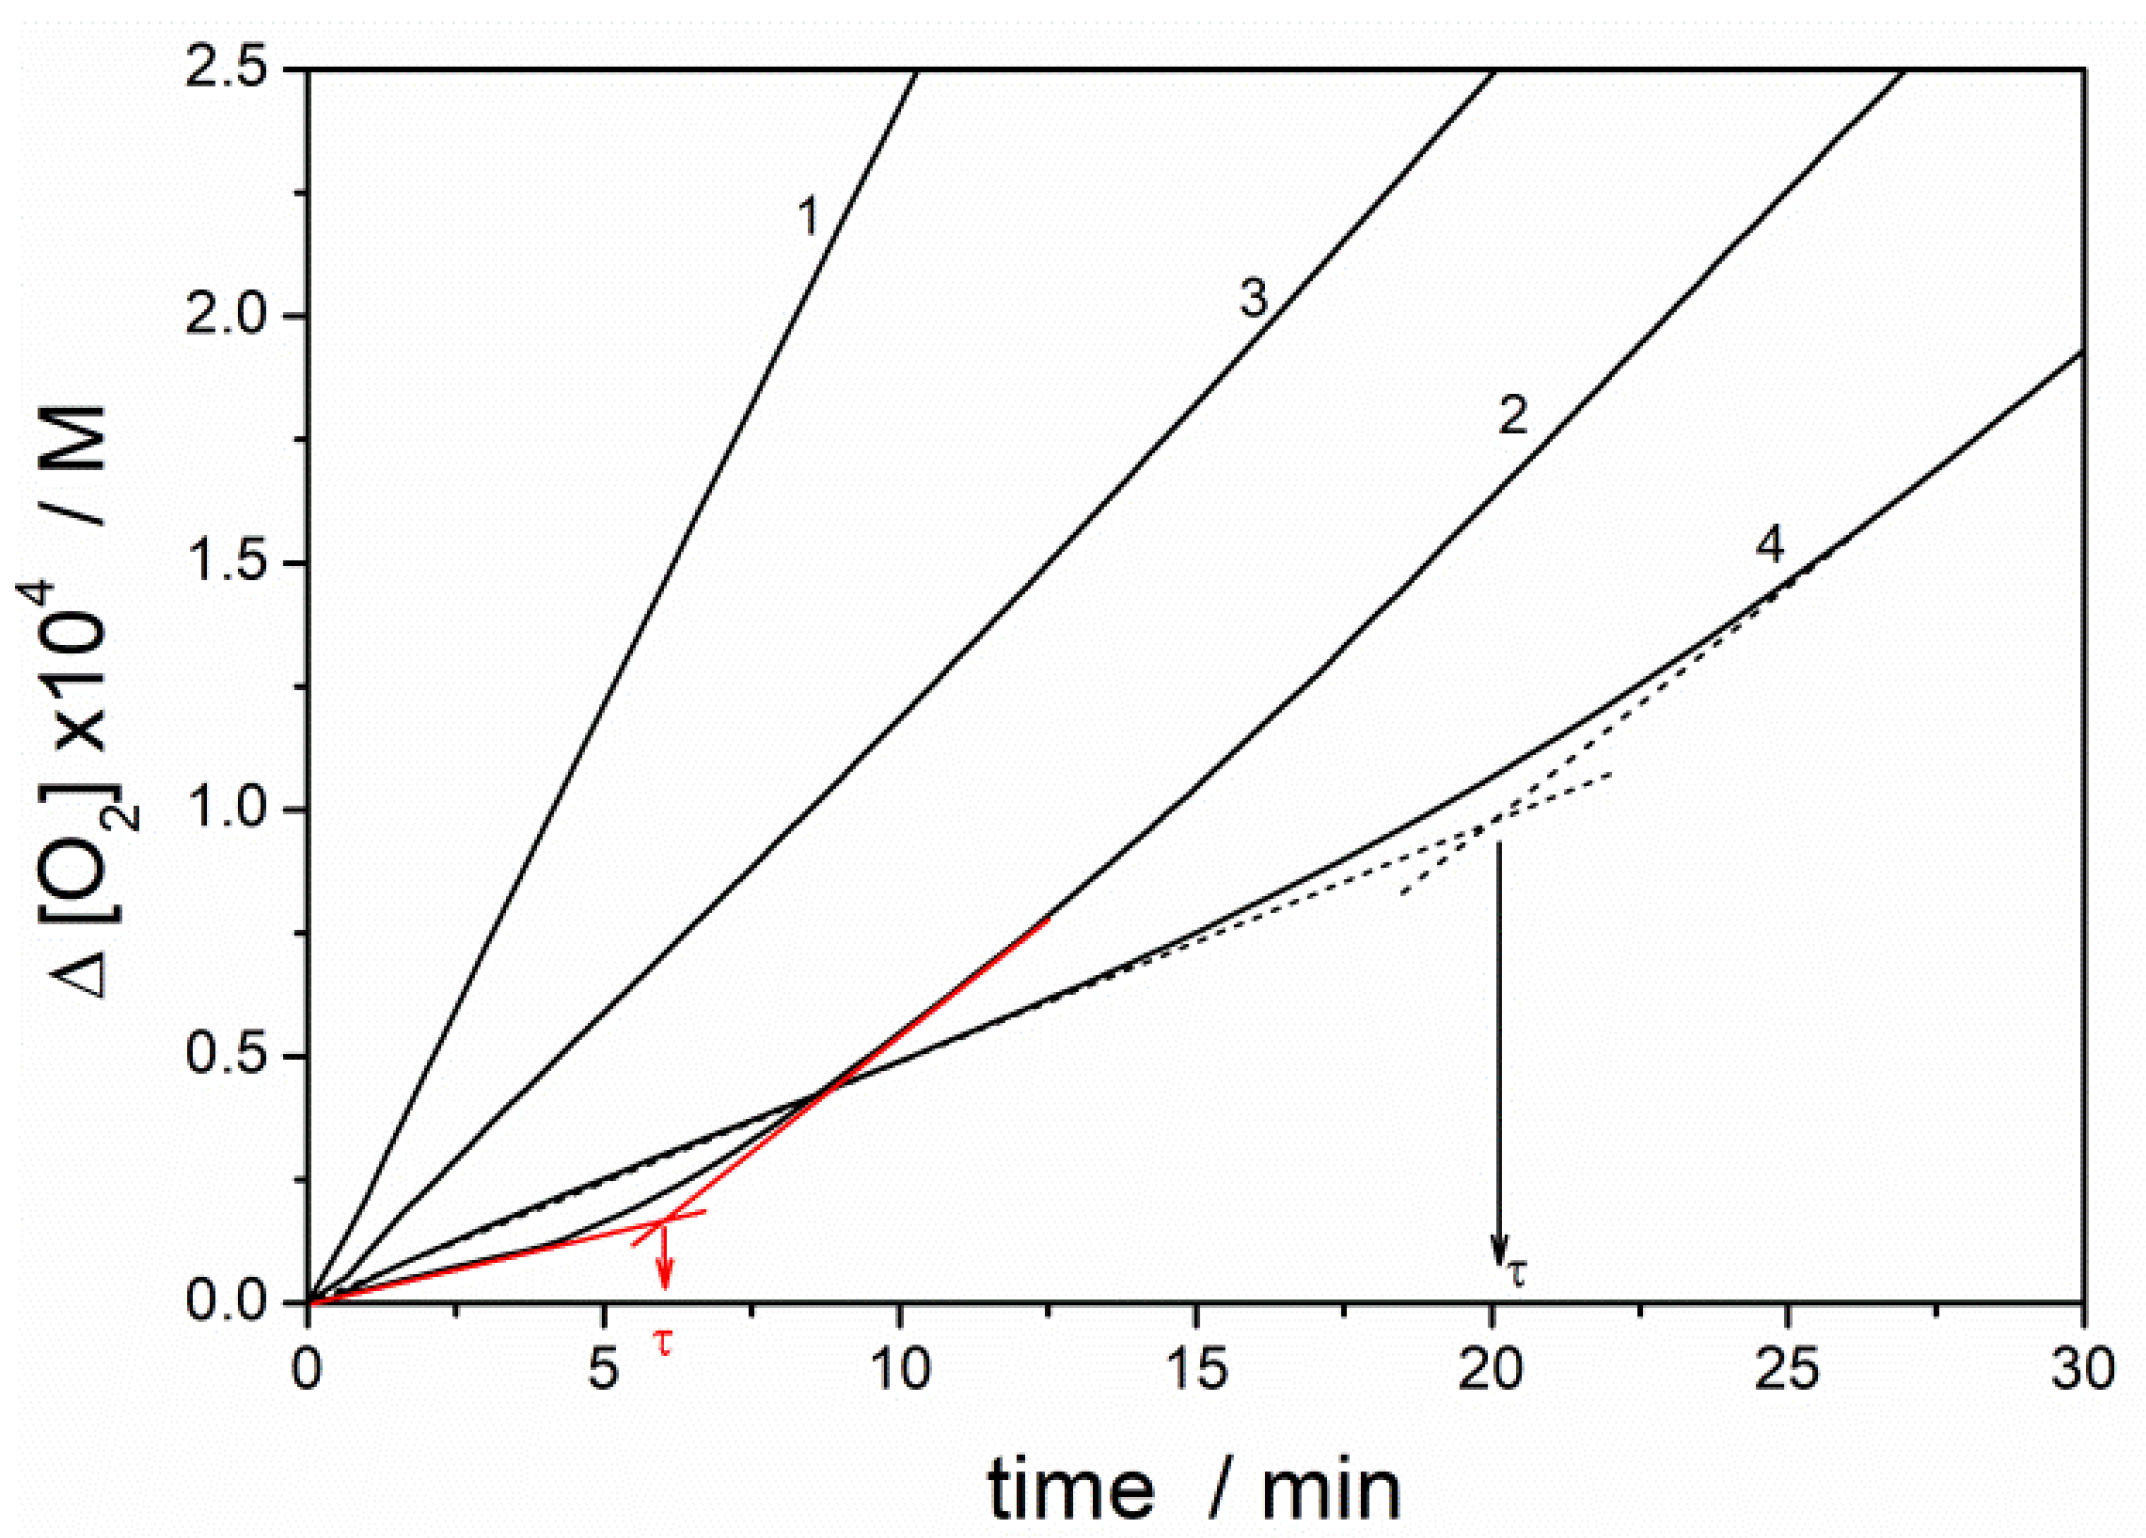
3.2. Kinetic Parameters of Reaction of NB-2 with Peroxyl Radicals
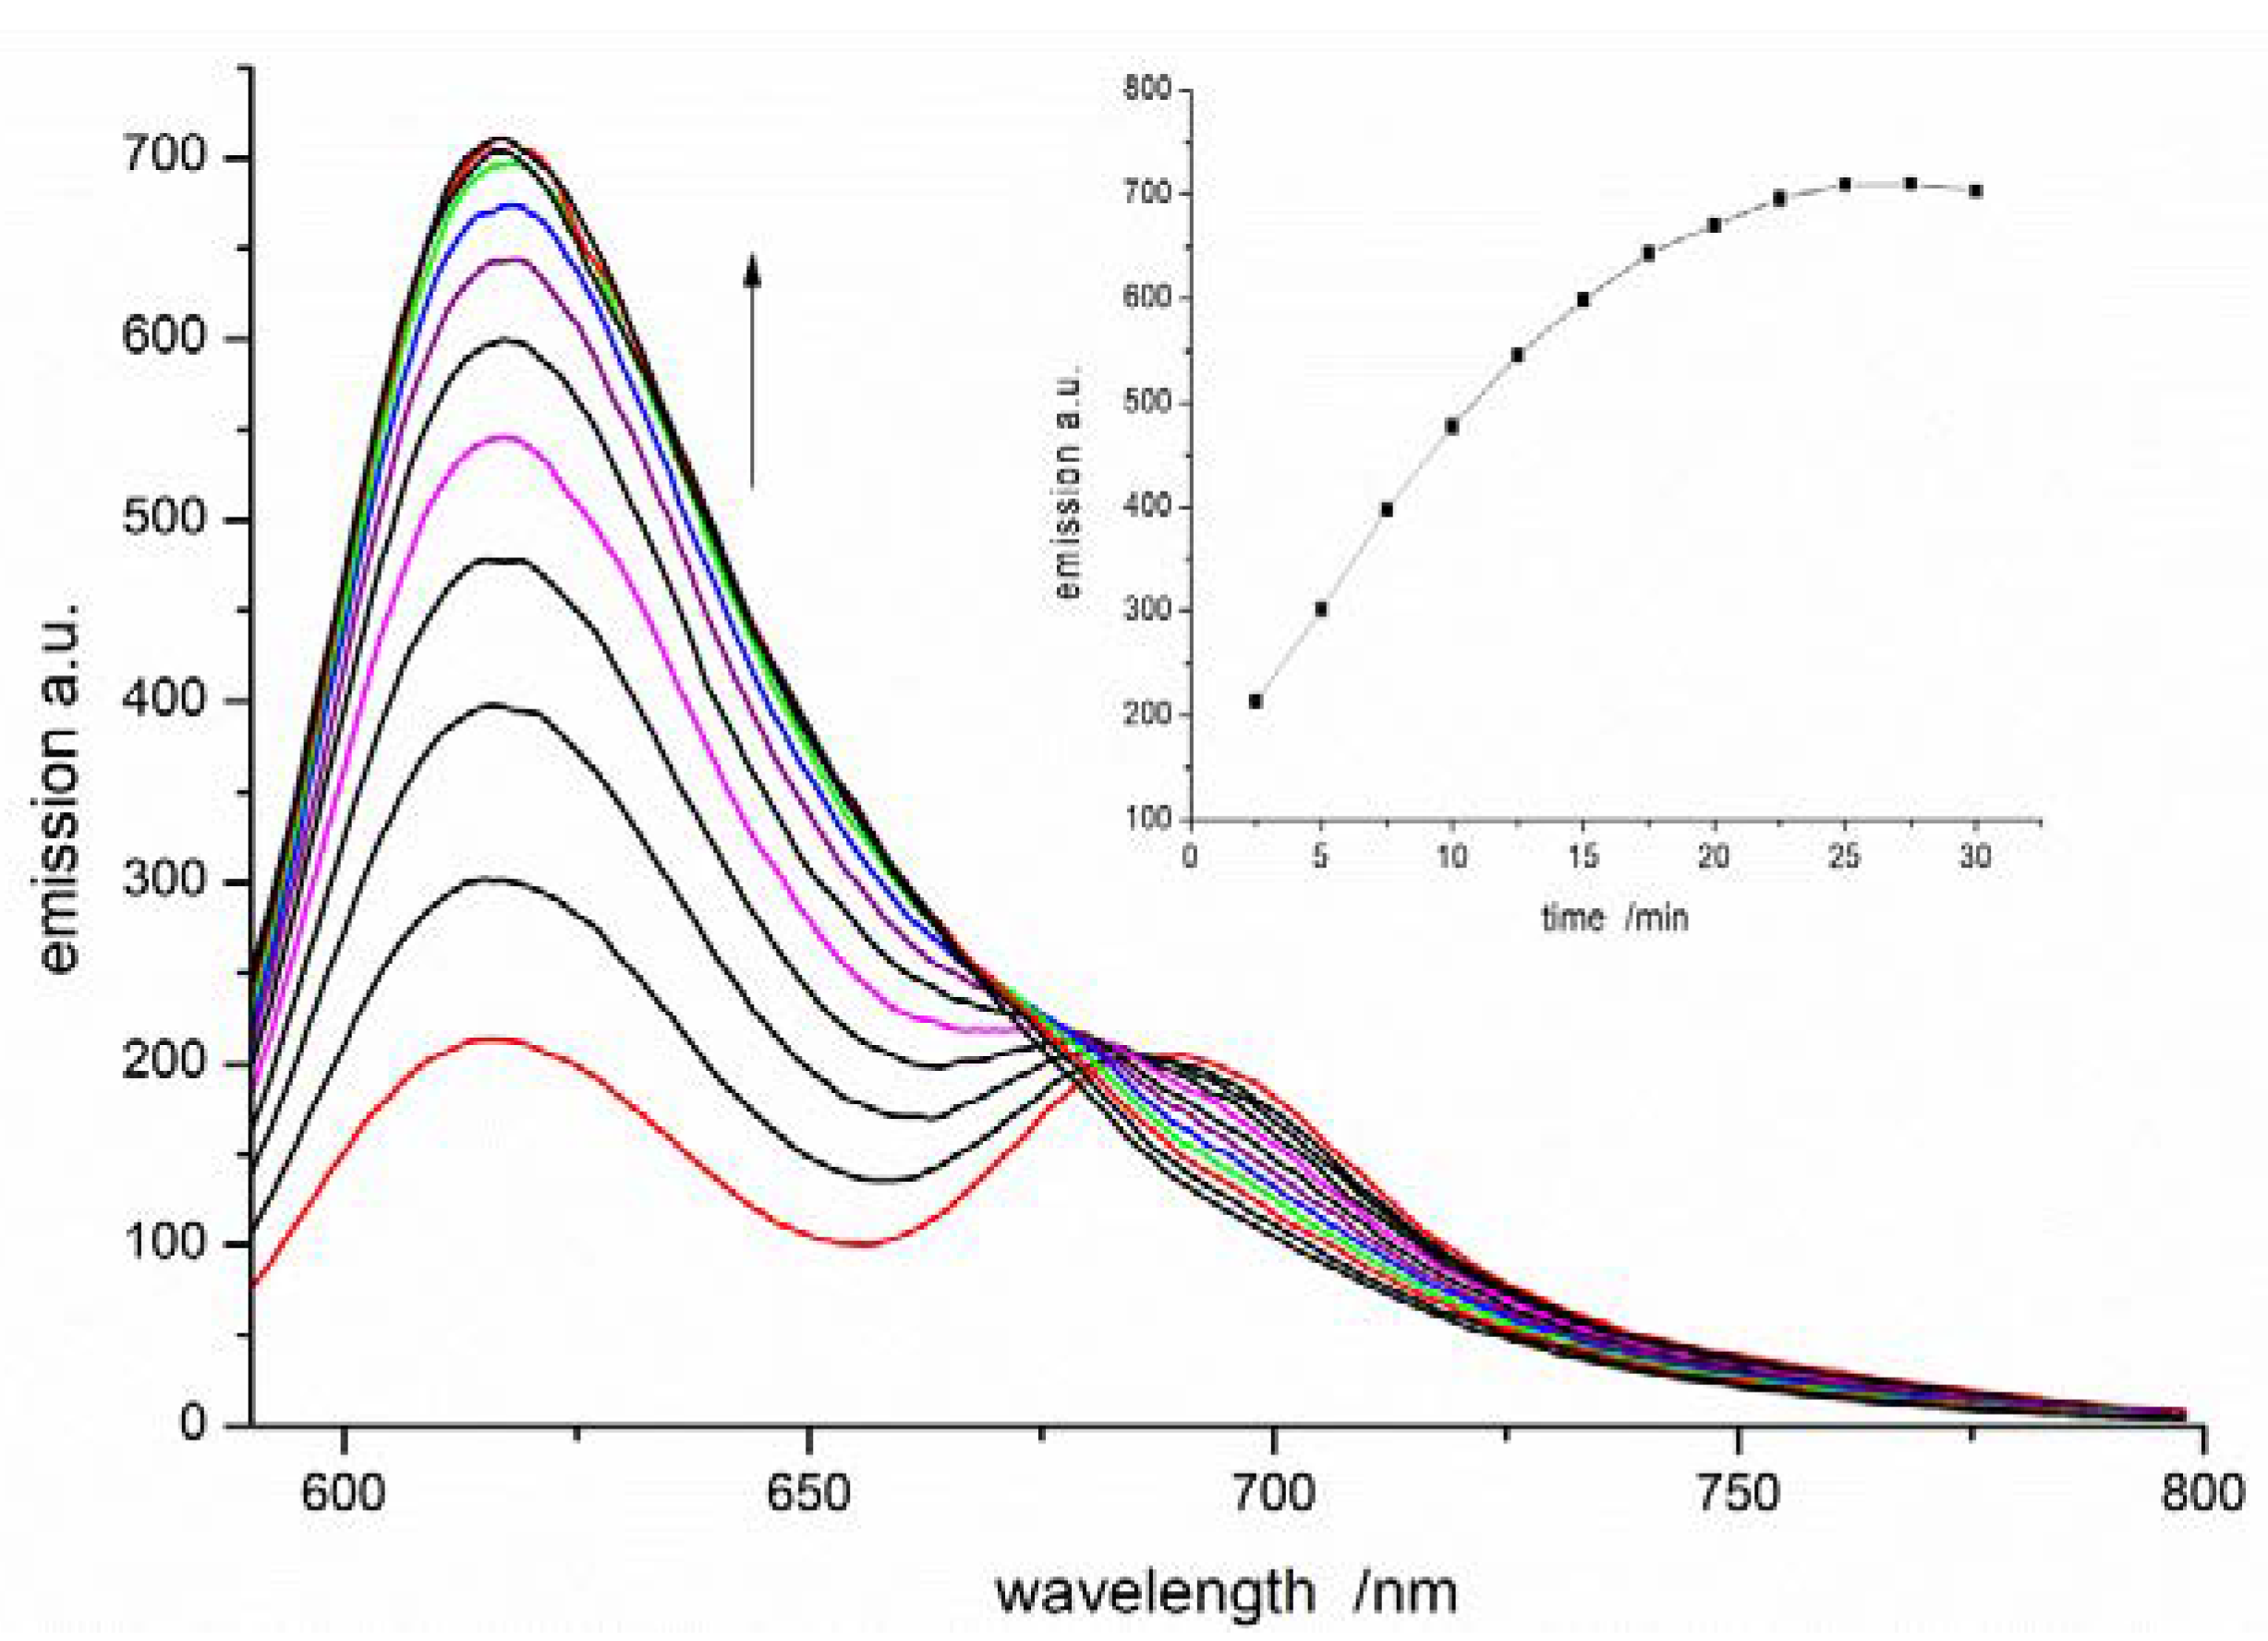
3.3. UV-vis and Spectrofluorimetric Study of the Reaction of NB-2 with Peroxyl Radicals in Methanol
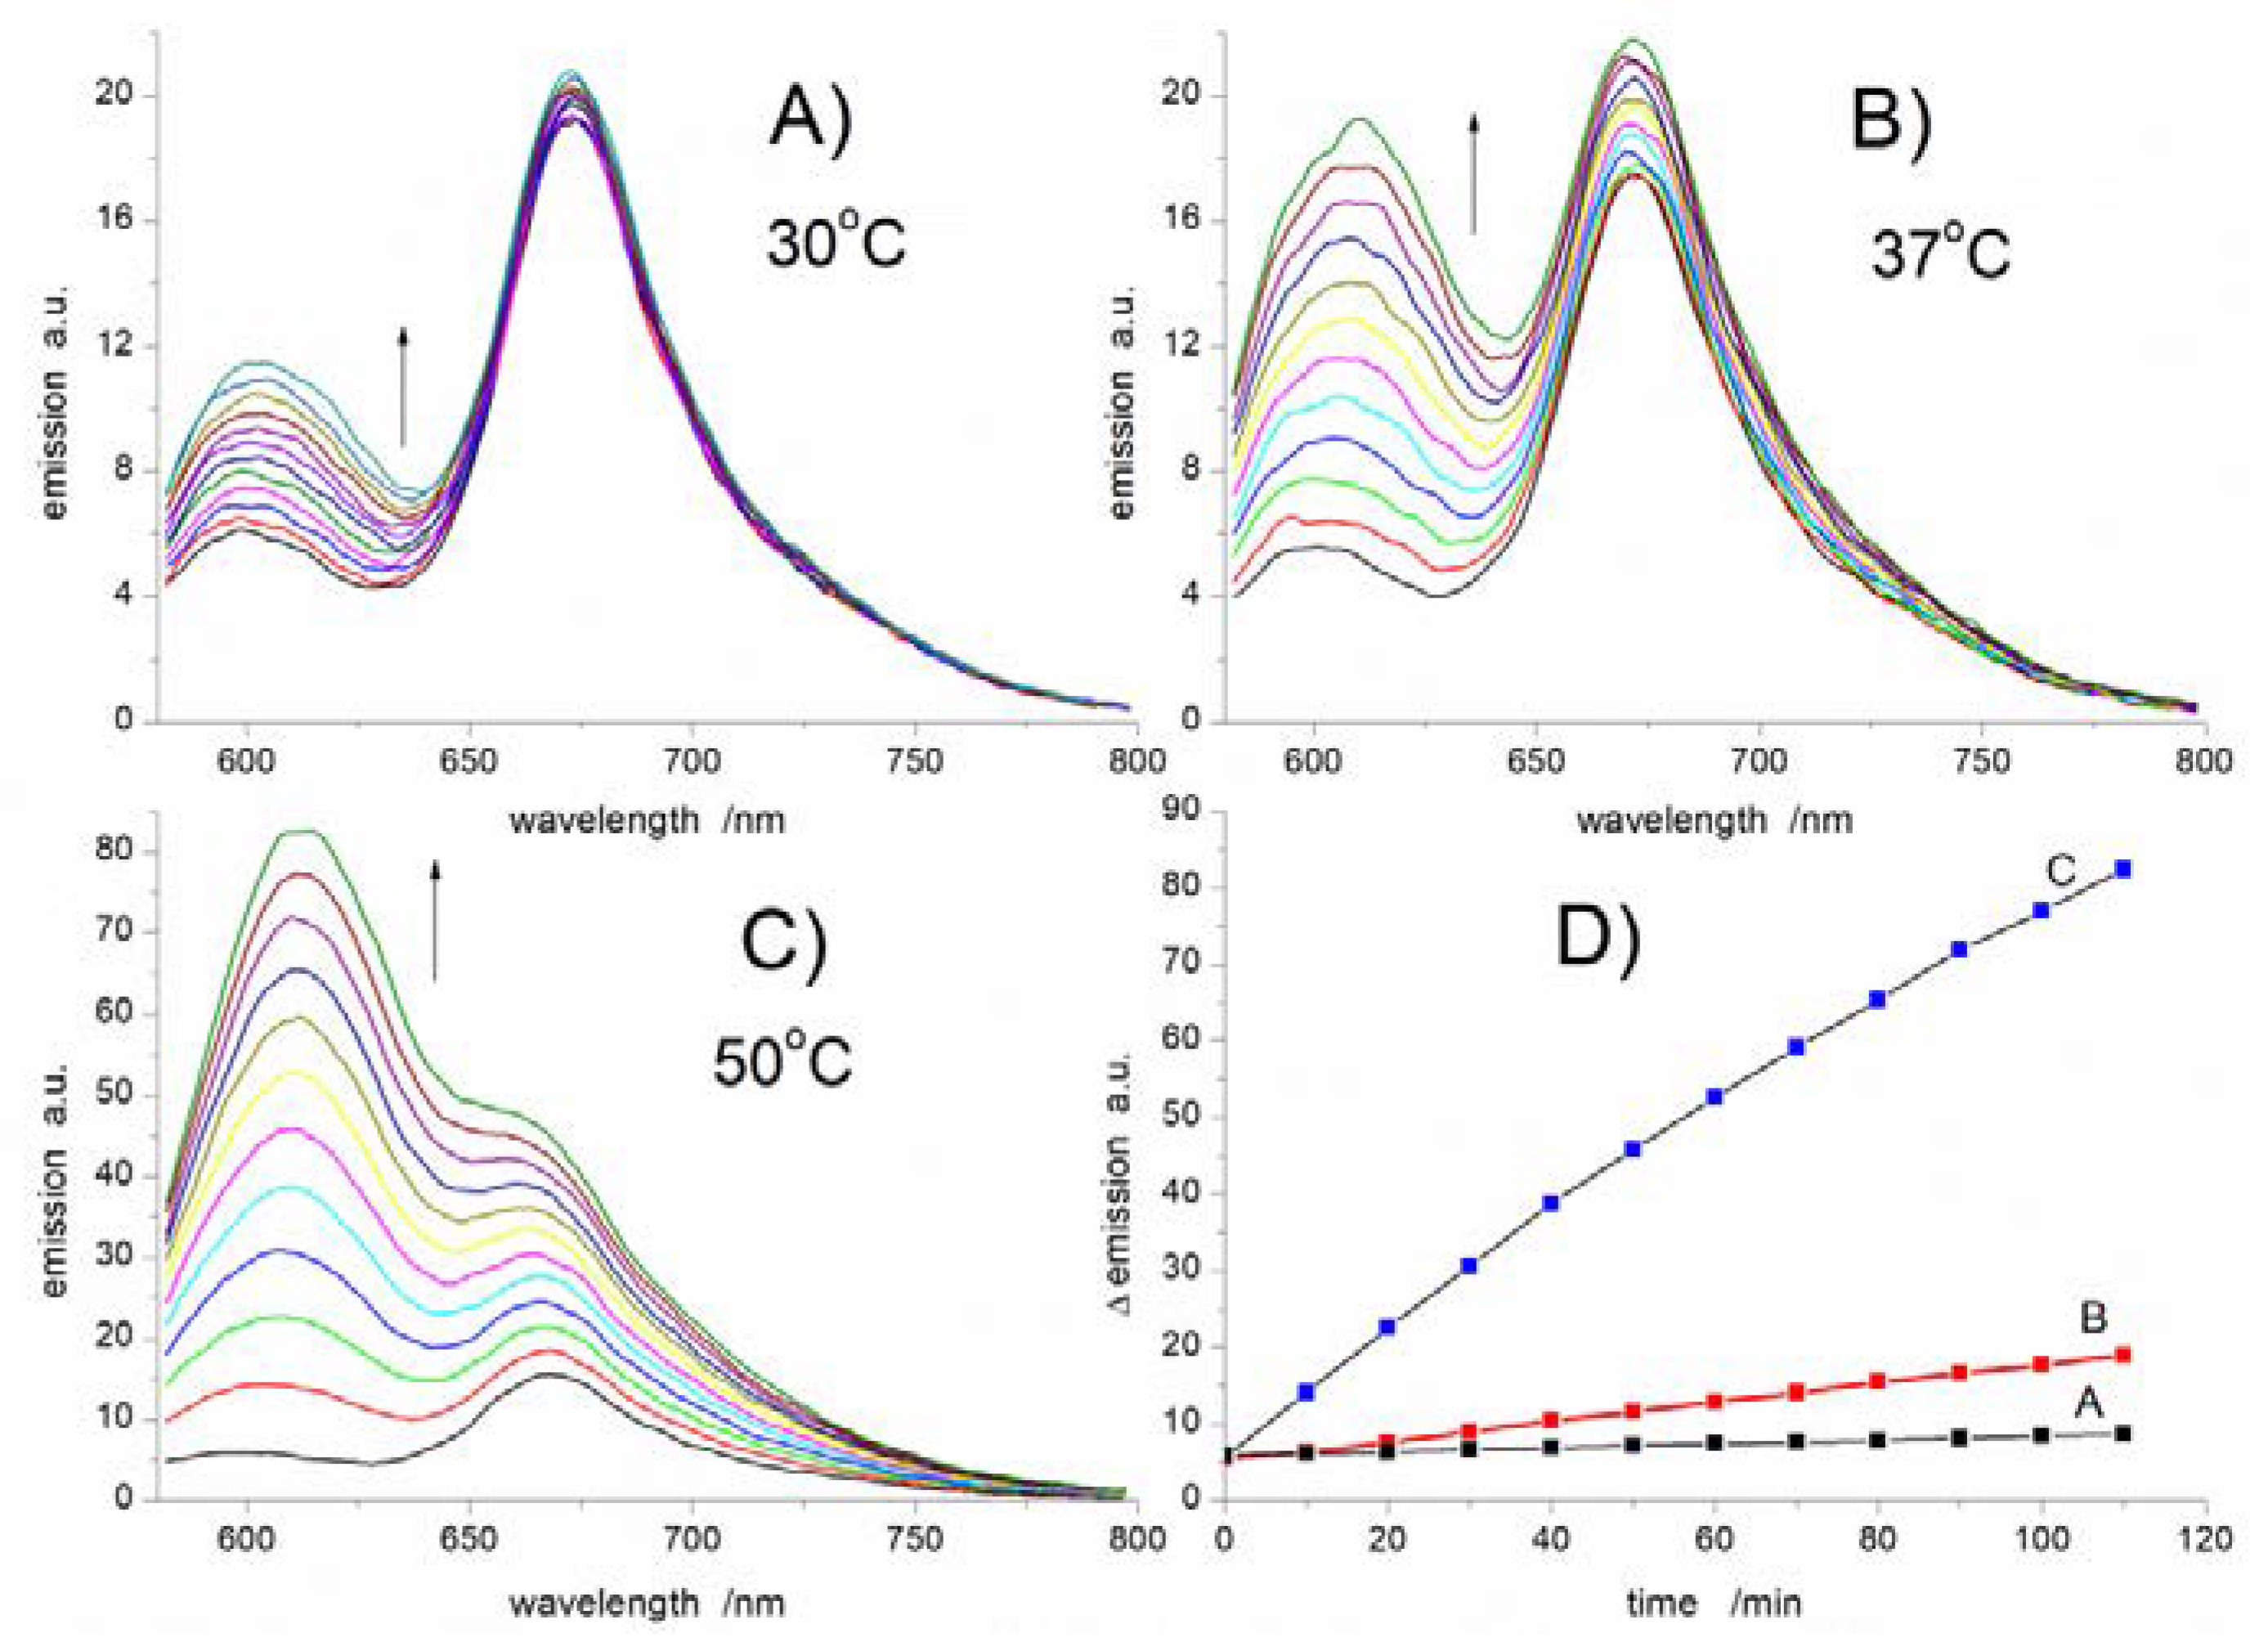
3.4. UV-vis and Spectrofluorimetric Study of the Reaction of NB-2 with Peroxyl Radicals in Micelles
4. Conclusions
Supplementary Materials
Author Contributions
Funding
Acknowledgments
Conflicts of Interest
Abbreviations
| ABAP | 2,2′-azobis(2-amidinopropane) |
| AIBN | α,α′-azobisisobutyronitrile |
| BODIPY | dipyrrometheneboron difluoride |
| CBA | chain-breaking antioxidant |
| DCM | dichloromethane |
| DDQ | 2,3-Dichloro-5,6-dicyano-1,4-benzoquinone |
| DMPC | 1,2-dimyristoyl-sn-glycero-3-phosphocholine |
| FP | fluorescent probe(s) |
| LinMe | methyl linoleate |
| LH | lipid molecule |
| PMHC | 2,2,5,7,8-pentamethylchroman-6-ol |
| PUFA | polyunsaturated fatty acids |
| R• | alkyl radical |
| LOO• | peroxyl radical |
| ROS | Reactive Oxygen Species |
| TEA | triethylamine |
| TFA | trifluoroacetic acid |
| THF | tetrahydrofuran |
| TLC | thin-layer chromatoraphy |
| Triton X-100 | polyethylene glycol p-(1,1,3,3-tetramethylbutyl)-phenyl ether |
References
- Russell, E.G.; Cotter, T.G. New Insight into the Role of Reactive Oxygen Species (ROS) in Cellular Signal-Transduction Processes. In International Review of Cell and Molecular Biology; Academic Press: Cambridge, MA, USA, 2015; Volume 319, pp. 221–254. [Google Scholar]
- Muller, F.L.; Lustgarten, M.S.; Jang, Y.; Richardson, A.; Van Remmen, H. Trends in oxidative aging theories. Free Radic. Biol. Med. 2007, 43, 477–503. [Google Scholar] [CrossRef]
- Liou, G.Y.; Storz, P. Reactive oxygen species in cancer. Free Radic. Res. 2010, 44, 479–496. [Google Scholar] [CrossRef] [Green Version]
- Aitken, R.J.; De Iuliis, G.N.; Gibb, Z.; Baker, M.A. The simmet lecture: New horizons on an old landscape—Oxidative stress, DNA damage and apoptosis in the male germ line. Reprod. Domest. Anim. 2012, 47, 7–14. [Google Scholar] [CrossRef]
- Liu, Y.W.; Sakaeda, T.; Takara, K.; Nakamura, T.; Ohmoto, N.; Komoto, C.; Kobayashi, H.; Yagami, T.; Okamura, N.; Okumura, K. Effects of reactive oxygen species on cell proliferation and death in HeLa cells and its MDR1-overexpressing derivative cell line. Biol. Pharm. Bull. 2003, 26, 278–281. [Google Scholar] [CrossRef] [PubMed] [Green Version]
- Grisham, M.B.; Jourd’heuil, D.; Wink, D.A. Chronic inflammation and reactive oxygen and nitrogen metabolism—Implications in DNA damage and mutagenesis. Aliment. Pharmacol. Ther. Suppl. 2000, 14, 3–9. [Google Scholar] [CrossRef] [PubMed]
- Nunomura, A.; Moreira, P.I.; Takeda, A.; Smith, M.A.; Perry, G. Oxidative RNA damage and neurodegeneration. Curr. Med. Chem. 2007, 14, 2968–2975. [Google Scholar] [CrossRef] [PubMed] [Green Version]
- Curtin, J.F.; Donovan, M.; Cotter, T.G. Regulation and measurement of oxidative stress in apoptosis. J. Immunol. Methods 2002, 265, 49–72. [Google Scholar] [CrossRef] [Green Version]
- Szatrowski, T.P.; Nathan, C.F. Production of Large Amounts of Hydrogen Peroxide by Human Tumor Cells. Cancer Res. 1991, 51, 794–798. [Google Scholar]
- Gaschler, M.M.; Stockwell, B.R. Lipid peroxidation in cell death. Biochem. Biophys. Res. Commun. 2017, 482, 419–425. [Google Scholar] [CrossRef]
- Ghezzi, P.; Jaquet, V.; Marcucci, F.; Schmidt, H.H.H.W. The oxidative stress theory of disease: Levels of evidence and epistemological aspects. Br. J. Pharmacol. 2017, 174, 1784–1796. [Google Scholar] [CrossRef]
- Kaur, A. Fluorescent Tools for Imaging Oxidative Stress in Biology; Springer: Cham, Switzerland, 2018. [Google Scholar]
- Djamali, A.; Sadowski, E.A.; Muehrer, R.J.; Reese, S.; Smavatkul, C.; Vidyasagar, A.; Fain, S.B.; Lipscomb, R.C.; Hullett, D.H.; Samaniego-Picota, M.; et al. BOLD-MRI assessment of intrarenal oxygenation and oxidative stress in patients with chronic kidney allograft dysfunction. Am. J. Physiol. Ren. Physiol. 2007, 292, F513–F522. [Google Scholar] [CrossRef] [PubMed] [Green Version]
- Noseworthy, M.D.; Bray, T.M. Effect of oxidative stress on brain damage detected by MRI and in vivo 31P-NMR. Free Radic. Biol. Med. 1998, 24, 942–951. [Google Scholar] [CrossRef]
- Lü, R. Reaction-based small-molecule fluorescent probes for dynamic detection of ROS and transient redox changes in living cells and small animals. J. Mol. Cell. Cardiol. 2017, 110, 96–108. [Google Scholar] [CrossRef] [PubMed]
- Andina, D.; Leroux, J.C.; Luciani, P. Ratiometric Fluorescent Probes for the Detection of Reactive Oxygen Species. Chem. A Eur. J. 2017, 23, 13549–13573. [Google Scholar] [CrossRef]
- Pawley, J.B. Handbook of Biological Confocal Microscopy, 3rd ed.; Springer: Boston, MA, USA, 2006; pp. 1–985. [Google Scholar] [CrossRef]
- Wang, H.; Joseph, J.A. Quantifying cellular oxidative stress by dichlorofluorescein assay using microplate reader. Free Radic. Biol. Med. 1999, 27, 612–616. [Google Scholar] [CrossRef]
- Gomes, A.; Fernandes, E.; Lima, J.L. Fluorescence probes used for detection of reactive oxygen species. J. Biochem. Biophys. Methods 2005, 65, 45–80. [Google Scholar] [CrossRef] [PubMed]
- Zhang, W.; Li, P.; Yang, F.; Hu, X.; Sun, C.; Zhang, W.; Chen, D.; Tang, B. Dynamic and reversible fluorescence imaging of superoxide anion fluctuations in live cells and in vivo. J. Am. Chem. Soc. 2013, 135, 14956–14959. [Google Scholar] [CrossRef] [PubMed]
- Yu, F.; Song, P.; Li, P.; Wang, B.; Han, K. Development of reversible fluorescence probes based on redox oxoammonium cation for hypobromous acid detection in living cells. Chem. Commun. 2012, 48, 7735–7737. [Google Scholar] [CrossRef] [PubMed]
- Kim, J.; Kim, Y. A water-soluble sulfonate-BODIPY based fluorescent probe for selective detection of HOCl/OCl− in aqueous media. Analyst 2014, 139, 2986–2989. [Google Scholar] [CrossRef] [PubMed]
- Drummen, G.P.C.; van Liebergen, L.C.M.; Op den Kamp, J.A.F.; Post, J.A. C11-BODIPY581/591, an oxidation-sensitive fluorescent lipid peroxidation probe: (Micro) spectroscopic characterization and validation of methodology. Free Radic. Biol. Med. 2002, 33, 473–490. [Google Scholar] [CrossRef]
- Durantini, A.M.; Greene, L.E.; Lincoln, R.; Martínez, S.R.; Cosa, G. Reactive Oxygen Species Mediated Activation of a Dormant Singlet Oxygen Photosensitizer: From Autocatalytic Singlet Oxygen Amplification to Chemicontrolled Photodynamic Therapy. J. Am. Chem. Soc. 2016, 138, 1215–1225. [Google Scholar] [CrossRef] [PubMed]
- Oleynik, P.; Ishihara, Y.; Cosa, G. Design and synthesis of a BODIPY-α-tocopherol adduct for use as an off/on fluorescent antioxidant indicator. J. Am. Chem. Soc. 2007, 129, 1842–1843. [Google Scholar] [CrossRef] [PubMed]
- Krumova, K.; Oleynik, P.; Karam, P.; Cosa, G. Phenol-based lipophilic fluorescent antioxidant indicators: A rational approach. J. Org. Chem. 2009, 74, 3641–3651. [Google Scholar] [CrossRef]
- Greene, L.E.; Lincoln, R.; Cosa, G. Tuning Photoinduced Electron Transfer Efficiency of Fluorogenic BODIPY-α-Tocopherol Analogues. Photochem. Photobiol. 2019, 95, 192–201. [Google Scholar] [CrossRef] [PubMed] [Green Version]
- Krumova, K.; Cosa, G. Fluorogenic Probes for Imaging Reactive Oxygen Species. In Photochemistry; The Royal Society of Chemistry: Cambridge, UK, 2013; Volume 41, pp. 279–301. [Google Scholar] [CrossRef]
- Pérez-Herrero, E.; Fernández-Medarde, A. Advanced targeted therapies in cancer: Drug nanocarriers, the future of chemotherapy. Eur. J. Pharm. Biopharm. 2015, 93, 52–79. [Google Scholar] [CrossRef] [PubMed] [Green Version]
- Jodko-Piorecka, K.; Litwinienko, G. Antioxidant activity of dopamine and L-DOPA in lipid micelles and their cooperation with an analogue of alpha-tocopherol. Free Radic. Biol. Med. 2015, 83, 1–11. [Google Scholar] [CrossRef]
- Konopko, A.; Kusio, J.; Litwinienko, G. Antioxidant Activity of Metal Nanoparticles Coated with Tocopherol-Like Residues—The Importance of Studies in Homo- and Heterogeneous Systems. Antioxidants 2020, 9, 5. [Google Scholar] [CrossRef] [Green Version]
- Van Wenum, E.; Jurczakowski, R.; Litwinienko, G. Media Effects on the Mechanism of Antioxidant Action of Silybin and 2,3-Dehydrosilybin: Role of the Enol Group. J. Org. Chem. 2013, 78, 9102–9112. [Google Scholar] [CrossRef]
- Fedeli, S.; Paoli, P.; Brandi, A.; Venturini, L.; Giambastiani, G.; Tuci, G.; Cicchi, S. Azido-Substituted BODIPY Dyes for the Production of Fluorescent Carbon Nanotubes. Chem. A Eur. J. 2015, 21, 15349–15353. [Google Scholar] [CrossRef]
- Foti, M.C.; Amorati, R. Non-phenolic radical-trapping antioxidants. J. Pharm. Pharmacol. 2009, 61, 1435–1448. [Google Scholar] [CrossRef]
- Barclay, L.R.C.; Baskin, K.A.; Dakin, K.A.; Locke, S.J.; Vinqvist, M.R. The Antioxidant Activities of Phenolic Antioxidants in Free-Radical Peroxidation of Phospholipid-Membranes. Can. J. Chem. 1990, 68, 2258–2269. [Google Scholar] [CrossRef] [Green Version]
- Denisov, E.T.; Afanas’ev, I.B. Oxidation and Antioxidants in Organic Chemistry and Biology; CRC Press: Boca Raton, FL, USA; Taylor & Francis Group: Abingdon-on-Thames, UK, 2005. [Google Scholar]
- Van Hook, J.P.; Tobolsky, A.V. The Thermal Decomposition of 2,2′-Azo-bis-isobutyronitrile. J. Am. Chem. Soc. 1958, 80, 779–782. [Google Scholar] [CrossRef]
- Denisov, E.T.; Denisova, T.G.; Pokidova, T.S. Handbook of Free Radical Initiators; John Wiley & Sons: Hoboken, NJ, USA, 2003. [Google Scholar]
- Koroleva, O.; Torkova, A.; Nikolaev, I.; Khrameeva, E.; Fedorova, T.; Tsentalovich, M.; Amarowicz, R. Evaluation of the Antiradical Properties of Phenolic Acids. Int. J. Mol. Sci. 2014, 15, 16351–16380. [Google Scholar] [CrossRef] [PubMed] [Green Version]
- Naguib, Y.M.A. A Fluorometric Method for Measurement of Peroxyl Radical Scavenging Activities of Lipophilic Antioxidants. Anal. Biochem. 1998, 265, 290–298. [Google Scholar] [CrossRef] [PubMed]


| Experimental System | τ/min | Ria/nMs−1 | Rinh/nMs−1 | Rox/Rinhb | 10−3 × kinh/M−1·s−1 |
|---|---|---|---|---|---|
| PMHC | 6.0 ± 0.6 | 4.3 ± 0.3 | 37 ± 13 | 11.6 | 12.1 ± 3.0 |
| NB-1 | - c | 4.3 ± 0.3 | 220 ± 15 c | 2.0 | - |
| NB-2 | 20.2 ± 0.8 | 4.4 ± 0.4 | 90 ± 9 | 4.8 | 1.0 ± 0.1 |
© 2020 by the authors. Licensee MDPI, Basel, Switzerland. This article is an open access article distributed under the terms and conditions of the Creative Commons Attribution (CC BY) license (http://creativecommons.org/licenses/by/4.0/).
Share and Cite
Kusio, J.; Sitkowska, K.; Konopko, A.; Litwinienko, G. Hydroxycinnamyl Derived BODIPY as a Lipophilic Fluorescence Probe for Peroxyl Radicals. Antioxidants 2020, 9, 88. https://doi.org/10.3390/antiox9010088
Kusio J, Sitkowska K, Konopko A, Litwinienko G. Hydroxycinnamyl Derived BODIPY as a Lipophilic Fluorescence Probe for Peroxyl Radicals. Antioxidants. 2020; 9(1):88. https://doi.org/10.3390/antiox9010088
Chicago/Turabian StyleKusio, Jaroslaw, Kaja Sitkowska, Adrian Konopko, and Grzegorz Litwinienko. 2020. "Hydroxycinnamyl Derived BODIPY as a Lipophilic Fluorescence Probe for Peroxyl Radicals" Antioxidants 9, no. 1: 88. https://doi.org/10.3390/antiox9010088