Phenolic Profile, Antioxidant Capacities and Enzymatic Inhibitory Activities of Propolis from Different Geographical Areas: Needs for Analytical Harmonization

 ,
,
Abstract
:
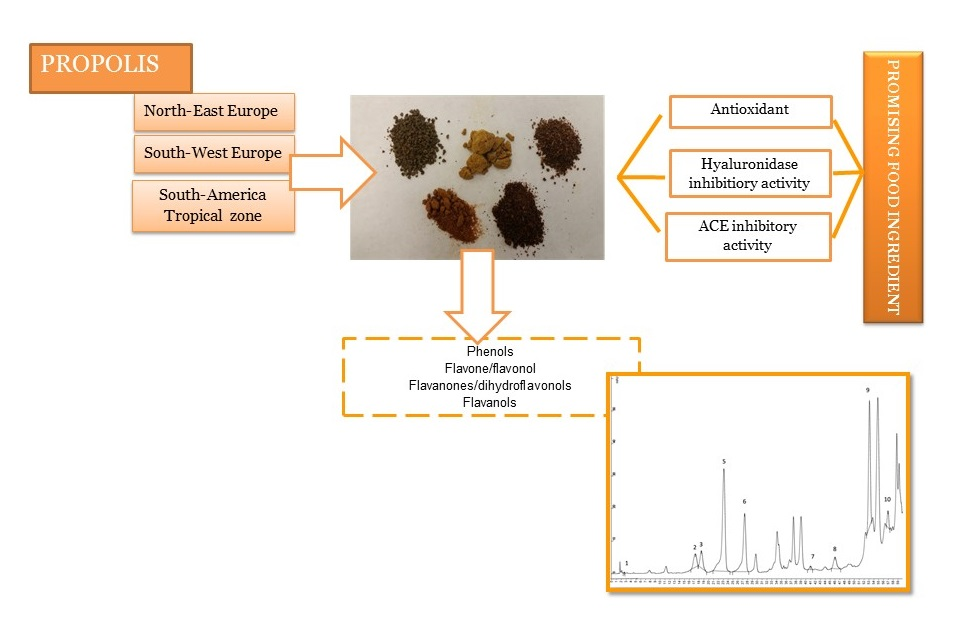
1. Introduction
2. Materials and Methods
3. Results and Discussion
3.1. Total Phenolic Content
3.2. Total Flavonoids Content
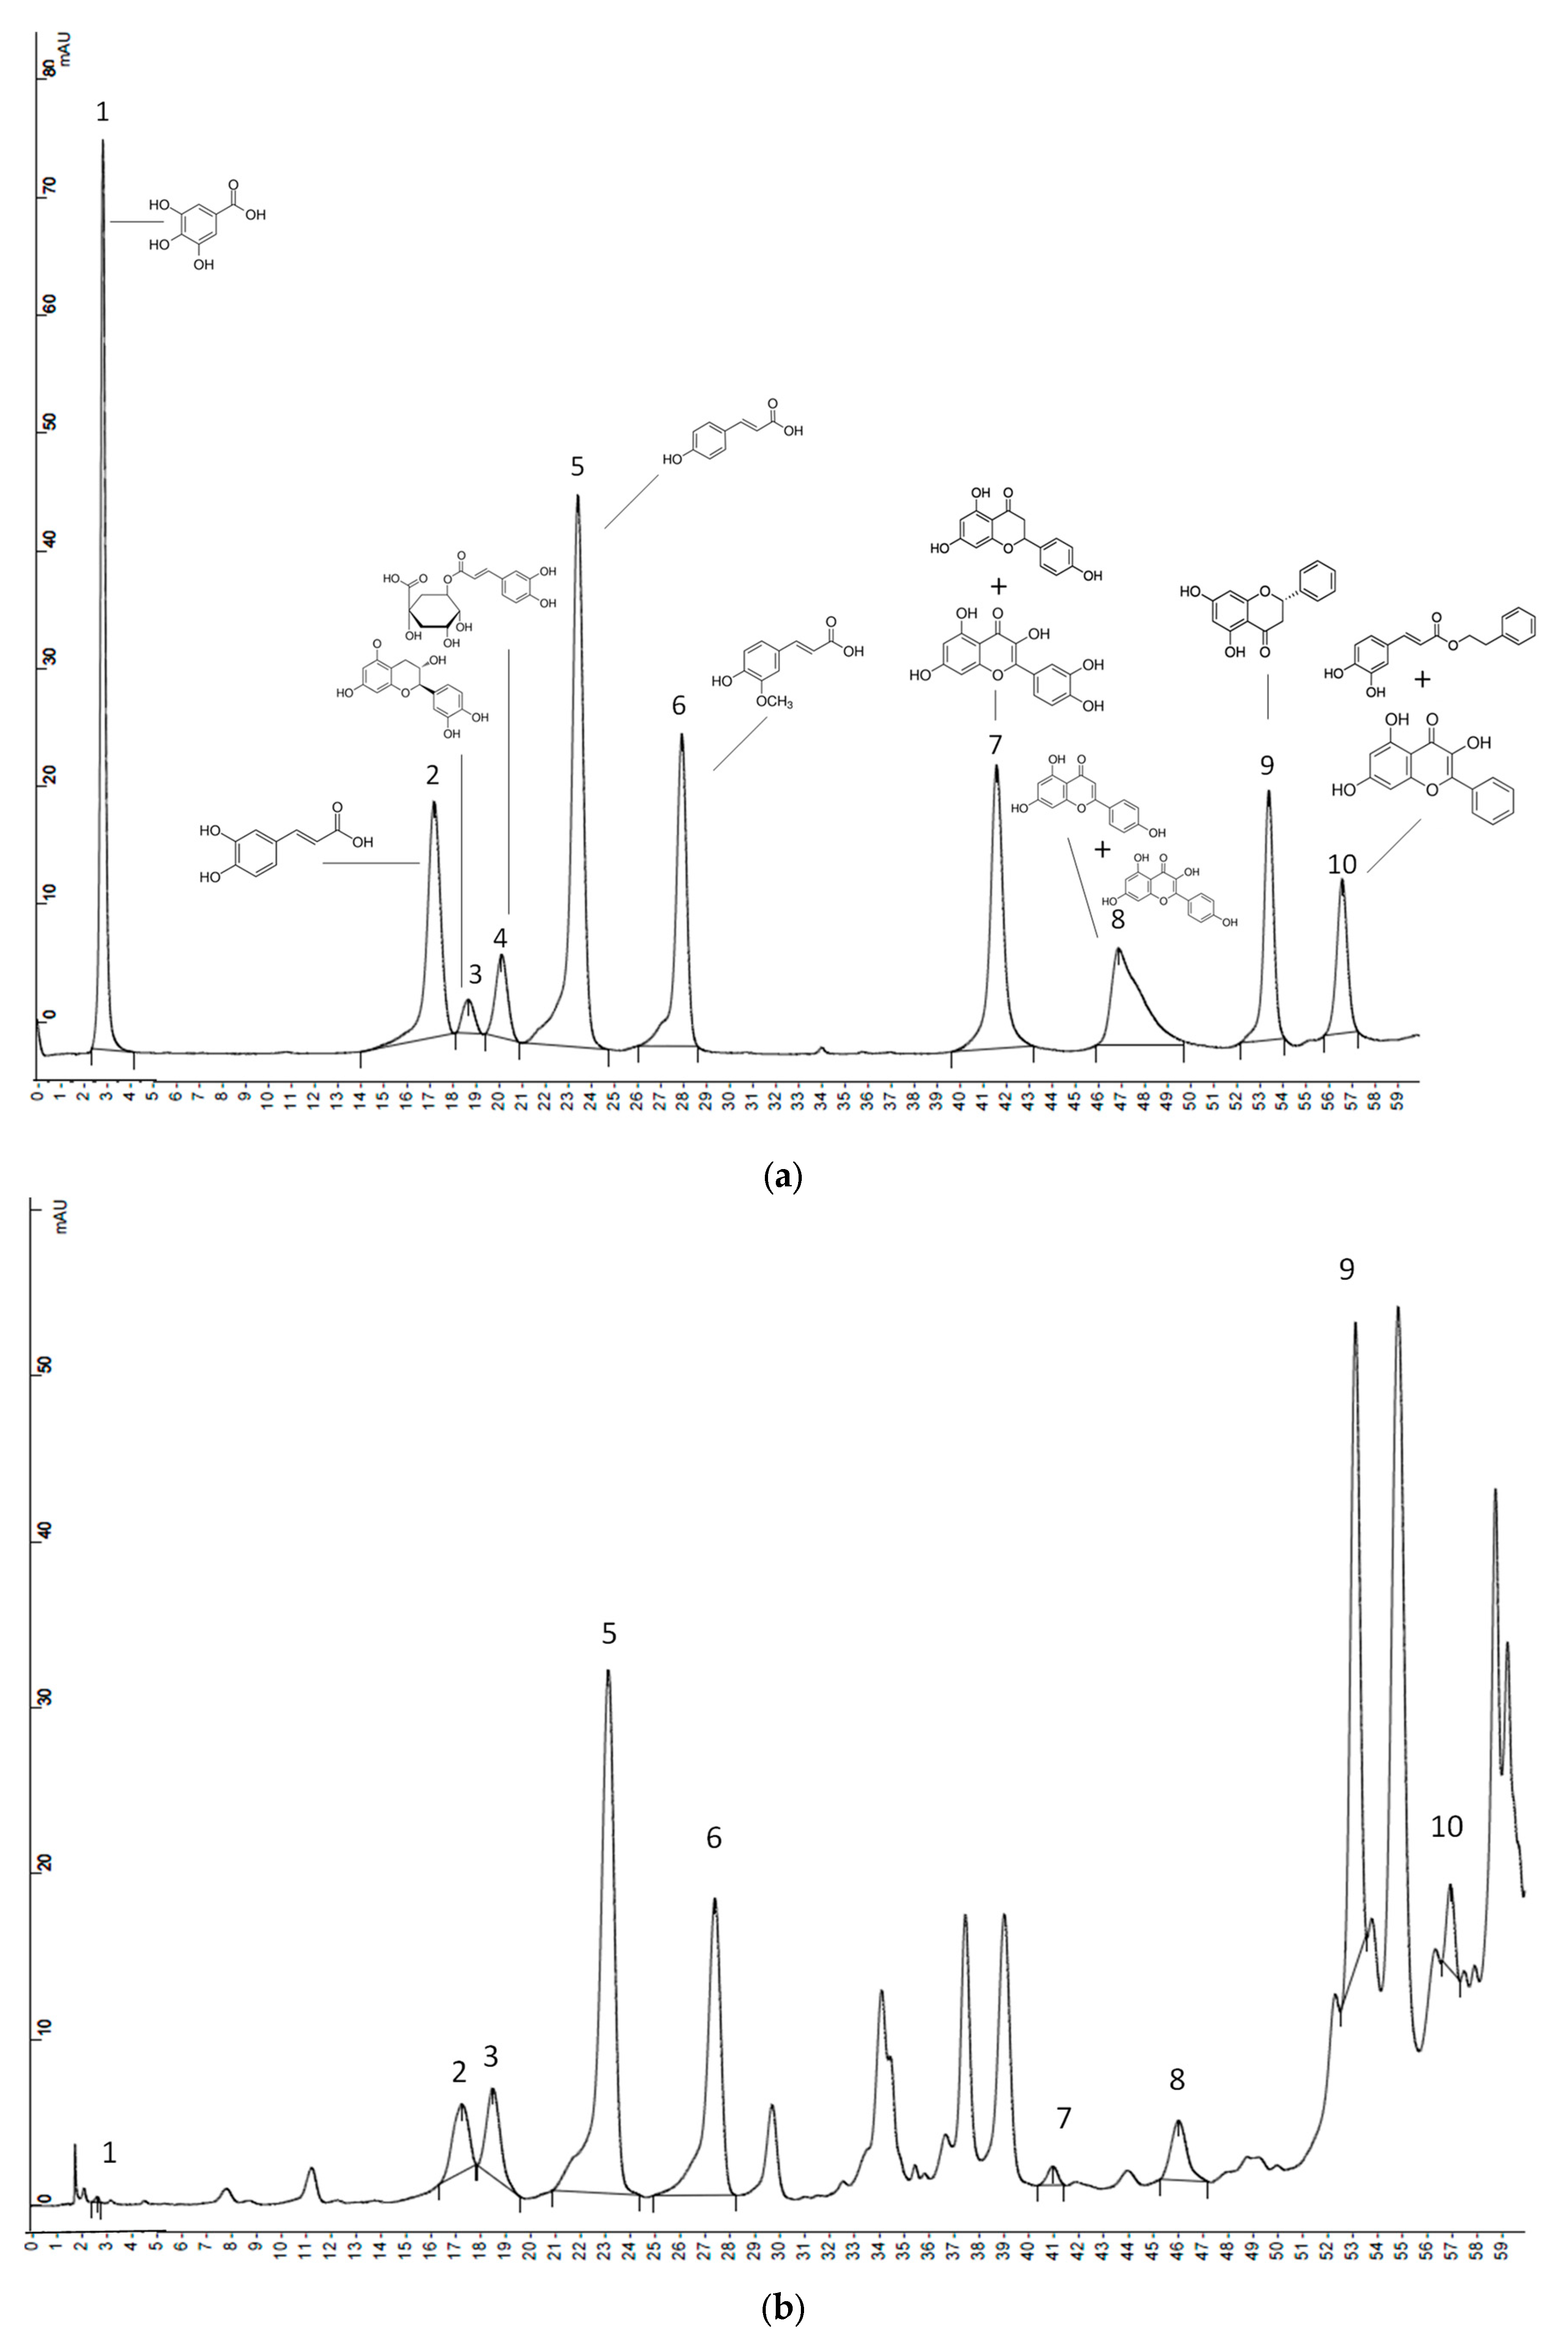
3.3. Quantification of Phenols Compounds Using HPLC-UV
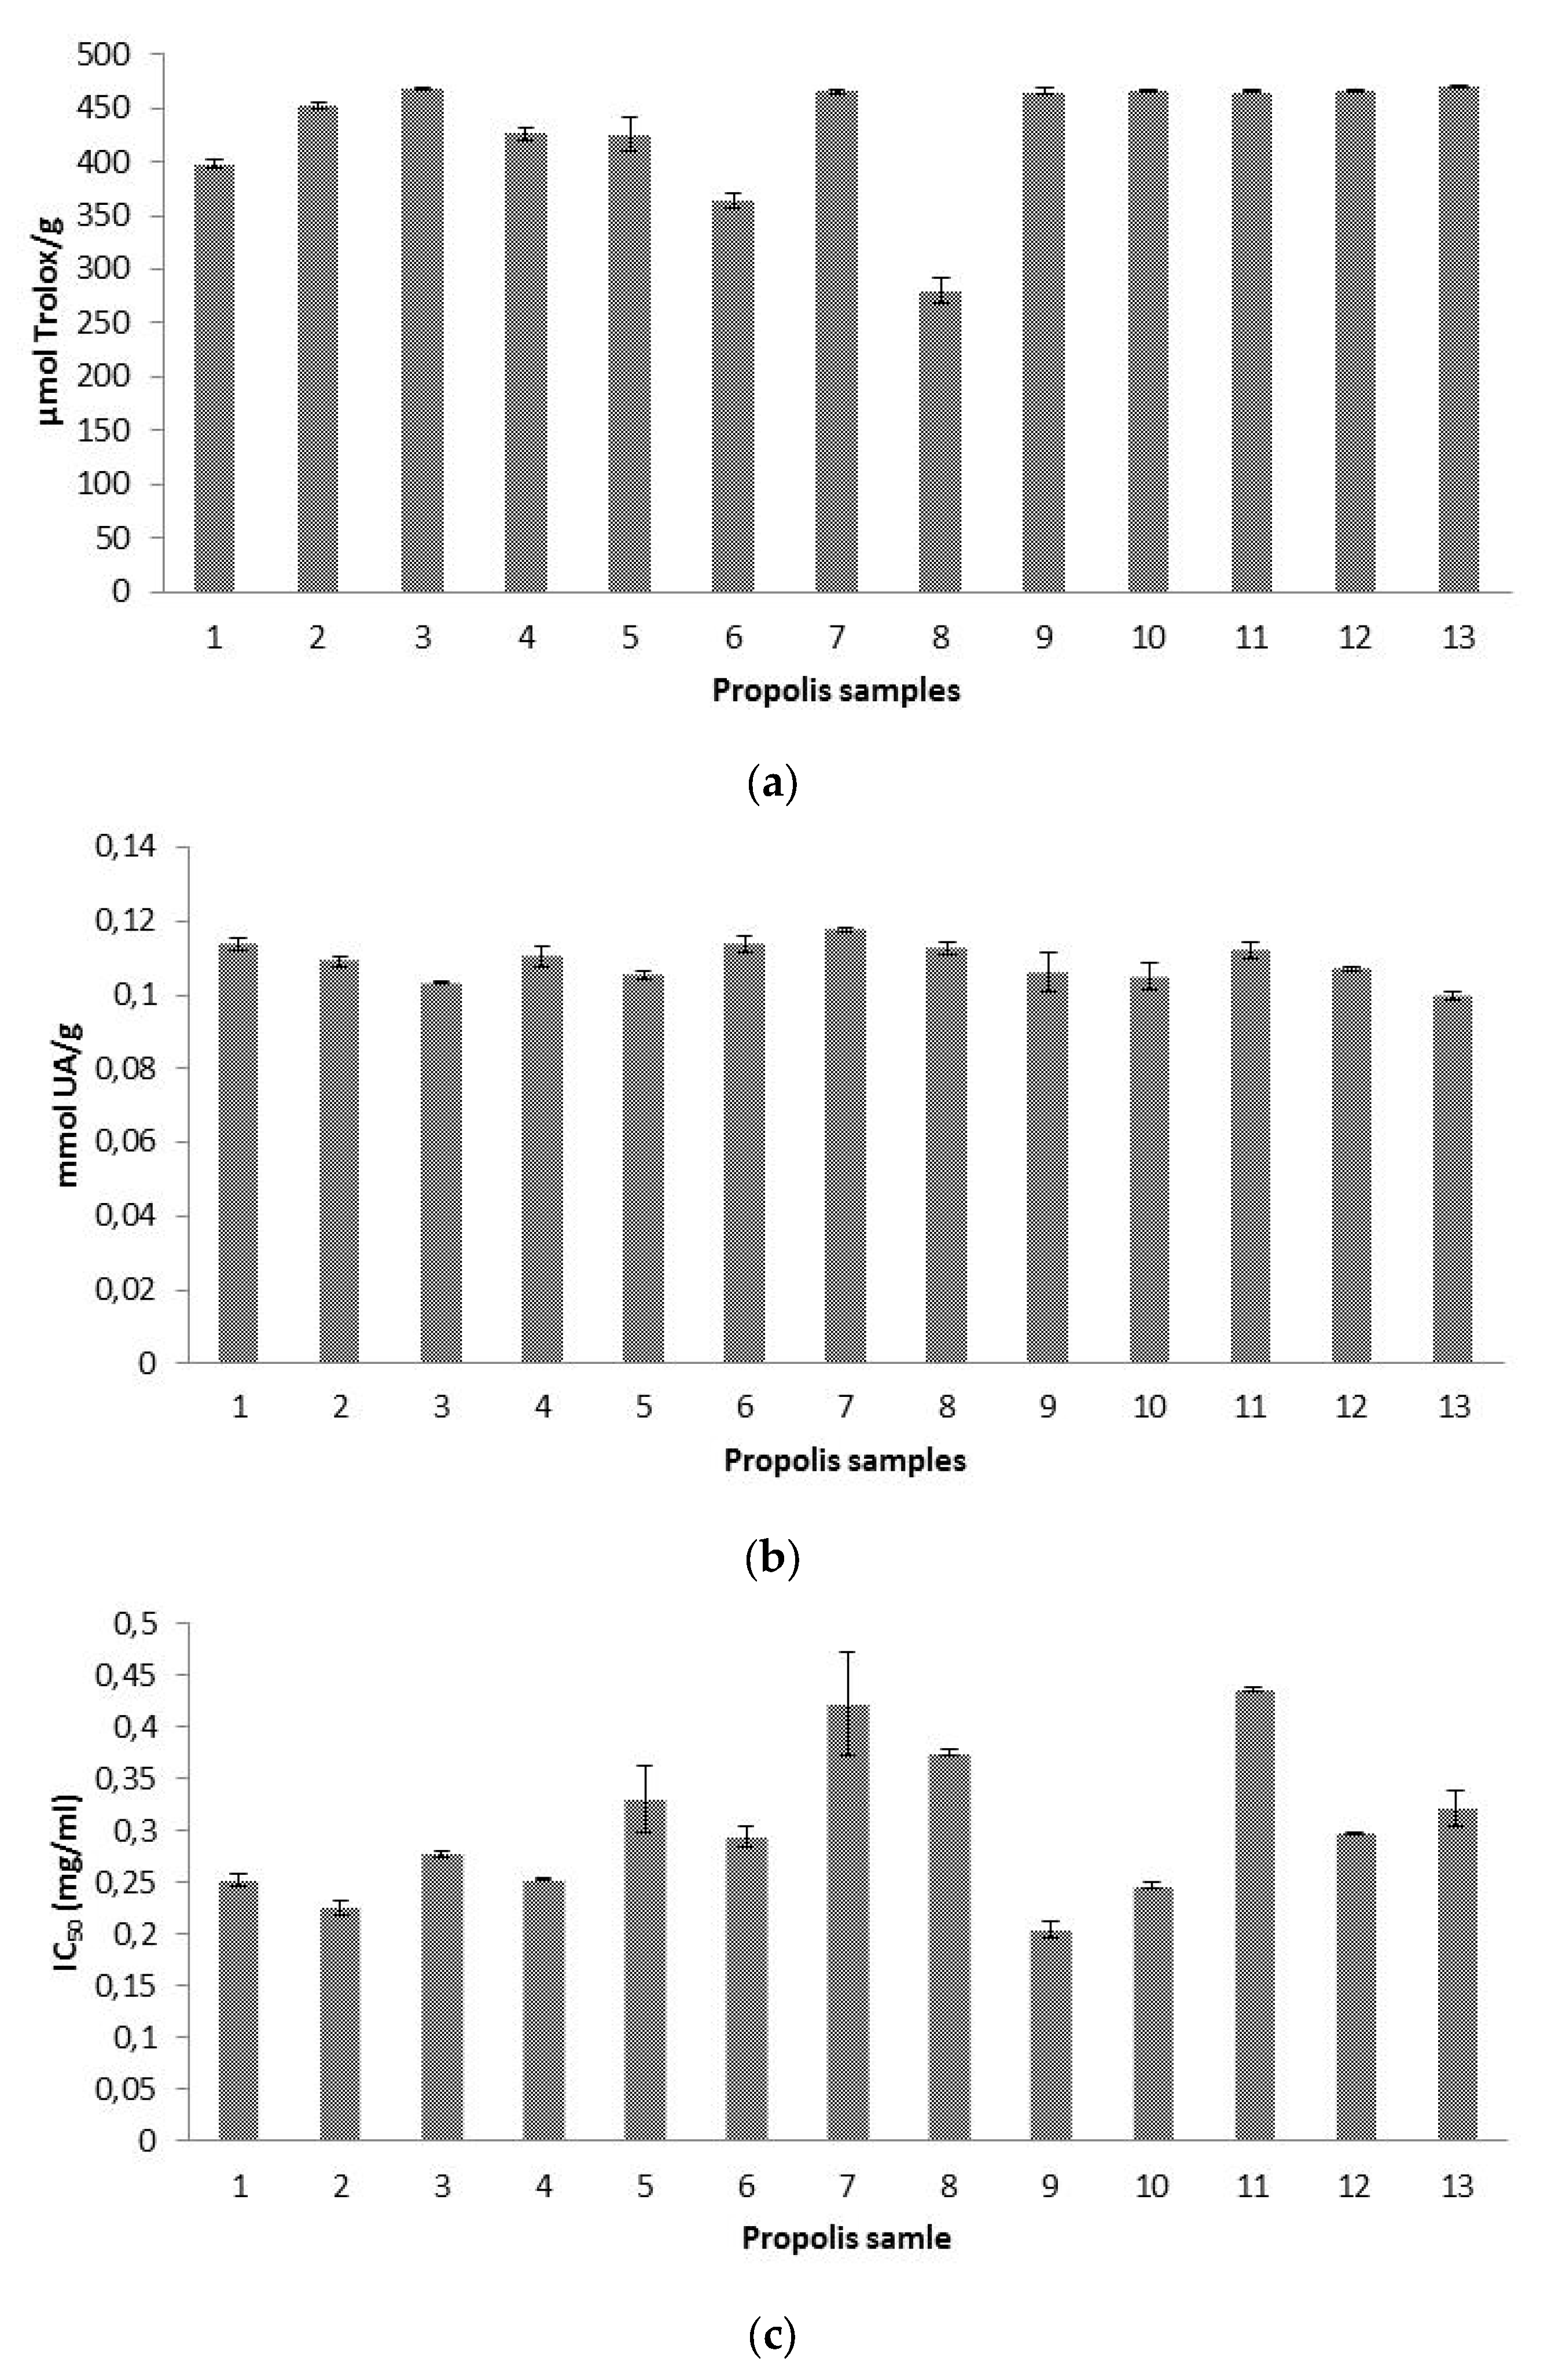
3.4. Antioxidant Capacities
3.4.1. Antioxidant Capacity by ABTS•+ Scavenging Activity Test
3.4.2. Antioxidant Capacity as Radical-Scavenging Effect on Hydroxyl Radicals (AOA Assay)
3.4.3. Antioxidant Capacity as Superoxide Radical-Scavenging Activity
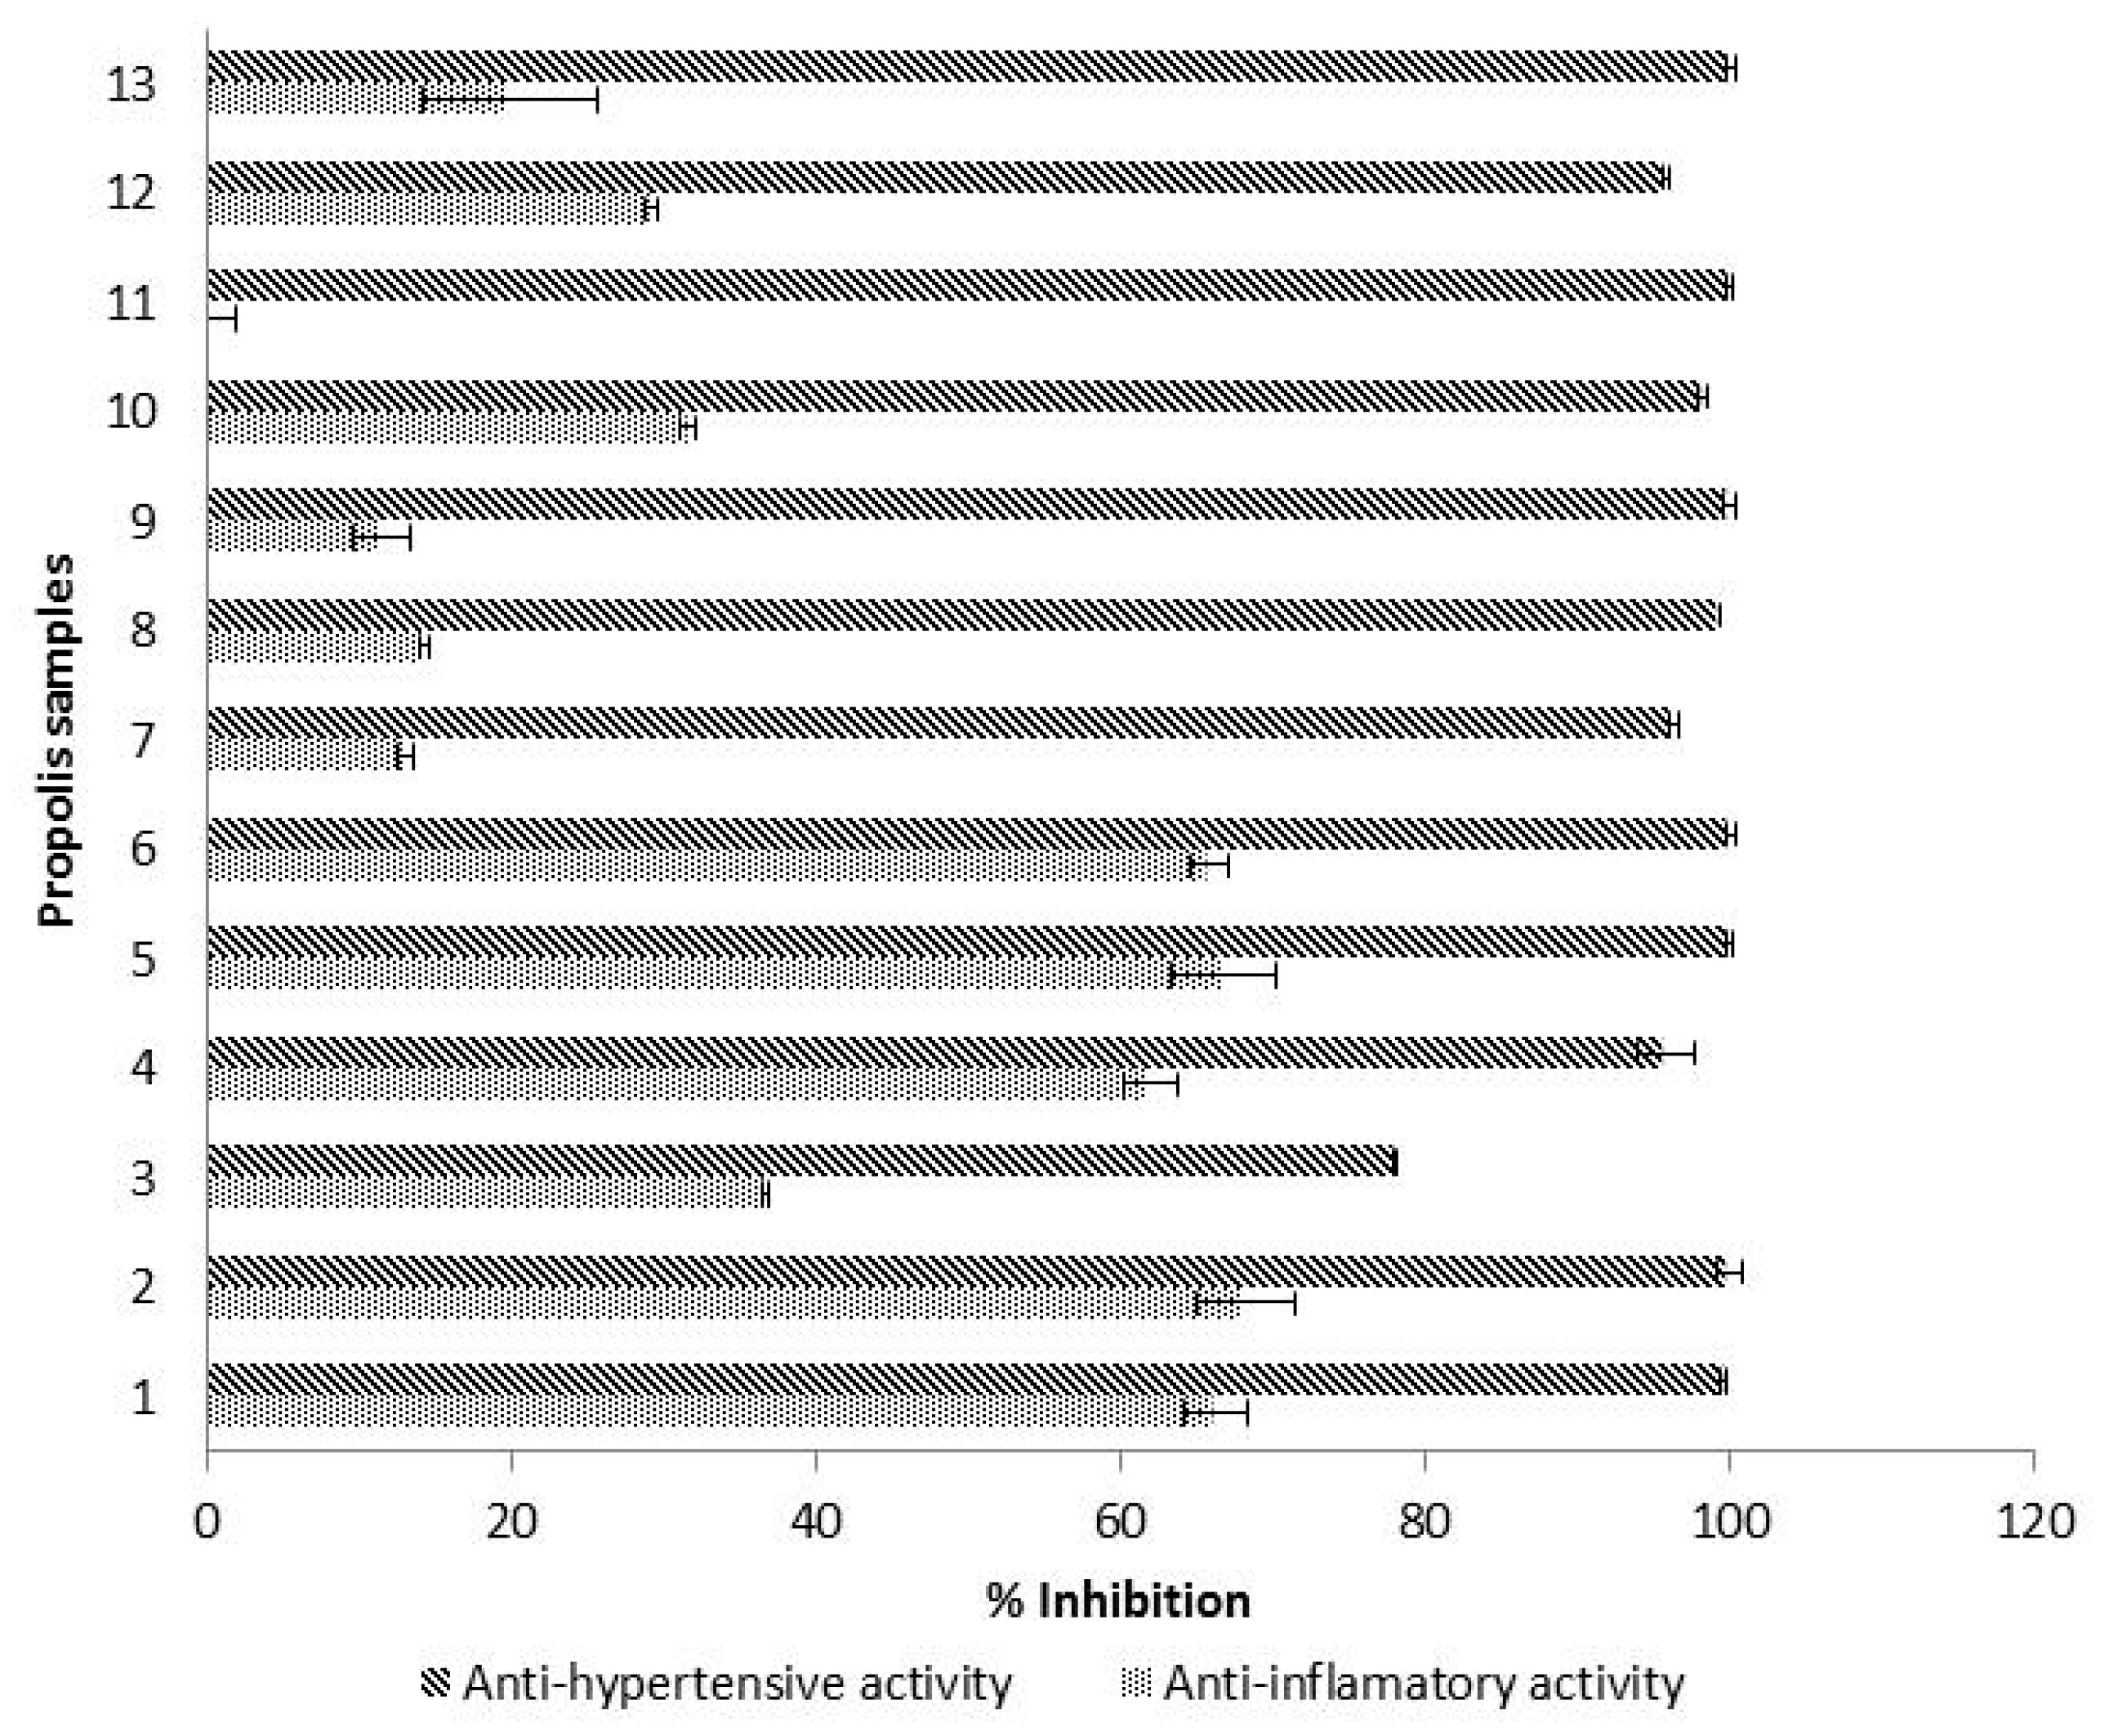
3.5. Hyaluronidase Inhibitory Activity
3.6. ACE Inhibitory Activity
3.7. Correlations
4. Conclusions
Supplementary Materials
Author Contributions
Funding
Acknowledgments
Conflicts of Interest
References
- Bankova, V. Recent trends and important developments in propolis research. eCAM 2005, 2, 29–32. [Google Scholar] [CrossRef] [PubMed] [Green Version]
- Bogdanov, S.; Bankova, V. Propolis: Origin, Production, Composition. The Propolis Book, Chapter 1. 2017. Available online: http://www.bee-hexagon.net (accessed on 11 April 2019).
- Jerković, I.; Mastelić, J. Volatile compounds from leaf-buds of Populus nigra L. (Salicaceae). Phytochemistry 2003, 63, 109–113. [Google Scholar] [CrossRef]
- Salatino, A.; Teixeira, E.W.; Negri, G.; Message, D. Origin and chemical variation of Brazilian propolis. Evid.-Based Complement. Altern. Med. 2005, 2, 33–38. [Google Scholar] [CrossRef] [PubMed] [Green Version]
- Kumazawa, S.; Hamasaka, T.; Nakayama, T. Antioxidant activity of propolis of various geographic origins. Food Chem. 2004, 84, 329–339. [Google Scholar] [CrossRef]
- Bogdanov, S. Propolis: Biological Properties and Medical Applications. The Propolis Book, Chapter 2. 2017. Available online: http://www.bee-hexagon.net (accessed on 10 January 2019).
- Mehta, J.; Rayalam, S.; Wang, X. Cytoprotective effects of natural compounds against oxidative stress. Antioxidant 2018, 7, 147. [Google Scholar] [CrossRef] [Green Version]
- Karapetsas, A.; Voulgaridou, G.P.; Konialis, M.; Tsochantaridis, I.; Kynigopoulos, S.; Lambropoulou, M.; Stavropoulou, M.I.; Stathopoulou, K.; Aligiannis, N.; Bozidis, P.; et al. Propolis extracts inhibit UV-induced photodamage in human experimental in vitro skin models. Antioxidant 2017, 8, 125. [Google Scholar] [CrossRef] [Green Version]
- Oršolić, N.; Jurčević, I.L.; Đikić, D.; Rogić, D.; Odeh, D.; Balta, V.; Junaković, E.P.; Terzić, S.; Jutrić, D. Effect of propolis on diet-induced hyperlipidemia and atherogenic indices in mice. Antioxidant 2019, 8, 156. [Google Scholar] [CrossRef] [Green Version]
- Bankova, V.; Popova, M.; Trusheva, B. New emerging fields of application of propolis. Maced. J. Chem. Chem. Eng. 2016, 35, 1–11. [Google Scholar] [CrossRef]
- European Commission. 2017. Available online: http://ec.europa.eu/food/safety/labelling_nutrition/claims /register/public/?event=search (accessed on 12 June 2019).
- Prior, R.L.; Wu, X.; Schaich, K. Standardized methods for the determination of antioxidant capacity and phenolics in foods and dietary supplements. J. Agric. Food Chem. 2005, 53, 4290–4302. [Google Scholar] [CrossRef]
- Meda, A.; Lamien, C.E.; Romito, M.; Millogo, J.; Nacoulma, O.G. Determination of the total phenolic, flavonoid and proline content in Burkina Fasan honey, as well as their radical scavenging activity. Food Chem. 2005, 91, 571–577. [Google Scholar] [CrossRef]
- Popova, M.; Bankova, V.; Butovska, D.; Petkov, V.; Nikolova-Damyanova, B.; Sabatini, A.G.; Marcazzan, G.L.; Bogdanov, S. Validated methods for the quantification of biologically active constituents of poplar-type propolis. Phytochem. Anal. 2004, 15, 235–240. [Google Scholar] [CrossRef] [PubMed]
- Pękal, A.; Pyrzynska, K. Evaluation of aluminium complexation reaction for flavonoid content assay. Food Anal. Meth. 2014, 7, 1776–1782. [Google Scholar] [CrossRef] [Green Version]
- Falcão, S.I.; Tomás, A.; Vale, N.; Gomes, P.; Freire, C.; Vilas-Boas, M. Phenolic quantification and botanical origin of Portuguese propolis. Ind. Crop. Prod. 2013, 49, 805–812. [Google Scholar] [CrossRef] [Green Version]
- Gargouri, W.; Osés, S.M.; Fernández-Muiño, M.A.; Sancho, M.T.; Kechaour, N. Evaluation of bioactive compounds and biological activities of Tunisian propolis. LWT-Food Sci. Technol. 2019, 111, 328–336. [Google Scholar] [CrossRef]
- Sancho, M.T.; Pascual-Maté, A.; Rodríguez-Morales, E.G.; Osés, S.M.; Escriche, I.; Periche, A.; Fernández-Muiño, M.A. Critical assessment of antioxidant-related parameters of honey. Int. J. Food Sci. Technol. 2016, 51, 30–36. [Google Scholar] [CrossRef]
- Koracevic, D.; Koracevic, G.; Djordjevic, V.; Andrejevic, S.; Cosic, V. Method for the measurement of antioxidant activity in human fluids. J. Clin. Pathol. 2001, 54, 356–361. [Google Scholar] [CrossRef] [Green Version]
- Nagai, T.; Sakai, M.; Inoue, R.; Inoue, H.; Suzuki, N. Antioxidative activities of some commercially honeys, royal jelly, and propolis. Food Chem. 2001, 75, 237–240. [Google Scholar] [CrossRef]
- Ferreres, F.; López, G.; Gil-Izquierdo, A.; Andrade, P.; Sousa, C.; Mouga, T.; Valentao, P. Phlorotannin extracts from fucales characterized by HPLC-DAD-ESI-MSn: Approaches to hyaluronidase inhibitory capacity and antioxidant properties. Mar. Drugs 2012, 10, 2766–2781. [Google Scholar] [CrossRef] [Green Version]
- Gonzalez-Gonzalez, C.R.; Tuohy, K.M.; Jauregi, P. Production of angiotensin-I-converting enzyme (ACE) inhibitory activity in milk fermented with probiotic strains: Effects of calcium, pH and peptides on the ACE-inhibitory activity. Int. Dairy J. 2011, 21, 615–622. [Google Scholar] [CrossRef]
- Feás, X.; Pacheco, L.; Iglesias, A.; Estevinho, L.M. Use of propolis in the sanitization of lettuce. Int. J. Mol. Sci. 2014, 15, 12243–12257. [Google Scholar] [CrossRef] [Green Version]
- Woisky, R.G.; Salatino, A. Analysis of propolis: Some parameters and procedures for chemical quality control. J. Apic. Res. 1998, 37, 99–105. [Google Scholar] [CrossRef]
- Osés, S.M.; Pascual-Maté, A.; Fernández-Muiño, M.A.; López-Díaz, T.M.; Sancho, M.T. Bioactive properties of honey with propolis. Food Chem. 2016, 196, 1215–1223. [Google Scholar] [CrossRef] [PubMed]
- Serra-Bonvehí, J.; Lacalle-Gutiérrez, A. Antioxidant activity and total phenolics of propolis from the Basque country (Northeastern Spain). J. Am. Oil Chem. Soc. 2011, 88, 1387–1395. [Google Scholar] [CrossRef]
- Socha, R.; Galkowska, D.; Bugaj, M.; Juszczak, L. Phenolic composition and antioxidant activity of propolis from various regions of Poland. Nat. Prod. Res. 2015, 29, 416–422. [Google Scholar] [CrossRef]
- Yang, H.; Dong, Y.; Du, H.; Shi, H.; Peng, Y.; Li, X. Antioxidant compounds from propolis collected in Anhui, China. Molecules 2011, 16, 3444–3455. [Google Scholar] [CrossRef]
- Miguel, M.D.G.; Nunes, S.; Dandlen, S.A.; Cavaco, A.M.; Antunes, M.D. Phenols and antioxidant activity of hydro-alcoholic extracts of propolis from Algarve, South of Portugal. Food Chem. Toxicol. 2010, 48, 3418–3423. [Google Scholar] [CrossRef]
- Mavri, A.; Abramovič, H.; Polak, T.; Bertoncelj, J.; Jamnik, P.; Možina, S.S.; Jeršek, B. Chemical properties and antioxidant and antimicrobial activities of Slovenian propolis. Chem. Biodivers. 2012, 9, 1545–1558. [Google Scholar] [CrossRef]
- Miguel, M.D.G.; Doughmi, O.; Aazza, S.; Antunes, D.; Lyoussi, B. Antioxidant, anti-inflammatory and acetylcholinesterase inhibitory activities of propolis from different regions of Morocco. Food Sci. Biotechnol. 2014, 23, 313–322. [Google Scholar] [CrossRef]
- Kalogeropoulos, N.; Konteles, S.J.; Troullidou, E.; Mourtzinos, I.; Karathanos, V.T. Chemical composition, antioxidant activity and antimicrobial properties of propolis extracts from Greece and Cyprus. Food Chem. 2009, 116, 452–461. [Google Scholar] [CrossRef]
- Falcão, S.I.; Vale, N.; Cos, P.; Gomes, P.; Freire, C.; Maes, L.; Vilas-Boas, M. In vitro evaluation of Portuguese propolis and floral sources for antiprotozoal, antibacterial and antifungal activity. Phytother. Res. 2013, 28, 437–443. [Google Scholar] [CrossRef]
- Coelho, J.; Falcão, S.I.; Vale, N.; Almeida-Muradian, L.B.; Vilas-Boas, M. Phenolic composition and antioxidant activity assessment of southeastern and south Brazilian propolis. J. Apic. Res. 2017, 56, 21–31. [Google Scholar] [CrossRef] [Green Version]
- Bankova, V.; Bertelli, D.; Borba, R.; Conti, B.J.; da Silva Cunha, I.B.; Danert, C.; Eberlin, M.N.; Falcão, S.I.; Isla, M.I.; Moreno, M.I.N.M.; et al. Standard methods for Apis mellifera propolis research. J. Apic. Res. 2016, 58, 1–49. [Google Scholar] [CrossRef] [Green Version]
- Miguel, M.G.; Nunes, S.; Dandlen, S.A.; Cavaco, A.M.; Antunes, M.D. Phenols, flavonoids and antioxidant activity of aqueous and methanolic extracts of propolis (Apis mellifera L.) from Algarve, South Portugal. Food Sci. Technol. 2014, 34, 16–23. [Google Scholar] [CrossRef] [Green Version]
- Dubero-Sime, M.A.; Redi-Abshiro, M.; Zewde, T. Total phenols and antioxidant activities of natural honeys and propolis collected from different geographical regions of Ethiopia. Bull. Chem. Soc. Ethiop. 2015, 29, 163–172. [Google Scholar] [CrossRef] [Green Version]
- Auamcharoen, W.; Phankaew, C. Antibacterial activity and phenolic content of propolis from four different areas of Thailand. Int. J. Pharm. Sci. Rev. Res. 2016, 37, 77–82. [Google Scholar]
- Molnár, S.; Mikuska, K.; Patonay, K.; Sisa, K.; Daood, H.G.; Némedi, E.; Kiss, A. Comparative studies on polyphenolic profile and antimicrobial activity of propolis samples selected from distinctive geographical areas of Hungary. Food Sci. Technol. Int. 2017, 23, 349–357. [Google Scholar] [CrossRef]
- Okińczyc, P.; Szumny, A.; Szperlik, J.; Kulma, A.; Franiczek, R.; Żbikowska, B.; Krzyżanowska, B.; Sroka, Z. Profile of polyphenolic and essential oil composition of Polish propolis, black poplar and aspens buds. Molecules 2018, 23, 1262. [Google Scholar] [CrossRef] [Green Version]
- Escriche, I.; Juan-Borrás, M. Standardizing the analysis of phenolic profile in propolis. Food Res. Int. 2018, 106, 834–841. [Google Scholar] [CrossRef]
- Gardini, S.; Bertelli, D.; Marchetti, L.; Graziosi, R.; Pinetti, D.; Plessi, M.; Marcazzan, G.L. Chemical composition of Italian propolis of different ecoregional origin. J. Apic. Res. 2018, 57, 639–647. [Google Scholar] [CrossRef]
- Kumazawa, S.; Serrra Bonvehí, J.; Torres, C.; Mok-Ryeon, A.; Orantes Bermejo, F.J. Chemical and functional characterization of propolis collected from east Andalusia (Southern Spain). Phytochem. Anal. 2013, 24, 608–615. [Google Scholar] [CrossRef]
- Regueira Neto, M.S.; Tintino, S.R.; Pereira da Silva, A.R.; Costa, M.S.; Boligon, A.A.; Maties, E.F.F.; de Queiroz, V.; Menezes, I.R.A.; Melo, H.D. Seasonal variation of Brazilian red propolis: Antibacterial activity, synergistic effect and phytochemical sreening. Food Chem. Toxicol. 2017, 107, 572–580. [Google Scholar] [CrossRef] [PubMed]
- Calegari, M.A.; Prasniewski, A.; Da Silva, C.; Sado, R.Y.; Maia, F.M.C.; Tonial, L.M.S.; Oldoni, T.L.C. Propolis from Southwest of Parana produced by selected bees: Influence of seasonality and food supplementation of antioxidant activity and phenolic profile. An. Acad. Bras. Cienc. 2017, 89, 45–55. [Google Scholar] [CrossRef] [PubMed] [Green Version]
- Kurek-Górecka, A.; Rzepecka-Stojko, A.; Górecki, M.; Stojko, J.; Sosada, M.; Świerczek-Zięba, G. Structure and antioxidant activity of polyphenols derived from propolis. Molecules 2014, 19, 78–101. [Google Scholar] [CrossRef] [Green Version]
- Nagai, T.; Inoue, R.; Kanamori, N.; Suzuki, N.; Nagashima, T. Characterization of honey from different floral sources. Its functional properties and effect of honey species on storage of meat. Food Chem. 2006, 97, 256–262. [Google Scholar] [CrossRef]
- Marquele, F.D.; Di Mambro, V.M.; Georgetti, S.R.; Casagrande, R.; Valim, Y.M.L.; Fonseca, M.J.V. Assessment of the antioxidant activities of Brazilian extracts of propolis alone and in topical pharmaceutical formulations. J. Pharm. Biomed. Anal. 2005, 39, 455–462. [Google Scholar] [CrossRef] [PubMed]
- Nagai, T.; Inoue, R.; Inoue, H.; Suzuki, N. Preparation and antioxidant properties of water extract of propolis. Food Chem. 2003, 80, 29–33. [Google Scholar] [CrossRef]
- Libby, P.; Ridker, P.M.; Maseri, A. Inflammation and atherosclerosis. Circulation 2002, 105, 1135–1143. [Google Scholar] [CrossRef]
- Silva, J.C.; Rodrigues, S.; Feás, X.; Estevinho, L.M. Antimicrobial activity, phenolic profile and role in the inflammation of propolis. Food Chem. Toxicol. 2012, 50, 1790–1795. [Google Scholar] [CrossRef]
- Ferreira Campos, J.; Pereira dos Santos, U.; dos Santos da Rocha, P.; Damião, M.J.; Perrella Balestieri, J.B.; Lima Cardoso, C.A.; Paredes-Gamero, E.J.; Estevinho, L.M.; de Picoli Souza, K.; dos Santos, E.L. Antimicrobial, antioxidant, anti-inflammatory, and cytotoxic activities of propolis from the stingless bee Tetragonisca fiebrigi (Jataí). Evid.-Based Complement. Altern. Med. 2015, 2015, 296186. [Google Scholar] [CrossRef] [Green Version]
- León-Ruiz, V.; González-Porto, A.V.; Al-Habsi, N.; Vera, S.; San Andrés, M.P.; Jauregi, P. Antioxidant, antibacterial and ACE-inhibitory activity of four monofloral honeys in relation to their chemical composition. Food Funct. 2013, 4, 1617–1624. [Google Scholar] [CrossRef]
- Nagai, T.; Tanoue, Y.; Kai, N.; Suzuki, N. Functional Property of Honey from Echium vulgare. Food Nutr. Sci. 2012, 3, 614–620. [Google Scholar] [CrossRef] [Green Version]
- Li, G.H.; Liu, H.; Shi, Y.H.; Le, G.W. Direct spectrophotometric measurement of angiotensin I-converting enzyme inhibitory activity for screening bioactive peptides. J. Pharm. Biomed. Anal. 2005, 37, 219–224. [Google Scholar] [CrossRef] [PubMed]
- Nho, J.W.; Hwang, I.G.; Kim, H.Y.; Lee, Y.R.; Woo, K.S.; Hwang, B.Y.; Chang, S.J.; Lee, J.; Jeong, H.S. Free radical scavenging, angiotensin I-converting enzyme (ACE) inhibitory, and in vitro anticancer activities of ramie (Boehmeria nivea) leaves extracts. Food Sci. Biotechnol. 2010, 19, 383–390. [Google Scholar] [CrossRef]
- Vercruysse, L.; Van Camp, J.; Smagghe, G. ACE inhibitory peptides derived from enzymatic hydrolysates of animal muscle protein: A review. J. Agric. Food Chem. 2005, 53, 8106–8115. [Google Scholar] [CrossRef] [PubMed]
- Ding, L.; Zhang, Y.; Jiang, Y.; Wang, L.; Liu, B.; Liu, J. Transport of egg white ACE-inhibitory peptide, Gln-Ile-Gly-Leu-Phe, in human intestinal Caco-2 cell monolayers with cytoprotective effect. J. Agric. Food Chem. 2014, 62, 3177–3182. [Google Scholar] [CrossRef] [PubMed]
- Lee, J.S.; Mi, A.Y.; Koo, S.H.; Baek, H.H.; Lee, H.G. Antioxidant and ACE inhibitory activities of soybean hydrolysates: Effect of enzyme and degree of hydrolysis. Food Sci. Biotechnol. 2008, 17, 873–877. [Google Scholar]
- Yu, Y.; Fan, F.; Wu, D.; Yu, C.; Wang, Z.; Du, M. Antioxidant and ACE inhibitory activity of enzymatic hydrolysates from Ruditapes philippinarum. Molecules 2018, 23, 1189. [Google Scholar] [CrossRef] [Green Version]
- Zhang, Q.; Song, C.; Zhao, J.; Shi, X.; Sun, M.; Liu, J.; Fu, Y.; Jin, W.; Zhu, B. Separation and characterization of antioxidative and angiotensin converting enzyme inhibitory peptide from jellyfish gonad hydrolysate. Molecules 2018, 23, 94. [Google Scholar] [CrossRef] [Green Version]
- Chen, S.Y.; Chu, C.C.; Chyau, C.C.; Yang, J.W.; Duh, P.D. Djulis (Chenopoliu formosanum) and its bioactive compounds affect vasodilation, angiotensin convertin enzyme activity, and hypertension. Food Biosci. 2019, 32, 100469. [Google Scholar] [CrossRef]
- Maruyama, H.; Sumitou, Y.; Sakamoto, T.; Araki, Y.; Hara, H. Antihypertensive effects of flavonoids isolated from Brazilian green propolis in spontaneously hypertensive rats. Biol. Pharm. Bull. 2009, 32, 1244–1250. [Google Scholar] [CrossRef] [Green Version]
- Balasuriya, N.; Rupasinghe, H.P. Antihypertensive properties of flavonoid-rich apple peel extract. Food Chem. 2012, 135, 2320–2325. [Google Scholar] [CrossRef] [PubMed]
- Seyhan, M.F.; Yilmaz, E.; Timirci-Kahraman, Ö.; Saygili, N.; Kisakesen, H.I.; Gazioğlu, S.; Gören, A.C.; Eronat, A.P.; Ceviz, A.B.; Öztürk, T.; et al. Different propolis samples, phenolic content, and breast cancer cell lines: Variable cytotoxicity ranging from ineffective to potent. IUBMB Life 2019, 71, 619–631. [Google Scholar] [CrossRef] [PubMed]


| Zone | Sample | Gallic Acid | Caffeic Acid | Catechin | Clorogenic Acid | p-Coumaric Acid | Ferulic Acid | Naringenin + Quercetin * | Apigenin + Kaempferol * | Pinocembrin | CAPE + Galangin * |
|---|---|---|---|---|---|---|---|---|---|---|---|
| RT (min) | 2.81 | 17.23 | 18.71 | 20.17 | 23.47 | 27.98 | 41.64 | 46.93 | 53.45 | 56.63 | |
| NE-Europe | 1 | 0.3 ± 0.0 a | 0.7 ± 0.1 a | 29.1 ± 0.5 e | ND | 9.5 ± 0.2 bc | 11.0 ± 0.2 e | 0.4 ± 0.0 a | 4.5 ± 0.1 ab | 4.6 ± 0.3 b | 14.8 ± 0.4 de |
| NE-Europe | 2 | 0.3 ± 0.0 a | 2.2 ± 0.1 b | 19.8 ± 1.1 d | ND | 8.1 ± 0.3 b | 7.9 ± 0.3 d | 0.5 ± 0.0 bc | 15.8 ± 0.9 d | 16.5 ± 0.3 d | 5.8 ± 0.4 ab |
| NE-Europe | 3 | ND | 6.4 ± 0.5 e | 0.9±0.2 a | 1.4 ± 0.7 a | 2.3 ± 0.6 a | 1.4 ± 0.1 abc | 0.4 ± 0.0 a | 12.7 ± 1.1 cd | 56.6 ± 1.1 g | 18.9 ± 1.8 e |
| NE-Europe | 4 | < LQ | 1.6 ± 0.0 b | 32.9 ± 0.0 f | ND | 11.4 ± 0.3 c | 6.0 ± 0.2 d | 0.6 ± 0.0 cd | 0.6 ± 0.9 a | 13.9 ± 0.3 d | 13.3 ± 0.8 cde |
| NE-Europe | 5 | < LQ | 3.5 ± 0.3 c | 3.7 ± 0.4 b | 0.8 ± 0.5 a | 2.9 ± 0.7 a | 3.4 ± 0.3 c | 0.4 ± 0.1 a | 4.1 ± 2.6 ab | 0.4 ± 0.2 a | 71.9 ± 2.7 f |
| NE-Europe | 6 | < LQ | 0.8 ± 0.0 a | 52.1 ± 1.2 g | ND | 7.8 ± 0.2 b | 6.3 ± 0.1 d | 0.6 ± 0.0 cd | 1.4 ± 0.2 a | 9.5 ± 0.8 c | 2.4 ± 0.1 a |
| S America | 7 | 0.3 ± 0.0 a | 0.8 ± 0.0 a | ND | 0.9 ± 0.0 a | 8.1 ± 0.1 b | 0.4 ± 0.0 a | 3.2 ± 0.1 g | 5.5 ± 0.1 ab | 1.3 ± 0.1 a | 18.0 ± 0.7 e |
| S America | 8 | <LQ | <LQ | 20.8 ± 0.1 d | 0.2 ± 0.0 a | 1.2 ± 0.0 a | 0.3 ± 0.0 a | 0.5 ± 0.0 b | 1.5 ± 0.1 a | <LQ | 9.0 ± 0.2 bcd |
| SW-Europe | 9 | ND | ND | 34.1 ± 0.9 f | ND | 2.8 ± 0.1 a | 0.8 ± 0.0 ab | 0.7 ± 0.0 e | 5.6 ± 0.3 ab | 33.3 ± 1.4 f | 7.6 ± 0.5 abc |
| SW-Europe | 10 | ND | 6.0 ± 0.1 e | ND | ND | 2.4 ± 0.0 a | 1.0 ± 0.0 ab | 0.3 ± 0.0 a | 6.3 ± 0.5 abc | 28.3 ± 0.2 e | 13.4 ± 1.0 cde |
| SW-Europe | 11 | <LQ | 6.5 ± 0.3 e | 6.3 ± 1.6 c | 7.3 ± 4.1 b | 12.2 ± 3.2 c | 2.9 ± 0.8 bc | 1.0 ± 0.1 f | 11.4 ± 0.4 bcd | 13.7 ± 0.6 d | 72.0 ± 3.1 f |
| SW-Europe | 12 | ND | 4.6 ± 0.4 d | 1.7 ± 0.4 ab | 0.4 ± 0.3 a | 2.0 ± 0.2 a | 1.9 ± 0.1 abc | 0.4 ± 0.1 a | 32.2 ± 7.4 e | 25.6 ± 2.6 e | 13.0 ± 2.7 cde |
| SW-Europe | 13 | ND | 6.6 ± 0.1 e | ND | ND | 3.0 ± 0.0 a | 2.3 ± 2.8 abc | 0.3 ± 0.0 a | 4.0 ± 0.2 ab | 33.9 ± 1.1 f | 110.6 ± 6.0 g |
© 2020 by the authors. Licensee MDPI, Basel, Switzerland. This article is an open access article distributed under the terms and conditions of the Creative Commons Attribution (CC BY) license (http://creativecommons.org/licenses/by/4.0/).
Share and Cite
Osés, S.M.; Marcos, P.; Azofra, P.; de Pablo, A.; Fernández-Muíño, M.Á.; Sancho, M.T. Phenolic Profile, Antioxidant Capacities and Enzymatic Inhibitory Activities of Propolis from Different Geographical Areas: Needs for Analytical Harmonization. Antioxidants 2020, 9, 75. https://doi.org/10.3390/antiox9010075
Osés SM, Marcos P, Azofra P, de Pablo A, Fernández-Muíño MÁ, Sancho MT. Phenolic Profile, Antioxidant Capacities and Enzymatic Inhibitory Activities of Propolis from Different Geographical Areas: Needs for Analytical Harmonization. Antioxidants. 2020; 9(1):75. https://doi.org/10.3390/antiox9010075
Chicago/Turabian StyleOsés, Sandra M., Patricia Marcos, Patricia Azofra, Ana de Pablo, Miguel Ángel Fernández-Muíño, and M. Teresa Sancho. 2020. "Phenolic Profile, Antioxidant Capacities and Enzymatic Inhibitory Activities of Propolis from Different Geographical Areas: Needs for Analytical Harmonization" Antioxidants 9, no. 1: 75. https://doi.org/10.3390/antiox9010075