Salivary FRAP as A Marker of Chronic Kidney Disease Progression in Children

 ,
,  ,
,
Abstract
:1. Introduction
2. Material and Methods
2.1. Ethical Issues
2.2. Patients
2.3. Saliva Collection
2.4. Dental Examination
2.5. Plasma and Urine Collection
2.6. Total Protein Assay
2.7. FRAP Assay
2.8. Statistical Analysis
3. Results
3.1. Salivary Gland Function and Dental Examination
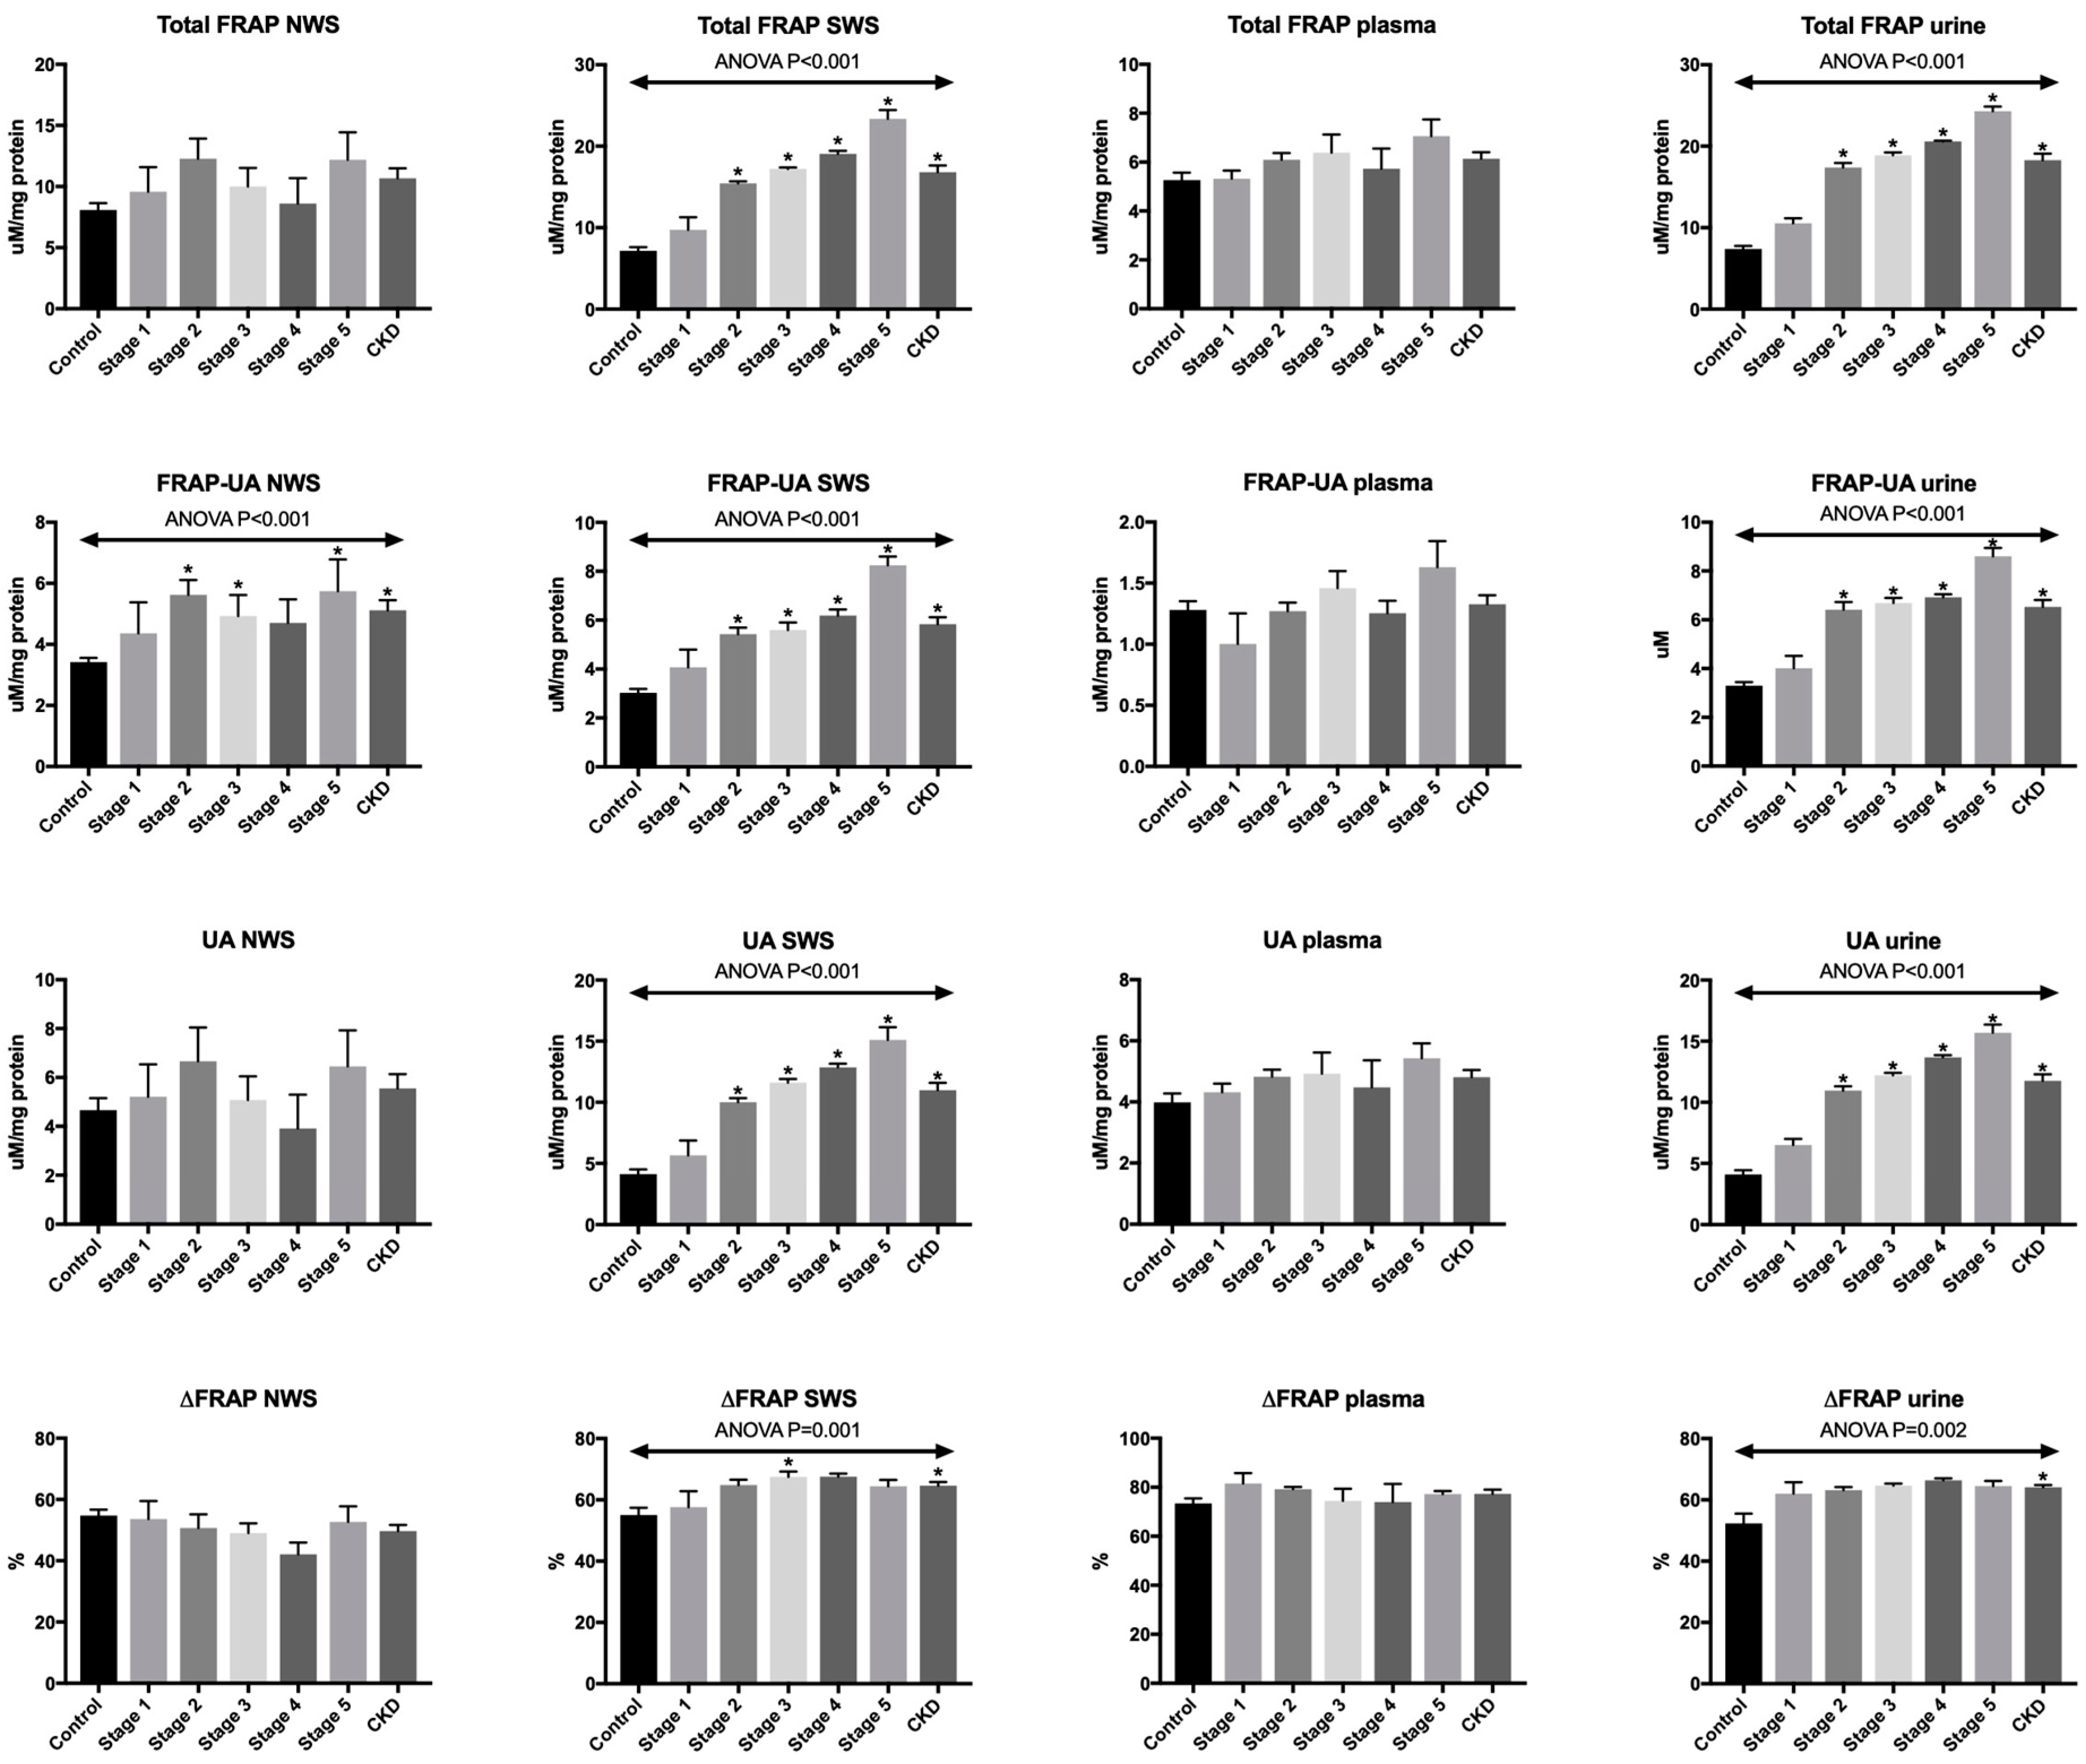
3.2. Total FRAP
3.3. FRAP-UA
3.4. UA
3.5. ΔFRAP
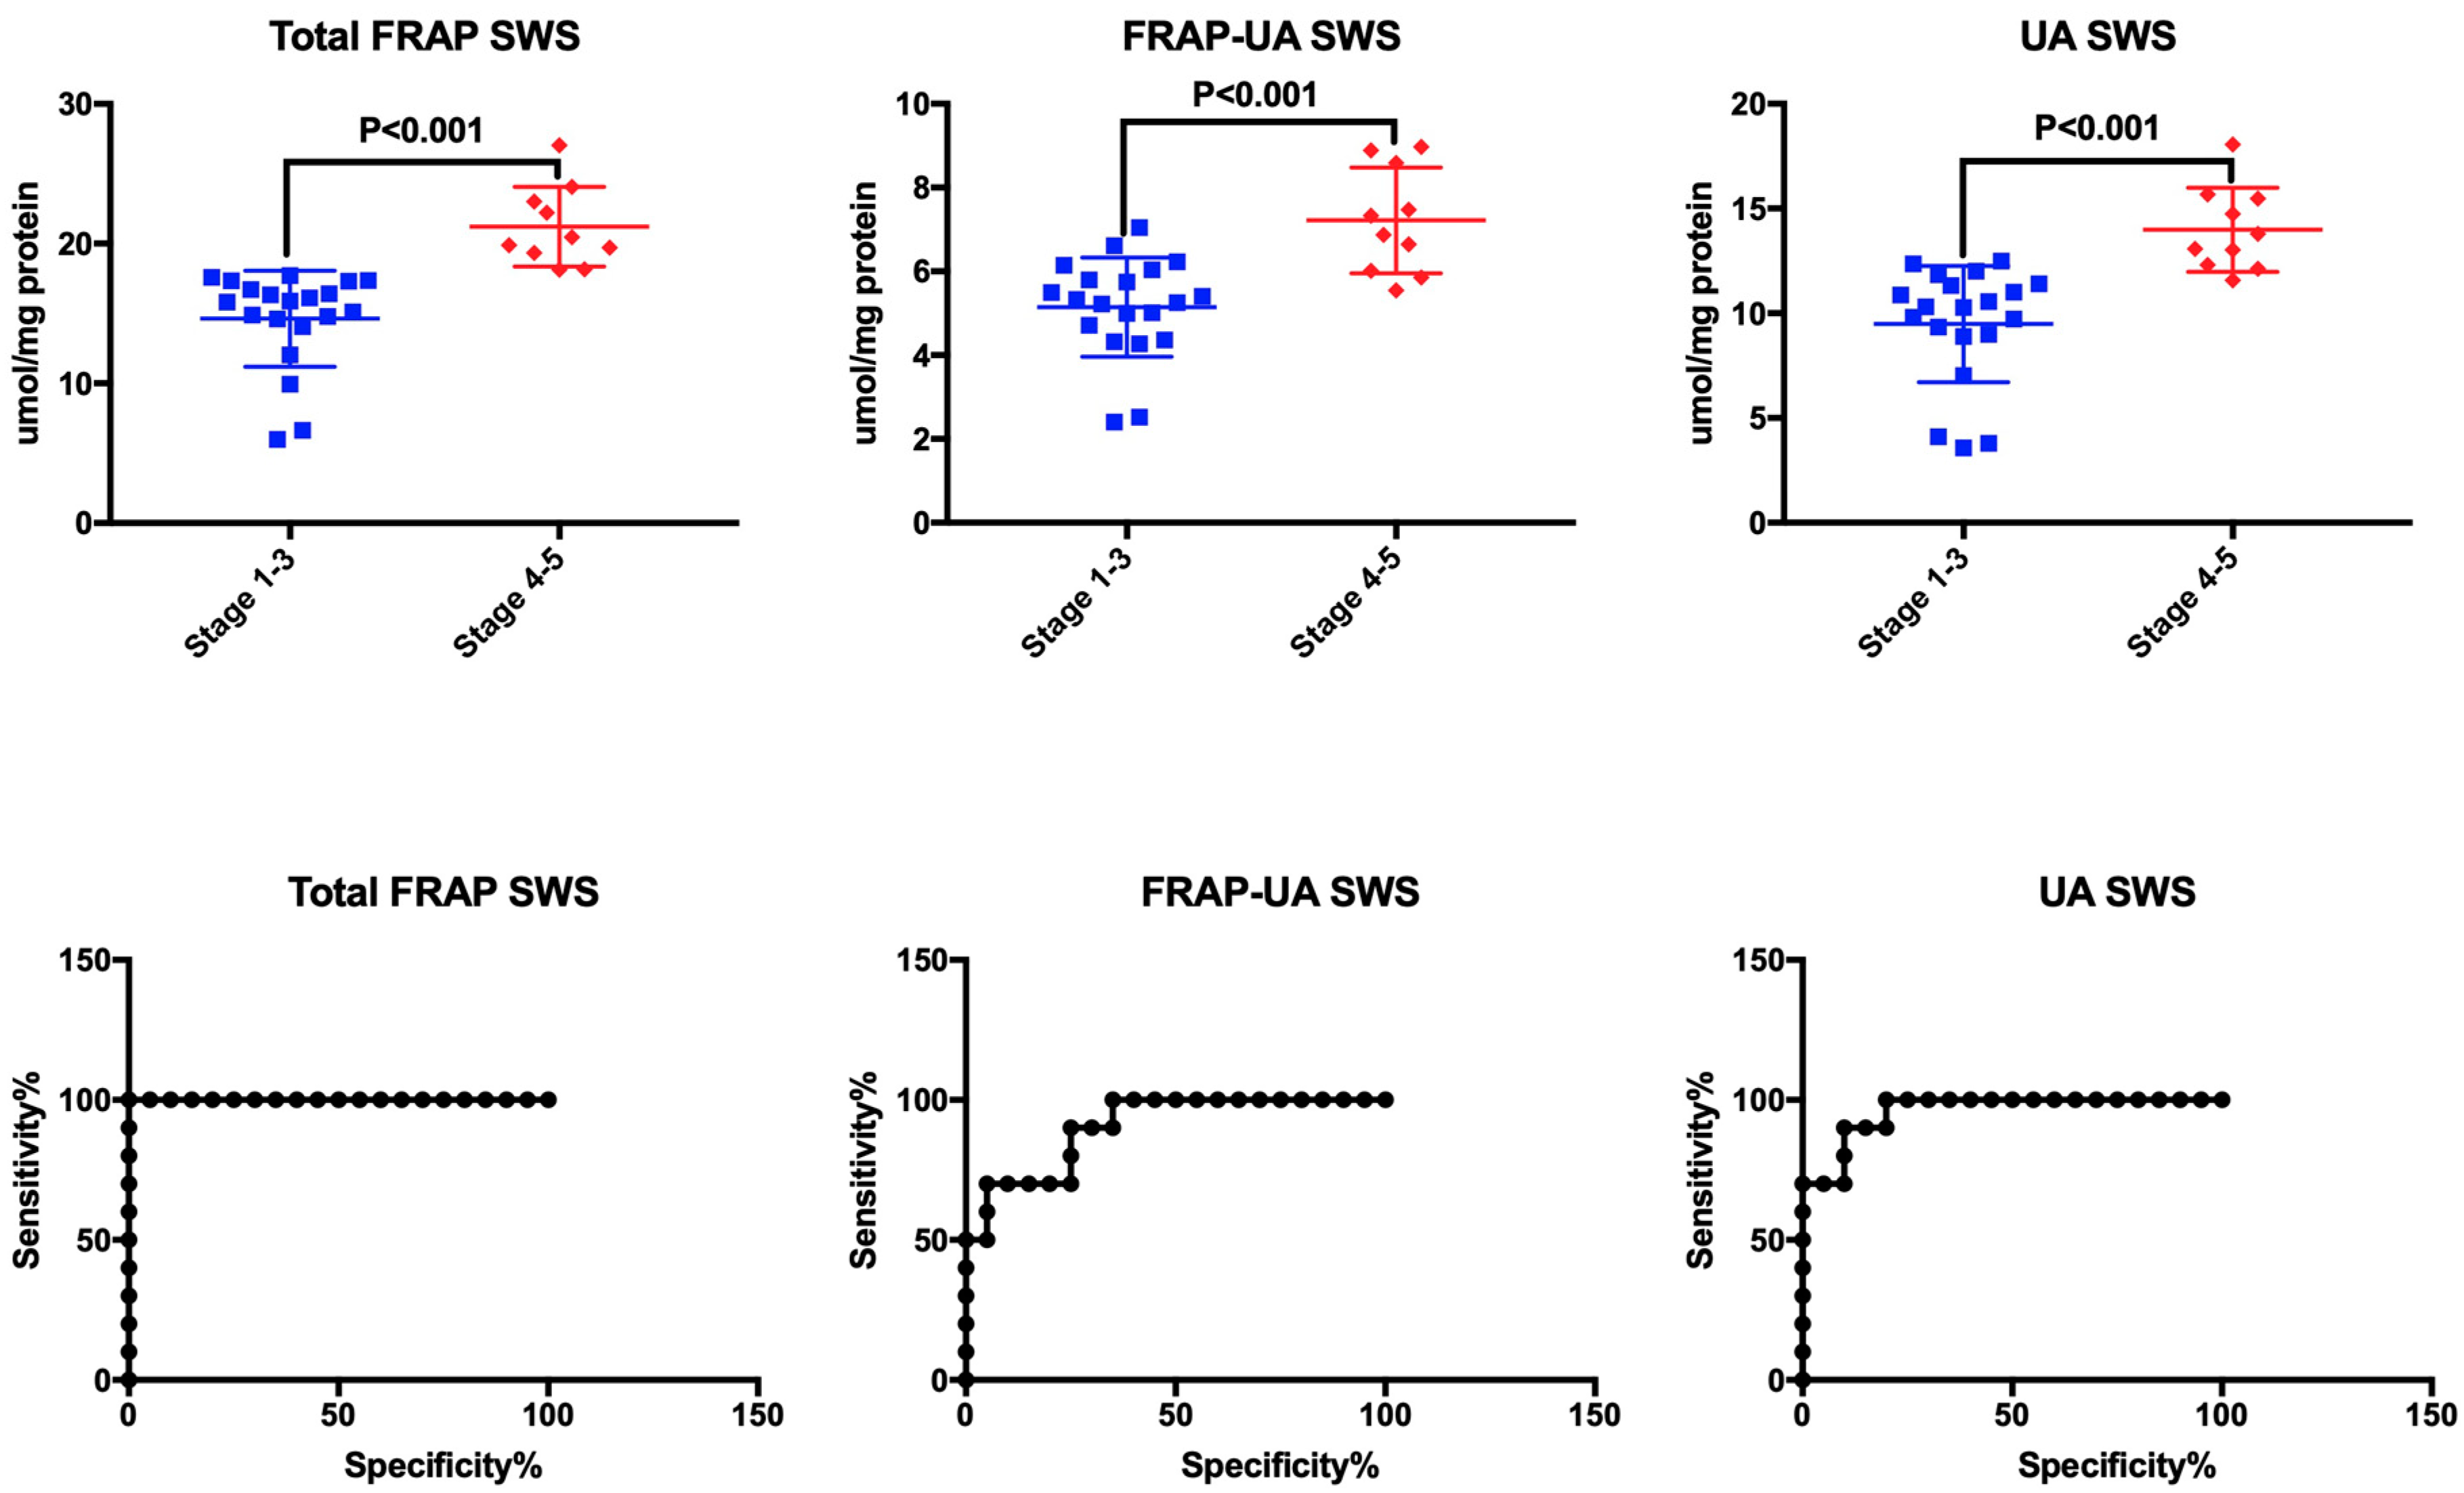
3.6. ROC Analysis
3.7. Correlations
4. Discussion
Author Contributions
Funding
Conflicts of Interest
References
- Levey, A.S.; De Jong, P.E.; Coresh, J.; Nahas, M.E.; Astor, B.C.; Matsushita, K.; Gansevoort, R.T.; Kasiske, B.L.; Eckardt, K.U. The definition, classification, and prognosis of chronic kidney disease: A KDIGO Controversies Conference report. Kidney Int. 2011, 80, 17–28. [Google Scholar] [CrossRef] [PubMed]
- Becherucci, F.; Roperto, R.M.; Materassi, M.; Romagnani, P. Chronic kidney disease in children. Clin. Kidney J. 2016, 9, 583–591. [Google Scholar] [CrossRef] [PubMed] [Green Version]
- Koye, D.N.; Magliano, D.J.; Nelson, R.G.; Pavkov, M.E. The Global Epidemiology of Diabetes and Kidney Disease. Adv. Chronic Kidney Dis. 2018, 25, 121–132. [Google Scholar] [CrossRef] [PubMed]
- Willis, K.; Cheung, M.; Slifer, S. KDIGO 2012 Clinical Practice Guideline for Evaluation & Management of CKD. Kidney Int. 2013. [Google Scholar] [CrossRef]
- Lopez-Giacoman, S. Biomarkers in chronic kidney disease, from kidney function to kidney damage. World J. Nephrol. 2015. [Google Scholar] [CrossRef] [PubMed]
- Modaresi, A.; Nafar, M.; Sahraei, Z. Oxidative stress in chronic kidney disease. Iran. J. Kidney Dis. 2015, 9, 165–179. [Google Scholar] [PubMed]
- Nakanishi, T.; Kuragano, T.; Nanami, M.; Nagasawa, Y.; Hasuike, Y. Misdistribution of Iron and Oxidative Stress in Chronic Kidney Disease. Free Radic. Biol. Med. 2018. [Google Scholar] [CrossRef] [PubMed]
- Putri, A.Y.; Thaha, M. Role of Oxidative Stress on Chronic Kidney Disease Progression. Acta Med. Indones. 2014, 46, 244–252. [Google Scholar]
- Kuchta, A.; Pacanis, A.; Kortas-Stempak, B.; Ćwiklińska, A.; Ziȩtkiewicz, M.; Renke, M.; Rutkowski, B. Estimation of oxidative stress markers in chronic kidney disease. Kidney Blood Press. Res. 2011. [Google Scholar] [CrossRef]
- Schei, J.; Fuskevåg, O.M.; Stefansson, V.T.N.; Solbu, M.D.; Jenssen, T.G.; Eriksen, B.O.; Melsom, T. Urinary Markers of Oxidative Stress are Associated with Albuminuria but not GFR Decline. Kidney Int. Rep. 2018. [Google Scholar] [CrossRef]
- Maciejczyk, M.; Szulimowska, J.; Skutnik, A.; Taranta-Janusz, K.; Wasilewska, A.; Wiśniewska, N.; Zalewska, A. Salivary Biomarkers of Oxidative Stress in Children with Chronic Kidney Disease. J. Clin. Med. 2018, 7, 209. [Google Scholar] [CrossRef] [PubMed]
- Lakshmi, B.S.; Devi, N.H.; Suchitra, M.M.; Rao, P.V.L.N.S.; Kumar, V.S. Changes in the inflammatory and oxidative stress markers during a single hemodialysis session in patients with chronic kidney disease. Ren. Fail. 2018, 40, 534–540. [Google Scholar] [CrossRef] [PubMed] [Green Version]
- Javaid, M.A.; Ahmed, A.S.; Durand, R.; Tran, S.D. Saliva as a diagnostic tool for oral and systemic diseases. J. Oral Biol. Craniofacial Res. 2016. [Google Scholar] [CrossRef]
- Maciejczyk, M.; Skutnik-Radziszewska, A.; Zieniewska, I.; Matczuk, J.; Domel, E.; Waszkiel, D.; Żendzian-Piotrowska, M.; Szarmach, I.; Zalewska, A. Antioxidant Defense, Oxidative Modification, and Salivary Gland Function in an Early Phase of Cerulein Pancreatitis. Oxid. Med. Cell. Longev. 2019, 2019, 8403578. [Google Scholar] [CrossRef] [PubMed]
- Knaś, M.; Maciejczyk, M.; Waszkiel, D.; Zalewska, A. Oxidative stress and salivary antioxidants. Dent. Med. Probl. 2013, 50, 461–466. [Google Scholar]
- Al-Rawi, N.H. Oxidative stress, antioxidant status and lipid profile in the saliva of type 2 diabetics. Diabetes Vasc. Dis. Res. 2011. [Google Scholar] [CrossRef]
- Nair, A.; Nair, B. Comparative analysis of the oxidative stress and antioxidant status in type II diabetics and nondiabetics: A biochemical study. J. Oral Maxillofac. Pathol. 2017. [Google Scholar] [CrossRef]
- Fejfer, K.; Buczko, P.; Niczyporuk, M.; Ładny, J.R.; Hady, H.R.; Knaś, M.; Waszkiel, D.; Klimiuk, A.; Zalewska, A.; Maciejczyk, M. Oxidative Modification of Biomolecules in the Nonstimulated and Stimulated Saliva of Patients with Morbid Obesity Treated with Bariatric Surgery. Biomed Res. Int. 2017, 2017, 4923769. [Google Scholar] [CrossRef]
- Knaś, M.; Maciejczyk, M.; Sawicka, K.; Hady, H.R.; Niczyporuk, M.; Ładny, J.R.; Matczuk, J.; Waszkiel, D.; Żendzian-Piotrowska, M.; Zalewska, A. Impact of morbid obesity and bariatric surgery on antioxidant/oxidant balance of the unstimulated and stimulated human saliva. J. Oral Pathol. Med. 2016, 45, 455–464. [Google Scholar] [CrossRef]
- Kułak-Bejda, A.; Waszkiewicz, N.; Bejda, G.; Zalewska, A.; Maciejczyk, M. Diagnostic Value of Salivary Markers in Neuropsychiatric Disorders. Dis. Markers 2019, 2019, 4360612. [Google Scholar] [CrossRef]
- Klimiuk, A.; Maciejczyk, M.; Choromańska, M.; Fejfer, K.; Waszkiewicz, N.; Zalewska, A. Salivary Redox Biomarkers in Different Stages of Dementia Severity. J. Clin. Med. 2019, 8, 840. [Google Scholar] [CrossRef] [PubMed]
- Bibi, G.; Green, Y.; Nagler, R.M. Compositional and oxidative analysis in the saliva and serum of predialysis chronic kidney disease patients and end-stage renal failure patients on peritoneal dialysis. Ther. Apher. Dial. 2008. [Google Scholar] [CrossRef] [PubMed]
- Duplancic, D.; Kukoc-Modun, L.; Modun, D.; Radic, N. Simple and rapid method for the determination of uric acid-independent antioxidant capacity. Molecules 2011, 16, 7058. [Google Scholar] [CrossRef] [PubMed]
- Schwartz, G.J.; Muñoz, A.; Schneider, M.F.; Mak, R.H.; Kaskel, F.; Warady, B.A. New Equations to Estimate GFR in Children with CKD. J. Am. Soc. Nephrol. 2009, 20, 629–637. [Google Scholar] [CrossRef] [PubMed] [Green Version]
- National Institutes Health (NIH). The Fourth Report on the Diagnosis, Evaluation, and Treatment of High Blood Pressure in Children and Adolescents; NIH: Bethesda, MD, USA, 2005. [CrossRef]
- National Kidney Foundation. K/DOQI clinical practice guidelines for chronic kidney disease: Evaluation, classification, and stratification. Am. J. Kidney Dis. 2002, 39, S1–S266. [Google Scholar]
- Choromańska, M.; Klimiuk, A.; Kostecka-Sochoń, P.; Wilczyńska, K.; Kwiatkowski, M.; Okuniewska, N.; Waszkiewicz, N.; Zalewska, A.; Maciejczyk, M. Antioxidant defence, oxidative stress and oxidative damage in saliva, plasma and erythrocytes of dementia patients. Can salivary AGE be a marker of dementia? Int. J. Mol. Sci. 2017, 18, 2205. [Google Scholar] [CrossRef] [PubMed]
- World Health Organization. Oral Health Surveys: Basic Methods; WHO: Geneva, Switzerland, 2013; ISBN 9789241548649. [Google Scholar]
- Lushchak, V.I. Free radicals, reactive oxygen species, oxidative stress and its classification. Chem. Biol. Interact. 2014, 224, 164–175. [Google Scholar] [CrossRef]
- Żukowski, P.; Maciejczyk, M.; Waszkiel, D. Sources of free radicals and oxidative stress in the oral cavity. Arch. Oral Biol. 2018, 92, 8–17. [Google Scholar] [CrossRef] [PubMed]
- Nagler, R.M.; Klein, I.; Zarzhevsky, N.; Drigues, N.; Reznick, A.Z. Characterization of the differentiated antioxidant profile of human saliva. Free Radic. Biol. Med. 2002. [Google Scholar] [CrossRef]
- Maciejczyk, M.; Matczuk, J.; Żendzian-Piotrowska, M.; Niklińska, W.; Fejfer, K.; Szarmach, I.; Ładny, J.R.; Zieniewska, I.; Zalewska, A. Eight-Week Consumption of High-Sucrose Diet Has a Pro-Oxidant Effect and Alters the Function of the Salivary Glands of Rats. Nutrients 2018, 10, 1530. [Google Scholar] [CrossRef]
- Feinstein, H.; Schramm, M. Energy Production in Rat Parotid Gland: Relation to Enzyme Secretion and Effects of Calcium. Eur. J. Biochem. 1970. [Google Scholar] [CrossRef] [PubMed]
- Zalewska, A.; Ziembicka, D.; Żendzian-Piotrowska, M.; Maciejczyk, M. The Impact of High-Fat Diet on Mitochondrial Function, Free Radical Production, and Nitrosative Stress in the Salivary Glands of Wistar Rats. Oxid. Med. Cell. Longev. 2019, 2019, 2606120. [Google Scholar] [CrossRef] [PubMed]
- Johnson, D.W.; Jones, G.R.D.; Mathew, T.H.; Ludlow, M.J.; Chadban, S.J.; Usherwood, T.; Polkinghorne, K.; Colagiuri, S.; Jerums, G.; MacIsaac, R.; et al. Chronic kidney disease and measurement of albuminuria or proteinuria: A position statement. Med. J. Aust. 2012. [Google Scholar] [CrossRef]


| Control n = 30 | Stage 1 n = 5 | Stage 2 n = 8 | Stage 3 n = 7 | Stage 4 n = 5 | Stage 5 n = 5 | CKD n = 30 | |
|---|---|---|---|---|---|---|---|
| Weight (kg) | 42.1 ± 6.2 | 46.06 ± 4.74 | 51.64 ± 8.36 | 33.86 ± 4.27 | 42.34 ± 13.55 | 32.3 ±7.17 | 41.79 ± 3.65 |
| Height (cm) | 138.2 ± 8.3 | 145.6 ± 7.66 | 151.7 ± 5.58 | 134.4 ± 5.63 | 143.4 ± 7.34 | 130.2 ± 10.16 | 141.7 ± 3.29 |
| Age (yrs) | 12.5 ± 0.8 | 14.35 ± 1.51 | 13.89 ± 1.3 | 11.71 ± 1.2 | 13.35 ± 1.26 | 11.28 ± 2.04 | 12.93 ± 0.64 |
| Age of diagnosis (yrs) | ND | 12.75 ± 1.23 | 9.53 ± 2.13 | 7.82 ± 1.43 | 6.55 ± 2.55 | 7.06 ± 1.42 | 8.76 ± 0.88 |
| eGFR (mL/min/1.73 m2) | 137.2 ± 8.9 | 136.6 ± 15.88 | 75.26 ± 5.65 | 42.19 ± 5.25 | 21.76 ± 3.28 | 12.46 ± 0.83 | 58.38 ± 8.31 |
| Serum Cr (mg/dL) | 0.42 ± 0.1 | 0.82 ± 0.1 | 1.07 ± 0.11 | 1.72 ± 0.19 | 3.77 ± 0.13 | 6.62 ± 0.49 | 2.55 ± 0.39 |
| Serum urea (mg/dL) | 18.1 ± 3.4 | 26.8 ± 7.33 | 44.63 ± 5.89 | 57.29 ± 8.23 | 110.1 ± 9.52 | 156.2 ± 13.99 | 74.12 ± 9.09 |
| Proteinuria (mg/24 h) | 62.1 ± 3.7 | 91.5 ± 4.33 | 490.5 ± 224.5 | 607 ±329.6 | 804.3 ± 285.5 | 794 ± 553.5 | 561.9 ± 137.3 |
| Albuminuria (mg/24 h) | 8 ± 0.9 | 9.54 ± 0.41 | 54.53 ± 27.58 | 124.7 ± 113.8 | 335.5 ± 96.98 | 1454 ± 110.2 | 348 ± 126.4 |
| Ca2+ (mmol/L) | ND | 2.49 ± 0.04 | 2.38 ± 0.07 | 2.39 ± 0.06 | 2.37 ± 0.01 | 2.48 ± 0.08 | 2.42 ± 0.03 |
| Vitamin D3 (ng/mL) | ND | 24.1 ± 3.33 | 17.38 ± 3.57 | 23.86 ± 7.43 | 22.13 ± 6.56 | 10.8 ± 3.09 | 19.71 ± 2.4 |
| PTH (pg/mL) | 35.1 ± 5.5 | 39.03 ± 8.9 | 54.96 ± 11.58 | 73.67 ± 16.28 | 161.4 ± 132.1 | 703.6 ± 177.5 | 194.6 ± 60.6 |
| ALP (U/L) | 38.5 ± 8.7 | 109.3 ± 31 | 196.6 ± 41.31 | 197.3 ± 23.24 | 239.7 ± 89.27 | 372.6 ± 192.6 | 223.8 ± 41.33 |
| Hgb (g/dL) | 14.8 ± 0.3 | 13.64 ± 0.75 | 13.39 ± 0.82 | 12.14 ± 0.72 | 10.43 ± 0.21 | 11.02 ± 0.97 | 12.31 ± 0.4 |
| Hct (%) | 39.8 ± 1 | 39.88 ± 1.95 | 38.33 ± 2.01 | 35.31 ± 1.71 | 31.24 ± 0.27 | 32.44 ± 2.58 | 35.72 ± 0.99 |
| Fe (μg/dL) | 80.2 ± 2 | 55.2 ± 10.44 | 78.13 ± 11.85 | 67.14 ± 8.85 | 82.2 ± 2.46 | 106.4 ± 16.16 | 77.13 ± 5.57 |
| Ferritin (ng/mL) | ND | 53.23 ± 13.17 | 78.89 ± 28.41 | 106.5 ± 41.02 | 183.5 ± 66.46 | 320.6 ± 66.52 | 138.8 ± 25.01 |
| SBP (mmHg) | 107 ± 1.5 | 116 ± 6.3 | 121.8 ± 6.34 | 113.4 ± 3.77 | 111.9 ± 1.21 | 119.4 ± 6.19 | 116.8 ± 2.37 |
| DBP (mmHg) | 65 ± 2.6 | 70.8 ± 3.12 | 68 ± 3.08 | 69.57 ± 2.46 | 74.27 ± 1.17 | 79.6 ± 5.01 | 71.81 ± 1.52 |
| Hypertension n (%) | 0 (0) | 1 (20) | 1 (12.5) | 1 (14.3) | 2 (40) | 3 (60) | 8 (26.7) |
| Dialysis n (%) | 0 (0) | 0 (0) | 0 (0) | 0 (0) | 1 (20) | 5 (100) | 6 (20) |
| Drugs < 5 per day n (%) | 0 (0) | 2 (40) | 4 (50) | 5 (71.4) | 2 (40) | 1 (20) | 14 (46.7) |
| Drugs ≥ 5 per day n (%) | 0 (0) | 3 (60) | 4 (50) | 2 (28.6) | 3 (60) | 4 (80) | 16 (53.3) |
| Control n = 30 | Stage 1 n = 5 | Stage 2 n = 8 | Stage 3 n = 7 | Stage 4 n = 5 | Stage 5 n = 5 | CKD n = 30 | ANOVA p | |
|---|---|---|---|---|---|---|---|---|
| Total protein NWS (μg/mL) | 1371 ± 78.52 | 832.2 ± 31.45 * | 976 ± 46.75 * | 931.1 ± 89.26 * | 919.5 ± 52.16 | 897.7 ± 72.63 * | 918.4 ± 29.07 * | <0.001 |
| Total protein SWS (μg/mL) | 1308 ± 30.77 | 907.1 ± 89.52 * | 916.3 ± 64.24 * | 1031 ± 64.17 * | 998.9 ± 40.09 * | 890.1 ± 78.15 * | 950.9 ± 30.56 * | <0.001 |
| NWS flow rate (mL/min) | 0.56 ± 0.02 | 0.30 ± 0.03 * | 0.34 ± 0.04 * | 0.33 ± 0.03 * | 0.24 ± 0.05 * | 0.31 ± 0.08 * | 0.31 ± 0.02 * | <0.001 |
| SWS flow rate (mL/min) | 1.42 ± 0.05 * | 0.85 ± 0.09 * | 0.78 ± 0.1 * | 0.76 ± 0.1 * | 0.81 ± 0.12 * | 1.09 ± 0.08 | 0.84 ± 0.05 * | <0.001 |
| DMFT | 3.2 ± 0.5 | 3.1 ± 0.4 | 3.0 ± 0.7 | 3.2 ± 0.3 | 3.6 ± 0.8 | 3.5 ± 0.5 | 3.3 ± 0.5 | NS |
| dmft | 10.1 ± 0.5 | 10.8 ± 0.2 | 11 ± 0.2 | 12.5 ± 0.3 | 11.1 ± 0.5 | 12.4 ± 0.8 | 11.5 ± 0.4 | NS |
| PBI | 0 ± 0.1 | 0 ± 0.1 | 0 ± 0.3 | 0 ± 0.3 | 0 ± 0.3 | 0 ± 0.3 | 0 ± 0.3 | NS |
| GI | 0 ± 0.2 | 0 ± 0.2 | 0 ± 01 | 0 ± 0.2 | 0 ± 0.2 | 0 ± 0.2 | 0 ± 0.2 | NS |
| AUC | p-Value | Cut-Off | Confidence Intervals | Sensitivity (%) | Specificity (%) | |
|---|---|---|---|---|---|---|
| NWS | ||||||
| Total FRAP (μM/mg protein) | 0.7 | 0.008 | >7.90 | 0.56–0.84 | 73.33 | 73.33 |
| FRAP-UA (μM/mg protein) | 0.81 | <0.001 | >3.68 | 0.69–0.93 | 80 | 80 |
| UA (μM/mg protein) | 0.54 | NS | >3.84 | 0.39–0.69 | 53.33 | 43.33 |
| ΔFRAP (%) | 0.62 | NS | <53.76 | 0.47–0.76 | 60 | 60 |
| SWS | ||||||
| Total FRAP (μM/mg protein) | 0.95 | <0.001 | <10.41 | 0.9–1.01 | 90 | 90 |
| FRAP-UA (μM/mg protein) | 0.95 | <0.001 | >3.92 | 0.9–1.02 | 93.33 | 90 |
| UA (μM/mg protein) | 0.94 | <0.001 | >6.79 | 0.9–1 | 90 | 90 |
| ΔFRAP (%) | 0.76 | <0.001 | >62.2 | 0.64–0.89 | 70 | 73.33 |
| Plasma | ||||||
| Total FRAP (μM/mg protein) | 0.69 | 0.01 | >5.78 | 0.55–0.83 | 66.67 | 70 |
| FRAP-UA (μM/mg protein) | 0.57 | NS | >1.29 | 0.42–0.72 | 60 | 53.33 |
| UA (μM/mg protein) | 0.72 | 0.003 | >4.35 | 0.59–0.86 | 70 | 70 |
| ΔFRAP (%) | 0.63 | NS | >77.53 | 0.48–0.78 | 56.67 | 60 |
| Urine | ||||||
| Total FRAP (μM/mg protein) | 0.98 | <0.001 | >10.46 | 0.96–1.01 | 90 | 90 |
| FRAP-UA (μM/mg protein) | 0.95 | <0.001 | >4.51 | 0.89–1.01 | 86.67 | 90 |
| UA (μM/mg protein) | 0.98 | <0.001 | >6.72 | 0.95–1.01 | 90 | 90 |
| ΔFRAP (%) | 0.8 | <0.001 | >61.41 | 0.67–0.92 | 80 | 80 |
| AUC | p-Value | Cut-Off | Confidence Intervals | Sensitivity (%) | Specificity (%) | |
|---|---|---|---|---|---|---|
| NWS | ||||||
| Total FRAP (μM/mg protein) | 0.61 | NS | <9.28 | 0.4–0.81 | 58.33 | 55 |
| FRAP-UA μM/mg protein) | 0.55 | NS | >5.02 | 0.31–0.78 | 50 | 50 |
| UA (μM/mg protein) | 0.53 | NS | <4.32 | 0.3–0.76 | 60 | 55 |
| ΔFRAP (%) | 0.61 | NS | <44.77 | 0.39–0.83 | 60 | 60 |
| SWS | ||||||
| Total FRAP (μM/mg protein) | 1.00 | <0.001 | >17.92 | 1–1 | 100 | 100 |
| FRAP-UA μM/mg protein) | 0.91 | <0.001 | >5.932 | 0.8–1.01 | 80 | 75 |
| UA (μM/mg protein) | 0.96 | <0.001 | >12.07 | 0.9–1.02 | 90 | 90 |
| ΔFRAP (%) | 0.55 | NS | >66.32 | 0.34–0.77 | 60 | 55 |
| Plasma | ||||||
| Total FRAP (μM/mg protein) | 0.63 | NS | >6.43 | 0.4–0.86 | 60 | 65 |
| FRAP-UA (μM/mg protein) | 0.61 | NS | >1.41 | 0.38–0.83 | 60 | 55 |
| UA (μM/mg protein) | 0.62 | NS | >4.97 | 0.4–0.85 | 60 | 60 |
| ΔFRAP (%) | 0.56 | NS | <77.98 | 0.34–0.78 | 50 | 55 |
| Urine | ||||||
| Total FRAP (μM/mg protein) | 0.99 | <0.001 | >20 | 0.96–1.02 | 100 | 95 |
| FRAP-UA (μM/mg protein) | 0.89 | <0.001 | >6.83 | 0.77–1 | 80 | 75 |
| UA (μM/mg protein) | 1 | <0.001 | >12.95 | 1–1 | 100 | 100 |
| ΔFRAP (%) | 0.73 | 0.047 | >65.16 | 0.52–0.93 | 70 | 70 |
| Total FRAP plasma | FRAP-UA Plasma | UA Plasma | ΔFRAP Plasma | Total FRAP Urine | FRAP-UA Urine | UA Urine | ΔFRAP Urine | |
|---|---|---|---|---|---|---|---|---|
| Total FRAP NWS | −0.12 | −0.42 * | −0.01 | 0.28 | 0.01 | −0.05 | 0.04 | 0.17 |
| FRAP-UA NWS | −0.12 | −0.32 | −0.03 | 0.19 | 0.09 | 0.01 | 0.13 | 0.25 |
| UA NWS | −0.10 | −0.40 * | 0.01 | 0.29 | −0.04 | −0.08 | −0.02 | 0.1 |
| ΔFRAP NWS | 0.05 | −0.16 | 0.10 | 0.19 | −0.16 | −0.14 | −0.16 | −0.09 |
| Total FRAP SWS | 0.26 | 0.45 * | 0.16 | −0.20 | 0.94 * | 0.83 * | 0.93 * | 0.21 |
| FRAP-UA SWS | −0.01 | 0.19 | −0.07 | −0.18 | 0.72 * | 0.65 * | 0.71 * | 0.14 |
| UA SWS | 0.36 * | 0.52 * | 0.25 | −0.19 | 0.93 * | 0.84 * | 0.93 * | 0.22 |
| ΔFRAP SWS | 0.44 * | 0.50 * | 0.34 | −0.13 | 0.47 * | 0.44 * | 0.47 * | 0.15 |
| Total FRAP NWS | FRAP-UA NWS | UA NWS | ΔFRAP NWS | Total FRAP SWS | FRAP-UA SWS | UA SWS | ΔFRAP SWS | |
|---|---|---|---|---|---|---|---|---|
| Weight (kg) | 0.02 | −0.04 | 0.05 | −0.03 | −0.2 | −0.12 | −0.21 | −0.14 |
| Height (cm) | 0.23 | 0.10 | 0.27 | 0.10 | −0.26 | −0.16 | −0.28 | −0.19 |
| Age (yrs) | 0.23 | 0.18 | 0.23 | −0.01 | −0.16 | −0.11 | −0.17 | −0.14 |
| Age of diagnosis (yrs) | 0.17 | 0.03 | 0.23 | 0.16 | −0.37 * | −0.23 | −0.39 * | −0.29 |
| eGFR (mL/min/1.73 m2) | −0.05 | −0.16 | 0.03 | 0.18 | −0.83 * | −0.72 * | −0.79 * | −0.28 |
| sCr (mg/dL) | 0.10 | 0.19 | 0.04 | −0.09 | 0.78 * | 0.79 * | 0.69 * | 0.09 |
| Serum urea (mg/dL) | 0.02 | 0.14 | −0.05 | −0.12 | 0.73 * | 0.70 * | 0.67 * | 0.14 |
| Proteinuria (mg/24 h) | −0.17 | −0.04 | −0.22 | −0.30 | 0.49 * | 0.36 | 0.50 * | 0.25 |
| Albuminuria (mg/24 h) | 0.08 | 0.14 | 0.03 | −0.02 | 0.74 * | 0.74 * | 0.66 * | 0.11 |
| Ca2+ (mmol/L) | 0.31 | 0.13 | 0.36 | 0.39 * | −0.07 | −0.03 | −0.09 | −0.06 |
| Vitamin D3 (ng/mL) | 0.04 | 0.04 | 0.03 | 0.01 | −0.18 | −0.13 | −0.19 | −0.07 |
| PTH (pg/mL) | 0.13 | 0.31 | 0.01 | −0.19 | 0.65 * | 0.72 * | 0.55 * | −0.01 |
| ALP (U/L) | −0.06 | 0.21 | −0.19 | −0.29 | 0.49 * | 0.38 | 0.49 * | 0.22 |
| Hgb (g/dL) | 0.27 | 0.09 | 0.33 | 0.38 * | −0.48 * | −0.44 * | −0.45 * | −0.06 |
| Hct (%) | 0.29 | 0.06 | 0.38 * | 0.45 * | −0.53 * | −0.48 * | −0.50 * | −0.12 |
| Fe (μg/dL) | −0.18 | 0.04 | −0.27 | −0.28 | 0.46 * | 0.34 * | 0.47 * | 0.28 |
| Ferritin (ng/mL) | 0.13 | 0.27 | 0.03 | −0.17 | 0.53 * | 0.65 * | 0.42 * | −0.09 |
| SBP (mmHg) | −0.12 | −0.19 | −0.06 | 0.06 | −0.03 | 0.01 | −0.04 | −0.04 |
| DBP (mmHg) | −0.13 | −0.17 | −0.09 | 0.05 | 0.23 | 0.23 | 0.20 | 0.04 |
© 2019 by the authors. Licensee MDPI, Basel, Switzerland. This article is an open access article distributed under the terms and conditions of the Creative Commons Attribution (CC BY) license (http://creativecommons.org/licenses/by/4.0/).
Share and Cite
Maciejczyk, M.; Szulimowska, J.; Taranta-Janusz, K.; Werbel, K.; Wasilewska, A.; Zalewska, A. Salivary FRAP as A Marker of Chronic Kidney Disease Progression in Children. Antioxidants 2019, 8, 409. https://doi.org/10.3390/antiox8090409
Maciejczyk M, Szulimowska J, Taranta-Janusz K, Werbel K, Wasilewska A, Zalewska A. Salivary FRAP as A Marker of Chronic Kidney Disease Progression in Children. Antioxidants. 2019; 8(9):409. https://doi.org/10.3390/antiox8090409
Chicago/Turabian StyleMaciejczyk, Mateusz, Julita Szulimowska, Katarzyna Taranta-Janusz, Katarzyna Werbel, Anna Wasilewska, and Anna Zalewska. 2019. "Salivary FRAP as A Marker of Chronic Kidney Disease Progression in Children" Antioxidants 8, no. 9: 409. https://doi.org/10.3390/antiox8090409