Article

Transcriptional Regulation of the Acer truncatum B. Response to Drought and the Contribution of AtruNAC36 to Drought Tolerance

1
Experimental Centre of Forestry in North China, Chinese Academy of Forestry, Beijing 102300, China
2
National State Key Laboratory of Tree Genetics and Breeding, Chinese Academy of Forestry, Beijing 100091, China
3
Taishan Academy of Forestry Sciences, Tai’an 271000, China
*
Author to whom correspondence should be addressed.
Antioxidants 2023, 12(7), 1339; https://doi.org/10.3390/antiox12071339
Submission received: 29 May 2023 / Revised: 14 June 2023 / Accepted: 21 June 2023 / Published: 24 June 2023

Abstract

:
Drought stress is one of the major environmental factors severely restricting plant development and productivity. Acer truncatum B, which is an economically important tree species, is highly tolerant to drought conditions, but the underlying molecular regulatory mechanisms remain relatively unknown. In this study, A. truncatum seedlings underwent a drought treatment (water withheld for 0, 3, 7, and 12 days), after which they were re-watered for 5 days. Physiological indices were measured and a transcriptome sequencing analysis was performed to reveal drought response-related regulatory mechanisms. In comparison to the control, the drought treatment caused a significant increase in antioxidant enzyme activities, with levels rising up to seven times, and relative electrical conductivity from 14.5% to 78.4%, but the relative water content decreased from 88.3% to 23.4%; these indices recovered somewhat after the 5-day re-watering period. The RNA sequencing analysis identified 9126 differentially expressed genes (DEGs), which were primarily involved with abscisic acid responses, and mitogen-activated protein kinase signaling. These DEGs included 483 (5.29%) transcription factor genes from 53 families, including ERF, MYB, and NAC. A co-expression network analysis was conducted and three important modules were analyzed to identify hub genes, one of which (AtruNAC36) was examined to clarify its function. The AtruNAC36 protein was localized to the nucleus and had a C-terminal transactivation domain. Moreover, it bounded specifically to the NACRS element. The overexpression of AtruNAC36 in Arabidopsis thaliana resulted in increased drought tolerance by enhancing antioxidant enzyme activities. These findings provide important insights into the transcriptional regulation mediating the A. truncatum response to drought. Furthermore, AtruNAC36 may be relevant for breeding forest trees resistant to drought stress.

1. Introduction

As one of the most common environmental factors, drought stress severely affects seedling establishment as well as plant growth and productivity [1]. Plants adapt to drought condition through morphophysiological changes, such as stomatal closure to minimize water loss, root elongation (i.e., increasing the root-to-shoot ratio) to enhance water absorption, and cell wall modifications that promote water transport [1,2]. Additionally, metabolic processes are reorganized and the antioxidant system is activated to eliminate the excess reactive oxygen species (ROS) resulting from an exposure to drought stress. During these processes, the expression of drought stress-related genes is regulated to enhance drought stress responses at the morphological and physiological levels [3,4]. Clarifying the expression patterns of genes involved in drought responses is essential for characterizing the mechanism underlying the drought resistance of plants.
Many drought stress-inducible genes and signaling pathways have recently been identified on the basis of RNA sequencing (RNA-seq) analyses. For example, 5164 differentially expressed genes (DEGs) between two sea buckthorn subspecies under drought conditions were detected, including six hub genes involved in the abscisic acid (ABA) signaling pathway [5]. In Pinus halepensis Miller, 6035 DEGs mainly associated with ROS scavenging as well as fatty acid and cell wall biosynthesis were identified following a drought treatment, while the transcription of retrotransposons was observed to increase significantly after trees recovered from drought stress [6]. In Aegilops tauschii, 6969 DEGs primarily involved in starch and sucrose metabolism as well as mitogen-activated protein kinase (MAPK) signaling were identified in response to drought stress [7]. An examination of Norway spruce trees under drought conditions revealed 5835 and 1304 DEGs in the roots and needles [8], respectively. In Salix psammophila, 8172 DEGs that were previously detected in drought-stressed roots contribute to transcriptional regulation and stress responses, with two hub genes encoding positive regulators of drought resistance [9]. Therefore, key drought-related genes may be efficiently identified by performing sequencing and bioinformatic analyses.
The NAC (NAM, ATAF1/2, and CUC2) family is a plant-specific transcription factor (TF) family that affects several biological processes, including secondary wall formation, shoot apical meristem development, and responses to environmental stimuli [10,11,12]. The NAC TFs bind directly to the NAC recognition site (NACRS) [CGT(G/A)] in the promoter of the downstream target genes to regulate transcription [13]. To date, there has been substantial research conducted to functionally characterize NAC genes in terms of their contribution to stress tolerance. In Arabidopsis thaliana, the expression of ANAC019 is triggered in response to dehydration and salinity. The encoded protein helps mediate abiotic stress defense responses by modulating jasmonate and ABA signaling [14,15]. The constitutive overexpression of MdNAC1 from apple (Malus hupehensis) significantly enhances drought tolerance by increasing antioxidant enzyme activities [16]. The MdNAC047 expression level increases significantly following an exposure to salt stress; the constitutive overexpression of this gene in A. thaliana and apple promotes MdERF3 expression and increases salt tolerance [17]. The overexpression of poplar NAC13 enhances the salt tolerance of transgenic tobacco and poplar [18,19]. In cotton, GhirNAC2 expression can improve drought tolerance by mediating ABA biosynthesis and stomatal closure [20]. These studies reflect the importance of NAC TFs for abiotic stress tolerance.
Acer truncatum B. is an important oil-producing woody plant. Its tissues/organs are valued because of their potential uses [21]. For example, the seeds and leaves are a rich source of nervonic acid, which has positive effects on cranial nerves and may be incorporated into health care products or medicines [22,23]. Because of the changing leaf colors and desirable shape of A. truncatum trees, they are often used for landscaping [24]. Moreover, A. truncatum is highly tolerant to drought conditions and can grow in arid and semi-arid regions. In recent times, several researches has been conducted to analyze the physiological effects of A. truncatum under drought stress. For example, A. truncatum has been reported to be able to endure drought stress through delayed dehydration at high water potentials, and its water regulation approach is generally conservative water [25]. Chronic drought stress has a mitigating effect on the negative impacts of ozone (O3) on growth and physiology in A. truncatum [26]. The leaf size, photosynthetic rate, and stomatal conductance are reduced under drought and O3 stress in A. truncatum [26]. The similar phenotype under drought stress are detected in A. rubrum and A. pictum which are related species of A. truncatum [27]. However, the systematic study of gene expression in A. truncatum under drought stress is still lacking, and the molecular mechanism underlying the drought resistance of A. truncatum remains unknown. We hypothesized that A. truncatum was able to endure drought stress by activating certain responses and some key genes that were essential for its drought tolerance.
To verified our hypotheses, physiological and transcriptome sequencing analyses of drought-stressed A. truncatum samples were conducted to reveal the regulatory mechanisms associated with drought tolerance. In addition, co-expression networks for A. truncatum under drought conditions were constructed to screen for hub genes, one of which (AtruNAC36) was functionally characterized to clarify its contribution to drought tolerance. This is the first exploration of transcriptome of A. truncatum under drought stress. The findings of this study provide researchers with useful information regarding the transcriptional regulatory mechanism mediating the A. truncatum drought response. Notably, a candidate gene relevant for improving the drought resistance of forest tree species was identified.

2. Materials and Methods

2.1. Plant Materials and Drought Treatment

Acer truncatum (Act-E) materials were acquired from Jiulong Mountain (E 115°59′–116°06′, N 39°54′–39°57′) in Beijing. Act-E was an excellent tree that were selected from Jiulong Mountain. The tree grew rapidly, with a height of 18.6 m and a diameter of 0.73 m at breast height in 20-year-old. The trunk was vertical, and the foliage was dense, with few infestations or illnesses. The twigs from Act-E were divided into 15-cm segments (one leaf per segment) and then added to plastic pots containing a turfy soil/perlite/vermiculite mixture with soil moisture at 75% in a greenhouse at the Experimental Center of Forestry in North China. After 1 year, vigorously growing and uniformly sized seedlings were selected for the drought treatment. These seedlings were stopping irrigation at water for 12 days to simulate a natural drought event and re-watered for 5 days (RW) [28]. On 0 (control), 3, 7, 12 days under drought stress and RW, the second and third leaves (from the stem tip) were collected from five seedlings at each time-point and frozen immediately using liquid nitrogen and stored at −80 °C for RNA extraction. For each time point, three independent biological replicates were conducted. Each biological replicate contained five individual seedlings. In addition, the fourth and fifth leaves were collected to examine physiological indices, including relative electrical conductivity (REC), relative water content (RWC), peroxidase (POD) activity, superoxide dismutase (SOD) activity, and catalase (CAT) activity. REC and RWC were measured according to the Hu’ study [28]. POD, SOD, and CAT activities were detected using reagent kits from Solarbio Company (Beijing, China) according to the manufacturer’s protocols. Three biological replicates and five technical replicates in the biochemical analysis were conducted.

2.2. RNA Extraction and RNA-Seq Analysis

Total RNA of 15 leaf samples (water withheld for 0, 3, 7, 12 days, and re-watered for 5 days, three independent biological replicates per time-point) was extracted using the RNA prep Pure Plant Kit from Tiangen Company (Beijing, China) according to the manufacturer’s instructions for RNA-seq. The RNA integrity and purity were determined using the Agilent 2100 system (Agilent Technologies, Palo Alto, CA, USA) and the NanoDrop 2000 system (Thermo Scientific, Waltham, MA, USA). The high-quality RNA (RNA integrity number ≥ 8.0, optical density ≥ 2.0, and concentration ≥ 100 ng/µL) was used to construct libraries that were sequenced on the Illumina HiSeq 2500 platform (2 × 125-bp paired-end reads) at BMKCloud Technologies Corporation (Shenzhen, China). The raw RNA-seq data for A. truncatum under drought conditions were deposited in the National Genomics Data Center database (PRJCA013039) (https://bigd.big.ac.cn, accessed on 13 November 2022).

2.3. Sequence Data Analysis and Functional Annotation

After eliminating the low-quality reads, adapters, and reads with poly-N sequences, the clean data were mapped to the A. truncatum genome sequence using the Bowtie2 software [29]. Gene expression levels were measured according to the fragments per kilobase of transcript per million mapped fragments (FPKM) value. Princomp was used to perform a principal component analysis (PCA). The DEGs between groups were identified using EdgeR and the following criteria: ratio of gene expression levels in two samples ≥ 2 and false discovery rate ≤ 0.05.
The GOseq R package and KOBAS software were used for the Gene Ontology (GO) enrichment analysis [30] and the Kyoto Encyclopedia of Genes and Genomes (KEGG) pathway analysis [31].

2.4. Co-Expression Network Analysis

A co-expression network analysis was performed using the weighted gene co-expression network analysis (WGCNA) package in R. The WGCNA edge weights > 0.30 were considered valid. Connectivity (degree) was calculated as the number of all node edges, and genes with a degree exceeding 90 in the network were defined as hub genes. The Cytoscape 3.7.0 software was used for visualizing the co-expression network.

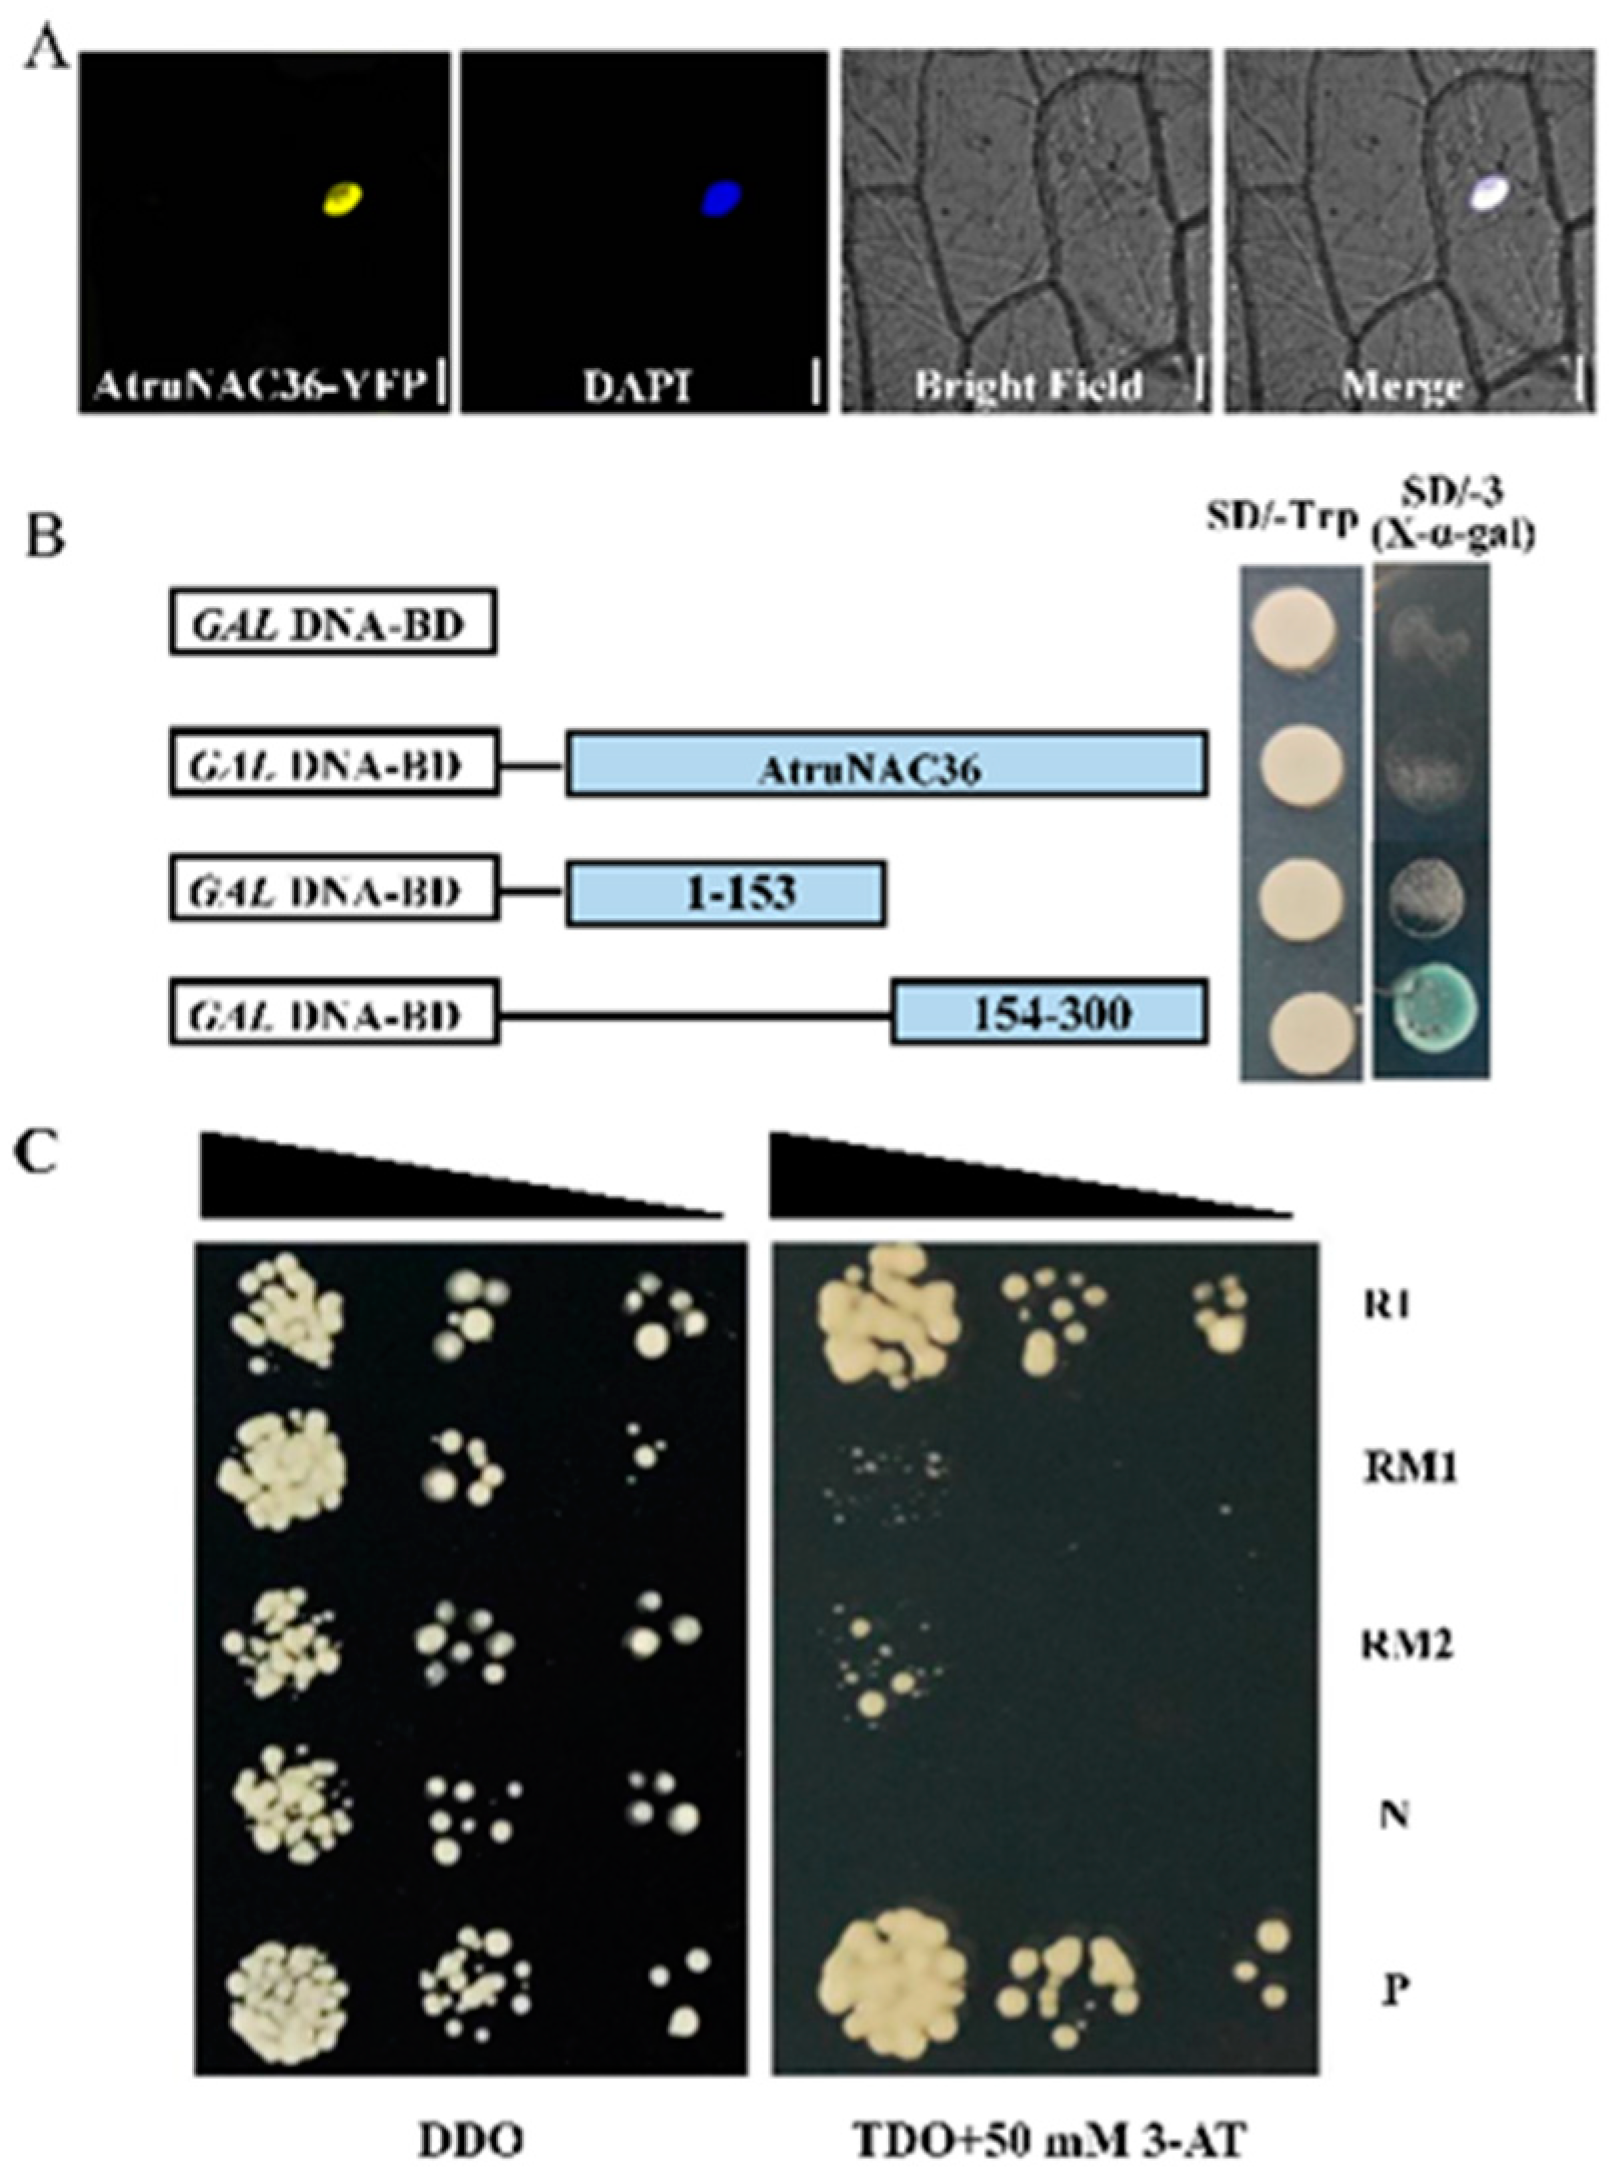
2.5. Transcriptional Activation Assay

The AtruNAC36 (Atru.chr5.3491) coding region was amplified via a polymerase chain reaction using specific primers (Table S1). The full-length AtruNAC36 sequence, the sequences encoding the N-terminal (amino acids 1–153) and C-terminal (amino acids 154–298) of AtruNAC36 were ligated into separate pGBKT7 vectors (Clontech, Palo Alto, CA, USA). The recombinant plasmids were inserted into separate Y2HGold yeast cells, which were cultured for 3 days on solid SD medium lacking tryptophan (SD/−Trp) and solid SD medium lacking Trp, histidine (His), and adenine (Ade), but supplemented with X-α-Gal (SD/−3/X-α-Gal). The pGBKT7 vector was used as negative control. The growth status of the transformed yeast cells and the blue/white colony assay results were used to determine transcriptional activation. The PCR primers are listed in Table S1.

2.6. Yeast One-Hybrid (Y1H) Assay

Three tandem copies of the NACRS sequence (CGTA; R) and the mutated sequences RM1 (CGCC) and RM2 (AATA) were cloned into separate pHIS2 vectors form three bait reporter vectors. The AtruNAC36 coding sequence was inserted into the pGADT7-Rec2 vector for a pGADT7-Rec2-AtruNAC36 fusion vector. Different combinations of the recombinant pGADT7-Rec2 and bait reporter vectors s were co-expressed in Y187 yeast cells, which were cultured on solid SD/−leucine (Leu)/−Trp medium (DDO). The transformed yeast cells form DDO medium were proliferated and diluted 10, 100, 1000 times with autoclaved double-distilled water and then dripped on solid SD/−Leu/−Trp/−His medium supplemented with 3-amino-1,2,4-triazole (3-AT) (TDO + 50 mM 3-AT). The positive control yeast cells were transformed with pHIS2-p53 and pGADT7-Rec2-p53, whereas the negative control yeast cells were transformed with pHIS2-p53 and pGADT7-Rec2-AtruNAC36.

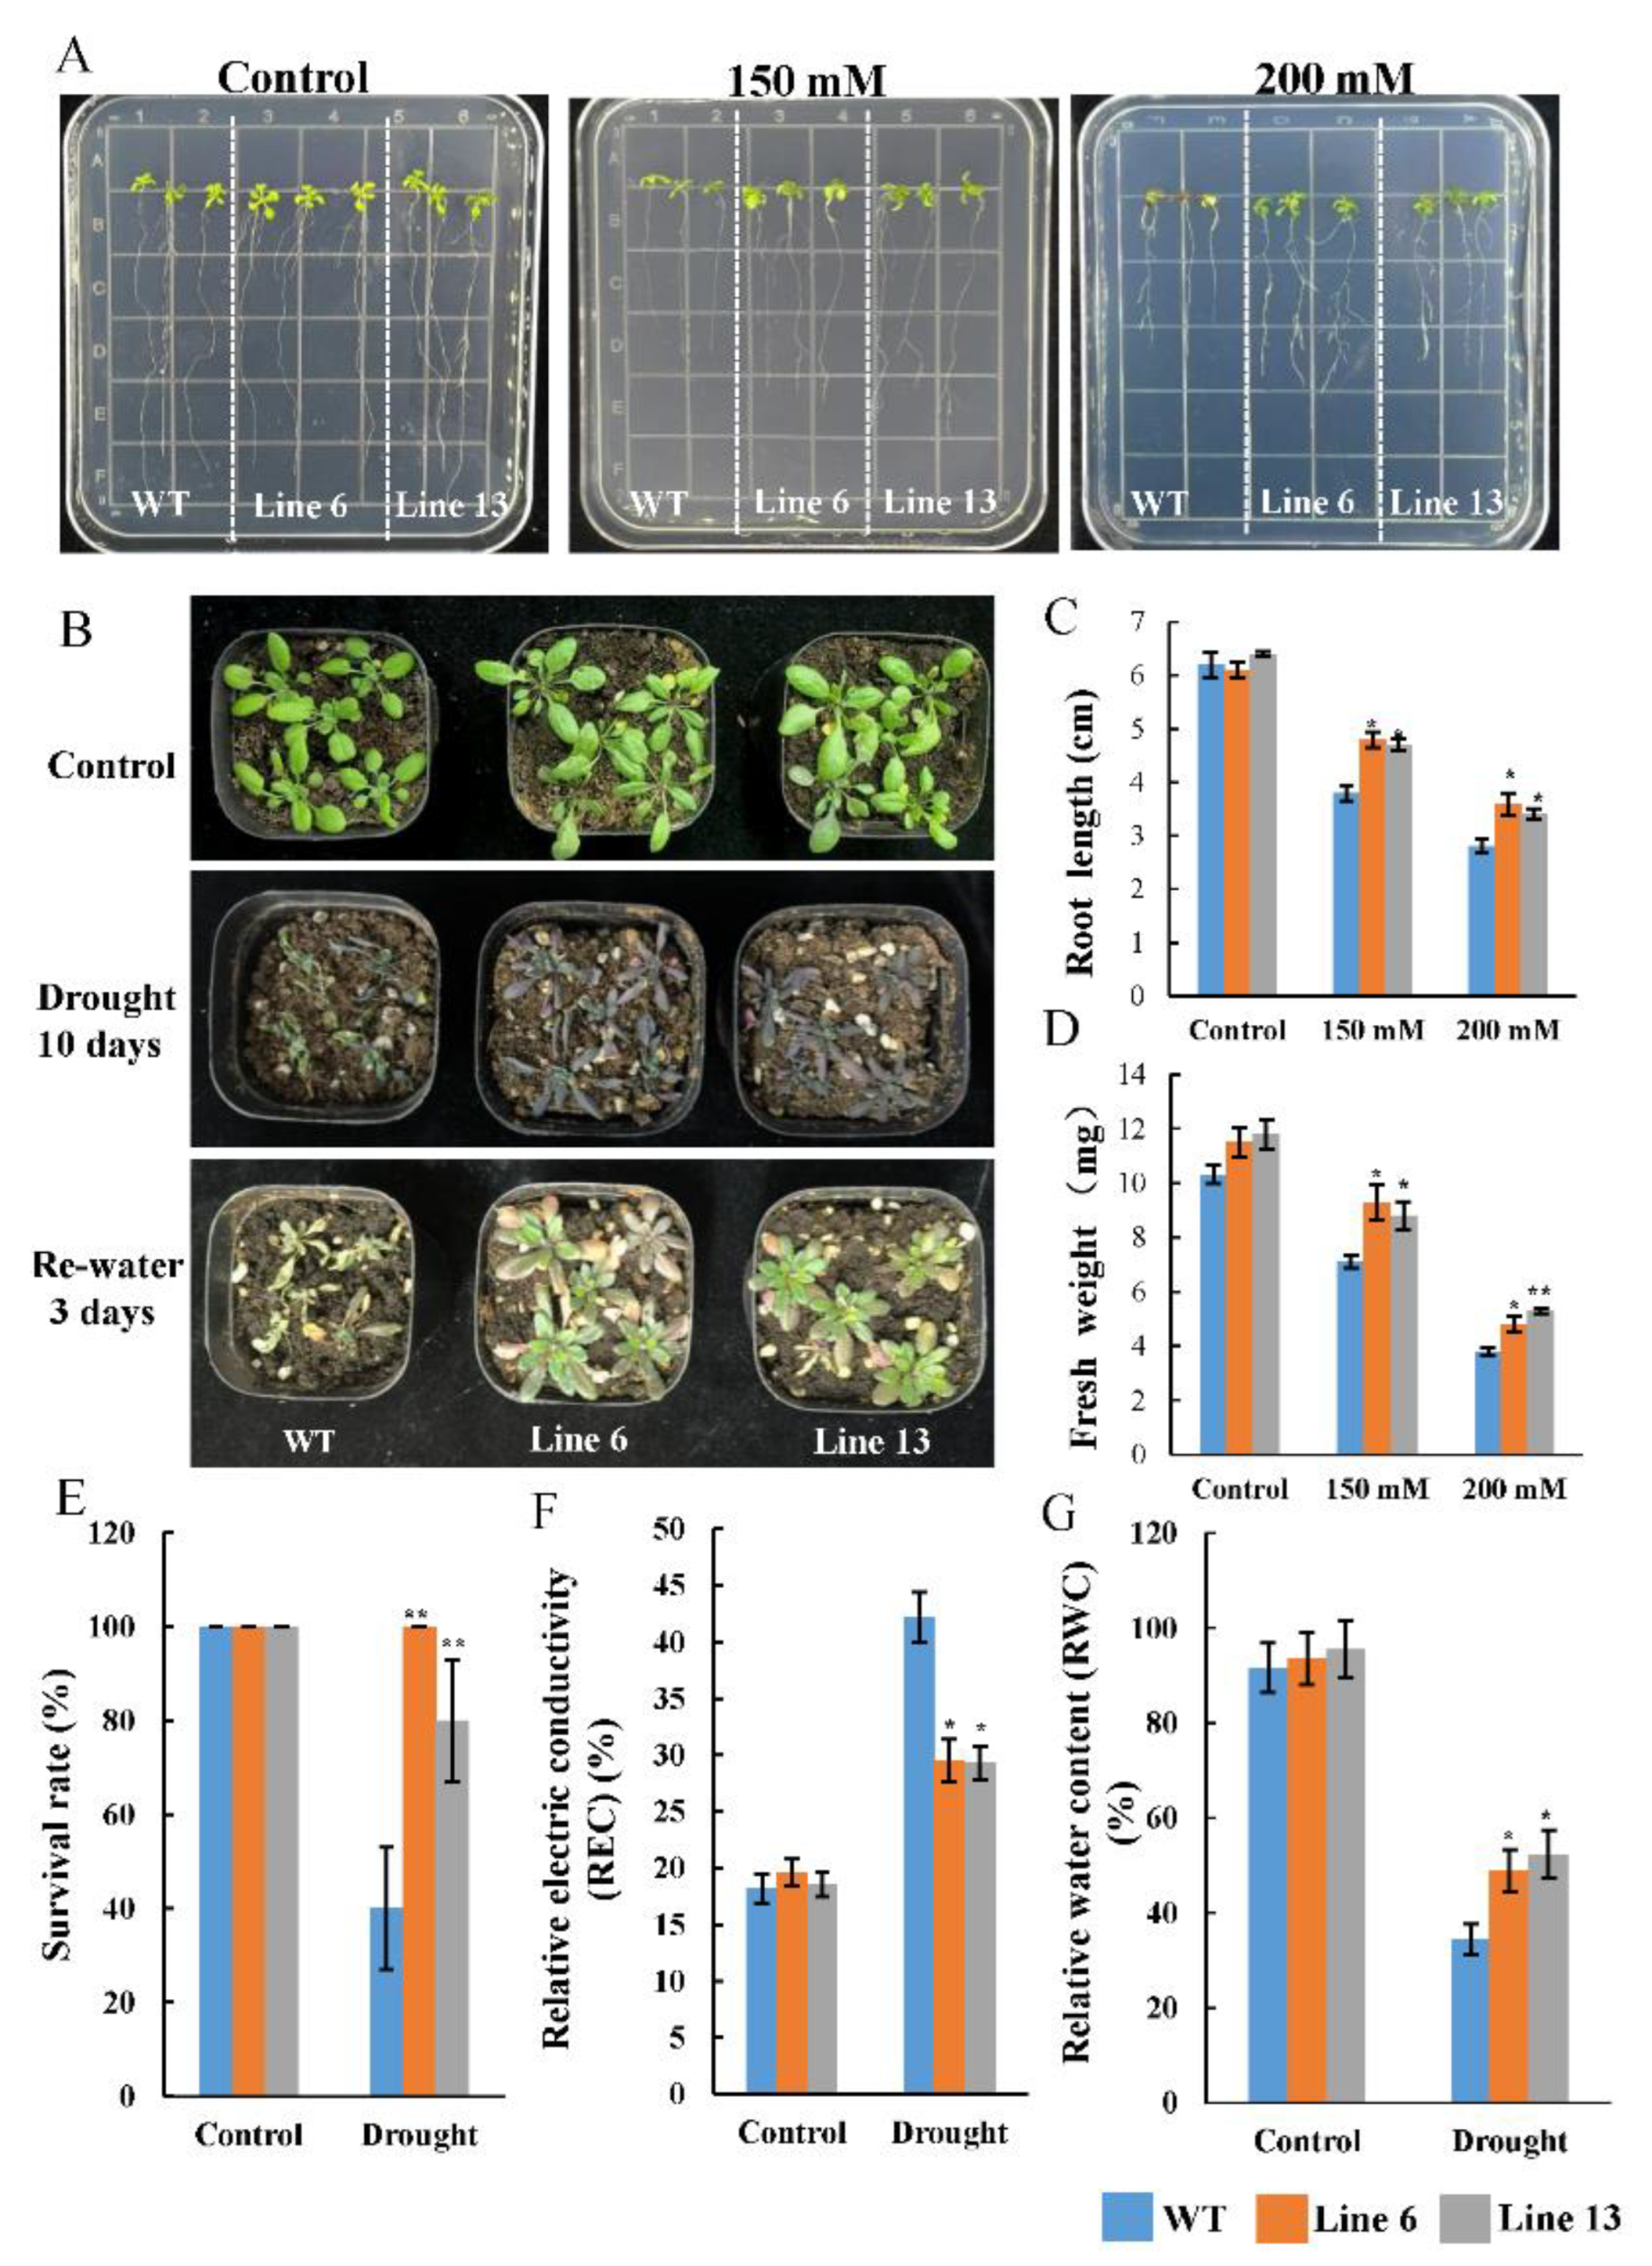
2.7. Analysis of the Drought Tolerance of AtruNAC36-Overexpressing Transgenic A. thaliana

The AtruNAC36 coding sequence was inserted into the pCAMBIA1302 vector using ClonExpress II One Step Cloning Kit (Vazyme, Nanjing, China) to construct the 35S::AtruNAC36 recombinant plasmid, which was used to transform A. thaliana plants according to the floral dip method [32]. After screened using hygromycin, more than 30 AtruNAC36-overexpressing transgenic lines were obtained, of which two homozygous AtruNAC36-overexpressing transgenic lines with high relative AtruNAC36 expression levels were selected for the drought treatment. Two developmental stages of AtruNAC36-overexpressing transgenic seedling were chosen for drought stress tolerance analysis. The root length, fresh weight, survival rate, REC and RWC were measured and the 3, 3′-diaminobenzidine (DAB) and nitroblue tetrazolium (NBT) staining were performed as previously described [33].

3. Results

3.1. Physiological Responses of A. truncatum to Drought Stress

To explore the physiological responses of A. truncatum to drought stress, A. truncatum seedlings were withheld water for a number of days (i.e., 0, 3, 7, and 12 days) to simulate natural drought stress and then re-watered for 5 days (i.e., RW). The physiological indices of the seedlings were examined at these five time-points. The leaves gradually wilted as the duration of the simulated drought period increased (Figure S1), but after the seedlings were re-watered, the leaves recovered and appeared normal (Figure S1). The examination of specific physiological indices during the drought treatment period (0–12 days) revealed that RWC decreased gradually from 88.3% to 23.4% in response to drought stress, whereas REC increased significantly from 14.5% to 78.4%, reflecting the drought-induced damages to the seedlings. Both RWC and REC recovered after watering was resumed for 5 days. In addition, the SOD, POD, and CAT activities were increased as the drought treatment progressed, but then decreased after seedlings were re-watered (Figure 1C–E).

3.2. Identification of DEGs in A. truncatum under Drought Conditions

To clarify the molecular mechanism regulating the A. truncatum response to drought stress, an RNA-seq analysis was performed to reveal the drought-induced changes to gene expression. Paired-end read lengths of 125 bp were applied. A total of 98.08 Gb clean reads were obtained for the 15 samples (three replicates per time-point) with a Q30 score of at least 91.30%. Additionally, 89.53–92.16% of the reads were mapped to the A. truncatum genome. The detail information of RNA-seq data of A. truncate was listed in Table S2.
A PCA was performed to evaluate the uniformity of the data for the three biological replicates and the samples at five time-points. The first two principal components (PC1 and PC2) explained 87.83% of the total variation (Figure S2). The clustering of the three biological replicates for each time-point was indicative of the high repeatability of the results. The samples collected at the five time-points (0 d, 3 d,) were obviously separated. The distance separating samples was smallest between the day 0 and day 3 samples, followed by the day 0 and RW samples. In contrast, there were relatively large distances between the day 3 and day 7 samples as well as between the day 7 and day 12 samples and between the day 12 and RW samples (Figure S2).
A total of 9126 DEGs were detected among the five time-points (Figure 2A and Table S3). The 11 comparisons that were completed were divided into two groups. More specifically, Group I comprised the comparisons between the samples on day 0 and the samples at the other time-points (day 3, day 7, day 12, and RW samples), whereas Group II consisted of the time-course comparisons (3 d/0 d) (day 3 vs. day 0), 7 d/3 d, 12 d/7 d, and RW/7 d and other comparisons 12 d/3 d, RW/3 d, and RW/7 d. In Group I, the day 12 d/0 d comparison had the most DEGs (3974), of which 1639 and 2335 were up-regulated and down-regulated genes, respectively. The fewest DEGs (1946) were detected for the 3 d/0 d comparison, which was consistent with the close distance between the day 0 and day 3 samples. In Group II, the RW/12 d comparison had the most DEGs (5123), which included 2913 up-regulated genes and 2210 down-regulated genes. Some of the DEGs were common among comparisons (Figure 2). For example, 337 DEGs were detected in the 3 d/0 d, 7 d/0 d, and 12 d/0 d comparisons.
Transcription factors are crucial transcriptional regulators of plant responses to drought stress. A total of 483 TF genes from 53 gene families were identified among the detected DEGs (Table S4). The TF genes were mainly from the ERF family (47 genes), followed by the MYB (46 genes) and NAC (38 genes) families. Their expression levels were affected by drought stress. For example, the 12 d/0 d comparison revealed 124 and 107 TF genes with up-regulated and down-regulated expression levels, respectively (Figure 2).
To assess the reliability of the RNA-seq data, the following eight genes were selected for a quantitative real-time (qRT)-PCR analysis to determine their expression levels under drought conditions: Atru.chr5.3491 (AtruNAC36), Atru.chr7.1057 (MAPK family member), Atru.chr9.1574 (MYB family member), Atru.chr1.144 (protein phosphatase 2C family member), Atru.chr1.2580 (WRKY family member), Atru.chr1.3172 (ABC-2 type transporter), Atru.chr13.381 (ERF family member), and Atru.chr8.1096 (late embryogenesis abundant family member). For all eight genes, similar expression trends were revealed by the qRT-PCR and RNA-seq analyses (Figure S3), indicative of the reliability of the transcriptome data.

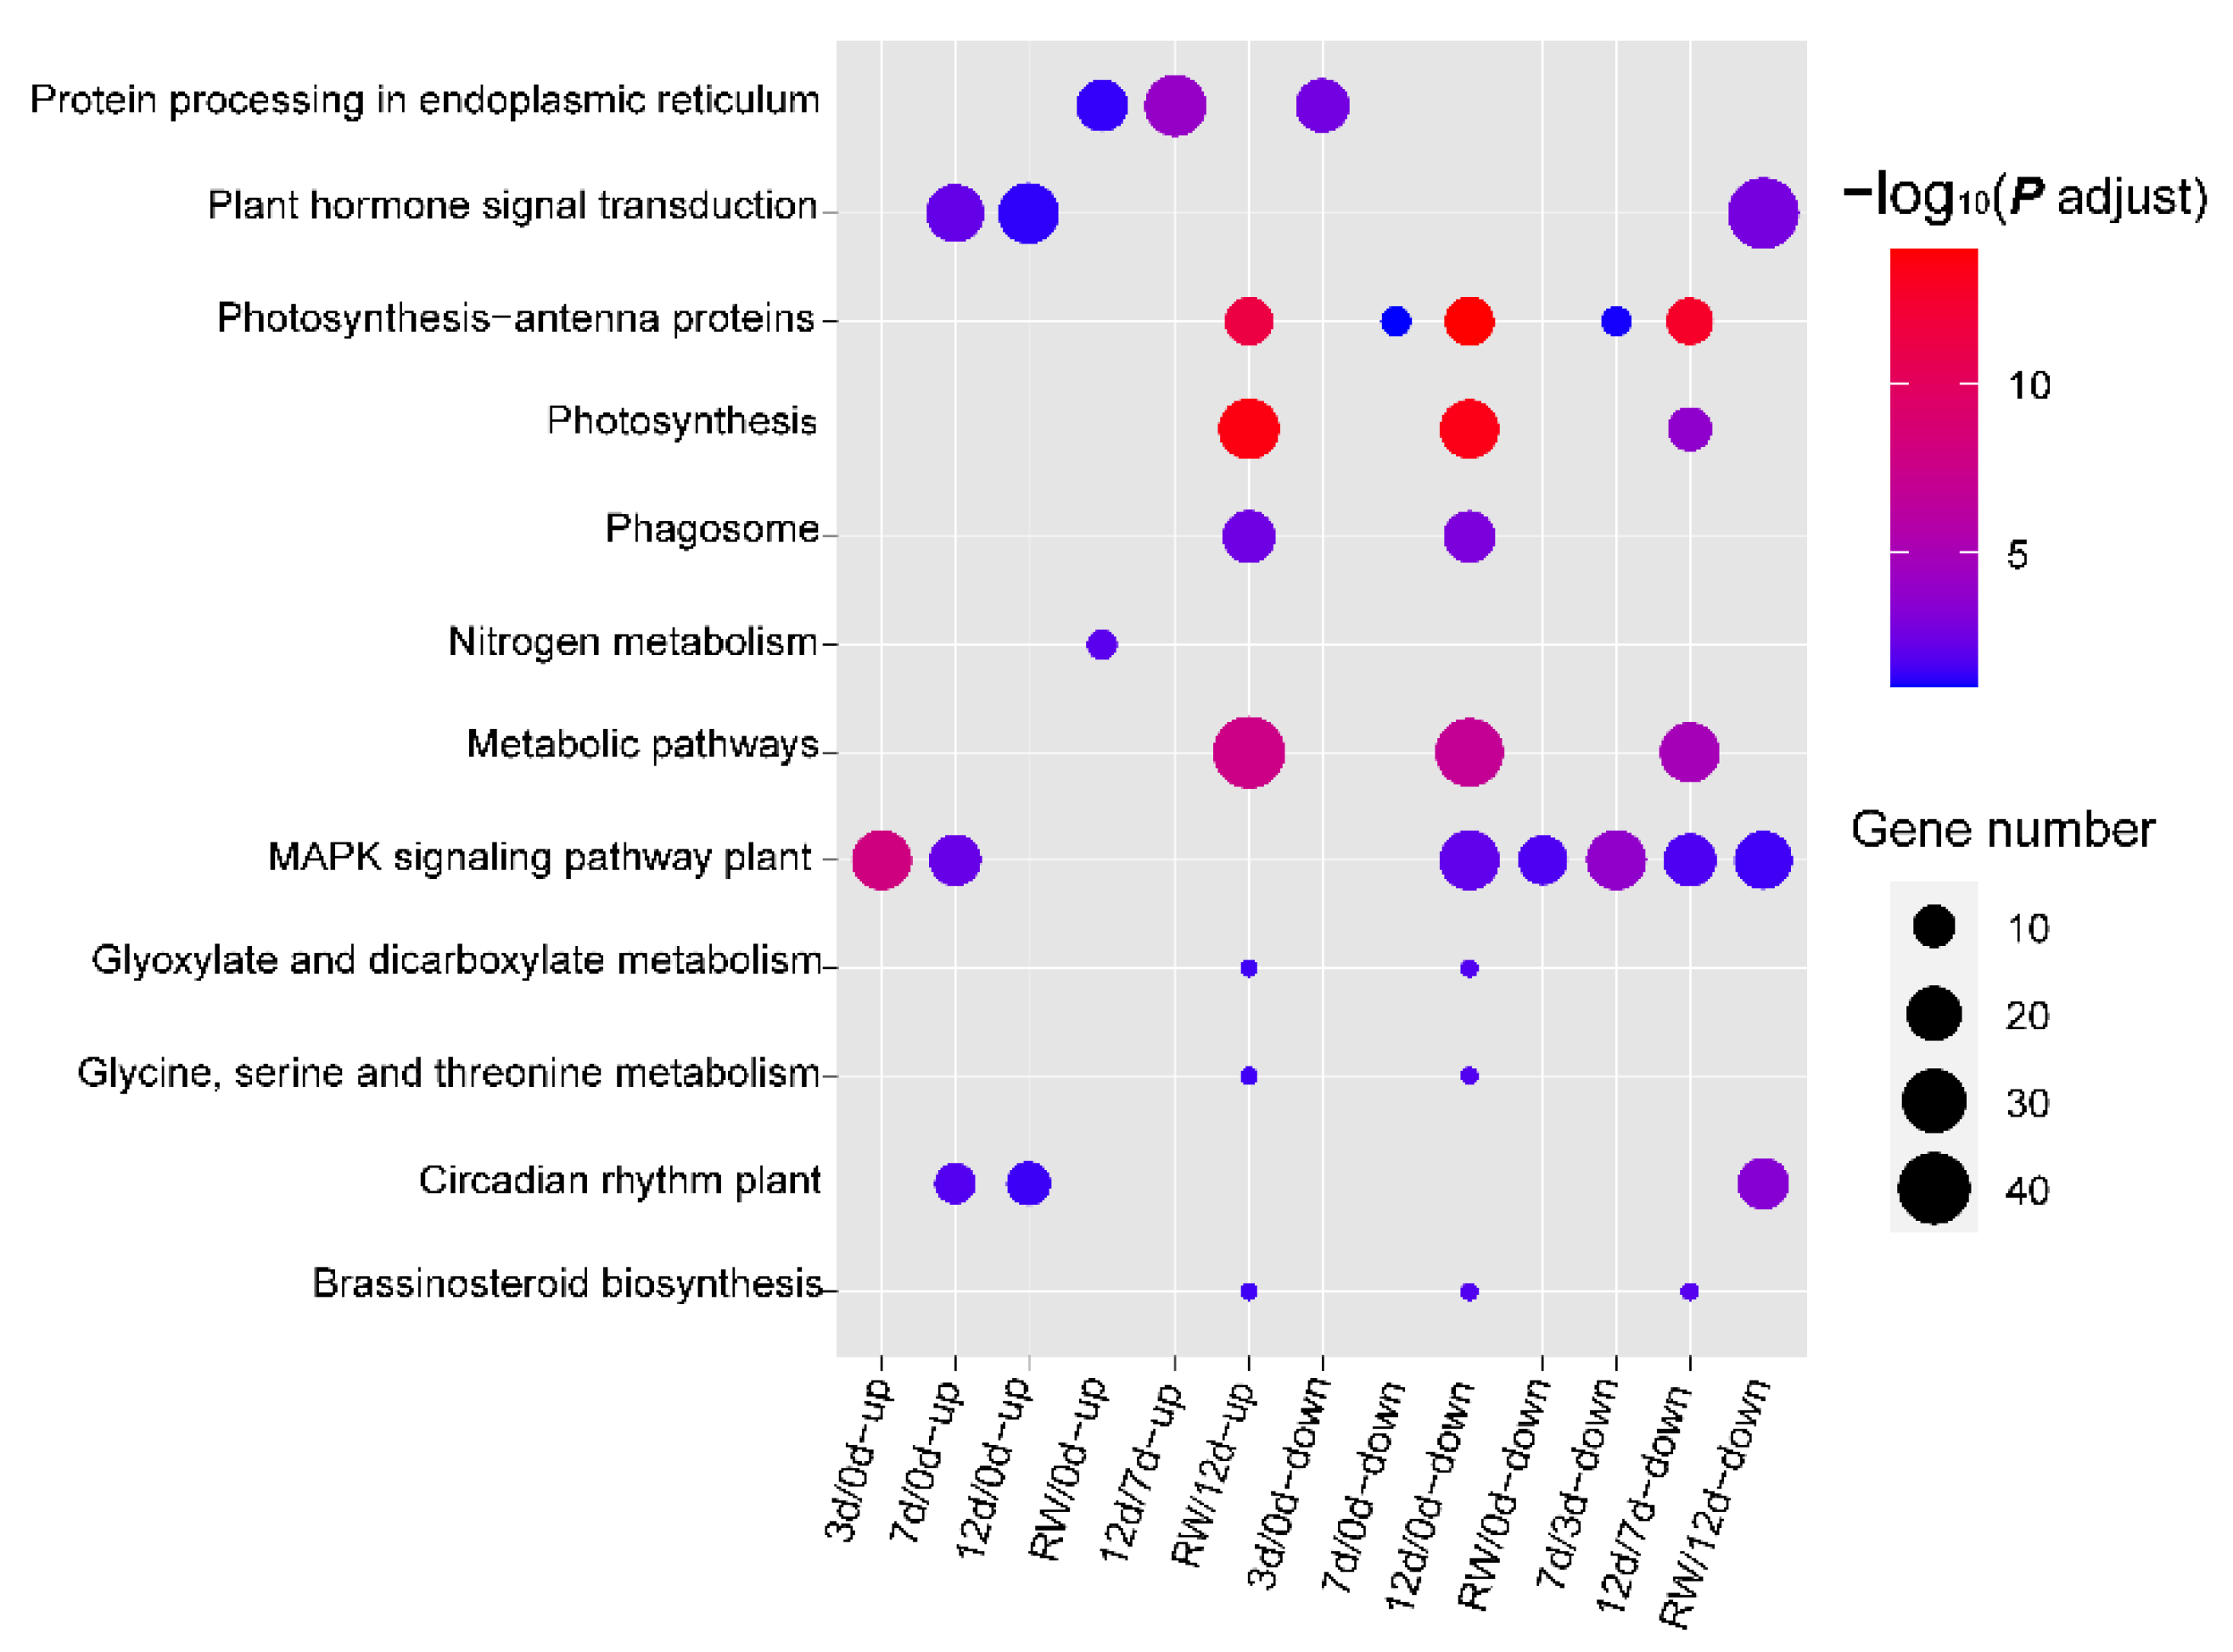
3.3. GO and KEGG Enrichment Analyses of DEGs

The DEG were functionally characterized according to a GO enrichment analysis (Figure 3). In the early drought stage (3 days), the enriched GO terms among the up-regulated genes were “carbohydrate metabolic process”, “carbohydrate catabolic process”, “microtubule-based process”, and “microtubule-based movement” (Figure 3A, Table S5). In the middle and later drought stages, the enriched GO term among the prominent up-regulated genes in the 7 d/0 d and 12 d/0 d comparisons was “stress related processes” (e.g., response to wounding, stress, water, and abiotic stimuli). Some of the up-regulated genes were also annotated with the “response to abscisic acid” and “response to lipid” GO terms. For the RW/12 d comparison, “stress related processes” and “photosynthesis” were the enriched GO terms assigned to the down-regulated and up-regulated genes, respectively (Figure 3), suggesting the 5-day re-watering period enabled the seedlings to recover from drought stress.
The KEGG analysis, which was completed to further explore the metabolic changes in A. truncatum induced by drought conditions, identified 12 enriched pathways (Figure 4, Table S6). The MAPK signaling pathway was a common enriched KEGG pathway among the DEGs detected in most comparisons. Both “photosynthesis–antenna proteins” and “photosynthesis” were enriched KEGG pathways related to the DEGs detected in the RW/12 d, 12 d/0 d, and 12 d/7 d comparisons. Moreover, according to the enriched KEGG pathways (e.g., “plant hormone signal transduction” and “brassinosteroid biosynthesis”), the DEGs revealed by some comparisons were associated with hormone-related processes (Figure 4).

3.4. Cluster Analysis of DEGs

The dynamic molecular responses of A. truncatum exposed to drought stress were further elucidated by classifying the DEGs on the basis of their expression trends. The 9126 DEGs were divided into 12 clusters (Figure 5, Table S7). The 681 genes whose expression levels were initially down-regulated in response to drought stress, but then rebounded during the recovery period, were grouped in Cluster 1; these genes were mainly associated with photosynthesis-related processes (e.g., photosynthesis, light harvesting, and the light reaction). Cluster 8 comprised 1333 genes with significantly up-regulated expression levels on day 3 of the drought treatment; the enriched KEGG pathways among these genes were “MAPK signaling pathway”, “plant hormone signal transduction”, and “proteasome”. The expression of the 626 genes in Cluster 4 was substantially induced on day 7 of the drought treatment; “plant hormone signal transduction” was the enriched KEGG pathway assigned to these genes. The expression of the genes in Clusters 3 and 9 peaked on day 12 of the drought treatment; the main KEGG pathways associated with these genes were “plant hormone signal transduction”, “RNA degradation”, and “circadian rhythm” (Table S8).

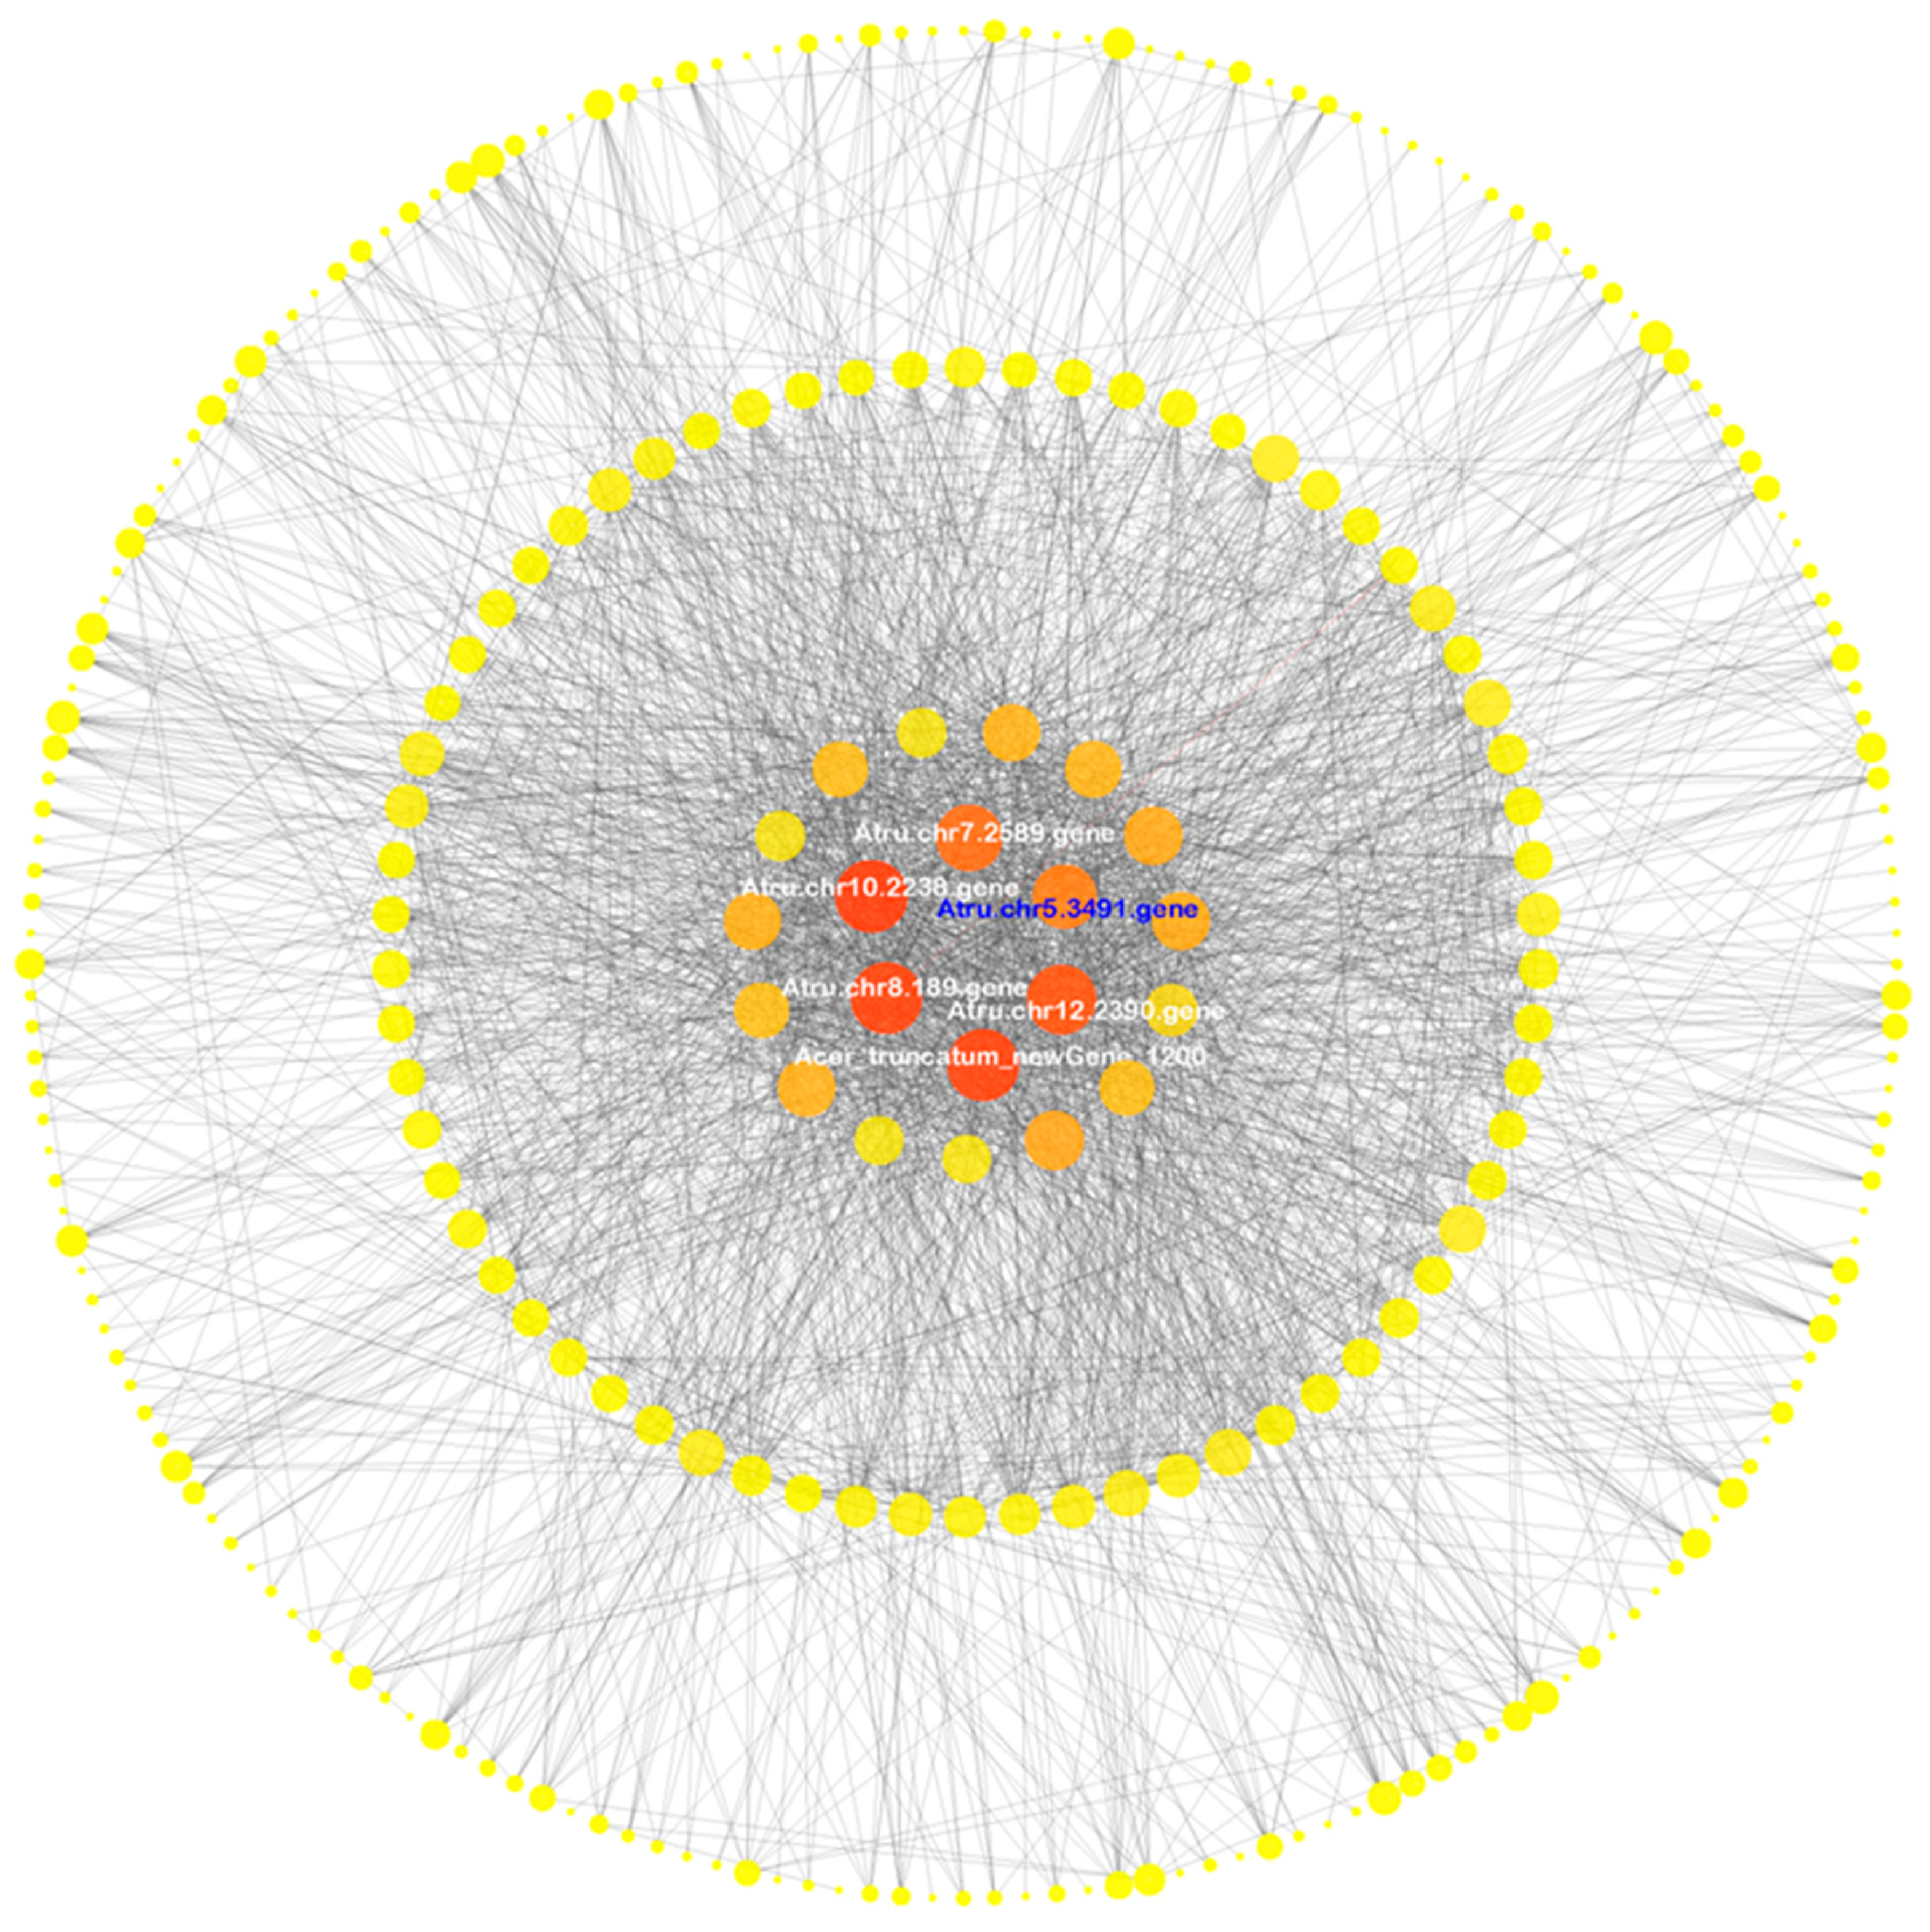
3.5. Co-Expression Network Analysis

To identify the key DEGs involved in the A. truncatum drought response, a WGCNA was conducted, which resulted in 12 distinct modules that were differentiated according to color in a dendrogram (Figure S4). The turquoise module was largest (2427 DEGs), followed by the blue (2325 DEGs) and yellow (747 DEGs) modules. In the co-expression network for the turquoise module, the genes encoding the gibberellin receptor AtruGID1B (Atru.chr5.1308), a receptor kinase (Atru.chr6.2180), the ethylene-responsive transcription factor AtruERF110 (Atru.chr13.2060), and a fatty acid biosynthesis-related protein (Atru.chr13.1709) had the highest connectivity values. In the co-expression network for the blue module, the highest connectivity values were obtained for the genes encoding the kinesin-like protein AtruKIN-12F (Atru.chr2.3626), microtubule-associated protein 3 (Atru.chr1.633), mitotic-specific cyclin AtruS13-6 (Atru.chr1.1390), and cellulose synthase-like protein D5 (Atru.chr5.1070). In the co-expression network for the yellow module, the genes encoding AtruNAC36 (Atru.chr5.3491), an LRR receptor-like serine/threonine-protein kinase (Acer_truncatum_newGene_11938), and AtruWRKY50 (Atru.chr7.1891) had the highest connectivity values. Thus, we speculated that the genes in the turquoise, blue, and yellow modules may mediate the A. truncatum response to drought stress. The co-expression networks for these three modules were visualized (Figure 6, Figure S5 and Figure S6, Table S9).

3.6. Isolation and Characterization of AtruNAC36

Among the hub genes, AtruNAC36 had a high connectivity value in the co-expression network for the yellow module. Additionally, its expression levels increased significantly on days 3, 7, and 12 of the drought treatment, indicative of the importance of the encoded protein throughout the exposure to drought stress. Thus, AtruNAC36 was functionally characterized. The protein structural analysis suggested AtruNAC36 contains a NAC domain (amino acids 6-152). The sequence alignment detected five subdomains in AtruNAC36 (Figure S7). To examine the subcellular localization of AtruNAC36, 35S::YFP-AtruNAC36 was constructed to produce AtruNAC36 with an N-terminal YFP in onion epidermal cells. The fluorescence of YFP was detected in the nucleus, indicating that AtruNAC36 is a nuclear protein (Figure 7A).
In addition, AtruNAC36 was analyzed in terms of transcriptional activation. The AtruNAC36 coding sequence and the sequences encoding the N-terminal and C-terminal of the protein were inserted into pGBKT7 vectors, which were then used to transform yeast cells. All transformants grew on the SD/−Trp medium, but only the yeast cells harboring the C-terminal of AtruNAC36 were able to grow on the SD/−Trp/−His/−Ade medium (i.e., blue colonies) (Figure 7B). Hence, the C-terminal of AtruNAC36 appears to be sufficient for transcriptional activation.
To determine whether AtruNAC36 can bind to NACRS, the tandemly repeated NACRS sequence (R) and the mutated sequences (RM1 and RM2) were used for Y1H assays. All yeast cells grew on the DDO (SD/−Leu/−Trp) medium (Figure 7B). In contrast, the yeast cells carrying pGAD-AtruNAC36/pHIS2-NACRS (R) and the positive control (P) grew normally on the TDO (SD/−Leu/−Trp/−His) medium supplemented with 50 mM 3-AT, but the growth of the cells with the mutated sequences (RM1 and RM2) and the negative control (N) was inhibited (Figure 7C). These results confirmed that AtruNAC36 can bind specifically to NACRS.

3.7. Overexpression of AtruNAC36 Enhanced Drought Tolerance

To elucidate the AtruNAC36 function, AtruNAC36-overexpressing transgenic A. thaliana lines were generated, of which lines 6 and 13 had high AtruNAC36 expression levels and were selected for an assessment of drought tolerance (Figure S5). Under normal conditions, there were no significant differences in the root length, fresh weight, REC, and RWC between the wild-type (WT) and transgenic seedlings (Figure 8). To further clarify the role of AtruNAC36 during the A. truncatum response to drought stress, seedlings were grown on MS medium for 1 week and then transferred to mannitol medium to simulate drought conditions. The growth of the WT and AtruNAC36-overexpressing transgenic seedlings was significantly suppressed after 1 week in the mannitol medium. However, the WT seedlings had shorter roots and a lower fresh weight than the AtruNAC36-overexpressing seedlings. More specifically, the average root lengths for the WT and AtruNAC36-overexpressing seedlings in the 150 mM mannitol medium were 3.8 and 4.7 cm, respectively (Figure 8A,C). Additionally, drought tolerance was evaluated using adult plants. After withholding water for 10 days, the transgenic plants had fewer wilted and curled rosette leaves than the WT plants. Consistent with the observed phenotypes, the transgenic plants had a significantly higher RWC, but a lower REC, than the WT plants under drought conditions. Furthermore, after the re-watering period, the transgenic plants had a higher survival rate than the WT plants (i.e., better recovery from drought stress). Accordingly, the overexpression of AtruNAC36 enhanced drought tolerance.

3.8. Overexpression of AtruNAC36 Increased ROS-Scavenging Efficiency

Drought stress leads to the excessive generation of ROS. The associated inhibitory effects on plant growth may be mitigated by ROS-scavenging antioxidant enzymes. In this study, the H2O2 and O2 contents in the leaves of WT and AtruNAC36-overexpressing plants were analyzed via NBT and DAB staining. The number of colored regions and the intensity of the staining were greater for the WT leaves than for the AtruNAC36-overexpressing leaves following the NBT and DAB staining analyses of the drought-treated seedlings (Figure 9). These results indicated that the H2O2 and O2 contents were lower in the AtruNAC36-overexpressing plants than in the WT plants exposed to drought stress.
Furthermore, antioxidant enzyme activities were measured. Under normal conditions, AtruNAC36-overexpressing plants had higher SOD activities than the WT plants, whereas there were no differences in the POD and CAT activities. Under drought conditions, the SOD, POD, and CAT activities increased significantly in the transgenic plants relative to the corresponding levels in the WT plants. Hence, the overexpression of AtruNAC36 increased the antioxidant enzyme activities.

4. Discussion

Drought stress severely inhibits plant development and induces a series of physiological changes [6]. In the current study on A. truncatum, the leaf RWC gradually decreased and the REC increased (Figure 1) during the 12-day drought treatment period, suggesting that the extent of the cell membrane damage increased as the exposure to drought stress was prolonged. Drought stress also leads to oxidative damage. Accordingly, the activities of antioxidant enzymes (e.g., POD, SOD, and CAT) are induced to eliminate the excessive amounts of ROS. In A. truncatum, the SOD, POD, and CAT activities increased under drought conditions (day 0 to day 12). The enhanced antioxidant enzyme activities indicated that the A. truncatum response to drought stress may involve the modulation of ROS homeostasis, thereby limiting cellular damage.
The regulated transcription of stress-related genes is an important molecular mechanism underlying adaptive responses. In the present study, 9126 DEGs were identified. The expression levels of the genes involved in “photosynthesis” were down-regulated under drought conditions, but recovered after the re-watering period according to the RW/12 d comparison. These findings reflected the adverse effects of drought stress on photosynthetic activities. The KEGG analysis revealed that many of the DEGs detected in the current study are involved in the MAPK signaling pathway. Earlier research confirmed that MAPK signal transduction plays a vital role in eukaryotic responses to extracellular stimuli [34]. Several MAPK family members have been isolated and functionally characterized in multiple plants. For example, in maize, ZmMAPK1 expression is induced by drought stress; the overexpression of this gene in transgenic plants leads to drought tolerance [35]. The expression of SlMAPK1 in tomato is also induced under drought conditions; the constitutive overexpression of SlMAPK1 increases drought tolerance through enhanced antioxidant enzyme activities [36]. In plants, MAPK cascade is responsible for controlling the antioxidant defense system and osmotic regulation system [37]. The antioxidant activities were increased in A. truncatum under drought stress which indicated that MAPK signal transduction pathway was implicated in drought stress in A. truncatum, and it is essential to look into the functions of the DEGs that enriched in MAPK signaling pathway in greater detail.
In addition, one of the enriched GO terms assigned to some of the identified DEGs was “response to abscisic acid”. ABA is a phytohormone that functions as a chemical signal that influences plant development and responses to adverse conditions. When plants are exposed to drought stress, endogenous ABA levels increase, while physiological processes (e.g., stomatal closure) are activated and the expression of stress-responsive genes is induced to enable plants to adapt to drought conditions [38]. ABA also regulated the production of ROS, and H2O2 causes the phosphorylation of MAPK, which is a factor in multiple signal transduction pathways that control gene expression downstream [39]. In the 7 d/0 d and 12 d/0 d comparisons, respectively, 16 and 17 DEGs were found to be upregulated, and these DEGs were enriched in ABA response process. These results imply the regulation of ABA signaling may be critical for the A. truncatum response to drought stress. Further research is needed to determine if the above DEGs are involved in ROS production and MAPK signaling pathways under drought stress.
Transcription factors regulate various biological processes. Many TF families, such as ERF, MYB, WRKY, and NAC, comprise important regulators of plant responses to abiotic stress. In the current study, 483 TF genes from 53 families (e.g., ERF, MYB, and NAC) were detected as DEGs. The ERF genes encode plant-specific TFs, most of which positively affect plant responses to drought stress. The overexpression of AtERF1 and AtERF019 can enhance the drought tolerance of A. thaliana [40,41]. Similar findings have been reported for the overexpression of ZmEREBP60 [42], OsERF115 [43], and OsERF71 [44]. In A. truncatum, AtruDREB28 was induced by drought stress and play positive role in drought stress resistance in our previous study [45]. Additionally, MYB genes also contribute to plant defenses against drought stress. Examples include PbrMYB21 in Pyrus betulaefolia [46], MbMYB4 in Malus baccata [47], and IbMYB48 in sweet potato [48]. On the basis of their expression patterns in A. truncatum and the functions of their orthologs in other species, these induced TF genes may be useful for improving A. truncatum drought tolerance.
Following our WGCNA, co-expression networks consisting of drought stress-related genes in A. truncatum were constructed and several important hub genes were identified, including AtruNAC36, which belongs to the NAC family. Several NAC genes have been analyzed and functionally characterized in many plants [14,15,49], but relatively little is known about NAC genes in A. truncatum. In the present study, sequence alignments indicated that AtruNAC36 has a diverse C-terminal domain and a conserved N-terminal domain that includes five conserved subdomains. Moreover, transactivation was observed for the AtruNAC36 C-terminal region, but not for the full-length sequence. Furthermore, in an earlier study involving a yeast self-activation detection system, the LVFY motif in the N-terminal domain of NAC was demonstrated to have repressive effects [50], which likely explains the lack of transactivation for the full-length AtruNAC36 protein. Thus, AtruNAC36 activity depends on its interaction with other proteins or structures in vivo. In addition, AtruNAC36 can specifically bind to the NACRS element, indicating that AtruNAC36 might regulate its downstream target genes by binding to NACRS in the promoter. However, future research will need to analyze the target genes and interacted proteins of AtruNAC36 in more detail to reveal its molecular mechanism.
Two developmental stages of AtruNAC36-overexpressing A. thaliana plants were examined to further clarify the AtruNAC36 function. Two-week old AtruNAC36-overexpressing seedlings had longer roots and a higher fresh weight than the WT seedlings in mannitol medium. The AtruNAC36-overexpressing adult plants had a higher survival rate and RWC, but a lower REC, than the WT adult plants. The plants overexpressing AtruNAC36 also had significantly higher SOD, POD, and CAT activities, but lower H2O2 and O2 contents, than the WT controls. These findings suggest that AtruNAC36 confers drought tolerance by promoting the activity of ROS-scavenging enzymes. The functional verification of AtruNAC36 further confirmed the reliability of our method for identifying hub genes.

5. Conclusions

In this study, physiological and transcriptome sequencing analyses of A. truncatum samples that had been exposed to drought were performed to understand the regulatory mechanisms associated with drought tolerance. Antioxidant enzyme activities were significantly induced after drought treatment, indicating A. truncatum might limit cellular damage through modulation of ROS homeostasis to resist drought stress. The identified DEGs were primarily involved in activating ABA responses and MAPK signaling. AtruNAC36 was identified as one of a major hub genes from co-expression network, and the overexpression of AtruNAC36 in A. thaliana could enhance the drought tolerance of transgenic plants, suggesting that the construction of co-expression network was an efficient strategy to screen key genes from a large number of DEGs. These results provide insights into the transcriptional regulatory mechanism underlying the A. truncatum response to drought stress. Additionally, AtruNAC36 can serve as a candidate gene to improve the drought tolerance of forest trees through molecular breeding.

Supplementary Materials

The following supporting information can be downloaded at: https://www.mdpi.com/article/10.3390/antiox12071339/s1, Figure S1. Phenotypic characteristics of A. truncatum under drought conditions. Figure S2. Principal component analysis of three biological replicates and 15 samples at five time-points. Figure S3. Quantitative real-time (qRT)-PCR analysis of eight genes. Gray columns represent the FPKM values of the eight genes at five time-points (calculated using RNA-seq data for 15 samples) and red lines indicate the relative expression levels of the eight genes as determined by qRT-PCR. Transcript levels at day 0 were set to 1. Enclosed in brackets are the Pearson correlation coefficients between FPKM values from RNA-Seq and RGE values from qPCR. Figure S4. Weighted gene co-expression network analysis of the DEGs in A. truncatum under control and stress conditions. (A) Dendrogram of all DEGs based on the WGCNA analysis, with 12 modules defined. (B) The eigengene network shows the relationships among the 12 modules. Figure S5. Cytoscape visualization of the co-expression network in the turquoise module. Figure S6. Cytoscape visualization of the co-expression network in the blue module. Figure S7. Alignment of the AtruNAC36 and AtNAC036 protein sequences. Five subdomains are labeled with red boxes. Asterisks represent the LVFY motif. Figure S8. Relative AtruNAC36 expression levels in transgenic plants. Table S1. Primers used in this study. Table S2. Overview of the RNA-seq data for A. truncatum under drought conditions. Table S3. Identified DEGs in A. truncatum under drought conditions. Table S4. Transcription factor genes among the identified DEGs. Table S5. Selection of DEGs in A. truncatum under drought conditions for the GO enrichment analysis. Table S6. Selection of DEGs in A. truncatum under drought conditions for the KEGG enrichment analysis. Table S7. Genes in different clusters. Table S8. KEGG enrichment analysis of the DEGs in different clusters. Table S9. Genes in co-expression networks.

Author Contributions

J.L. designed this research and wrote the manuscript. H.M., J.Z. and Y.Y. performed the data collation and statistical analysis. W.G. and G.Z. contributed with suggestions and reviewed the manuscript. W.Y. and J.L. reviewed and edited the manuscript. All authors have read and agreed to the published version of the manuscript.

Funding

This work was supported by the National Nonprofit Institute Research Grant of the Chinese Academy of Forestry (CAFYBB2021QB006 and CAFYBB2022QC003).

Institutional Review Board Statement

Not applicable.

Informed Consent Statement

Not applicable.

Data Availability Statement

The data presented in this study are available in Supplementary Materials.

Acknowledgments

We thank the Scientific instrument Platform of the State Key Laboratory of Tree Genetics and Breeding, Chinese Academy of Forestry.

Conflicts of Interest

The authors declare no conflict of interest.

References

  1. Farooq, M.; Wahid, A.; Kobayashi, N.; Fujita, D.; Basra, S.M.A. Plant drought stress: Effects, mechanisms and management. Agron. Sustain. Dev. 2009, 29, 185–212. [Google Scholar] [CrossRef] [Green Version]
  2. Lamers, J.; Meer, T.; Testerink, C. How plants sense and respond to stressful environments. Plant Physiol. 2020, 182, 1624–1635. [Google Scholar] [CrossRef] [PubMed] [Green Version]
  3. Sharma, P.; Jha, A.B.; Dubey, R.S.; Pessarakli, M. Reactive oxygen species, oxidative damage, and antioxidative defense mechanism in plants under stressful conditions. J. Bot. 2012, 2012, 217037. [Google Scholar] [CrossRef] [Green Version]
  4. Mates, J.M. Effects of antioxidant enzymes in the molecular control of reactive oxygen species toxicology. Toxicology 2022, 153, 83–104. [Google Scholar] [CrossRef]
  5. Gao, G.; Lv, Z.; Zhang, G.; Li, J.; Zhang, J.; He, C. An ABA-flavonoid relationship contributes to the differences in drought resistance between different sea buckthorn subspecies. Tree Physiol. 2020, 41, 744–755. [Google Scholar] [CrossRef] [PubMed]
  6. Fox, H.; Doron-Faigenboim, A.; Kelly, G.; Bourstein, R.; Attia, Z.; Zhou, J.; Moshe, Y.; Moshelion, M.; David-Schwartz, R. Transcriptome analysis of Pinus halepensis under drought stress and during recovery. Tree Physiol. 2018, 38, 423–441. [Google Scholar] [CrossRef] [PubMed] [Green Version]
  7. Zhao, X.; Bai, S.; Li, L.; Han, X.; Li, J.; Zhu, Y.; Fang, Y.; Zhang, D.; Li, S. Comparative transcriptome analysis of two Aegilops tauschii with contrasting drought tolerance by RNA-Seq. Int. J. Mol. Sci. 2020, 21, 3595. [Google Scholar] [CrossRef] [PubMed]
  8. Haas, J.C.; Vergara, A.; Serrano, A.R.; Mishra, S.; Hurry, V.; Street, N.R. Candidate regulators and target genes of drought stress in needles and roots of Norway spruce. Tree Physiol. 2021, 41, 1230–1246. [Google Scholar] [CrossRef]
  9. Jia, H.; Zhang, J.; Li, J.; Sun, P.; Zhang, Y.; Xin, X.; Lu, M.; Hu, J. Genome-wide transcriptomic analysis of a desert willow, Salix psammophila, reveals the function of hub genes SpMDP1 and SpWRKY33 in drought tolerance. BMC Plant Biol. 2019, 19, 356. [Google Scholar] [CrossRef] [Green Version]
  10. Yamaguchi, M.; Ohtani, M.; Mitsuda, N.; Kubo, M.; Ohme-Takagi, M.; Fukuda, H.; Demura, T. VND-INTERACTING2, a NAC domain transcription factor, negatively regulates xylem vessel formation in Arabidopsis. Plant Cell 2010, 22, 1249–1263. [Google Scholar] [CrossRef] [Green Version]
  11. Zhao, C.; Lasses, T.; Bako, L.; Kong, D.; Zhao, B.; Chanda, B.; Bombarely, A.; Cruz-Ramirez, A.; Scheres, B.; Brunner, A.M.; et al. XYLEM NAC DOMAIN1, an angiosperm NAC transcription factor, inhibits xylem differentiation through conserved motifs that interact with RETINOBLASTOMA-RELATED. New Phytol. 2017, 216, 76–89. [Google Scholar] [CrossRef] [Green Version]
  12. Takada, S.; Hibara, K.; Ishida, T.; Tasaka, M. The CUP-SHAPED COTYLEDON1 gene of Arabidopsis regulates shoot apical meristem formation. Development 2001, 128, 1127–1135. [Google Scholar] [CrossRef]
  13. Puranik, S.; Sahu, P.P.; Srivastava, P.S.; Prasad, M. NAC proteins: Regulation and role in stress tolerance. Trends Plant Sci. 2012, 17, 369–381. [Google Scholar] [CrossRef]
  14. Bu, Q.; Jiang, H.; Li, C.B.; Zhai, Q.; Zhang, J.; Wu, X.; Sun, J.; Xie, Q.; Li, C. Role of the Arabidopsis thaliana NAC transcription factors ANAC019 and ANAC055 in regulating jasmonic acid-signaled defense responses. Cell Res. 2008, 18, 756–767. [Google Scholar] [CrossRef] [Green Version]
  15. Sukiran, N.L.; Ma, J.C.; Ma, H.; Su, Z. ANAC019 is required for recovery of reproductive development under drought stress in Arabidopsis. Plant Mol. Biol. 2019, 99, 161–174. [Google Scholar] [CrossRef] [PubMed]
  16. Jia, D.; Gong, X.; Li, M.; Li, C.; Sun, T.; Ma, F. Overexpression of a novel apple NAC transcription factor gene, MdNAC1, confers the dwarf phenotype in transgenic apple (Malus domestica). Genes 2018, 9, 229. [Google Scholar] [CrossRef] [Green Version]
  17. An, J.P.; Yao, J.F.; Xu, R.R.; You, C.X.; Wang, X.F.; Hao, Y.J. An apple NAC transcription factor enhances salt stress tolerance by modulating the ethylene response. Physiol. Plantarum 2018, 164, 279–289. [Google Scholar] [CrossRef] [PubMed] [Green Version]
  18. Zhang, X.; Cheng, Z.; Zhao, K.; Yao, W.; Sun, X.; Jiang, T.; Zhou, B. Functional characterization of poplar NAC13 gene in salt tolerance. Plant Sci. 2019, 281, 1–8. [Google Scholar] [CrossRef]
  19. Jiang, C.; Iu, B.; Singh, J. Requirement of a CCGAC cis-acting element for cold induction of the BN115 gene from winter Brassica napus. Plant Mol. Biol. 1996, 30, 679–684. [Google Scholar] [CrossRef] [PubMed]
  20. Shang, X.; Yu, Y.; Zhu, L.; Liu, H.; Chai, Q.; Guo, W. A cotton NAC transcription factor GhirNAC2 plays positive roles in drought tolerance via regulating ABA biosynthesis. Plant Sci. 2020, 296, 110498. [Google Scholar] [CrossRef] [PubMed]
  21. Ma, Q.; Sun, T.; Li, S.; Wen, J.; Zhu, L.; Yin, T.; Yan, K.; Xu, X.; Li, S.; Mao, J.; et al. The Acer truncatum genome provides insights into nervonic acid biosynthesis. Plant J. 2020, 104, 662–678. [Google Scholar] [CrossRef]
  22. Hu, P.; Xu, X.; Yu, L. Physicochemical properties of Acer truncatum seed oil extracted using supercritical carbon dioxide. J. Am. Chem. Soc. 2017, 94, 779–786. [Google Scholar] [CrossRef]
  23. Dong, L.P.; Liu, H.Y.; Ni, W.; Li, J.Z.; Chen, C.X. Four new compounds from the leaves of Acer truncatum. Chem. Biodivers. 2006, 3, 791–798. [Google Scholar] [CrossRef] [PubMed]
  24. Fan, Y.; Lin, F.; Zhang, R.; Wang, M.; Gu, R.; Long, C. Acer truncatum Bunge: A comprehensive review on ethnobotany, phytochemistry and pharmacology. J. Ethnopharmacol. 2022, 282, 114572. [Google Scholar] [CrossRef] [PubMed]
  25. Wu, M.; Tian, Y.; Fan, D.; Zhang, X. Hydraulic regulation of Populus tomentosa and Acer truncatum under drought stress. Chin. J. Plant Ecol. 2022, 46, 1086–1097. [Google Scholar] [CrossRef]
  26. Li, L.; Manning, W.J.; Tong, L.; Wang, X.K. Chronic drought stress reduced but not protected Shantung maple (Acer truncatum Bunge) from adverse effects of ozone (O3) on growth and physiology in the suburb of Beijing, China. Environ. Pollut. 2015, 201, 34–41. [Google Scholar] [CrossRef]
  27. Wang, L.; Qu, L.; Li, H.; Wang, T.; Hu, X.; Yuan, X.; Guo, X. The Effects of dual ozone and drought stresses on the photosynthetic properties of Acer rubrum and A. pictum. Forests 2023, 14, 998. [Google Scholar] [CrossRef]
  28. Hu, H.; Liu, Y.; He, B.; Chen, X.; Ma, L.; Luo, Y.; Fei, X.; Wei, A. Integrative physiological, transcriptome, and metabolome analysis uncovers the drought responses of two Zanthoxylum bungeanum cultivars. Ind. Crop. Prod. 2022, 189, 115812. [Google Scholar] [CrossRef]
  29. Langmead, B.; Salzberg, S. Fast gapped-read alignment with Bowtie 2. Nat. Methods 2012, 9, 357–359. [Google Scholar] [CrossRef] [Green Version]
  30. Young, M.D.; Wakefield, M.J.; Smyth, G.K.; Oshlack, A. Gene ontology analysis for RNA-seq: Accounting for selection bias. Genome Biol. 2010, 11, R14. [Google Scholar] [CrossRef] [Green Version]
  31. Mao, X.; Cai, T.; Olyarchuk, J.G.; Wei, L. Automated genome annotation and pathway identification using the KEGG Orthology (KO) as a controlled vocabulary. Bioinformatics 2005, 21, 3787–3793. [Google Scholar] [CrossRef]
  32. Clough, S.J.; Bent, A.F. Floral dip: A simplified method for agrobacterium-mediated transformation of Arabidopsis thaliana. Plant J. 1998, 16, 735–743. [Google Scholar] [CrossRef] [Green Version]
  33. Jia, H.; Li, J.; Zhang, J.; Sun, P.; Lu, M.; Hu, J. The Salix psammophila SpRLCK1 involved in drought and salt tolerance. Plant Physiol. Bioch. 2019, 144, 222–233. [Google Scholar] [CrossRef]
  34. Taj, G.; Agarwal, P.; Grant, M.; Kumar, A. MAPK machinery in plants: Recognition and response to different stresses through multiple signal transduction pathways. Plant Signal. Behav. 2010, 5, 1370–1378. [Google Scholar] [CrossRef] [PubMed] [Green Version]
  35. Wu, L.; Zu, X.; Zhang, H.; Wu, L.; Xi, Z.; Chen, Y. Overexpression of ZmMAPK1 enhances drought and heat stress in transgenic Arabidopsis thaliana. Plant Mol. Biol. 2015, 88, 429–443. [Google Scholar] [CrossRef] [PubMed]
  36. Wang, L.; Zhao, R.; Li, R.; Yu, W.; Yang, M.; Sheng, J.; Shen, L. Enhanced drought tolerance in tomato plants by overexpression of SlMAPK1. Plant Cell Tiss. Org. 2018, 133, 27–38. [Google Scholar] [CrossRef]
  37. Yang, X.; Lu, M.; Wang, Y.; Wang, Y.; Liu, Z.; Chen, S. Response mechanism of plants to drought stress. Horticulturae 2021, 7, 50. [Google Scholar] [CrossRef]
  38. Hsu, P.; Dubeaux, G.; Takahashi, Y.; Schroeder, J. Signaling mechanisms in abscisic acid-mediated stomatal closure. Plant J. 2020, 105, 307–321. [Google Scholar] [CrossRef]
  39. Hossain, M.; Bhattacharjee, S.; Armin, S.; Qian, P.; Xin, W.; Li, H.; Burritt, D.; Fujita, M.; Tran, L. Hydrogen peroxide priming modulates abiotic oxidative stress tolerance: Insights from ROS detoxification and scavenging. Front. Plant Sci. 2015, 6, 420. [Google Scholar] [CrossRef] [Green Version]
  40. Cheng, M.C.; Liao, P.M.; Kuo, W.W.; Lin, T.P. The Arabidopsis Ethylene Response Factor1 regulates abiotic stress-responsive gene expression by binding to different cis-acting elements in response to different stress signals. Plant Physiol. 2013, 162, 1566–1582. [Google Scholar] [CrossRef] [PubMed] [Green Version]
  41. Scarpeci, T.E.; Frea, V.S.; Zanor, M.I.; Valle, E.M. Overexpression of AtERF019 delays plant growth and senescence, and improves drought tolerance in Arabidopsis. J. Exp. Bot. 2016, 68, 673–685. [Google Scholar]
  42. Zhu, Y.; Liu, Y.; Zhou, K.; Tian, C.; Aslam, M.; Zhang, B.; Liu, W.; Zou, H. Overexpression of ZmEREBP60 enhances drought tolerance in maize. J. Plant Physiol. 2022, 275, 153763. [Google Scholar] [CrossRef] [PubMed]
  43. Park, S.I.; Kwon, H.J.; Cho, M.H.; Song, J.S.; Kim, B.G.; Baek, J.; Kim, S.L.; Ji, H.; Kwon, T.R.; Kim, K.H.; et al. The OsERF115/AP2EREBP110 transcription factor is involved in the multiple stress tolerance to heat and drought in rice plants. Int. J. Mol. Sci. 2021, 22, 7181. [Google Scholar] [CrossRef] [PubMed]
  44. Li, J.; Guo, X.; Zhang, M.; Wang, X.; Zhao, Y.; Yin, Z.; Zhang, Z.; Wang, Y.; Xiong, H.; Zhang, H.; et al. OsERF71 confers drought tolerance via modulating ABA signaling and proline biosynthesis. Plant Sci. 2018, 270, 131–139. [Google Scholar] [CrossRef]
  45. Li, J.; Guo, W.; Meng, H.; Zhao, J.; Zheng, G.; Yuan, W. Comprehensive analysis of AP2/ERF gene members in Acer truncatum B. and the positive regulator role of AtruDREB28 in drought tolerance. Ind. Crop. Prod. 2023, 200, 116837. [Google Scholar] [CrossRef]
  46. Li, K.; Xing, C.; Yao, Z.; Huang, X. PbrMYB 21, a novel MYB protein of Pyrus betulaefolia, functions in drought tolerance and modulates polyamine levels by regulating arginine decarboxylase gene. Plant Biotechnol. J. 2017, 15, 1186–1203. [Google Scholar] [CrossRef] [PubMed] [Green Version]
  47. Yao, C.; Li, X.; Li, Y.; Yang, G.; Liu, W.; Shao, B.; Zhong, J.; Huang, P.; Han, D. Overexpression of a Malus baccata MYB transcription factor gene MbMYB4 increases cold and drought tolerance in Arabidopsis thaliana. Int. J. Mol. Sci. 2022, 23, 1794. [Google Scholar] [CrossRef]
  48. Zhao, H.; Zhao, H.; Hu, Y.; Zhang, S.; He, S.; Zhang, H.; Zhao, N.; Liu, Q.; Gao, S.; Zhai, H. Expression of the sweet potato MYB transcription factor IbMYB48 confers salt and drought tolerance in Arabidopsis. Genes 2022, 13, 1883. [Google Scholar] [CrossRef]
  49. Chung, P.J.; Jung, H.; Choi, Y.D.; Kim, J.K. Genome-wide analyses of direct target genes of four rice NAC-domain transcription factors involved in drought tolerance. BMC Genomics 2018, 19, 40. [Google Scholar] [CrossRef] [Green Version]
  50. Hao, Y.J.; Song, Q.X.; Chen, H.W.; Zou, H.F.; Wei, W.; Kang, X.S.; Ma, B.; Zhang, W.K.; Zhang, J.S.; Chen, S.Y. Plant NAC-type transcription factor proteins contain a NARD domain for repression of transcriptional activation. Planta 2010, 232, 1033–1043. [Google Scholar] [CrossRef]
Figure 1. Analysis of A. truncatum physiological indices. (A) Relative water content (RWC), (B) relative electrical conductivity (REC), (C) superoxide dismutase (SOD) activity, (D) peroxidase (POD) activity, and (E) catalase (CAT) activity in A. truncatum after withholding water for 0, 3, 7, and 12 days and then re-watering for 5 days (RW). Error bars represent standard deviations. Asterisks represent significant differences according to Student’s t-test (* p < 0.05; ** p < 0.01).
Antioxidants 12 01339 g001
Figure 2. Analysis of the DEGs in A. truncatum under drought conditions. (A) Bar graph presenting the number of up-regulated DEGs, down-regulated DEGs, and transcription factor genes in each comparison. (B) Venn diagram indicating the number of common or unique DEGs in the Group I comparisons of four treatment time-points (3 d/0 d, 7 d/0 d, 12 d/0 d, and RW/0 d) and the Group II time-course comparisons (3 d/0 d, 7 d/3 d, 12 d/7 d, and RW/12 d).
Antioxidants 12 01339 g002
Figure 3. GO enrichment analysis of the DEGs in A. truncatum under drought conditions. (A,B) GO enrichment analysis of the up-regulated (A) and down-regulated (B) genes.
Antioxidants 12 01339 g003
Figure 4. KEGG enrichment analysis of the DEGs in A. truncatum under drought conditions.
Antioxidants 12 01339 g004
Figure 5. Cluster analysis of the DEGs in A. truncatum under drought conditions and KEGG enrichment analysis. (A) Expression patterns for the genes in 12 clusters. (B) KEGG enrichment analysis of the DEG clusters.
Antioxidants 12 01339 g005
Figure 6. Co-expression network for the yellow module. The nodes represent the DEGs in the yellow module, whereas the lines represent the correlation between two DEGs. Connectivity was defined as the number of all node edges. Node size and color intensity reflect the connectivity between genes. Small and pale yellow nodes indicate low connectivity, whereas large and dark yellow nodes indicate high connectivity. The genes in the innermost circle are considered to be the hub genes in this module. The NAC36 (Atru.chr5.3491) gene is marked in blue and was selected for the functional verification.
Antioxidants 12 01339 g006
Figure 7. Characterization of AtruNAC36 in A. truncatum. (A) Subcellular localization of AtruNAC36. The fluorescence of YFP (35S::YFP-AtruNAC36) was detected in onion epidermal cells. (B) Transcriptional activation analysis of AtruNAC36 using a yeast system. The structures of the full-length AtruNAC36 as well as the N-terminal and C-terminal are presented. All constructs were expressed in yeast cells, which were grown on SD/−Trp medium and SD/−Trp/−His/−Ade medium containing 50 mM 3-AT. (C) AtruNAC36 was revealed to bind the NACRS element. More specifically, the ability of AtruNAC36 to recognize NACRS (R) and the mutated sequences (RM1 and RM2) was assessed. Serially diluted (1, 10−1, and 10−2) transformants were grown on DDO medium and TDO medium containing 3-AT.
Antioxidants 12 01339 g007
Figure 8. AtruNAC36 overexpression increased the drought tolerance of Arabidopsis thaliana. (A) Phenotype of AtruNAC36-overexpressing and WT seedlings in the normal medium and mannitol medium (150 and 200 mM mannitol). (B) Phenotypic characteristics of AtruNAC36-overexpressing and WT plants in soil under normal-watering conditions, drought conditions for 10 days, or after re-watering for 3 days. (C,D) Root length (C) and fresh weight (D) of the AtruNAC36-overexpressing and WT seedlings in the normal medium and mannitol medium (150 and 200 mM mannitol). (E) Survival rate after re-watering for 3 days. (F,G) Relative electrical conductivity (REC) (F) and relative water content (RWC) (G) of the AtruNAC36-overexpressing and WT. Plants.Significance test was conducted using Student’s t-test (* p < 0.05 and ** p < 0.01).
Antioxidants 12 01339 g008
Figure 9. AtruNAC36 overexpression enhanced the activity of antioxidant enzymes in Arabidopsis thaliana. (A,B) DAB (A) and NBT (B) staining analyses were performed using the rosette leaves from the WT and AtruNAC36-overexpressing seedlings under normal and drought conditions. (CE) POD, SOD, and CAT activities in the WT and AtruNAC36-overexpressing seedlings under normal and drought conditions. Error bars represent standard deviations. Asterisks represent significant differences according to Student’s t-test (* p < 0.05; ** p < 0.01).
Antioxidants 12 01339 g009
Disclaimer/Publisher’s Note: The statements, opinions and data contained in all publications are solely those of the individual author(s) and contributor(s) and not of MDPI and/or the editor(s). MDPI and/or the editor(s) disclaim responsibility for any injury to people or property resulting from any ideas, methods, instructions or products referred to in the content.

