
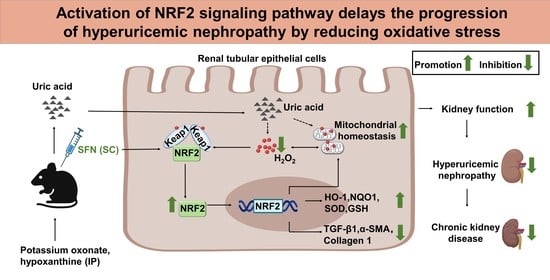
Activation of NRF2 Signaling Pathway Delays the Progression of Hyperuricemic Nephropathy by Reducing Oxidative Stress
 and
and
Abstract
:
1. Introduction
2. Materials and Methods
2.1. RNA Sequencing
2.2. Bioinformatics Analysis of Renal Tubular Samples from Normal Individuals or Patients with CKD
2.3. Cell Culture and Cell Models
2.4. Animal Experiments and Ethics
2.5. Analysis of Intracellular ROS
2.6. Determination of Adenosine Triphosphate (ATP) Content
2.7. Mitochondrial Membrane Potential
2.8. Biochemical Analysis of Serum/Urine/Kidney Samples
2.9. Non-Invasive Transcutaneous Assessment of Glomerular Filtration Rate (GFR)
2.10. Histological Analysis of Kidney
2.11. Transmission Electron Microscopy
2.12. Immunohistochemistry
2.13. Immunofluorescence Staining
2.14. Western Blot Analysis
2.15. Statistical Analyses
3. Results
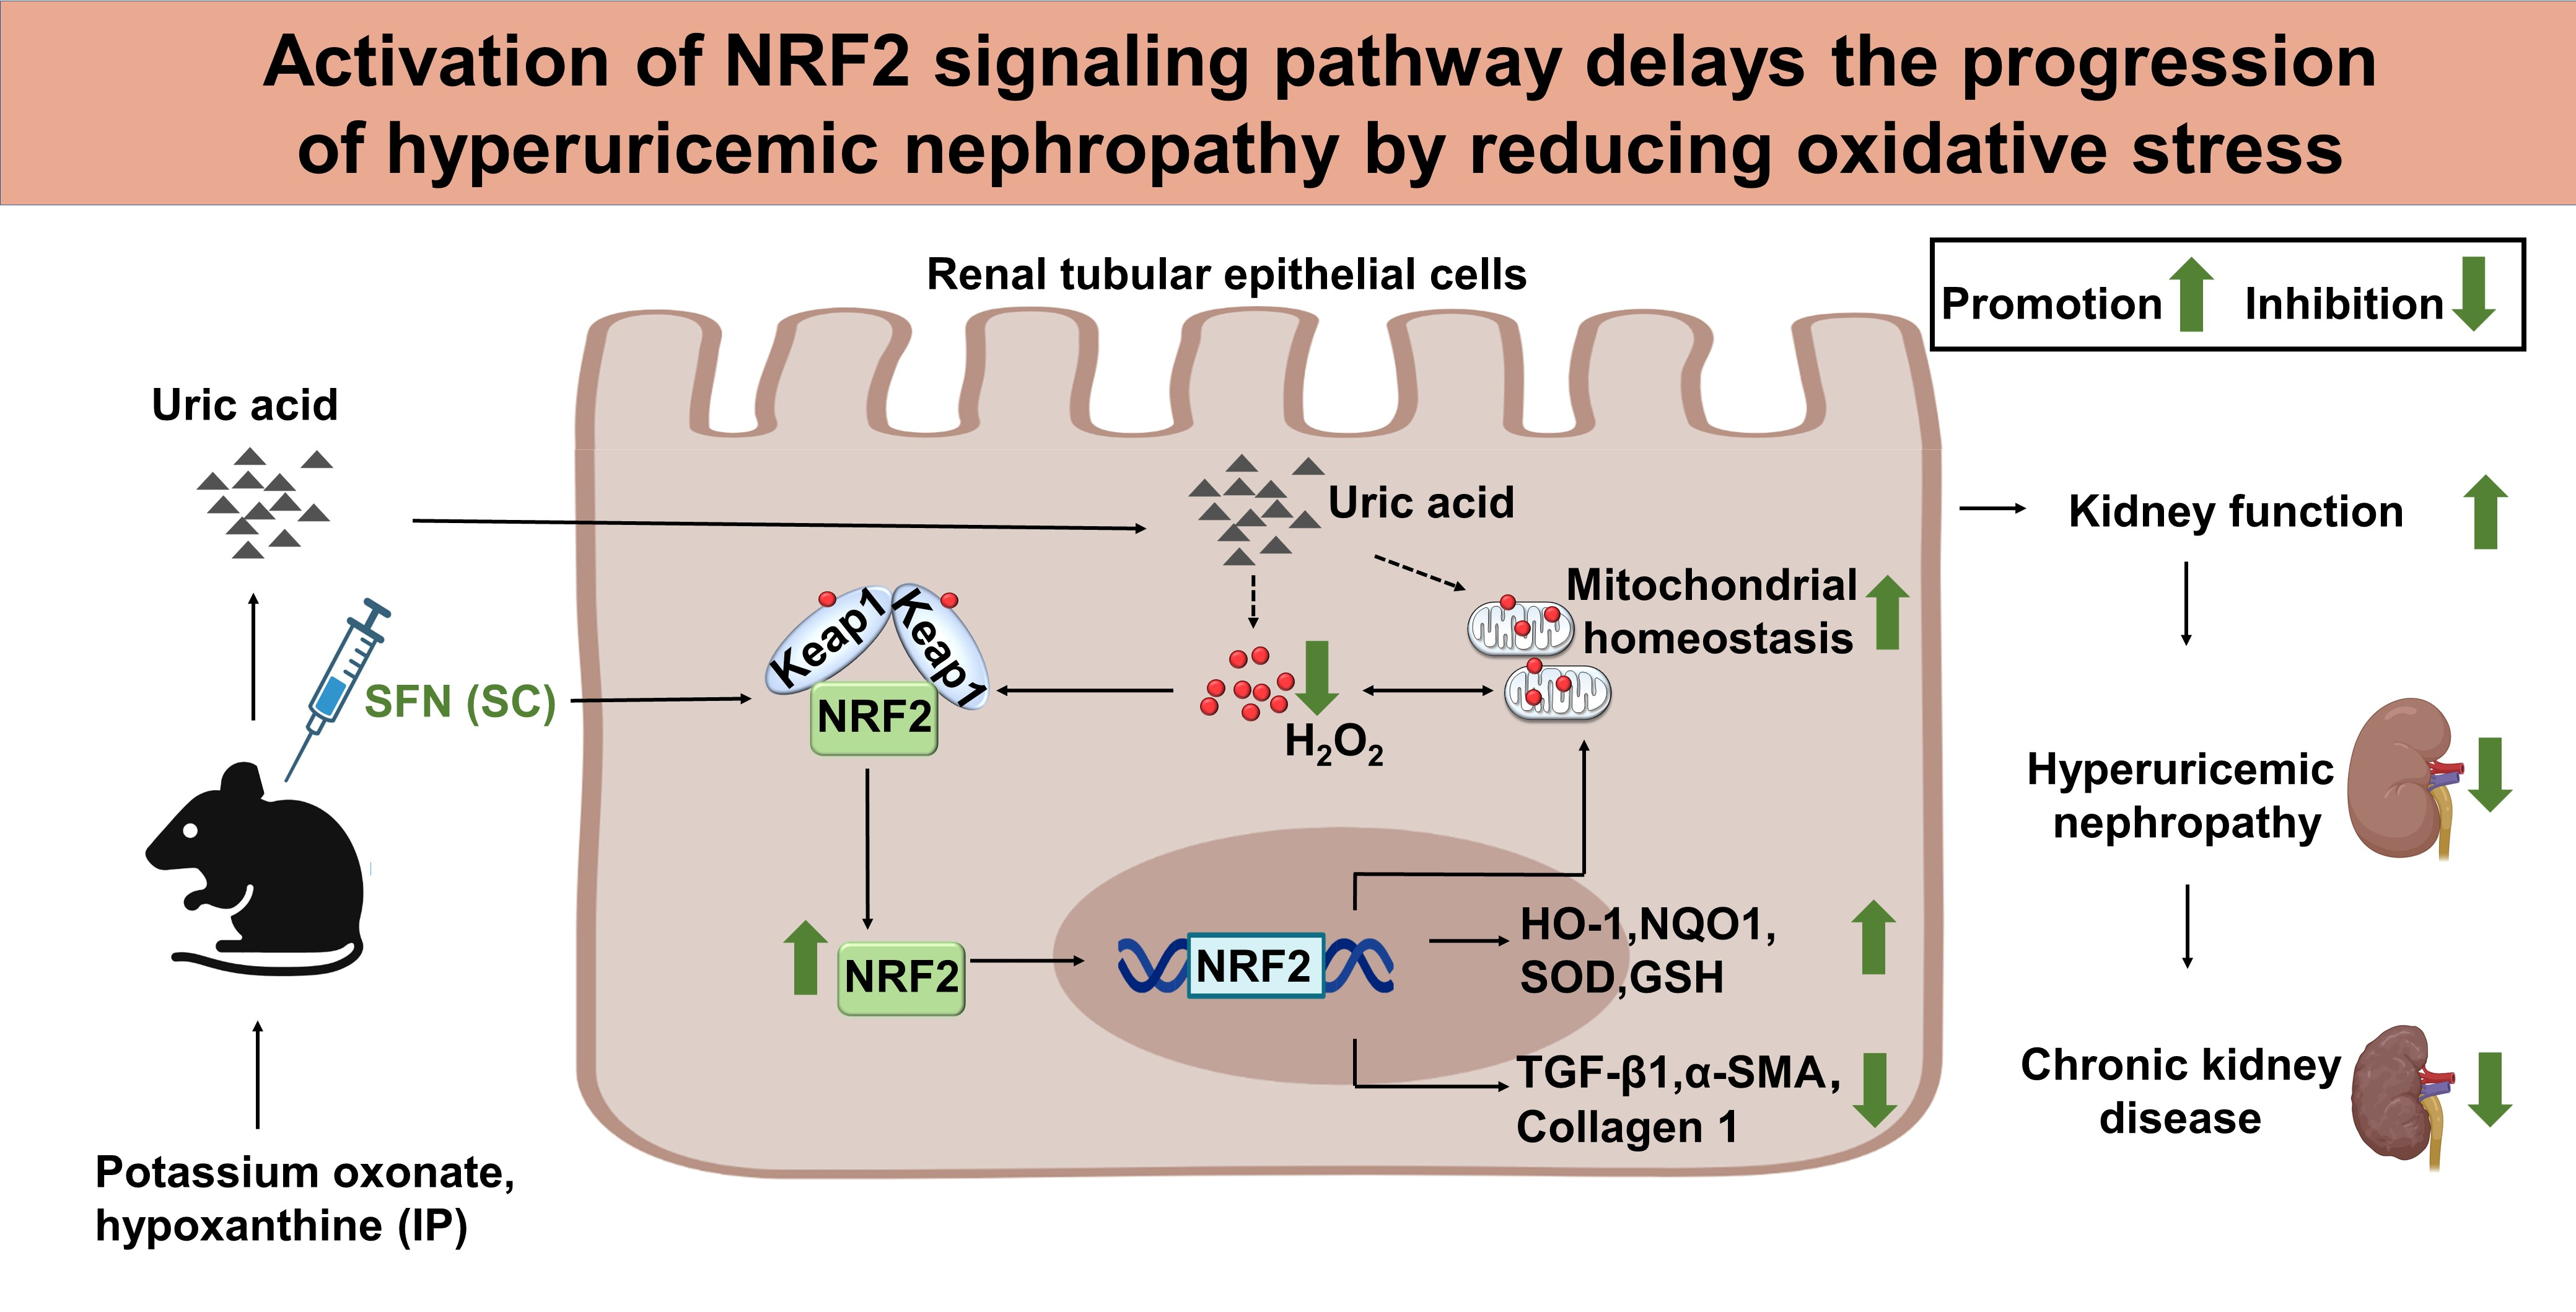
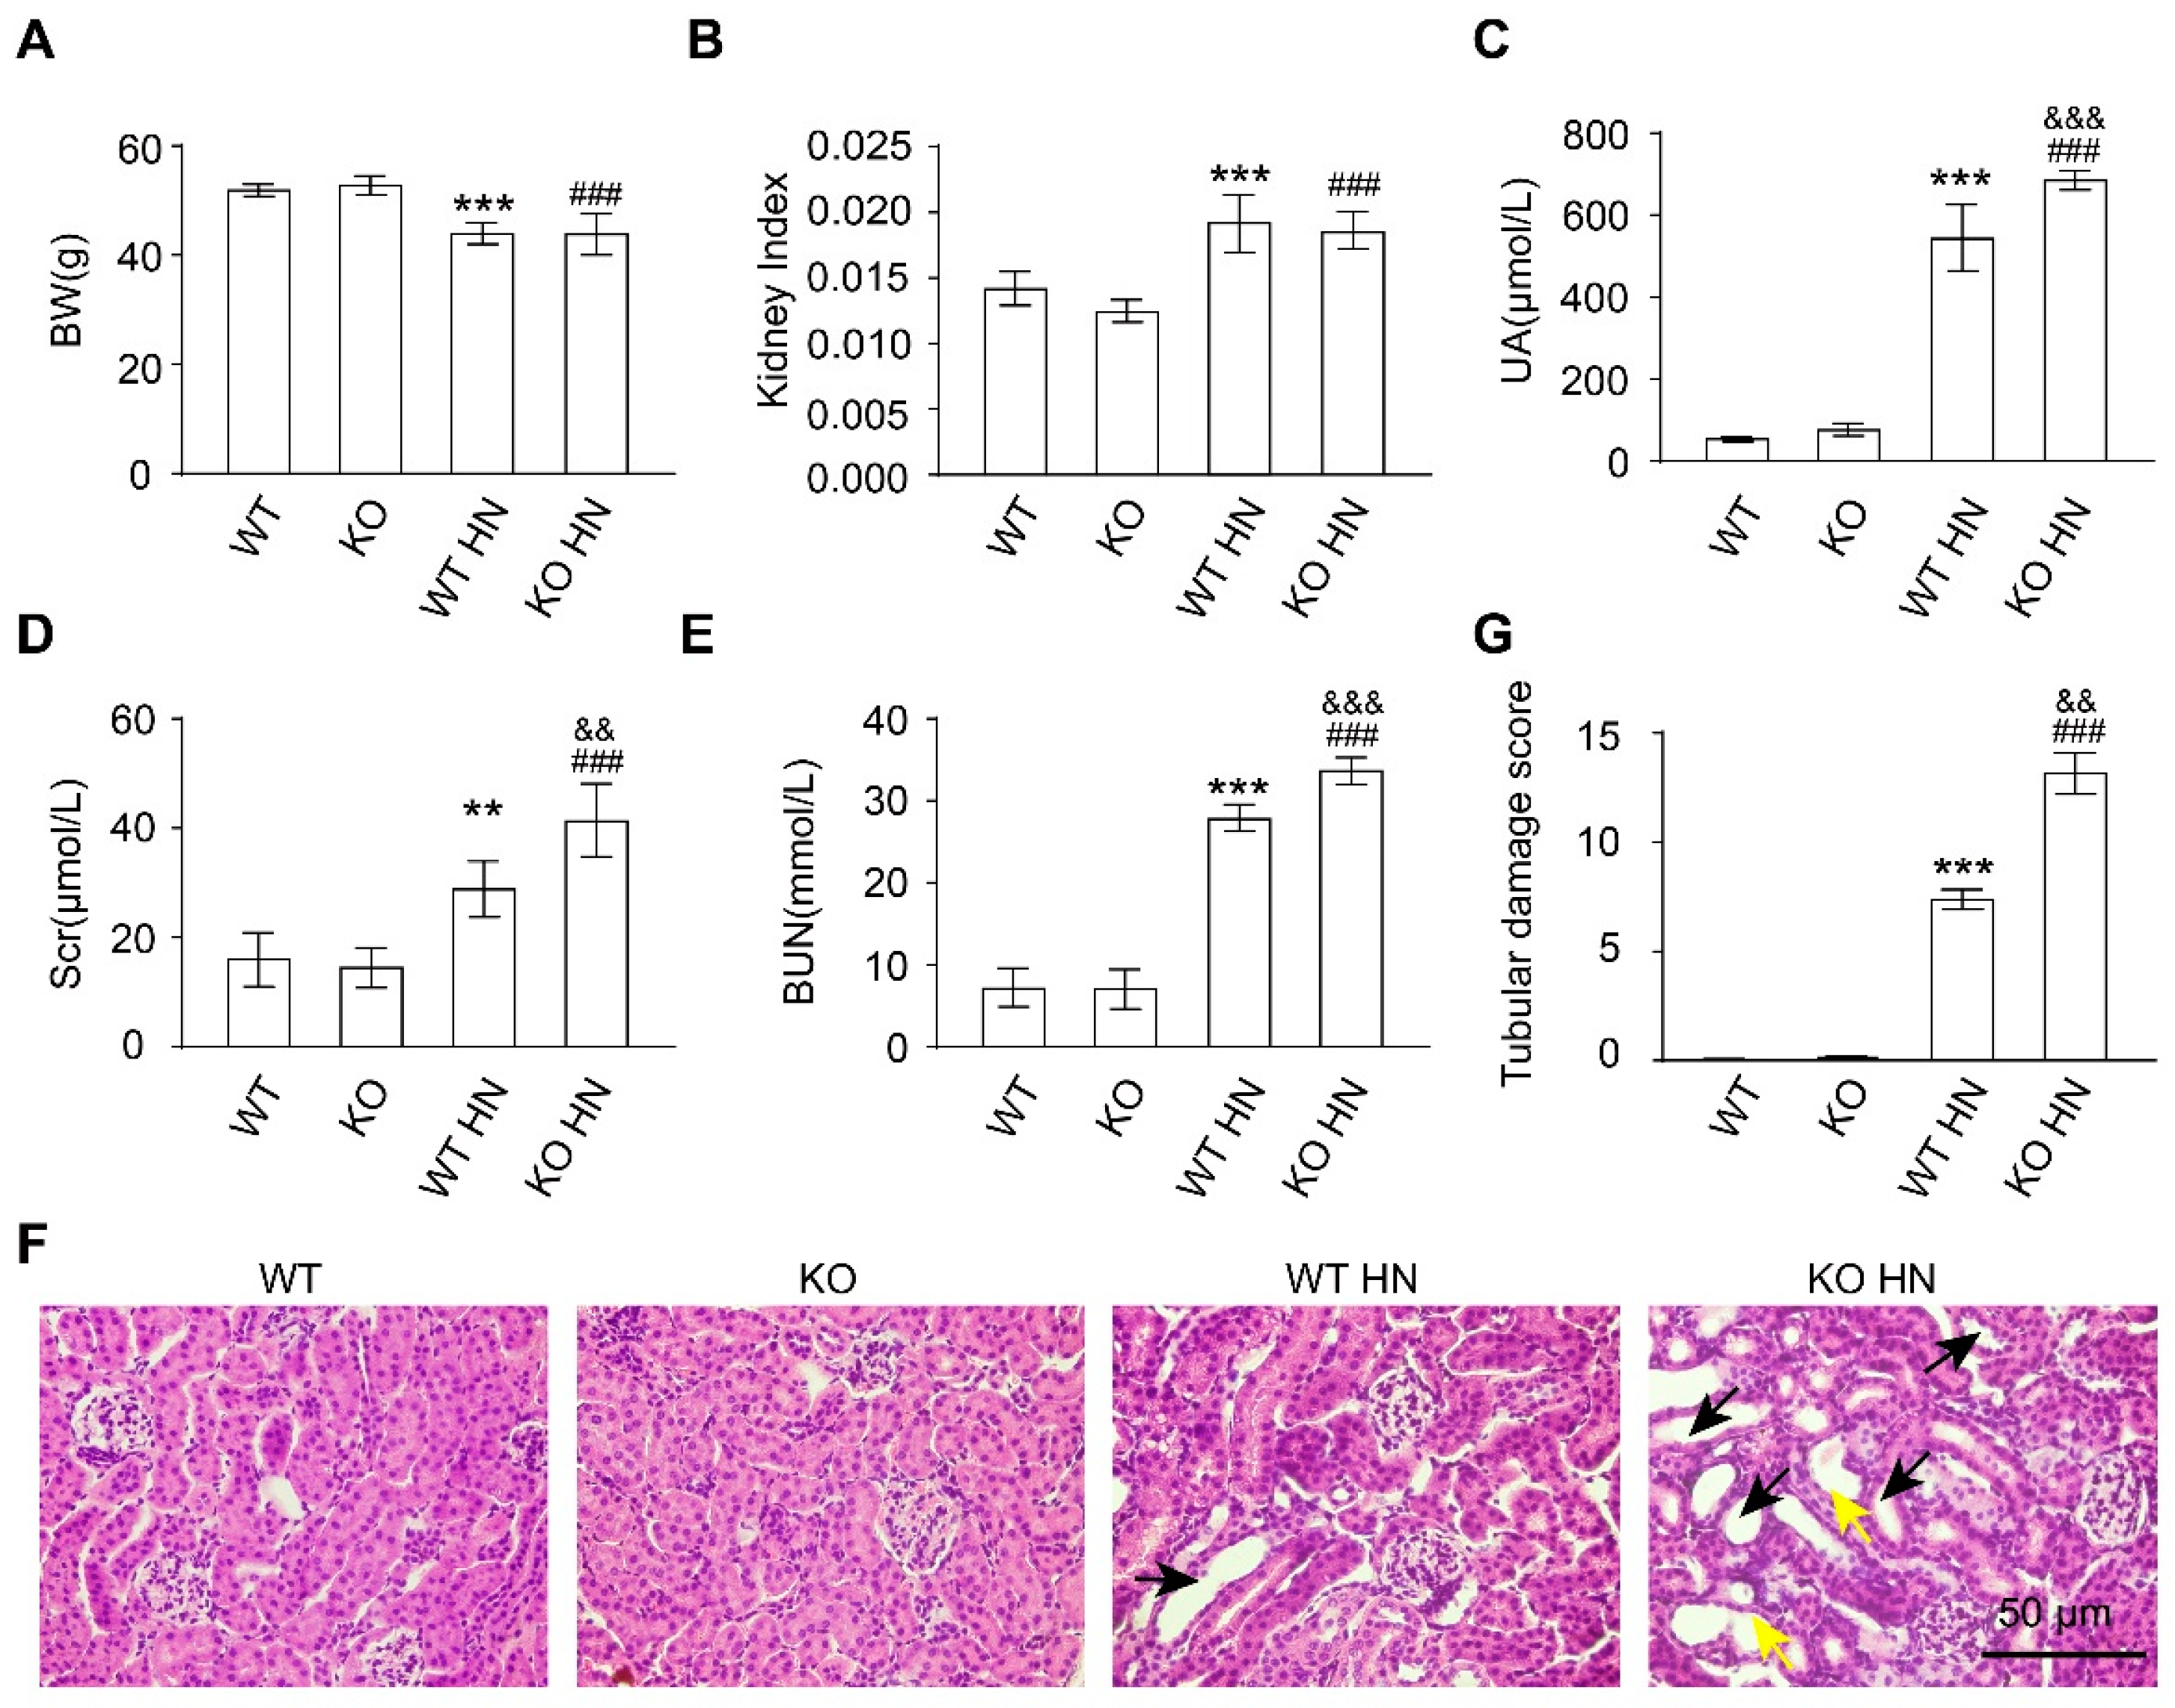
3.1. Renal Function Impairment in Hyperuricemic Mice Worsens with Disease Progression
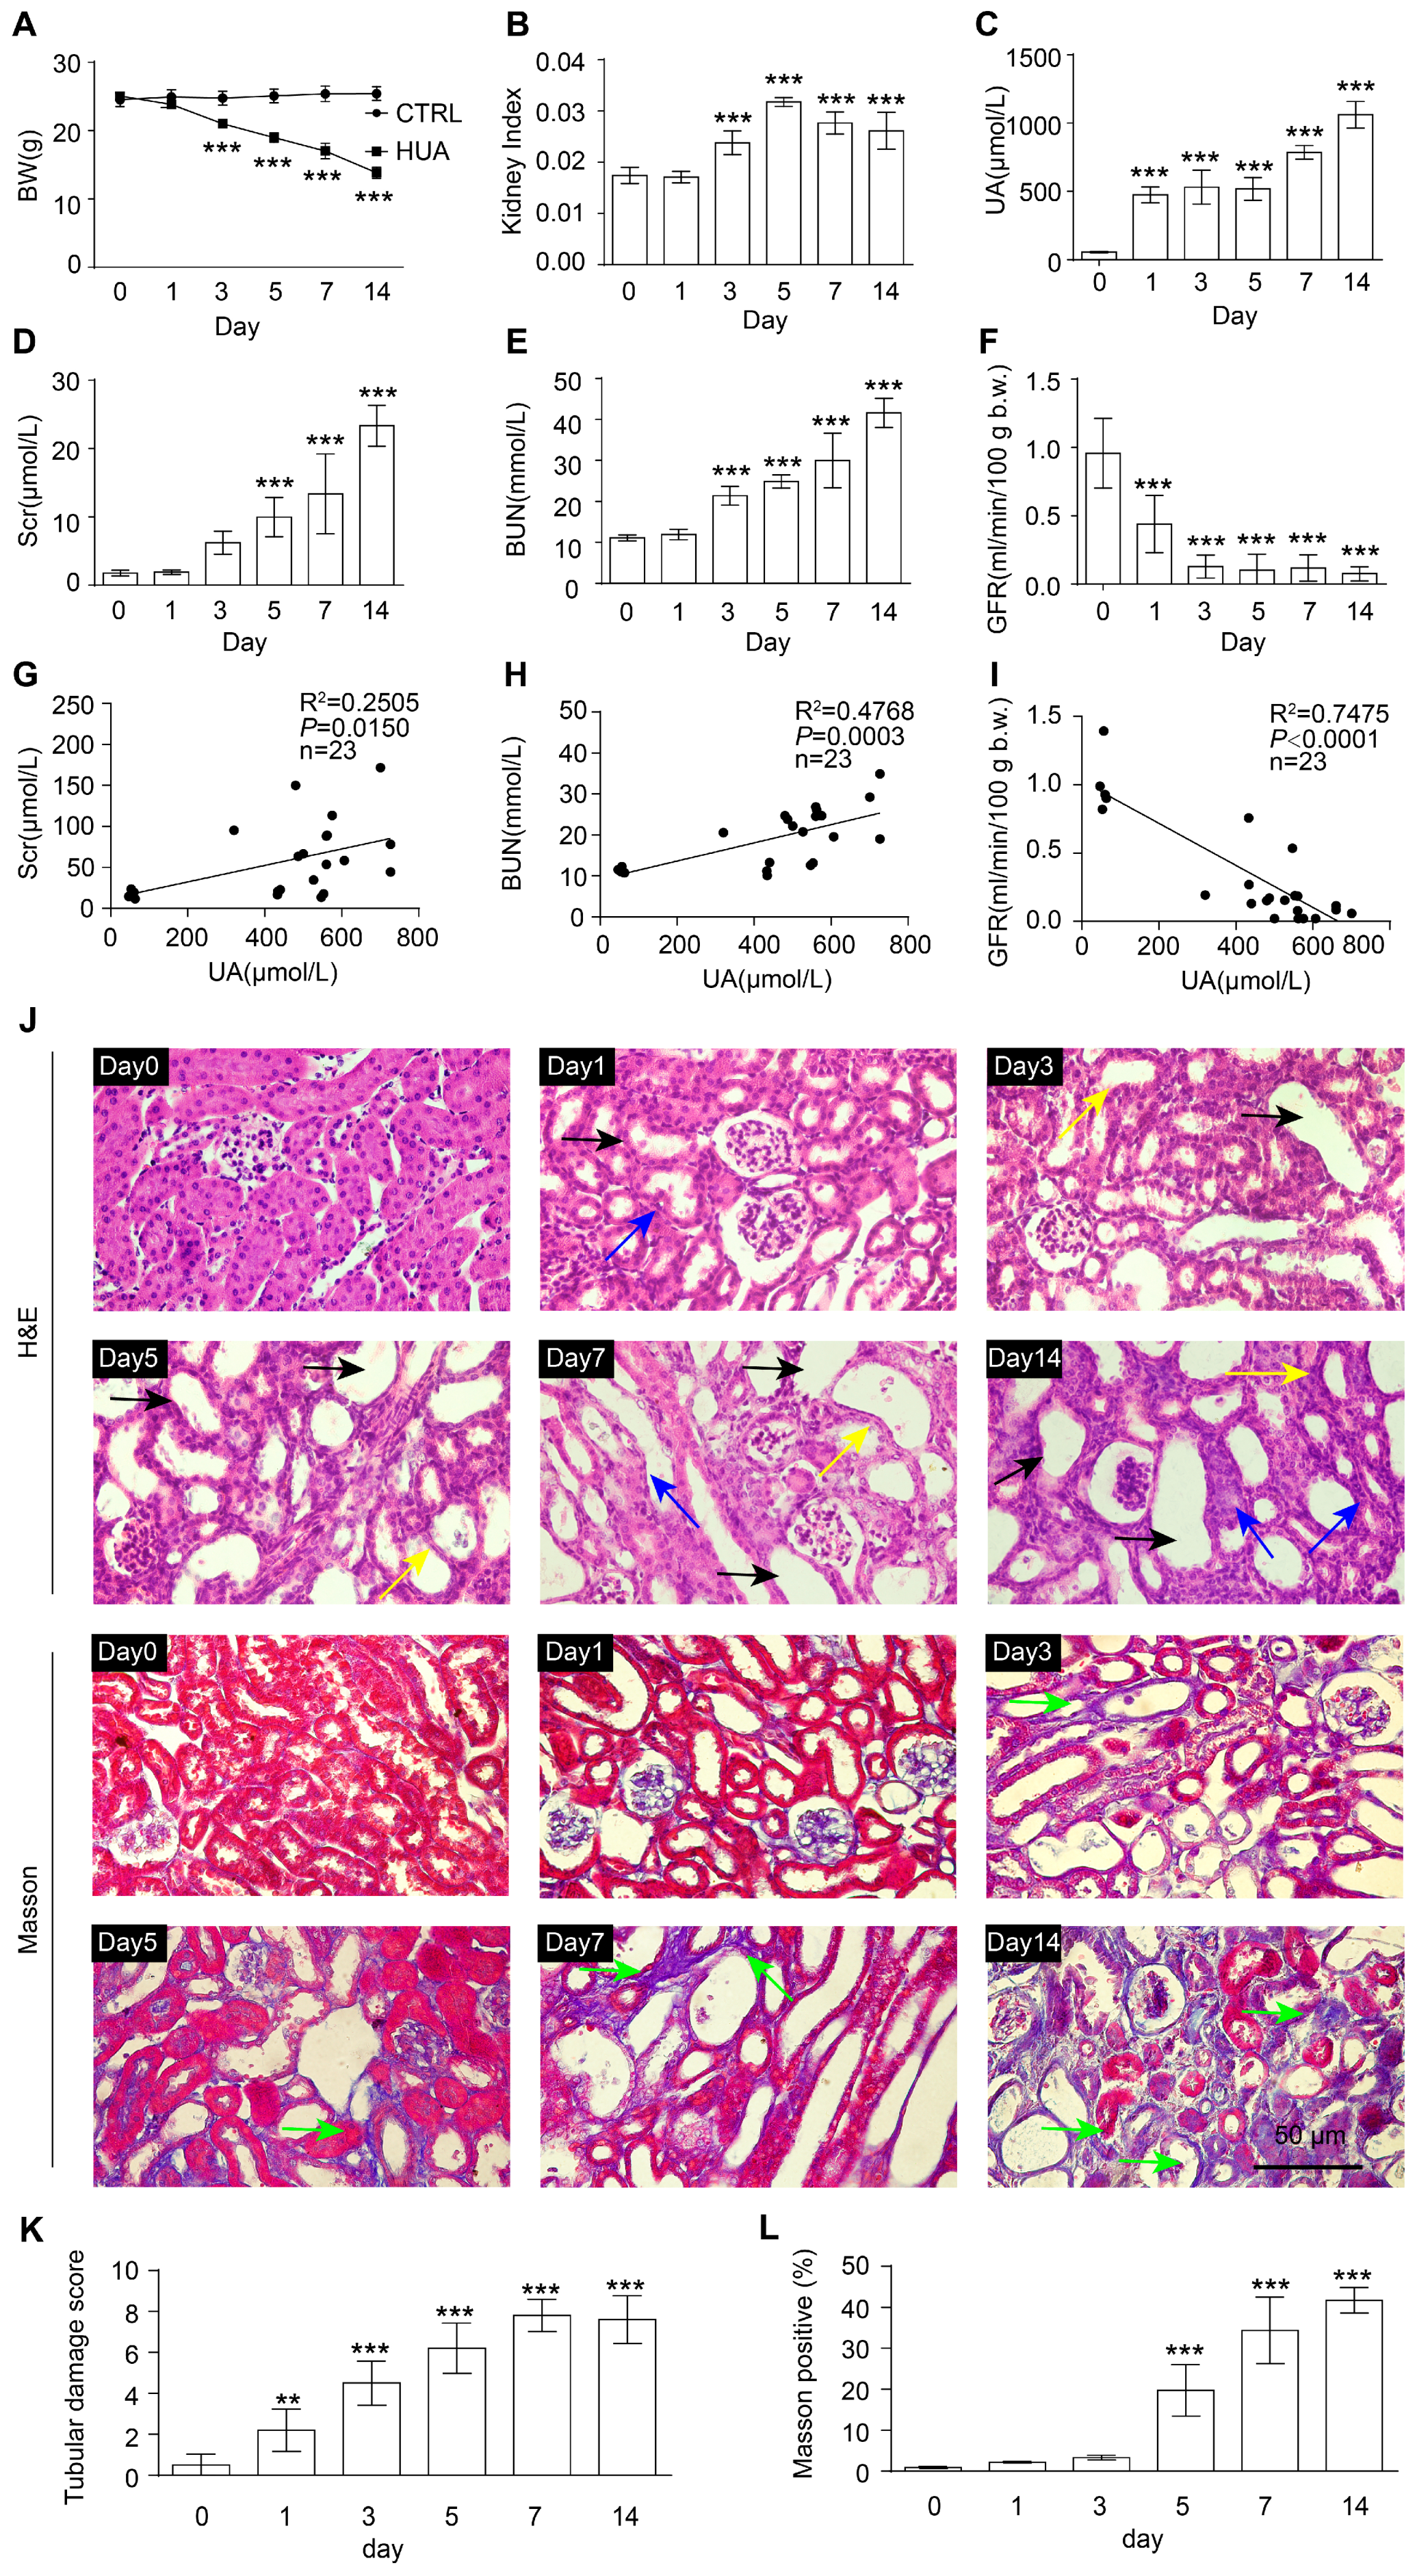
3.2. NRF2 Antioxidant Signaling Pathway Is Impaired in the Kidney of HN Mice
3.3. Loss of nrf2 Gene Aggravates Kidney Function Impairment in HN Mice
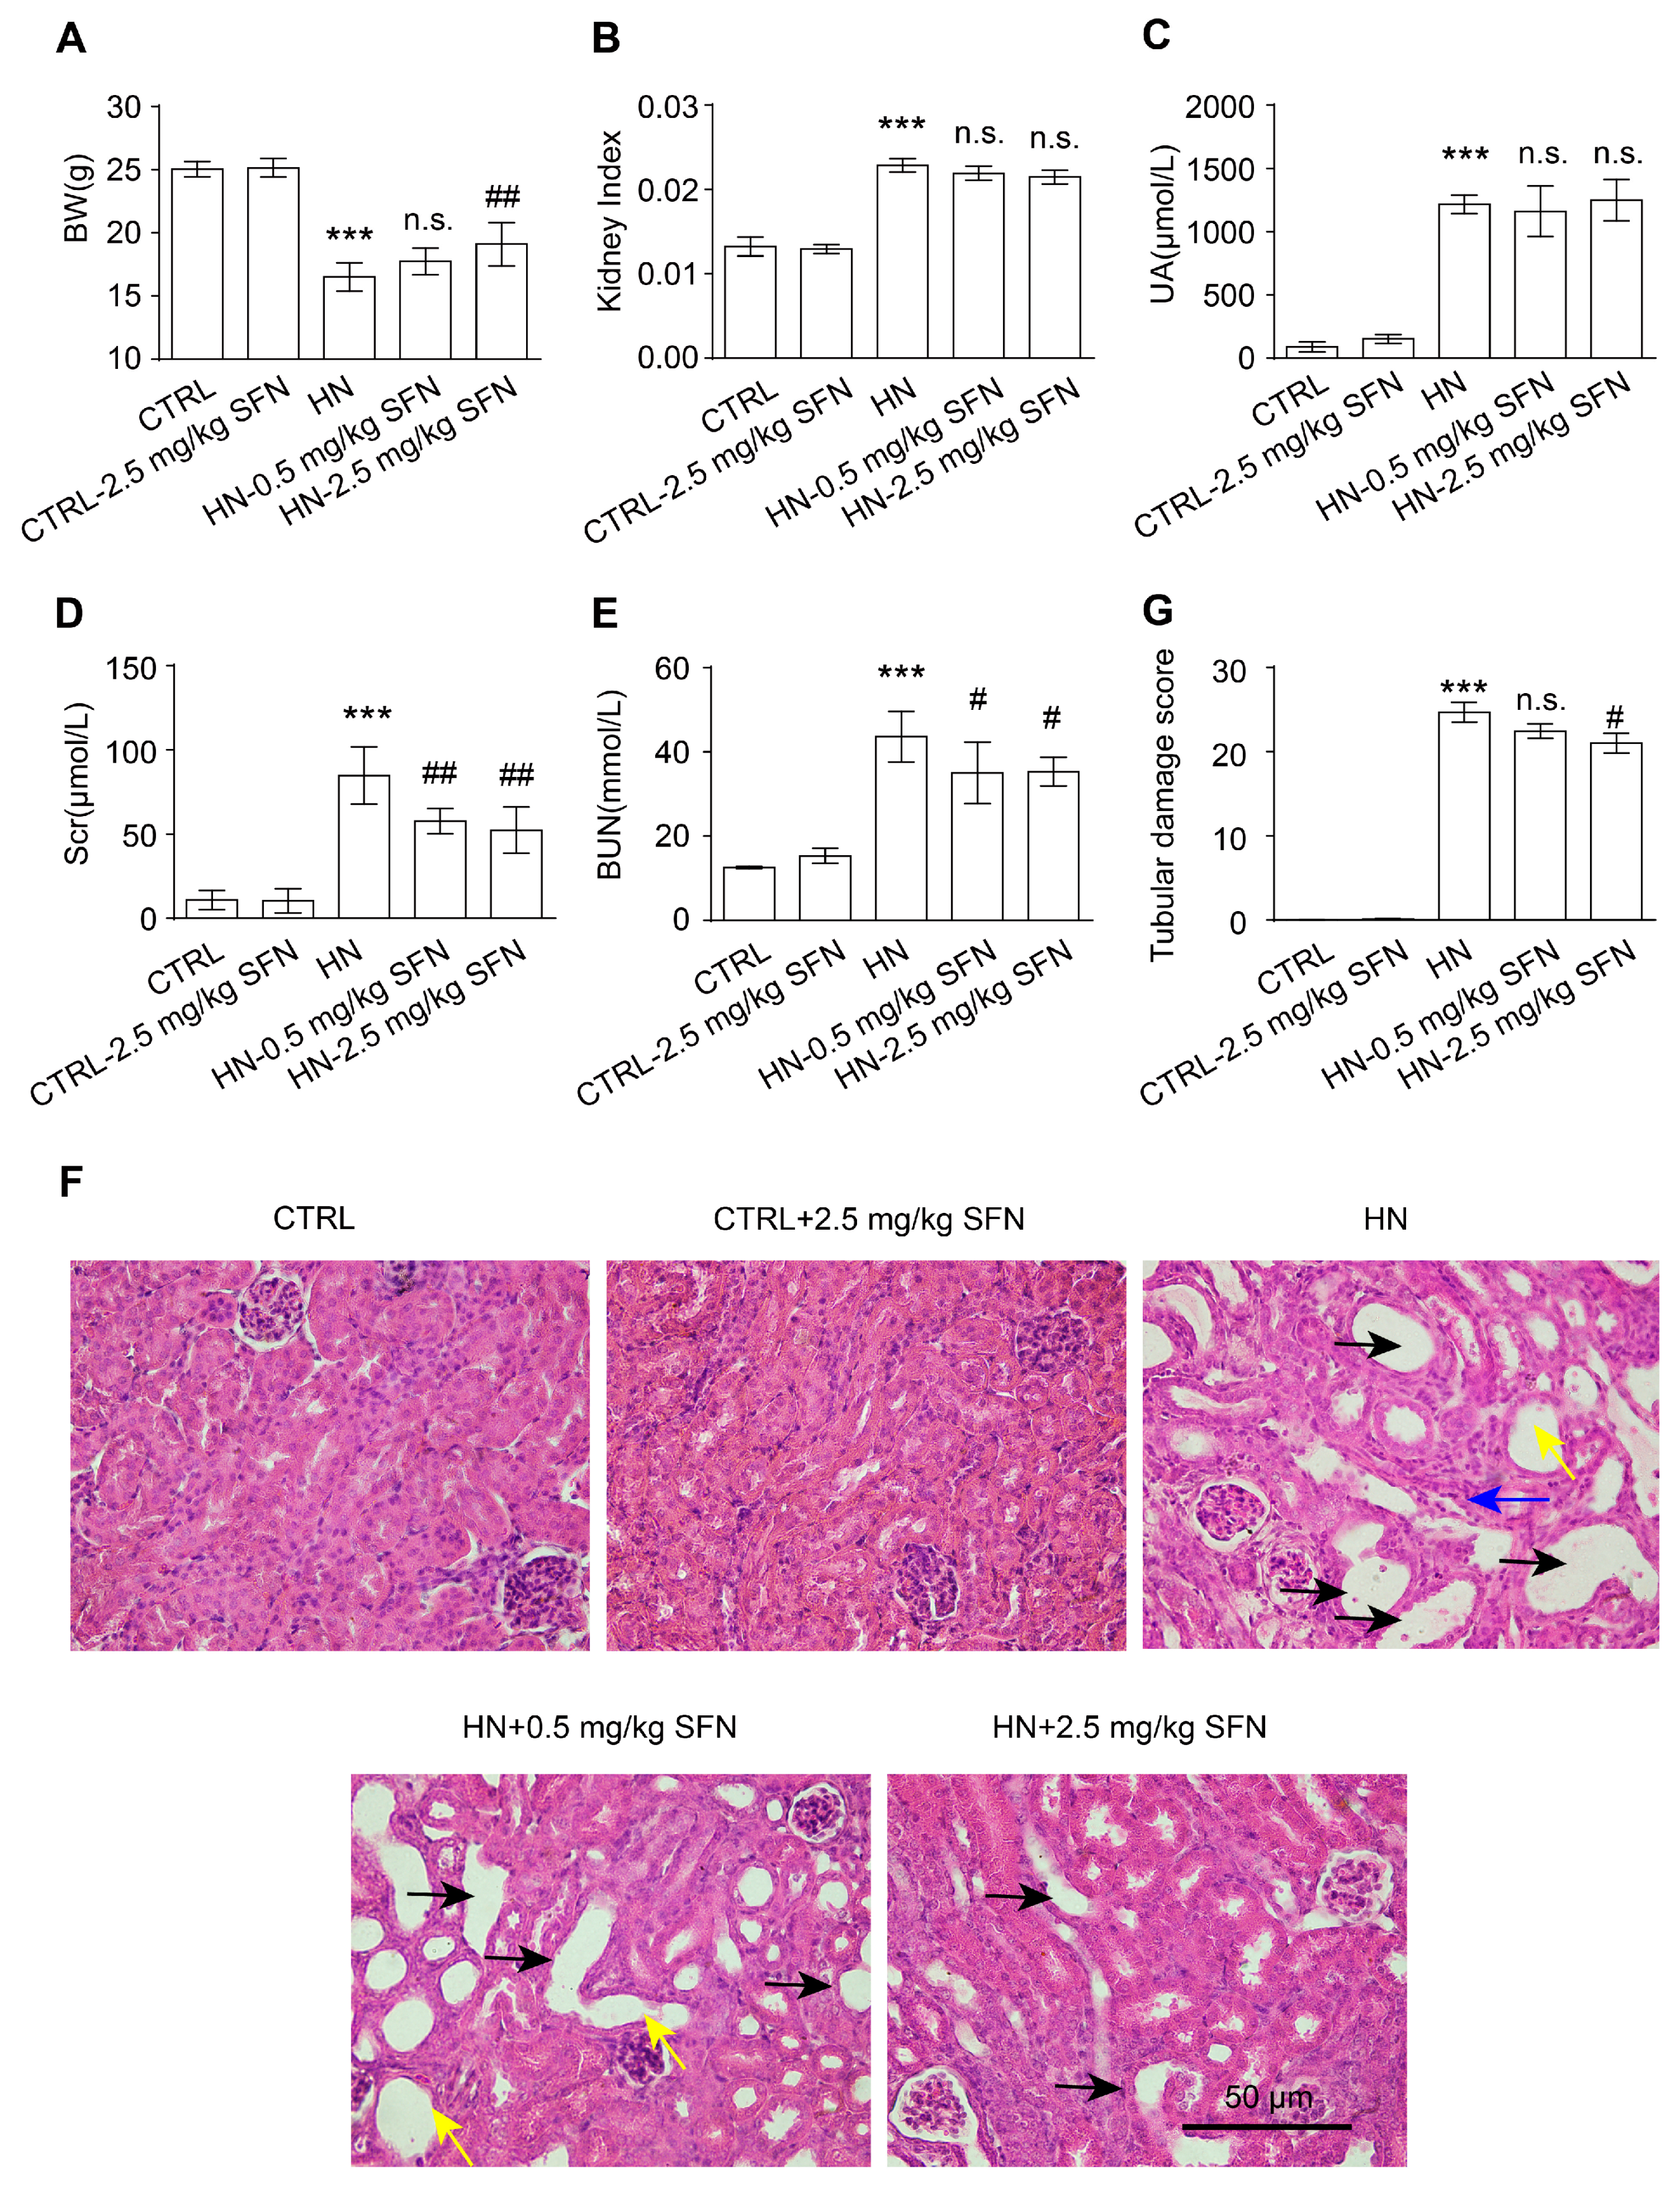
3.4. Activation of NRF2 Improves Kidney Function in HN Mice
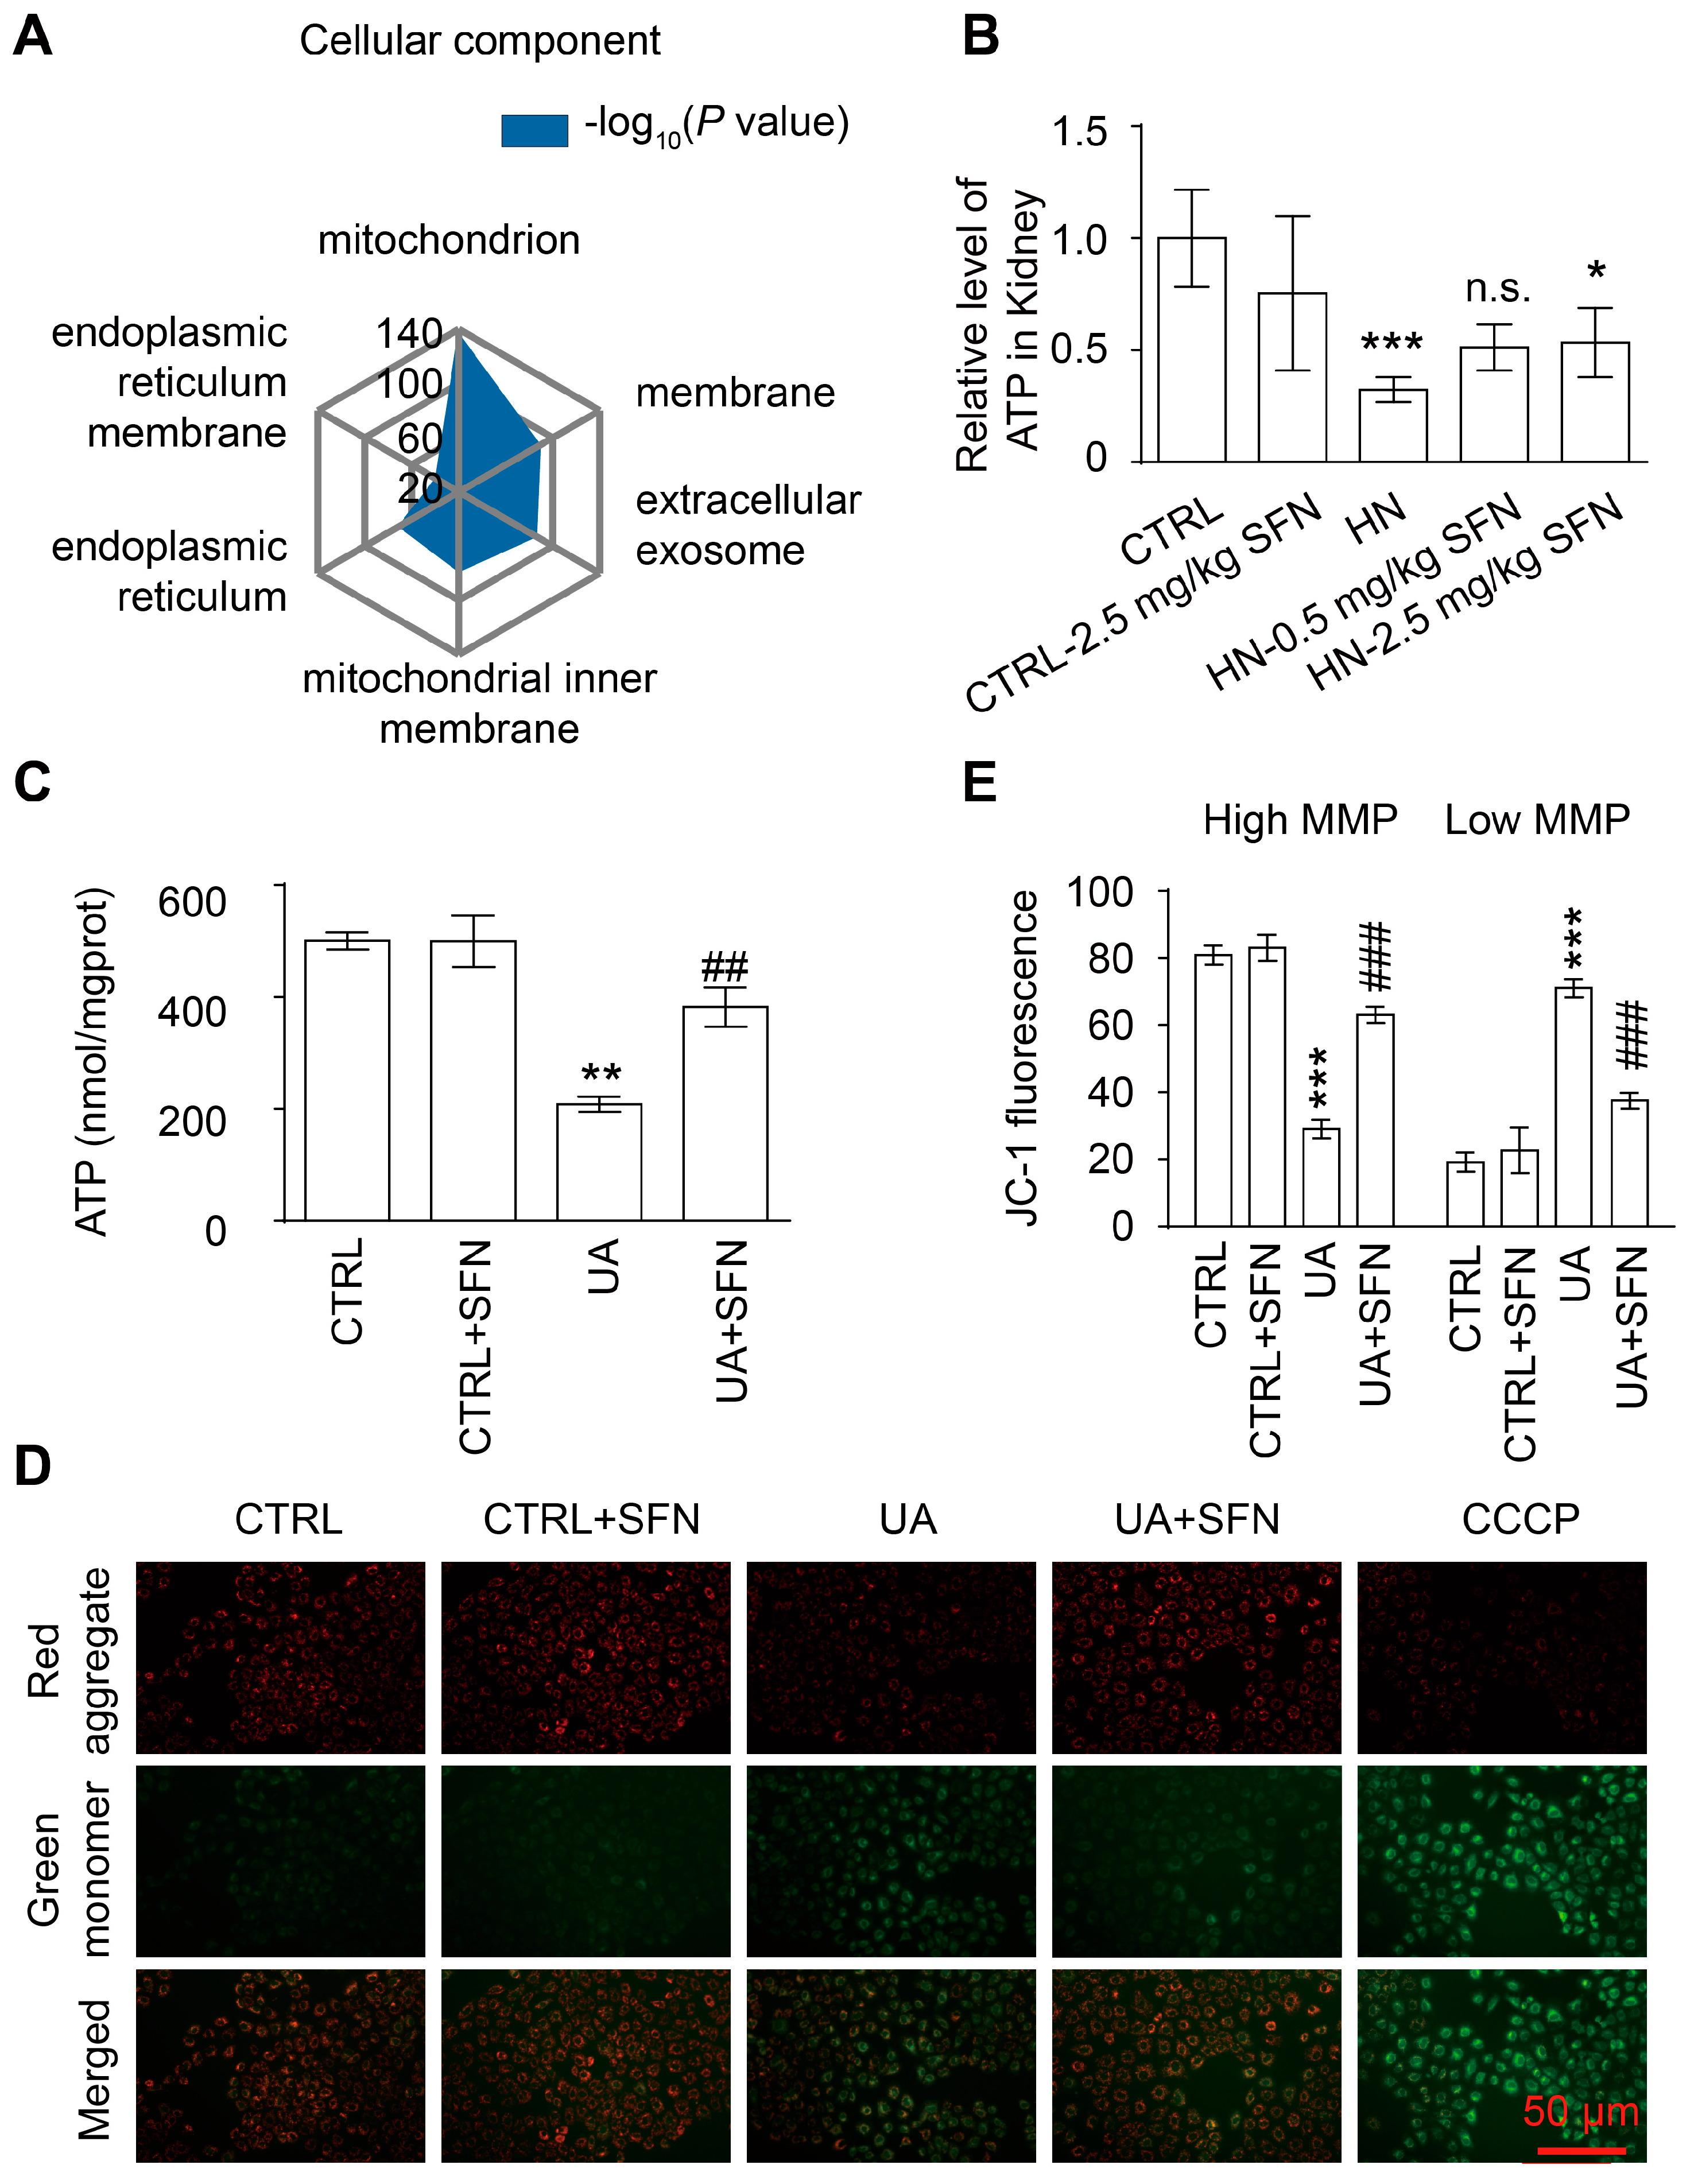
3.5. Activation of NRF2 Improves Mitochondrial Dysfunction in Animal and Cell Models
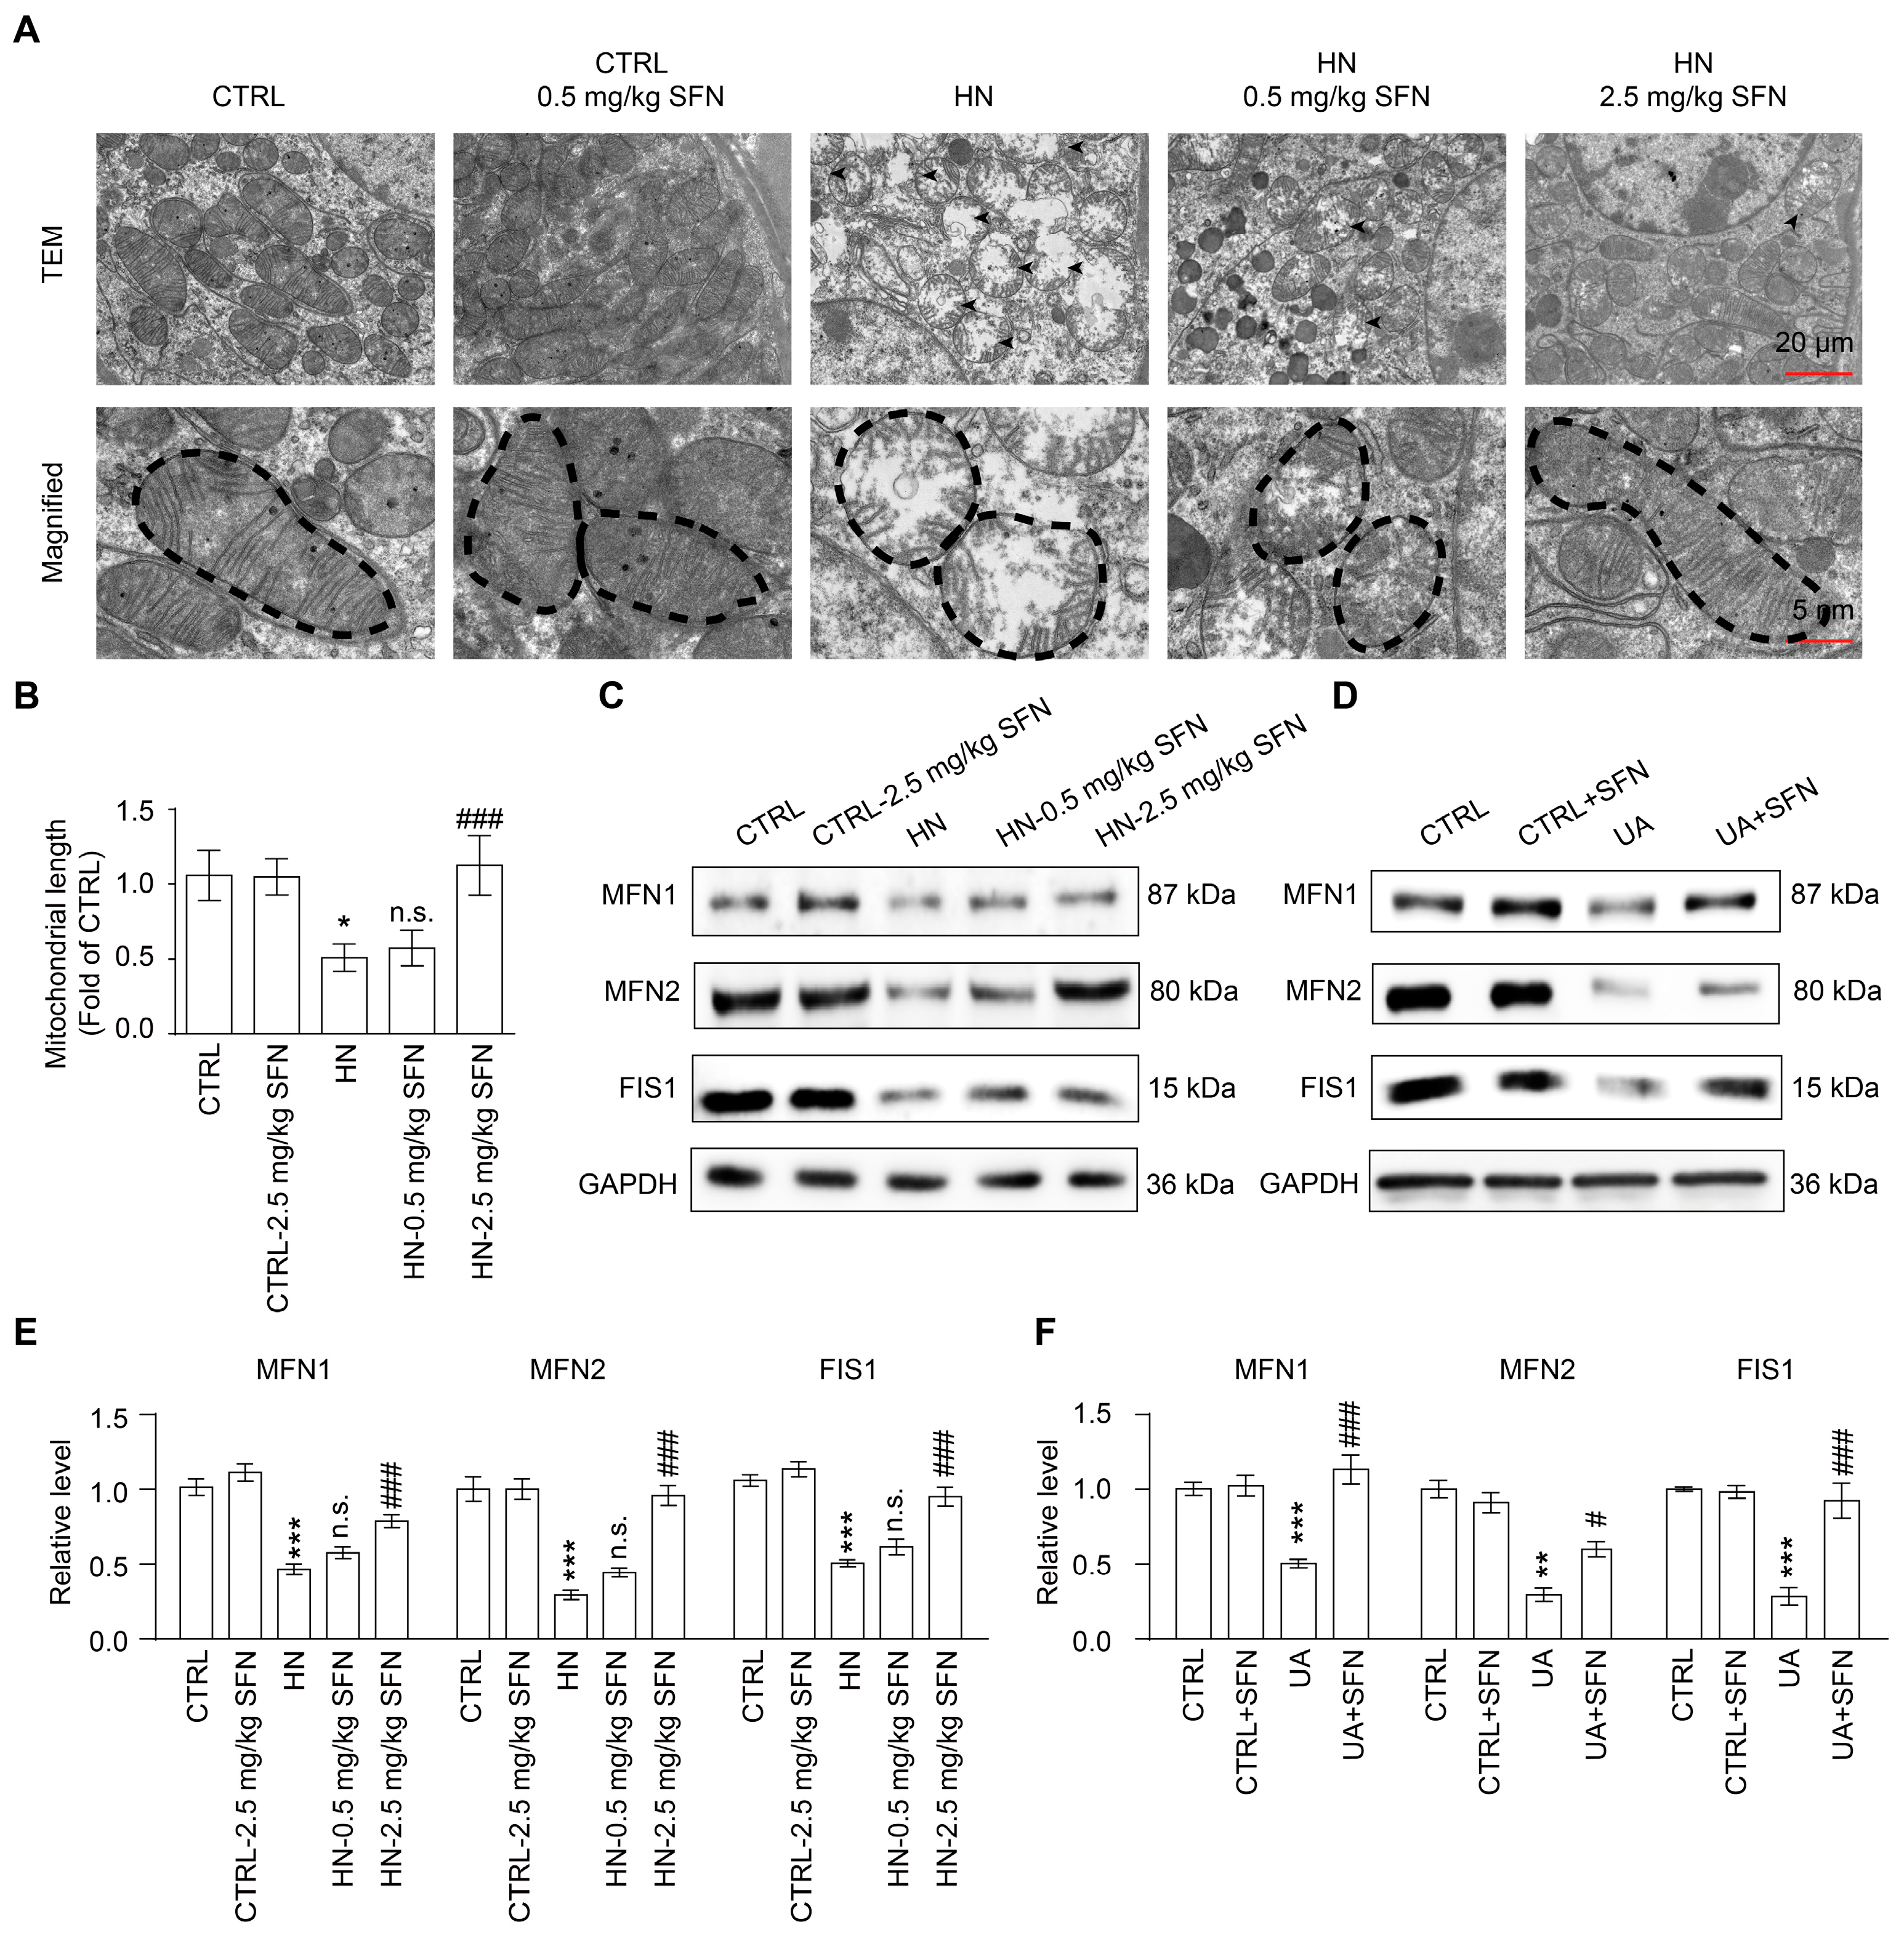
3.6. Activation of NRF2 Rescues Mitochondrial Homeostasis in Animal and Cell Models
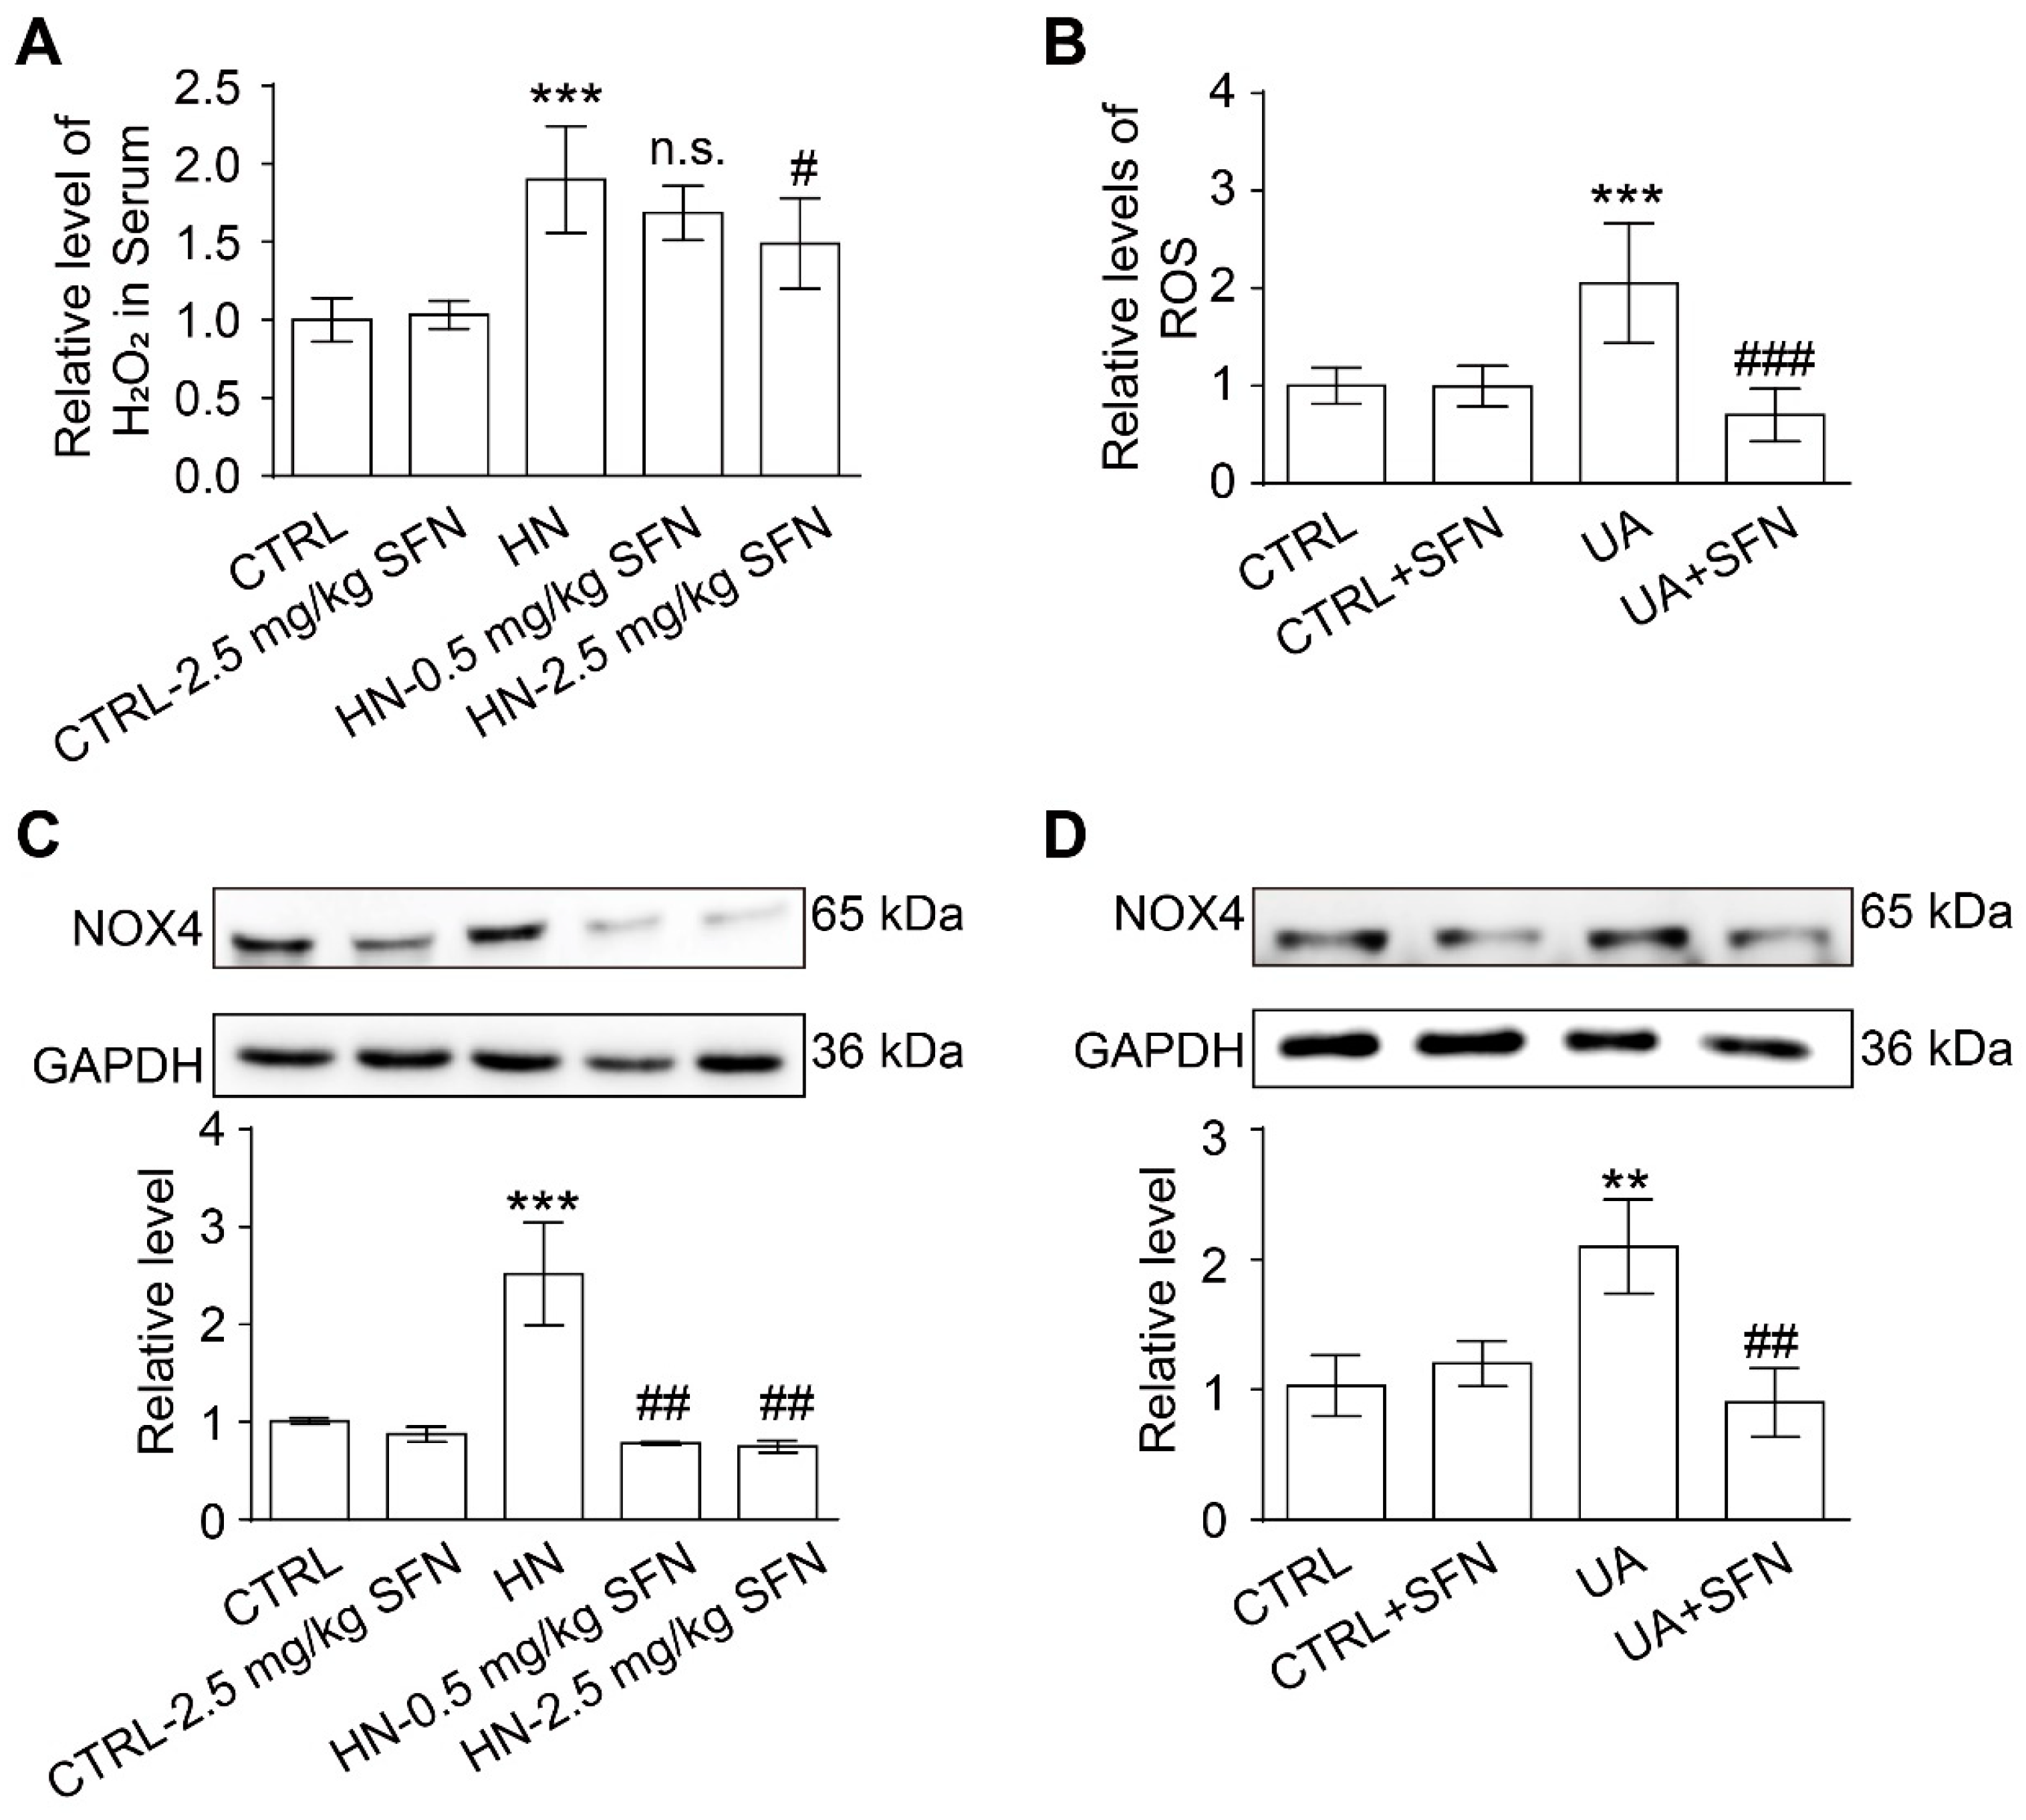
3.7. Activation of NRF2 Alleviates Oxidative Stress in Animal and Cell Models
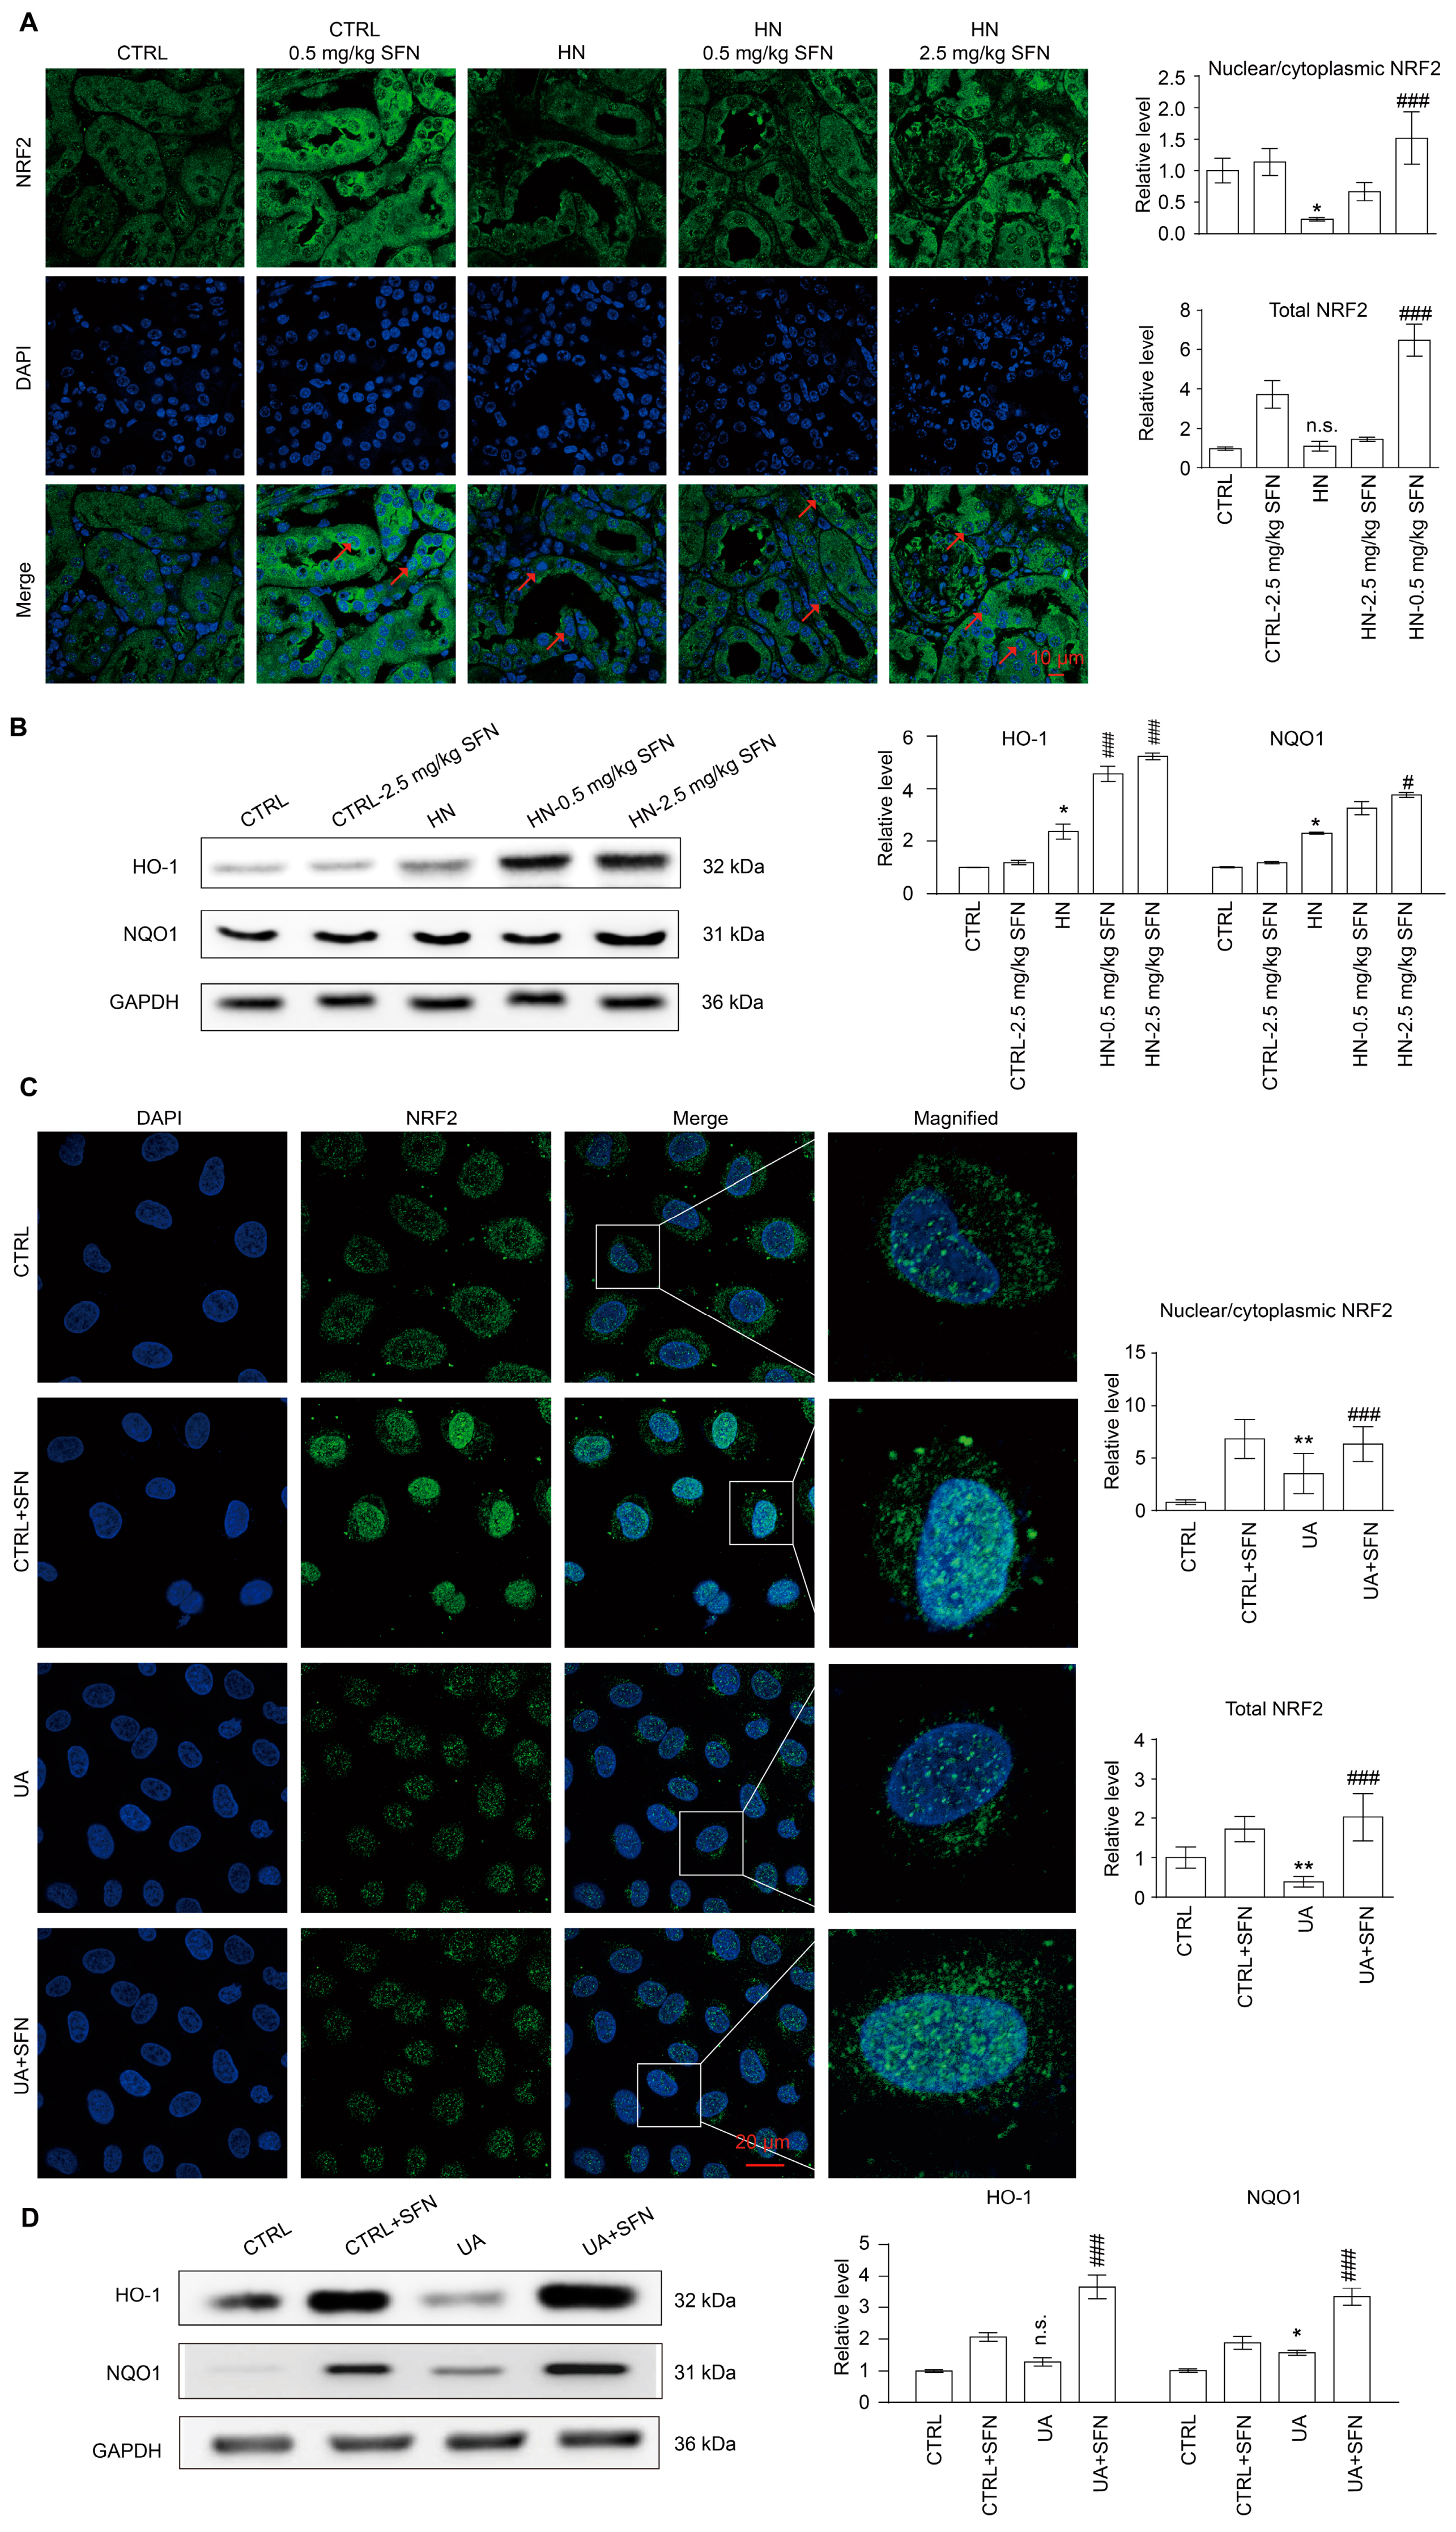
3.8. Activation of NRF2 Enhances the Antioxidant Capacity of Animals and Cells by Up-Regulating NRF2/HO-1/NQO1 Signaling Pathway
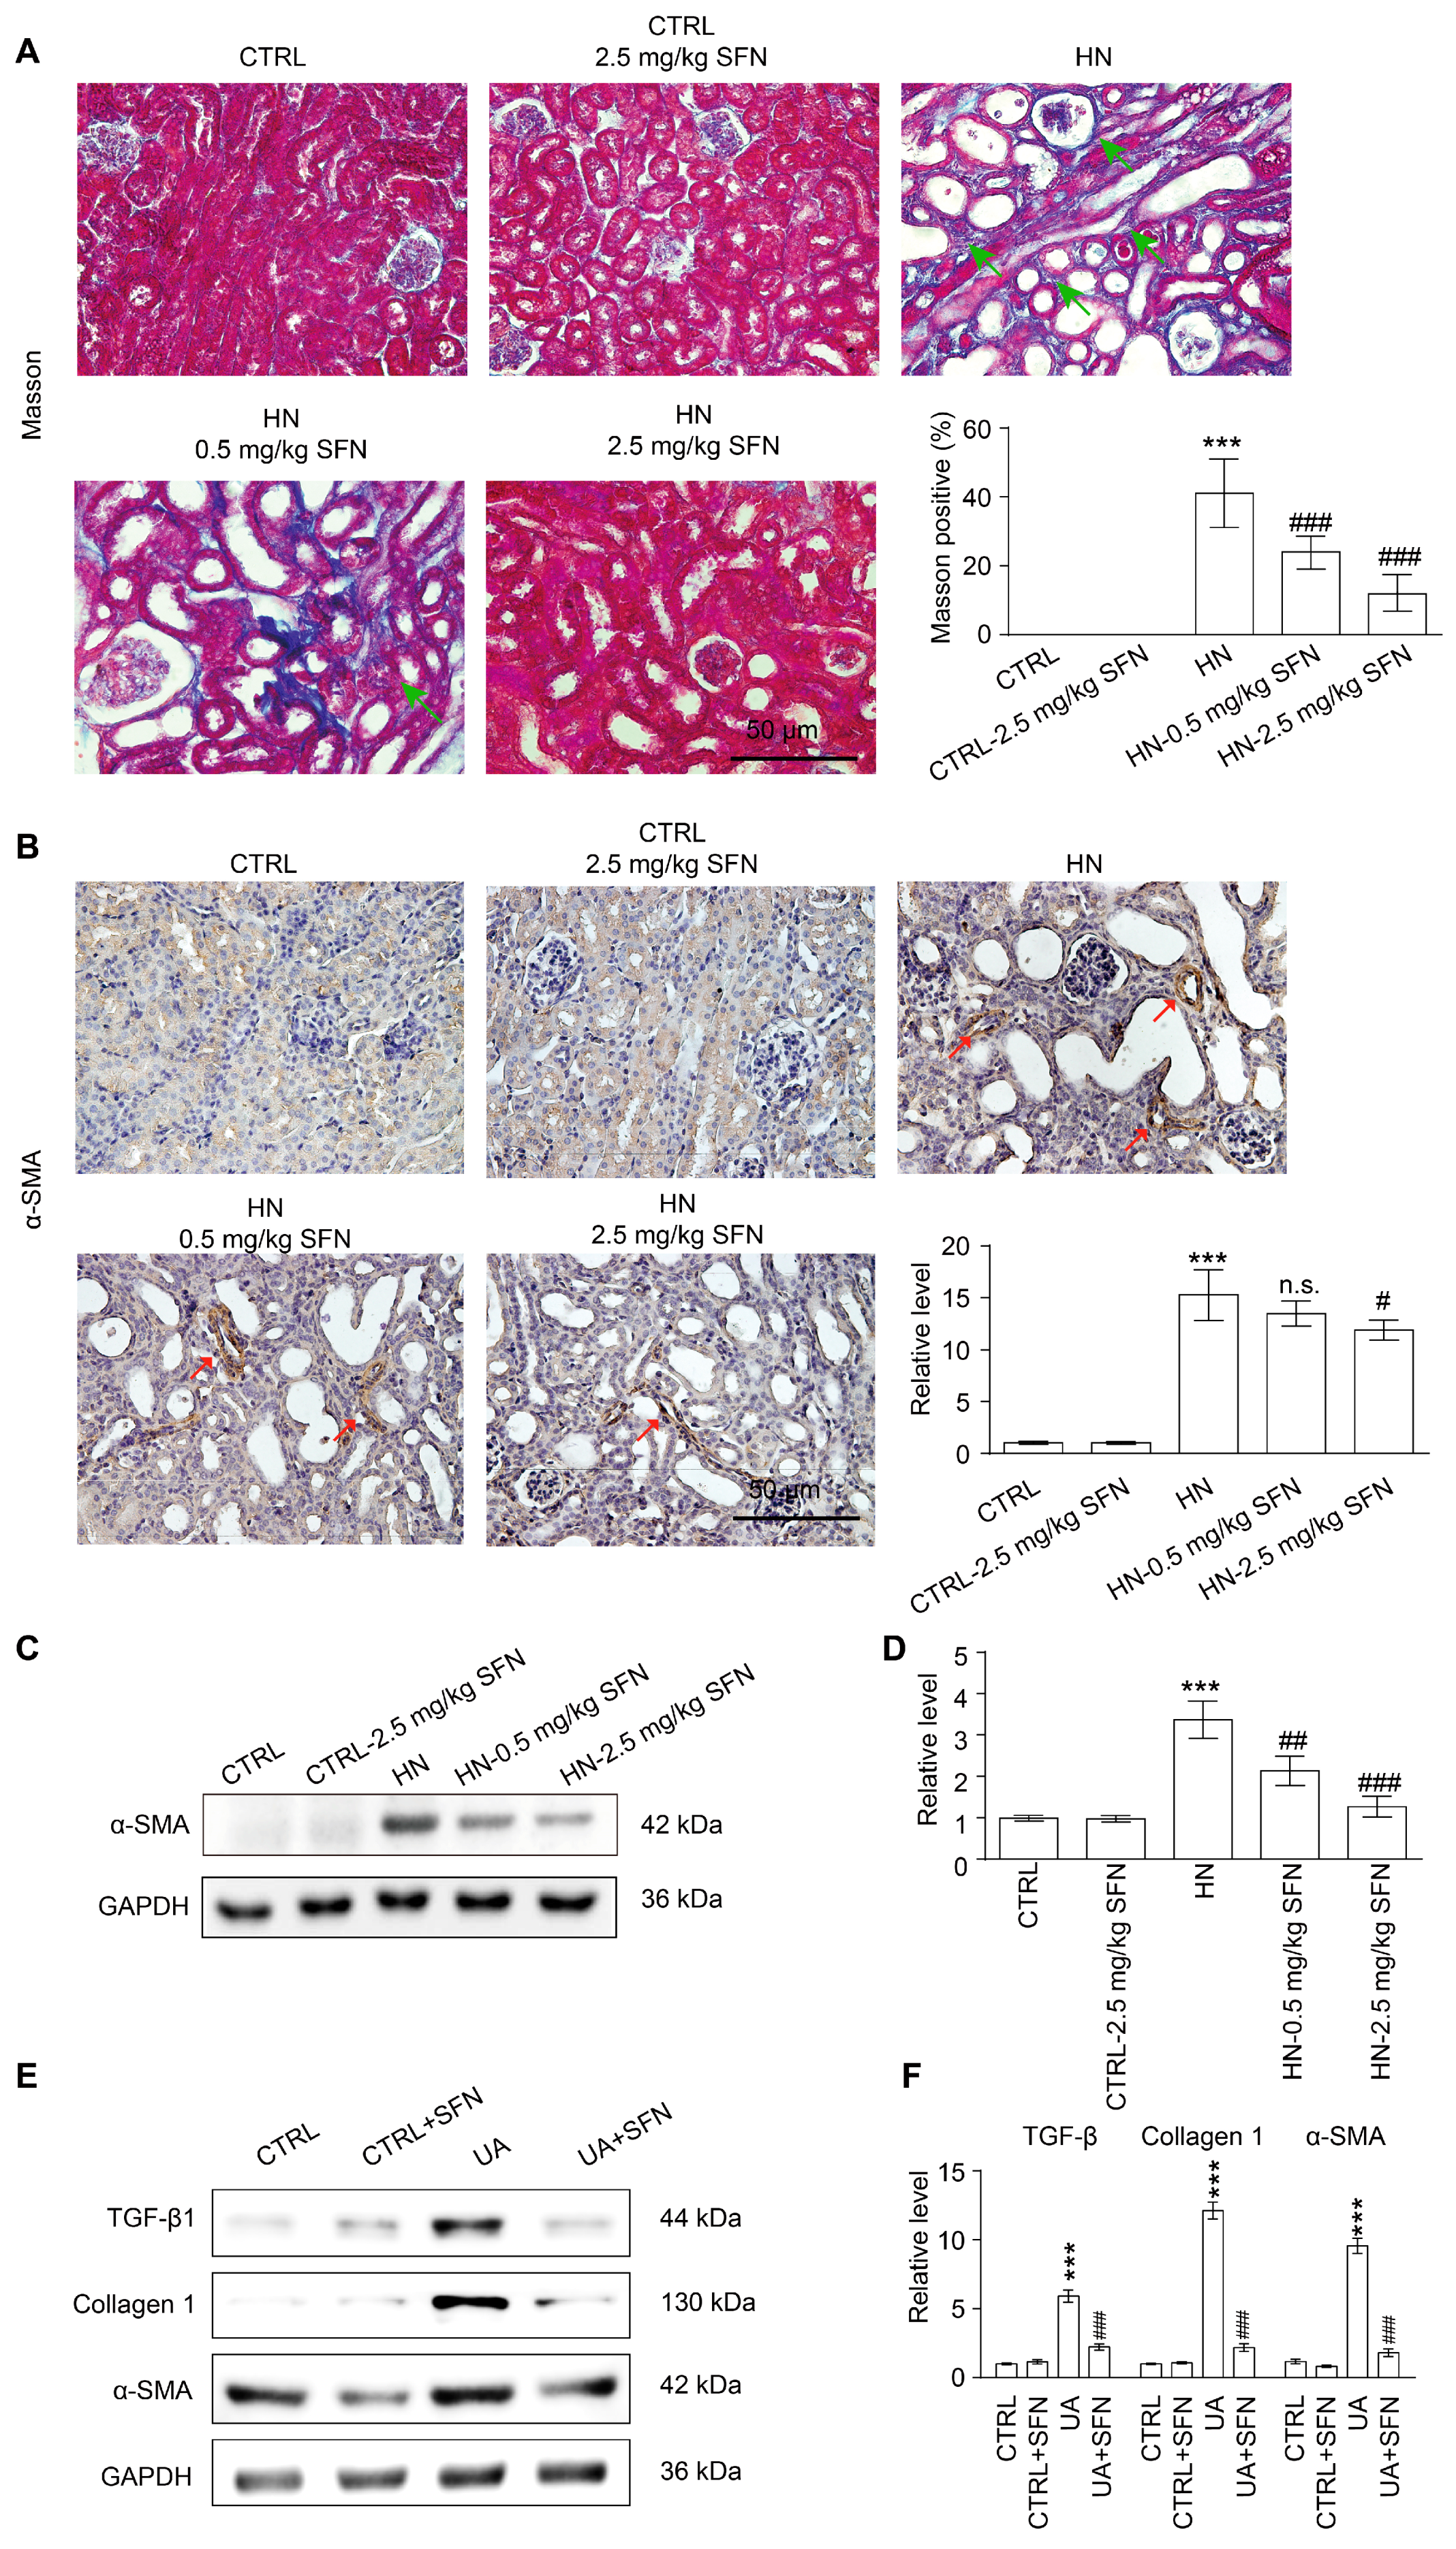
3.9. Activation of NRF2 Improves Renal Fibrosis in Animal and Cell Models by Down-Regulating TGF-β1/α-SMA/Collagen 1 Signaling Pathway
4. Discussion
4.1. NRF2 Antioxidant Signaling Pathway Is Impaired in the Kidney of HN Mice
4.2. Activation of NRF2 Improves Kidney Function in HN Mice
4.3. Activation of NRF2 Improves Mitochondrial Dysfunction by Improving Mitochondrial Homeostasis in Animal and Cell Models
4.4. Activation of NRF2 Alleviates Oxidative Stress in Animal and Cell Models
4.5. Activation of NRF2 Enhances the Antioxidant Capacity of Animals and Cells by Up-Regulating NRF2/HO-1/NQO1 Signaling Pathway
4.6. Activation of NRF2 Improves Renal Fibrosis in Animal and Cell Models by Down-Regulating TGF-β1/α-SMA/Collagen 1 Signaling Pathway
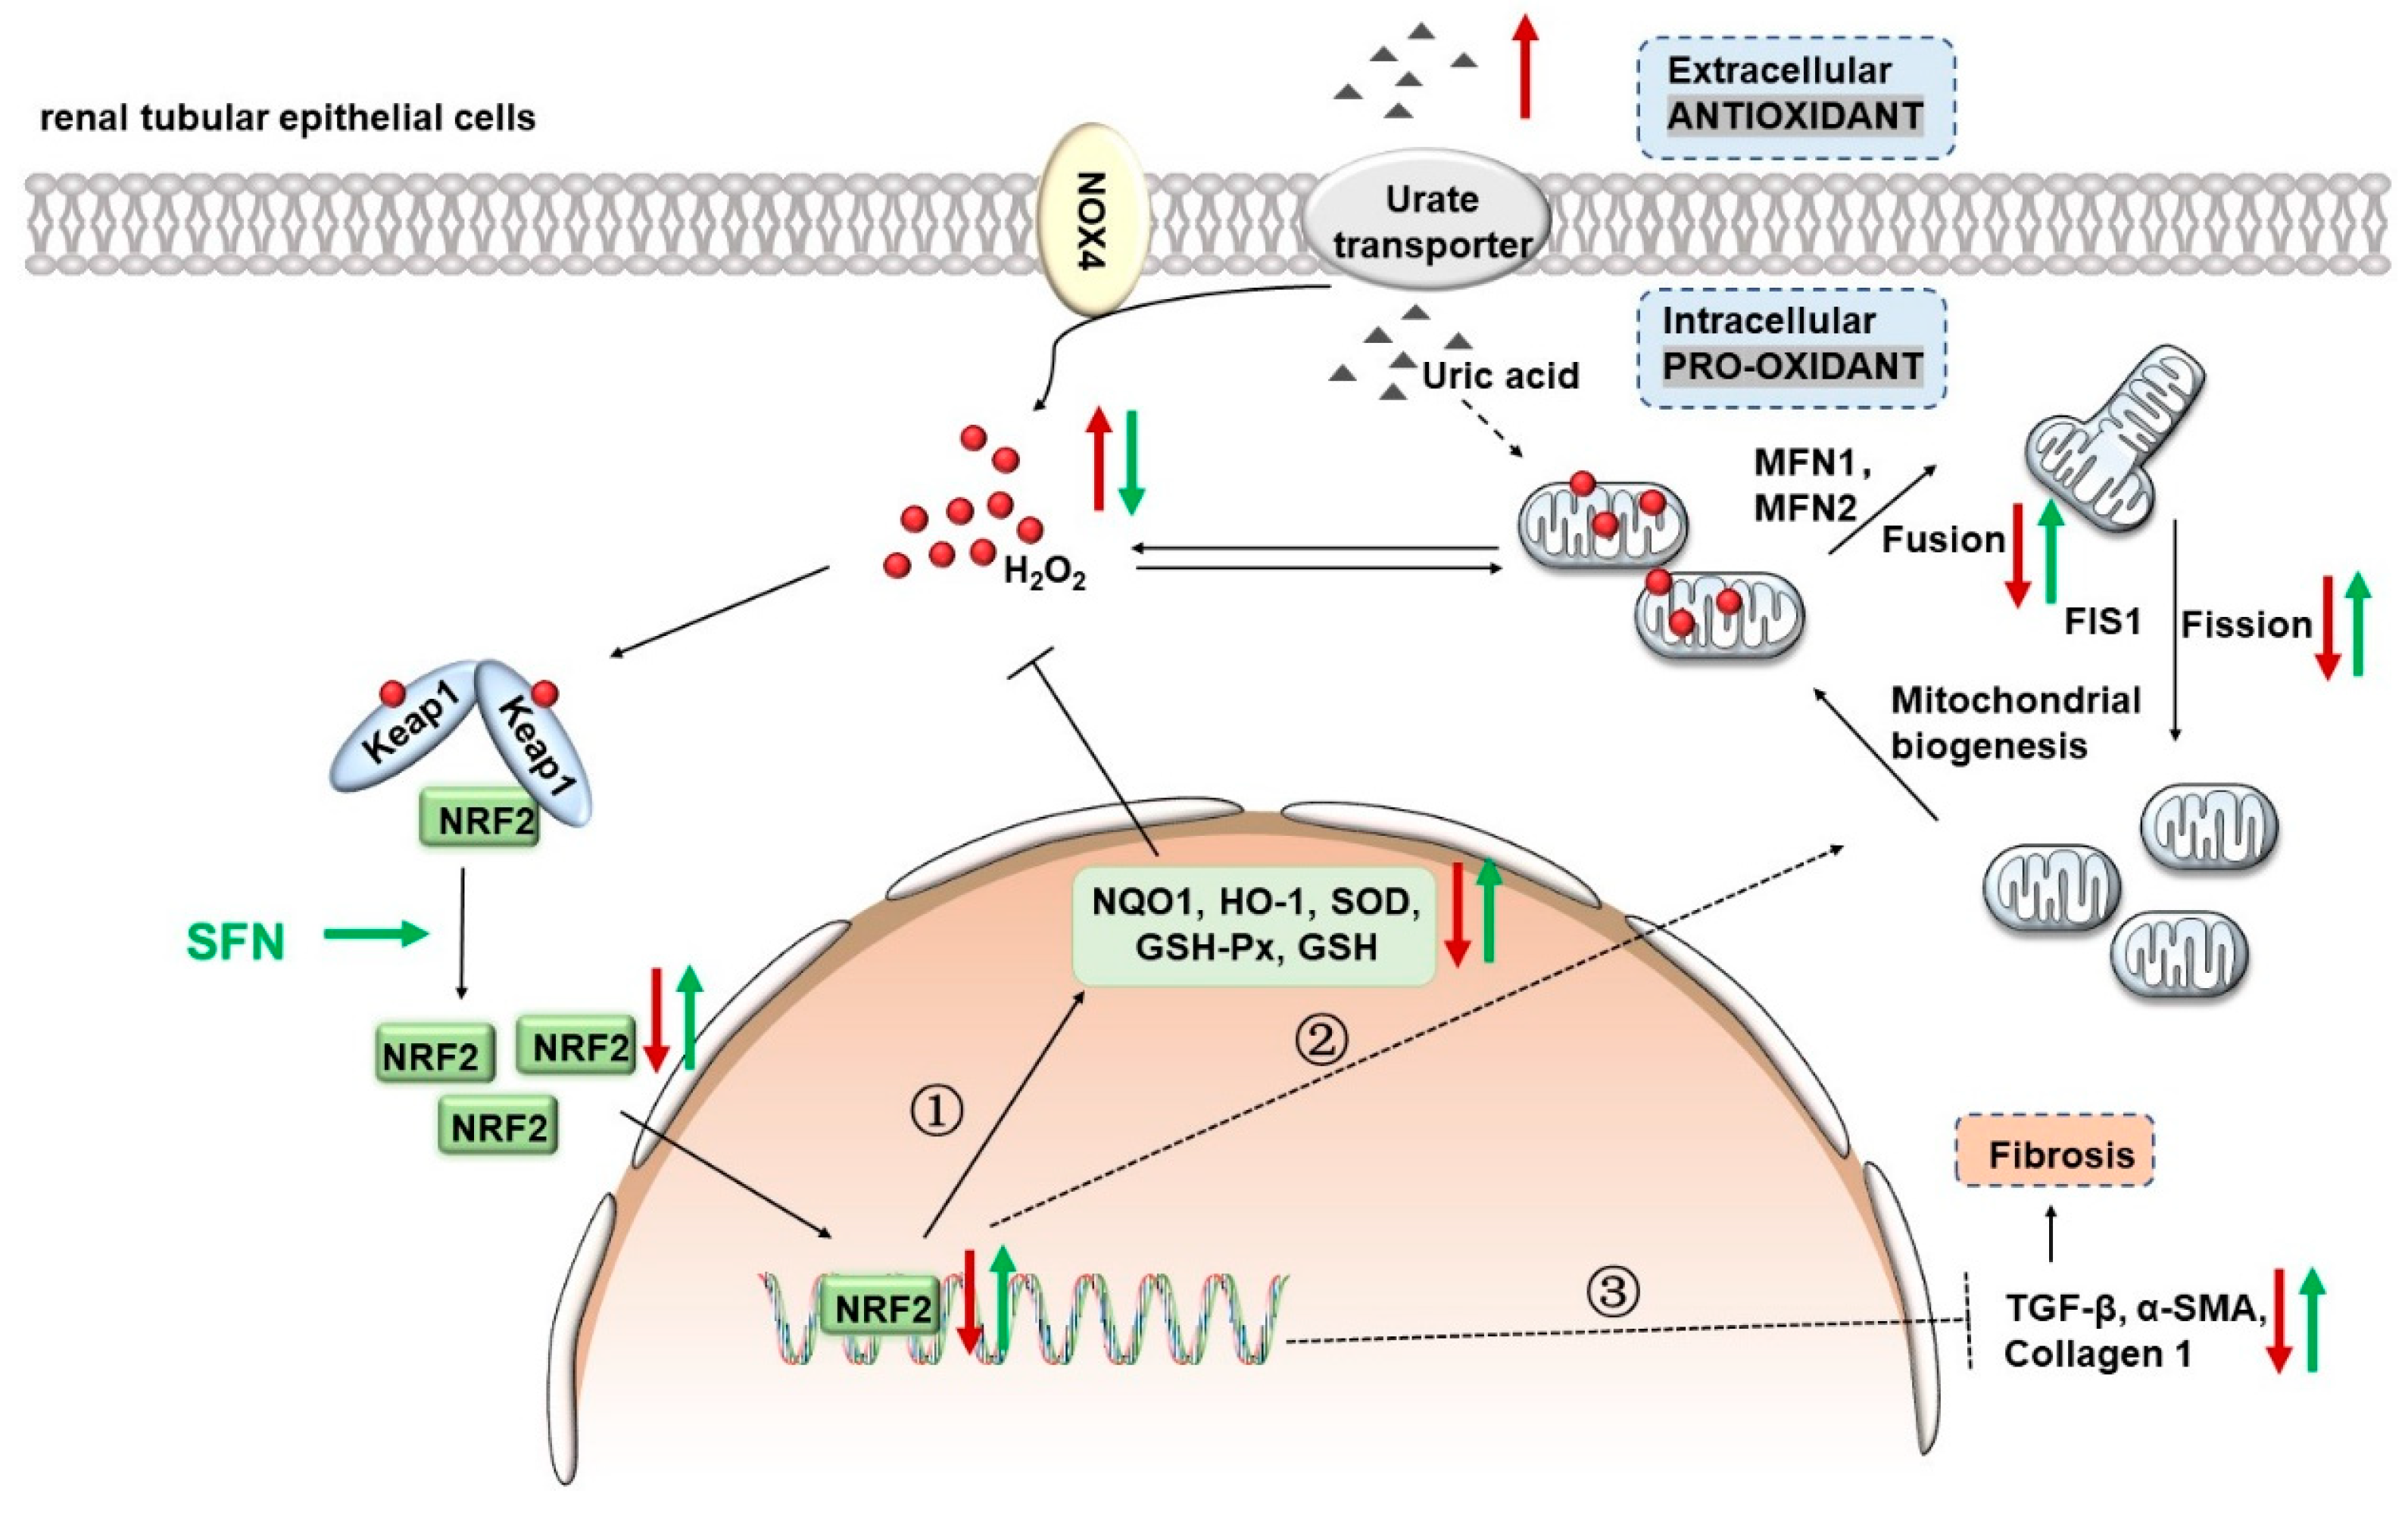
5. Conclusions
Supplementary Materials
Author Contributions
Funding
Institutional Review Board Statement
Informed Consent Statement
Data Availability Statement
Acknowledgments
Conflicts of Interest
References
- Bursill, D.; Taylor, W.J.; Terkeltaub, R.; Kuwabara, M.; Merriman, T.R.; Grainger, R.; Pineda, C.; Louthrenoo, W.; Edwards, N.L.; Andres, M.; et al. Gout, Hyperuricemia, and Crystal-Associated Disease Network Consensus Statement Regarding Labels and Definitions for Disease Elements in Gout. Arthritis Care Res. 2019, 71, 427–434. [Google Scholar] [CrossRef]
- Liu, R.; Han, C.; Wu, D.; Xia, X.; Gu, J.; Guan, H.; Shan, Z.; Teng, W. Prevalence of Hyperuricemia and Gout in Mainland China from 2000 to 2014: A Systematic Review and Meta-Analysis. Biomed. Res. Int. 2015, 2015, 762820. [Google Scholar] [CrossRef] [PubMed]
- Uaratanawong, S.; Suraamornkul, S.; Angkeaw, S.; Uaratanawong, R. Prevalence of hyperuricemia in Bangkok population. Clin. Rheumatol. 2011, 30, 887–893. [Google Scholar] [CrossRef] [PubMed]
- Dalbeth, N.; Merriman, T.R.; Stamp, L.K. Gout. Lancet 2016, 388, 2039–2052. [Google Scholar] [CrossRef] [PubMed]
- Sattui, S.E.; Singh, J.A.; Gaffo, A.L. Comorbidities in patients with crystal diseases and hyperuricemia. Rheum. Dis. Clin. N. Am. 2014, 40, 251–278. [Google Scholar] [CrossRef] [PubMed]
- Feig, D.I.; Kang, D.H.; Johnson, R.J. Uric acid and cardiovascular risk. N. Engl. J. Med. 2008, 359, 1811–1821. [Google Scholar] [CrossRef]
- Ejaz, A.A.; Johnson, R.J.; Shimada, M.; Mohandas, R.; Alquadan, K.F.; Beaver, T.M.; Lapsia, V.; Dass, B. The Role of Uric Acid in Acute Kidney Injury. Nephron 2019, 142, 275–283. [Google Scholar] [CrossRef]
- Rincon-Choles, H.; Jolly, S.E.; Arrigain, S.; Konig, V.; Schold, J.D.; Nakhoul, G.; Navaneethan, S.D.; Nally, J.V., Jr.; Rothberg, M.B. Impact of Uric Acid Levels on Kidney Disease Progression. Am. J. Nephrol. 2017, 46, 315–322. [Google Scholar] [CrossRef]
- Xia, X.; Luo, Q.; Li, B.; Lin, Z.; Yu, X.; Huang, F. Serum uric acid and mortality in chronic kidney disease: A systematic review and meta-analysis. Metabolism 2016, 65, 1326–1341. [Google Scholar] [CrossRef] [PubMed]
- Choi, H.K.; Mount, D.B.; Reginato, A.M. Pathogenesis of gout. Ann. Intern. Med. 2005, 143, 499–516. [Google Scholar] [CrossRef] [PubMed]
- Edwards, N.L. The role of hyperuricemia and gout in kidney and cardiovascular disease. Cleve. Clin. J. Med. 2008, 75, S13–S16. [Google Scholar] [CrossRef]
- Reginato, A.M.; Mount, D.B.; Yang, I.; Choi, H.K. The genetics of hyperuricaemia and gout. Nat. Rev. Rheumatol. 2012, 8, 610–621. [Google Scholar] [CrossRef]
- Roch-Ramel, F.; Guisan, B. Renal Transport of Urate in Humans. News Physiol. Sci. 1999, 14, 80–84. [Google Scholar] [CrossRef]
- Copur, S.; Demiray, A.; Kanbay, M. Uric acid in metabolic syndrome: Does uric acid have a definitive role? Eur. J. Intern. Med. 2022, 103, 4–12. [Google Scholar] [CrossRef] [PubMed]
- Steiger, S.; Ma, Q.; Anders, H.J. The case for evidence-based medicine for the association between hyperuricaemia and CKD. Nat. Rev. Nephrol. 2020, 16, 422. [Google Scholar] [CrossRef] [PubMed]
- Sato, Y.; Feig, D.I.; Stack, A.G.; Kang, D.H.; Lanaspa, M.A.; Ejaz, A.A.; Sanchez-Lozada, L.G.; Kuwabara, M.; Borghi, C.; Johnson, R.J. The case for uric acid-lowering treatment in patients with hyperuricaemia and CKD. Nat. Rev. Nephrol. 2019, 15, 767–775. [Google Scholar] [CrossRef] [PubMed]
- Gorin, Y. The Kidney: An Organ in the Front Line of Oxidative Stress-Associated Pathologies. Antioxid. Redox Signal. 2016, 25, 639–641. [Google Scholar] [CrossRef]
- Okamura, D.M.; Pennathur, S. The balance of powers: Redox regulation of fibrogenic pathways in kidney injury. Redox Biol. 2015, 6, 495–504. [Google Scholar] [CrossRef]
- Yamamoto, M.; Kensler, T.W.; Motohashi, H. The KEAP1-NRF2 System: A Thiol-Based Sensor-Effector Apparatus for Maintaining Redox Homeostasis. Physiol. Rev. 2018, 98, 1169–1203. [Google Scholar] [CrossRef]
- Ruiz, S.; Pergola, P.E.; Zager, R.A.; Vaziri, N.D. Targeting the transcription factor Nrf2 to ameliorate oxidative stress and inflammation in chronic kidney disease. Kidney Int. 2013, 83, 1029–1041. [Google Scholar] [CrossRef]
- Nezu, M.; Suzuki, N.; Yamamoto, M. Targeting the KEAP1-NRF2 System to Prevent Kidney Disease Progression. Am. J. Nephrol. 2017, 45, 473–483. [Google Scholar] [CrossRef]
- Chan, K.; Lu, R.; Chang, J.C.; Kan, Y.W. NRF2, a member of the NFE2 family of transcription factors, is not essential for murine erythropoiesis, growth, and development. Proc. Natl. Acad. Sci. USA 1996, 93, 13943–13948. [Google Scholar] [CrossRef] [PubMed]
- Schock-Kusch, D.; Xie, Q.; Shulhevich, Y.; Hesser, J.; Stsepankou, D.; Sadick, M.; Koenig, S.; Hoecklin, F.; Pill, J.; Gretz, N. Transcutaneous assessment of renal function in conscious rats with a device for measuring FITC-sinistrin disappearance curves. Kidney Int. 2011, 79, 1254–1258. [Google Scholar] [CrossRef]
- Ma, Q.; Immler, R.; Pruenster, M.; Sellmayr, M.; Li, C.; von Brunn, A.; von Brunn, B.; Ehmann, R.; Wolfel, R.; Napoli, M.; et al. Soluble uric acid inhibits beta2 integrin-mediated neutrophil recruitment in innate immunity. Blood 2022, 139, 3402–3417. [Google Scholar] [CrossRef] [PubMed]
- Meng, X.W.; He, C.X.; Chen, X.; Yang, X.S.; Liu, C. The extract of Gnaphalium affine D. Don protects against H2O2-induced apoptosis by targeting PI3K/AKT/GSK-3beta signaling pathway in cardiomyocytes. J. Ethnopharmacol. 2021, 268, 113579. [Google Scholar] [CrossRef]
- Xu, H.; Zhang, B.; Chen, Y.; Zeng, F.; Wang, W.; Chen, Z.; Cao, L.; Shi, J.; Chen, J.; Zhu, X.; et al. Type II collagen facilitates gouty arthritis by regulating MSU crystallisation and inflammatory cell recruitment. Ann. Rheum. Dis. 2022, 82, 416–427. [Google Scholar] [CrossRef]
- Gherghina, M.E.; Peride, I.; Tiglis, M.; Neagu, T.P.; Niculae, A.; Checherita, I.A. Uric Acid and Oxidative Stress-Relationship with Cardiovascular, Metabolic, and Renal Impairment. Int. J. Mol. Sci. 2022, 23, 3188. [Google Scholar] [CrossRef] [PubMed]
- Wu, D.; Chen, R.; Li, Q.; Lai, X.; Sun, L.; Zhang, Z.; Wen, S.; Sun, S.; Cao, F. Tea (Camellia sinensis) Ameliorates Hyperuricemia via Uric Acid Metabolic Pathways and Gut Microbiota. Nutrients 2022, 14, 2666. [Google Scholar] [CrossRef]
- Schmidlin, C.J.; Dodson, M.B.; Madhavan, L.; Zhang, D.D. Redox regulation by NRF2 in aging and disease. Free. Radic. Biol. Med. 2019, 134, 702–707. [Google Scholar] [CrossRef]
- Cheng, Y.; Zhang, X.; Ma, F.; Sun, W.; Wang, W.; Yu, J.; Shi, Y.; Cai, L.; Xu, Z. The Role of Akt2 in the Protective Effect of Fenofibrate against Diabetic Nephropathy. Int. J. Biol. Sci. 2020, 16, 553–567. [Google Scholar] [CrossRef]
- Lu, Y.; Sun, Y.; Liu, Z.; Lu, Y.; Zhu, X.; Lan, B.; Mi, Z.; Dang, L.; Li, N.; Zhan, W.; et al. Activation of NRF2 ameliorates oxidative stress and cystogenesis in autosomal dominant polycystic kidney disease. Sci. Transl. Med. 2020, 12, 1–16. [Google Scholar] [CrossRef]
- Nagasaki, T.; Maeda, H.; Taguchi, K.; Yanagisawa, H.; Nishida, K.; Kobayashi, K.; Wada, N.; Noguchi, I.; Murata, R.; Sakai, H.; et al. A bioinspired carbon monoxide delivery system prevents acute kidney injury and the progression to chronic kidney disease. Redox Biol. 2022, 54, 102371. [Google Scholar] [CrossRef]
- Kensler, T.W.; Egner, P.A.; Agyeman, A.S.; Visvanathan, K.; Groopman, J.D.; Chen, J.G.; Chen, T.Y.; Fahey, J.W.; Talalay, P. Keap1-nrf2 signaling: A target for cancer prevention by sulforaphane. Top Curr. Chem. 2013, 329, 163–177. [Google Scholar] [CrossRef] [PubMed]
- Uddin, M.S.; Mamun, A.A.; Jakaria, M.; Thangapandiyan, S.; Ahmad, J.; Rahman, M.A.; Mathew, B.; Abdel-Daim, M.M.; Aleya, L. Emerging promise of sulforaphane-mediated Nrf2 signaling cascade against neurological disorders. Sci. Total Environ. 2020, 707, 135624. [Google Scholar] [CrossRef] [PubMed]
- Li, Z.; Guo, H.; Li, J.; Ma, T.; Zhou, S.; Zhang, Z.; Miao, L.; Cai, L. Sulforaphane prevents type 2 diabetes-induced nephropathy via AMPK-mediated activation of lipid metabolic pathways and Nrf2 antioxidative function. Clin. Sci. 2020, 134, 2469–2487. [Google Scholar] [CrossRef] [PubMed]
- Liu, H.; Yang, X.; Tang, K.; Ye, T.; Duan, C.; Lv, P.; Yan, L.; Wu, X.; Chen, Z.; Liu, J.; et al. Sulforaphane elicts dual therapeutic effects on Renal Inflammatory Injury and crystal deposition in Calcium Oxalate Nephrocalcinosis. Theranostics 2020, 10, 7319–7334. [Google Scholar] [CrossRef]
- Liebman, S.E.; Le, T.H. Eat Your Broccoli: Oxidative Stress, NRF2, and Sulforaphane in Chronic Kidney Disease. Nutrients 2021, 13, 266. [Google Scholar] [CrossRef]
- Tilokani, L.; Nagashima, S.; Paupe, V.; Prudent, J. Mitochondrial dynamics: Overview of molecular mechanisms. Essays Biochem. 2018, 62, 341–360. [Google Scholar] [CrossRef]
- Zhang, Z.; Liu, L.; Wu, S.; Xing, D. Drp1, Mff, Fis1, and MiD51 are coordinated to mediate mitochondrial fission during UV irradiation-induced apoptosis. FASEB J. 2016, 30, 466–476. [Google Scholar] [CrossRef]
- Higa, Y.; Hiasa, M.; Tenshin, H.; Nakaue, E.; Tanaka, M.; Kim, S.; Nakagawa, M.; Shimizu, S.; Tanimoto, K.; Teramachi, J.; et al. The Xanthine Oxidase Inhibitor Febuxostat Suppresses Adipogenesis and Activates Nrf2. Antioxidants 2023, 12, 133. [Google Scholar] [CrossRef]
- Rodriguez-Rovira, I.; Arce, C.; De Rycke, K.; Perez, B.; Carretero, A.; Arbones, M.; Teixido-Tura, G.; Gomez-Cabrera, M.C.; Campuzano, V.; Jimenez-Altayo, F.; et al. Allopurinol blocks aortic aneurysm in a mouse model of Marfan syndrome via reducing aortic oxidative stress. Free. Radic. Biol. Med. 2022, 193, 538–550. [Google Scholar] [CrossRef] [PubMed]
- Duann, P.; Lin, P.H. Mitochondria Damage and Kidney Disease. Adv. Exp. Med. Biol. 2017, 982, 529–551. [Google Scholar] [CrossRef] [PubMed]
- Nourbakhsh, N.; Singh, P. Role of renal oxygenation and mitochondrial function in the pathophysiology of acute kidney injury. Nephron. Clin. Pract. 2014, 127, 149–152. [Google Scholar] [CrossRef] [PubMed]
- Khacho, M.; Harris, R.; Slack, R.S. Mitochondria as central regulators of neural stem cell fate and cognitive function. Nat. Rev. Neurosci. 2019, 20, 34–48. [Google Scholar] [CrossRef]
- Zacharioudakis, E.; Agianian, B.; Kumar Mv, V.; Biris, N.; Garner, T.P.; Rabinovich-Nikitin, I.; Ouchida, A.T.; Margulets, V.; Nordstrom, L.U.; Riley, J.S.; et al. Modulating mitofusins to control mitochondrial function and signaling. Nat. Commun. 2022, 13, 3775. [Google Scholar] [CrossRef] [PubMed]
- Pernas, L.; Scorrano, L. Mito-Morphosis: Mitochondrial Fusion, Fission, and Cristae Remodeling as Key Mediators of Cellular Function. Annu. Rev. Physiol. 2016, 78, 505–531. [Google Scholar] [CrossRef] [PubMed]
- Chan, D.C. Mitochondrial Dynamics and Its Involvement in Disease. Annu. Rev. Pathol. 2020, 15, 235–259. [Google Scholar] [CrossRef]
- Nolfi-Donegan, D.; Braganza, A.; Shiva, S. Mitochondrial electron transport chain: Oxidative phosphorylation, oxidant production, and methods of measurement. Redox Biol. 2020, 37, 101674. [Google Scholar] [CrossRef]
- Xu, M.; Wang, Y.; Ayub, A.; Ashraf, M. Mitochondrial K(ATP) channel activation reduces anoxic injury by restoring mitochondrial membrane potential. Am. J. Physiol. Heart Circ. Physiol. 2001, 281, H1295–H1303. [Google Scholar] [CrossRef]
- Di Lisa, F.; Menabo, R.; Canton, M.; Barile, M.; Bernardi, P. Opening of the mitochondrial permeability transition pore causes depletion of mitochondrial and cytosolic NAD+ and is a causative event in the death of myocytes in postischemic reperfusion of the heart. J. Biol. Chem. 2001, 276, 2571–2575. [Google Scholar] [CrossRef]
- Forbes, J.M.; Ke, B.X.; Nguyen, T.V.; Henstridge, D.C.; Penfold, S.A.; Laskowski, A.; Sourris, K.C.; Groschner, L.N.; Cooper, M.E.; Thorburn, D.R.; et al. Deficiency in mitochondrial complex I activity due to Ndufs6 gene trap insertion induces renal disease. Antioxid. Redox Signal. 2013, 19, 331–343. [Google Scholar] [CrossRef] [PubMed]
- Hall, A.M.; Rhodes, G.J.; Sandoval, R.M.; Corridon, P.R.; Molitoris, B.A. In vivo multiphoton imaging of mitochondrial structure and function during acute kidney injury. Kidney Int. 2013, 83, 72–83. [Google Scholar] [CrossRef] [PubMed]
- Hall, A.M.; Unwin, R.J. The not so ‘mighty chondrion’: Emergence of renal diseases due to mitochondrial dysfunction. Nephron Physiol. 2007, 105, p1–p10. [Google Scholar] [CrossRef] [PubMed]
- Di Cristofano, M.; Ferramosca, A.; Di Giacomo, M.; Fusco, C.; Boscaino, F.; Luongo, D.; Rotondi Aufiero, V.; Maurano, F.; Cocca, E.; Mazzarella, G.; et al. Mechanisms underlying the hormetic effect of conjugated linoleic acid: Focus on Nrf2, mitochondria and NADPH oxidases. Free. Radic. Biol. Med. 2021, 167, 276–286. [Google Scholar] [CrossRef] [PubMed]
- Sies, H.; Jones, D.P. Reactive oxygen species (ROS) as pleiotropic physiological signalling agents. Nat. Rev. Mol. Cell Biol. 2020, 21, 363–383. [Google Scholar] [CrossRef]
- Choi, Y.J.; Yoon, Y.; Lee, K.Y.; Hien, T.T.; Kang, K.W.; Kim, K.C.; Lee, J.; Lee, M.Y.; Lee, S.M.; Kang, D.H.; et al. Uric acid induces endothelial dysfunction by vascular insulin resistance associated with the impairment of nitric oxide synthesis. FASEB J. Off. Publ. Fed. Am. Soc. Exp. Biol. 2014, 28, 3197–3204. [Google Scholar] [CrossRef]
- Lanaspa, M.A.; Sanchez-Lozada, L.G.; Choi, Y.J.; Cicerchi, C.; Kanbay, M.; Roncal-Jimenez, C.A.; Ishimoto, T.; Li, N.; Marek, G.; Duranay, M.; et al. Uric acid induces hepatic steatosis by generation of mitochondrial oxidative stress: Potential role in fructose-dependent and -independent fatty liver. J. Biol. Chem. 2012, 287, 40732–40744. [Google Scholar] [CrossRef]
- Sanchez-Lozada, L.G.; Lanaspa, M.A.; Cristobal-Garcia, M.; Garcia-Arroyo, F.; Soto, V.; Cruz-Robles, D.; Nakagawa, T.; Yu, M.A.; Kang, D.H.; Johnson, R.J. Uric acid-induced endothelial dysfunction is associated with mitochondrial alterations and decreased intracellular ATP concentrations. Nephron Exp. Nephrol. 2012, 121, e71–e78. [Google Scholar] [CrossRef]
- Yu, W.; Chen, C.; Zhuang, W.; Wang, W.; Liu, W.; Zhao, H.; Lv, J.; Xie, D.; Wang, Q.; He, F.; et al. Silencing TXNIP ameliorates high uric acid-induced insulin resistance via the IRS2/AKT and Nrf2/HO-1 pathways in macrophages. Free. Radic. Biol. Med. 2022, 178, 42–53. [Google Scholar] [CrossRef]
- Lee, S.Y.; Ju, M.K.; Jeon, H.M.; Lee, Y.J.; Kim, C.H.; Park, H.G.; Han, S.I.; Kang, H.S. Reactive oxygen species induce epithelial-mesenchymal transition, glycolytic switch, and mitochondrial repression through the Dlx-2/Snail signaling pathways in MCF-7 cells. Mol. Med. Rep. 2019, 20, 2339–2346. [Google Scholar] [CrossRef]
- Yang, I.H.; Lee, J.J.; Wu, P.C.; Kuo, H.K.; Kuo, Y.H.; Huang, H.M. Oxidative stress enhanced the transforming growth factor-beta2-induced epithelial-mesenchymal transition through chemokine ligand 1 on ARPE-19 cell. Sci. Rep. 2020, 10, 4000. [Google Scholar] [CrossRef] [PubMed]


Disclaimer/Publisher’s Note: The statements, opinions and data contained in all publications are solely those of the individual author(s) and contributor(s) and not of MDPI and/or the editor(s). MDPI and/or the editor(s) disclaim responsibility for any injury to people or property resulting from any ideas, methods, instructions or products referred to in the content. |
© 2023 by the authors. Licensee MDPI, Basel, Switzerland. This article is an open access article distributed under the terms and conditions of the Creative Commons Attribution (CC BY) license (https://creativecommons.org/licenses/by/4.0/).
Share and Cite
Qiao, P.; Sun, Y.; Wang, Y.; Lin, S.; An, Y.; Wang, L.; Liu, J.; Huang, Y.; Yang, B.; Zhou, H. Activation of NRF2 Signaling Pathway Delays the Progression of Hyperuricemic Nephropathy by Reducing Oxidative Stress. Antioxidants 2023, 12, 1022. https://doi.org/10.3390/antiox12051022
Qiao P, Sun Y, Wang Y, Lin S, An Y, Wang L, Liu J, Huang Y, Yang B, Zhou H. Activation of NRF2 Signaling Pathway Delays the Progression of Hyperuricemic Nephropathy by Reducing Oxidative Stress. Antioxidants. 2023; 12(5):1022. https://doi.org/10.3390/antiox12051022
Chicago/Turabian StyleQiao, Panshuang, Yi Sun, Yiming Wang, Simei Lin, Yongpan An, Liang Wang, Jihan Liu, Yajun Huang, Baoxue Yang, and Hong Zhou. 2023. "Activation of NRF2 Signaling Pathway Delays the Progression of Hyperuricemic Nephropathy by Reducing Oxidative Stress" Antioxidants 12, no. 5: 1022. https://doi.org/10.3390/antiox12051022