
Standardized Sanguisorba officinalis L. Extract Inhibits Adipogenesis and Promotes Thermogenesis via Reducing Oxidative Stress
 and
and 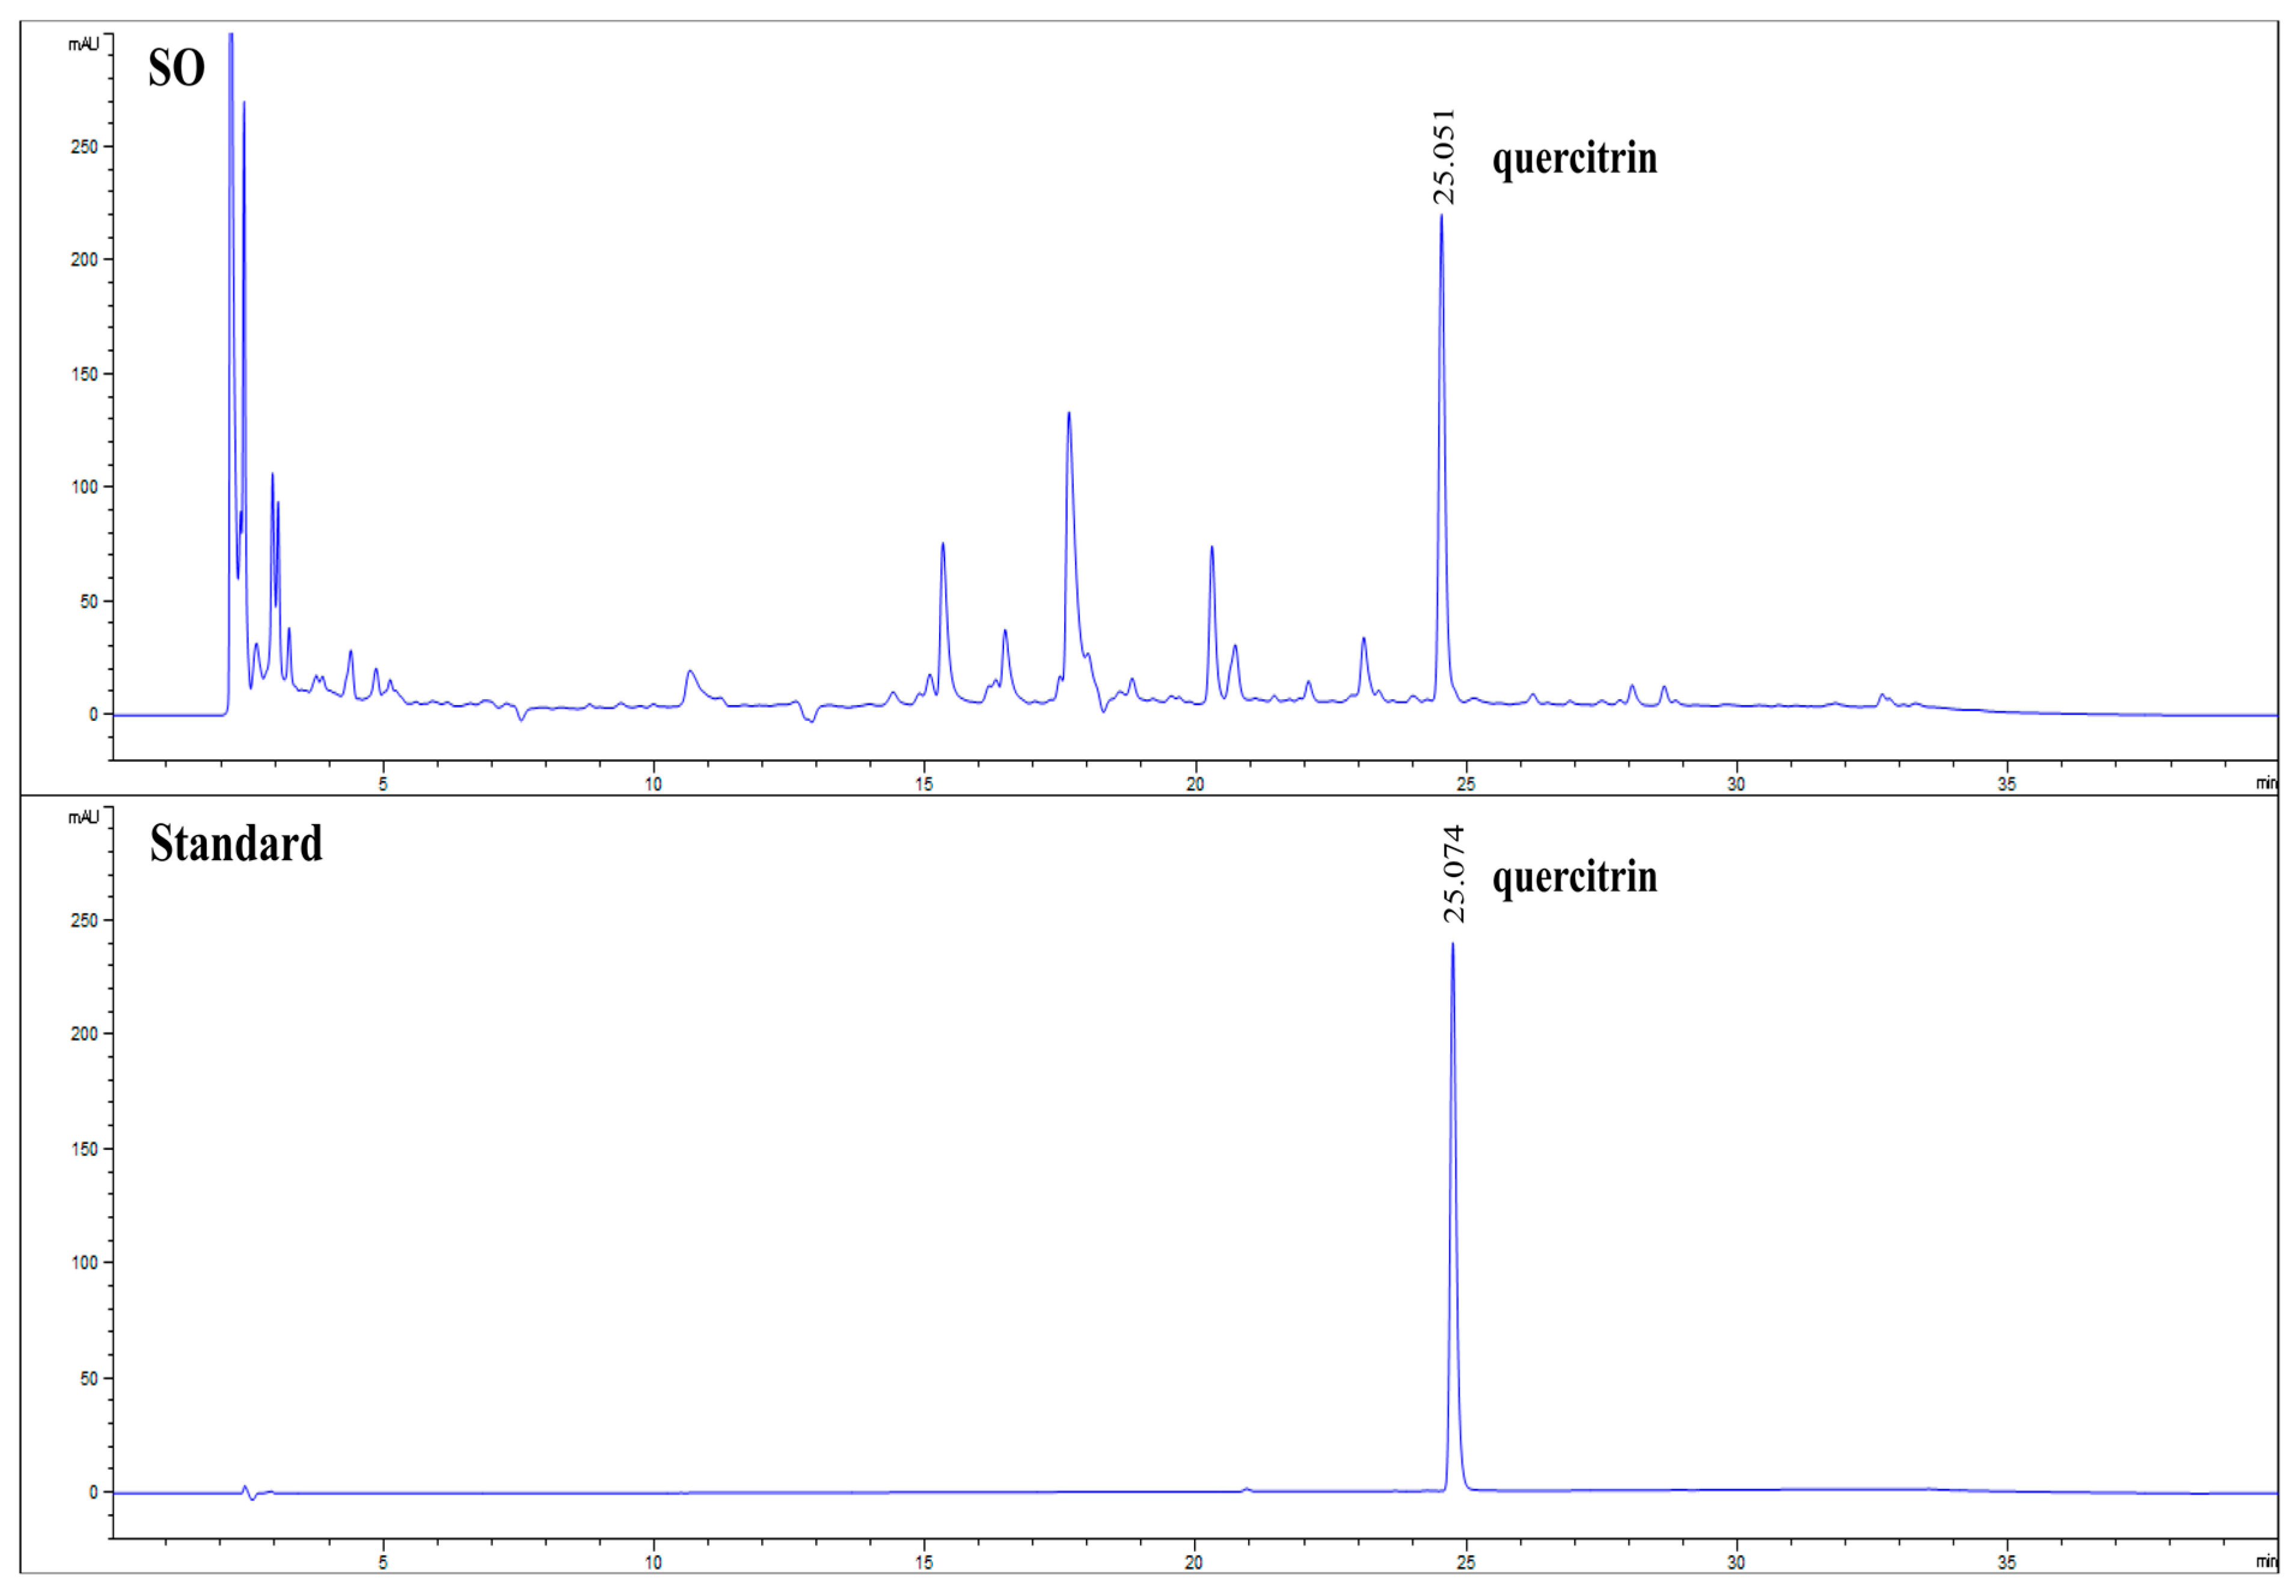
Abstract
:1. Introduction
2. Materials and Methods
2.1. Reagents
2.2. Sample Preparation
2.3. Sample Standardization
2.4. Cell Culture and Differentiation
2.5. Cell Viability Assay
2.6. ORO Staining and NBT Assay
2.7. Animal Experiment
2.8. Serum Analysis and Tissue Collection
2.9. Histological Analysis
2.10. Histofluorescence Staining
2.11. Immunohistochemistry
2.12. Western Blot Analysis
2.13. Statistical Analysis
3. Results
3.1. Quantification of Quercitrin in SO
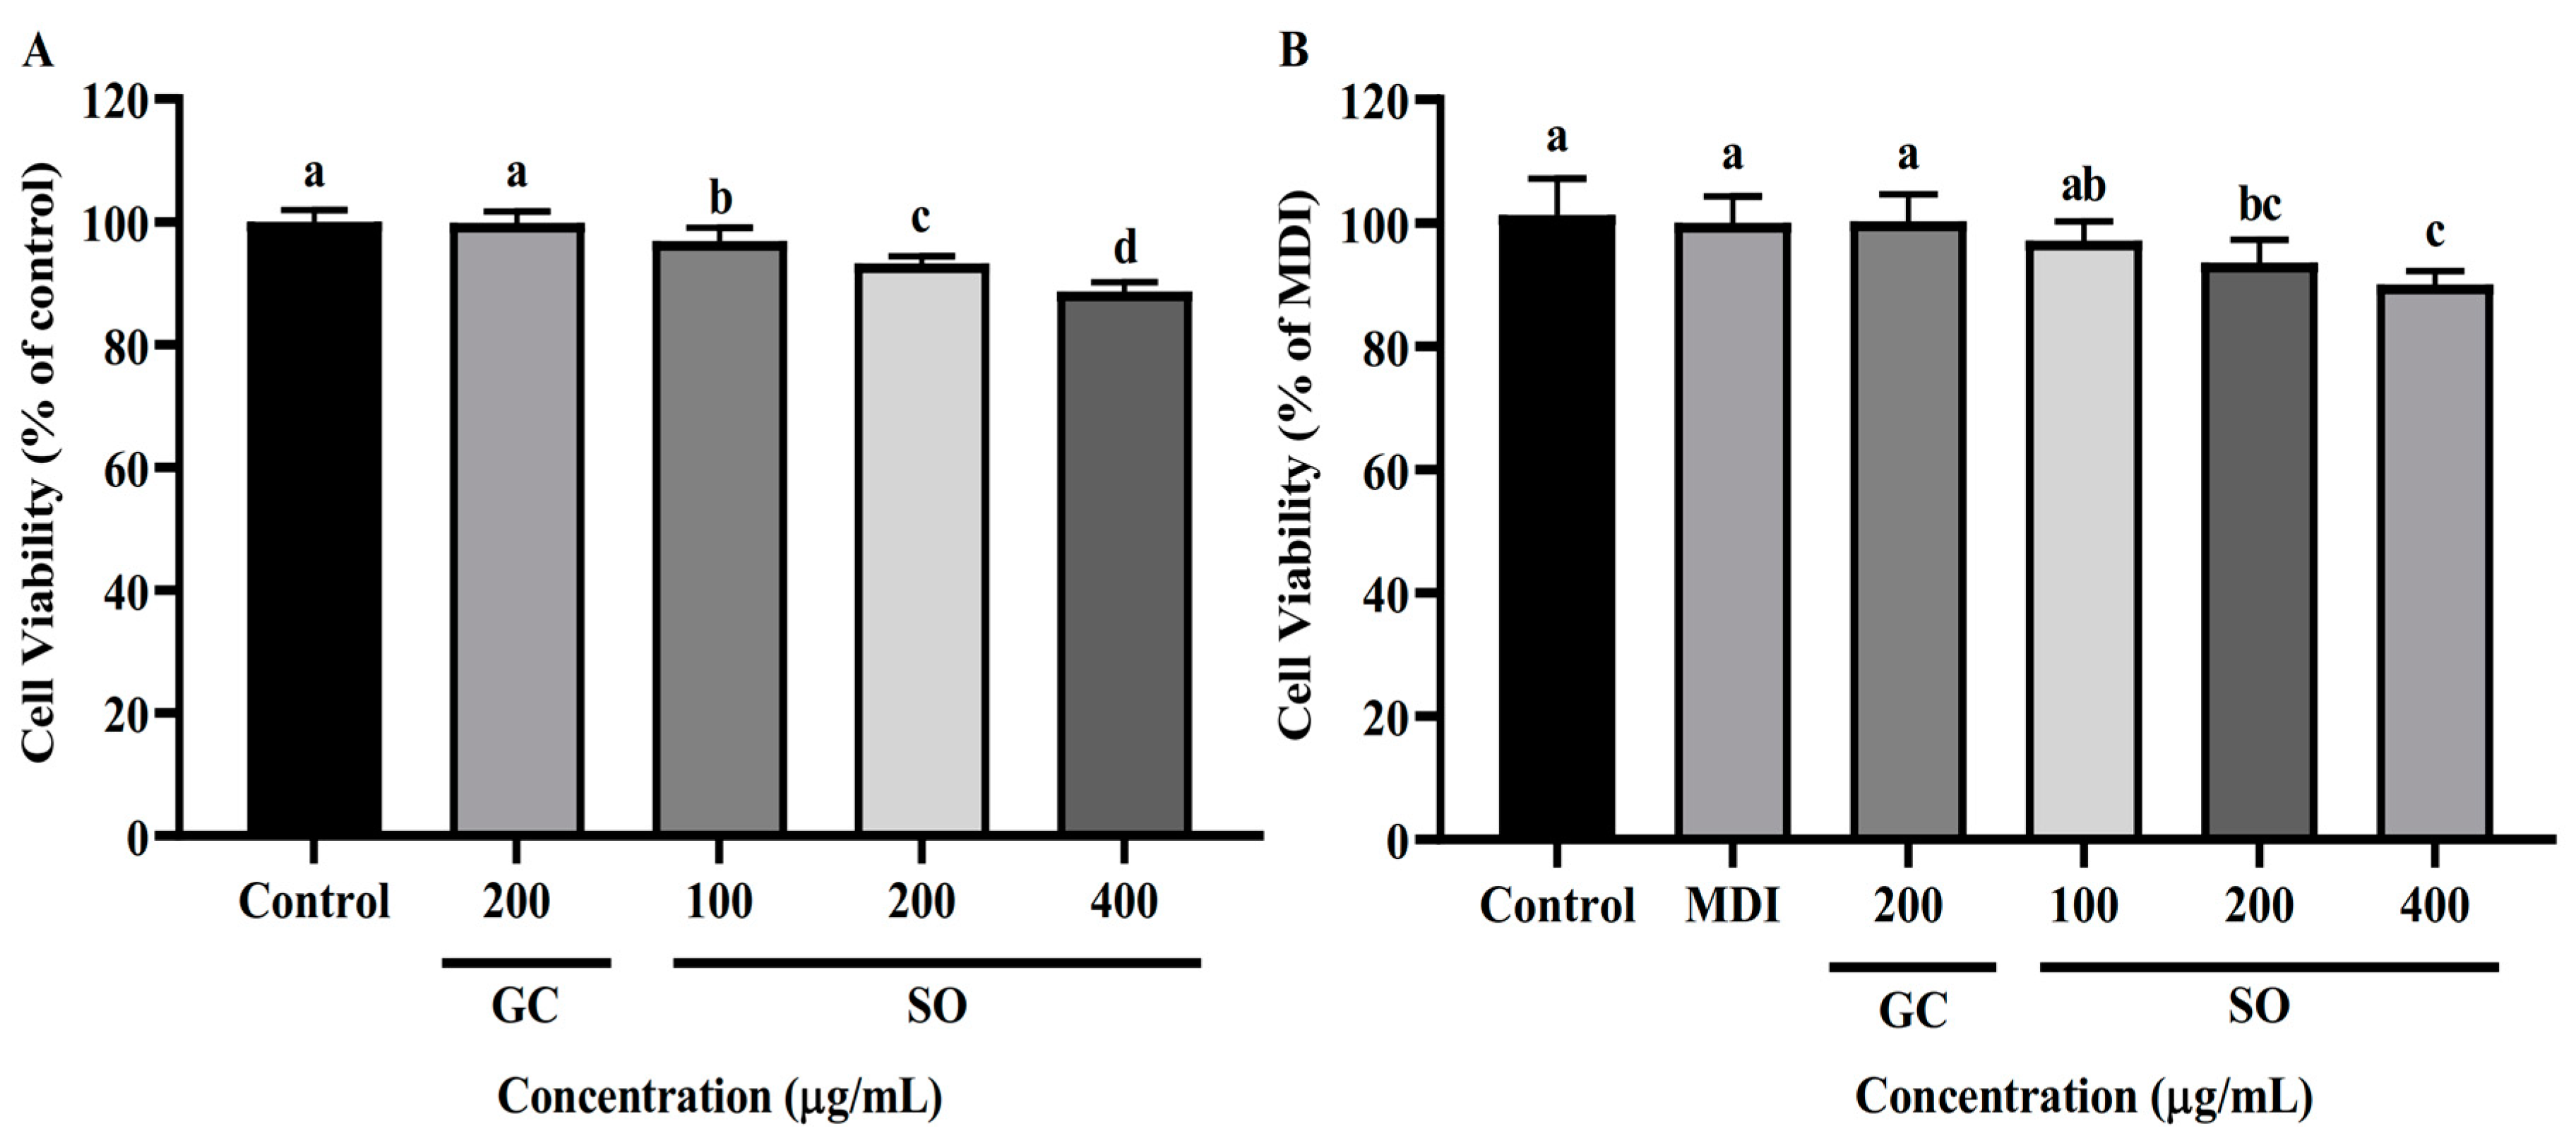
3.2. SO Has No Apparent Cytotoxicity to 3T3-L1 Cells
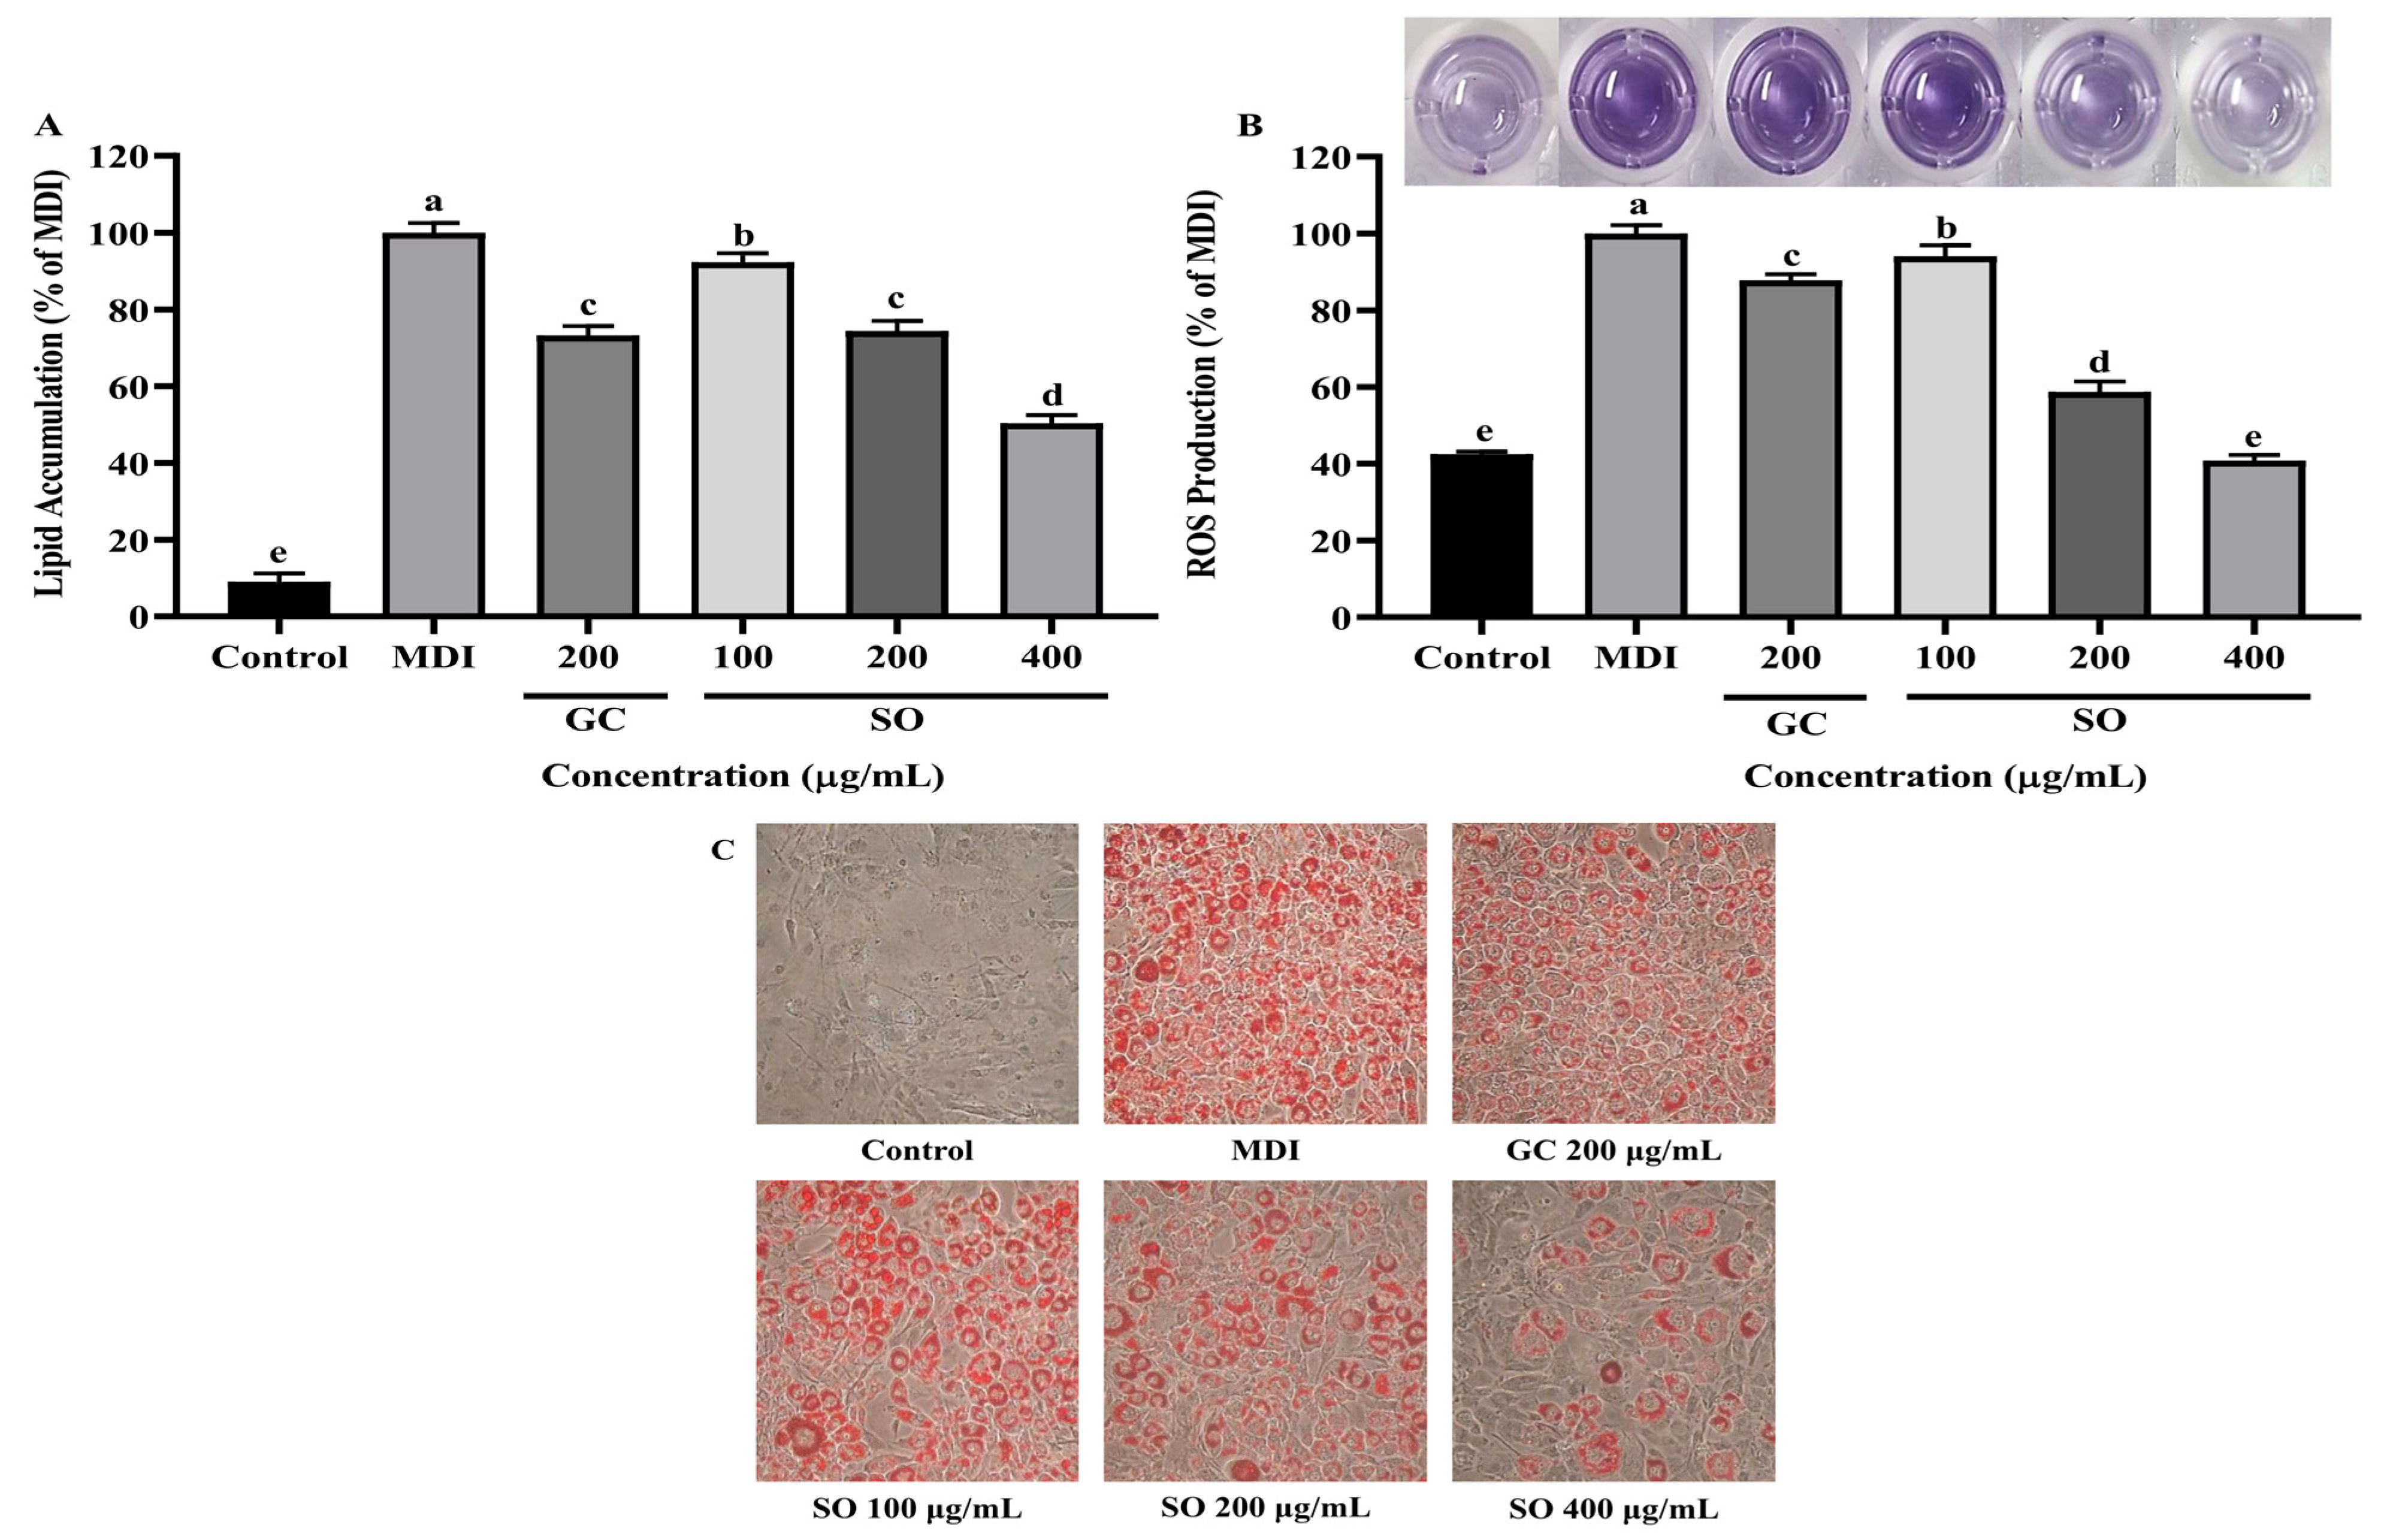
3.3. SO Reduces Lipid Accumulation and ROS Production in 3T3-L1 Adipocytes
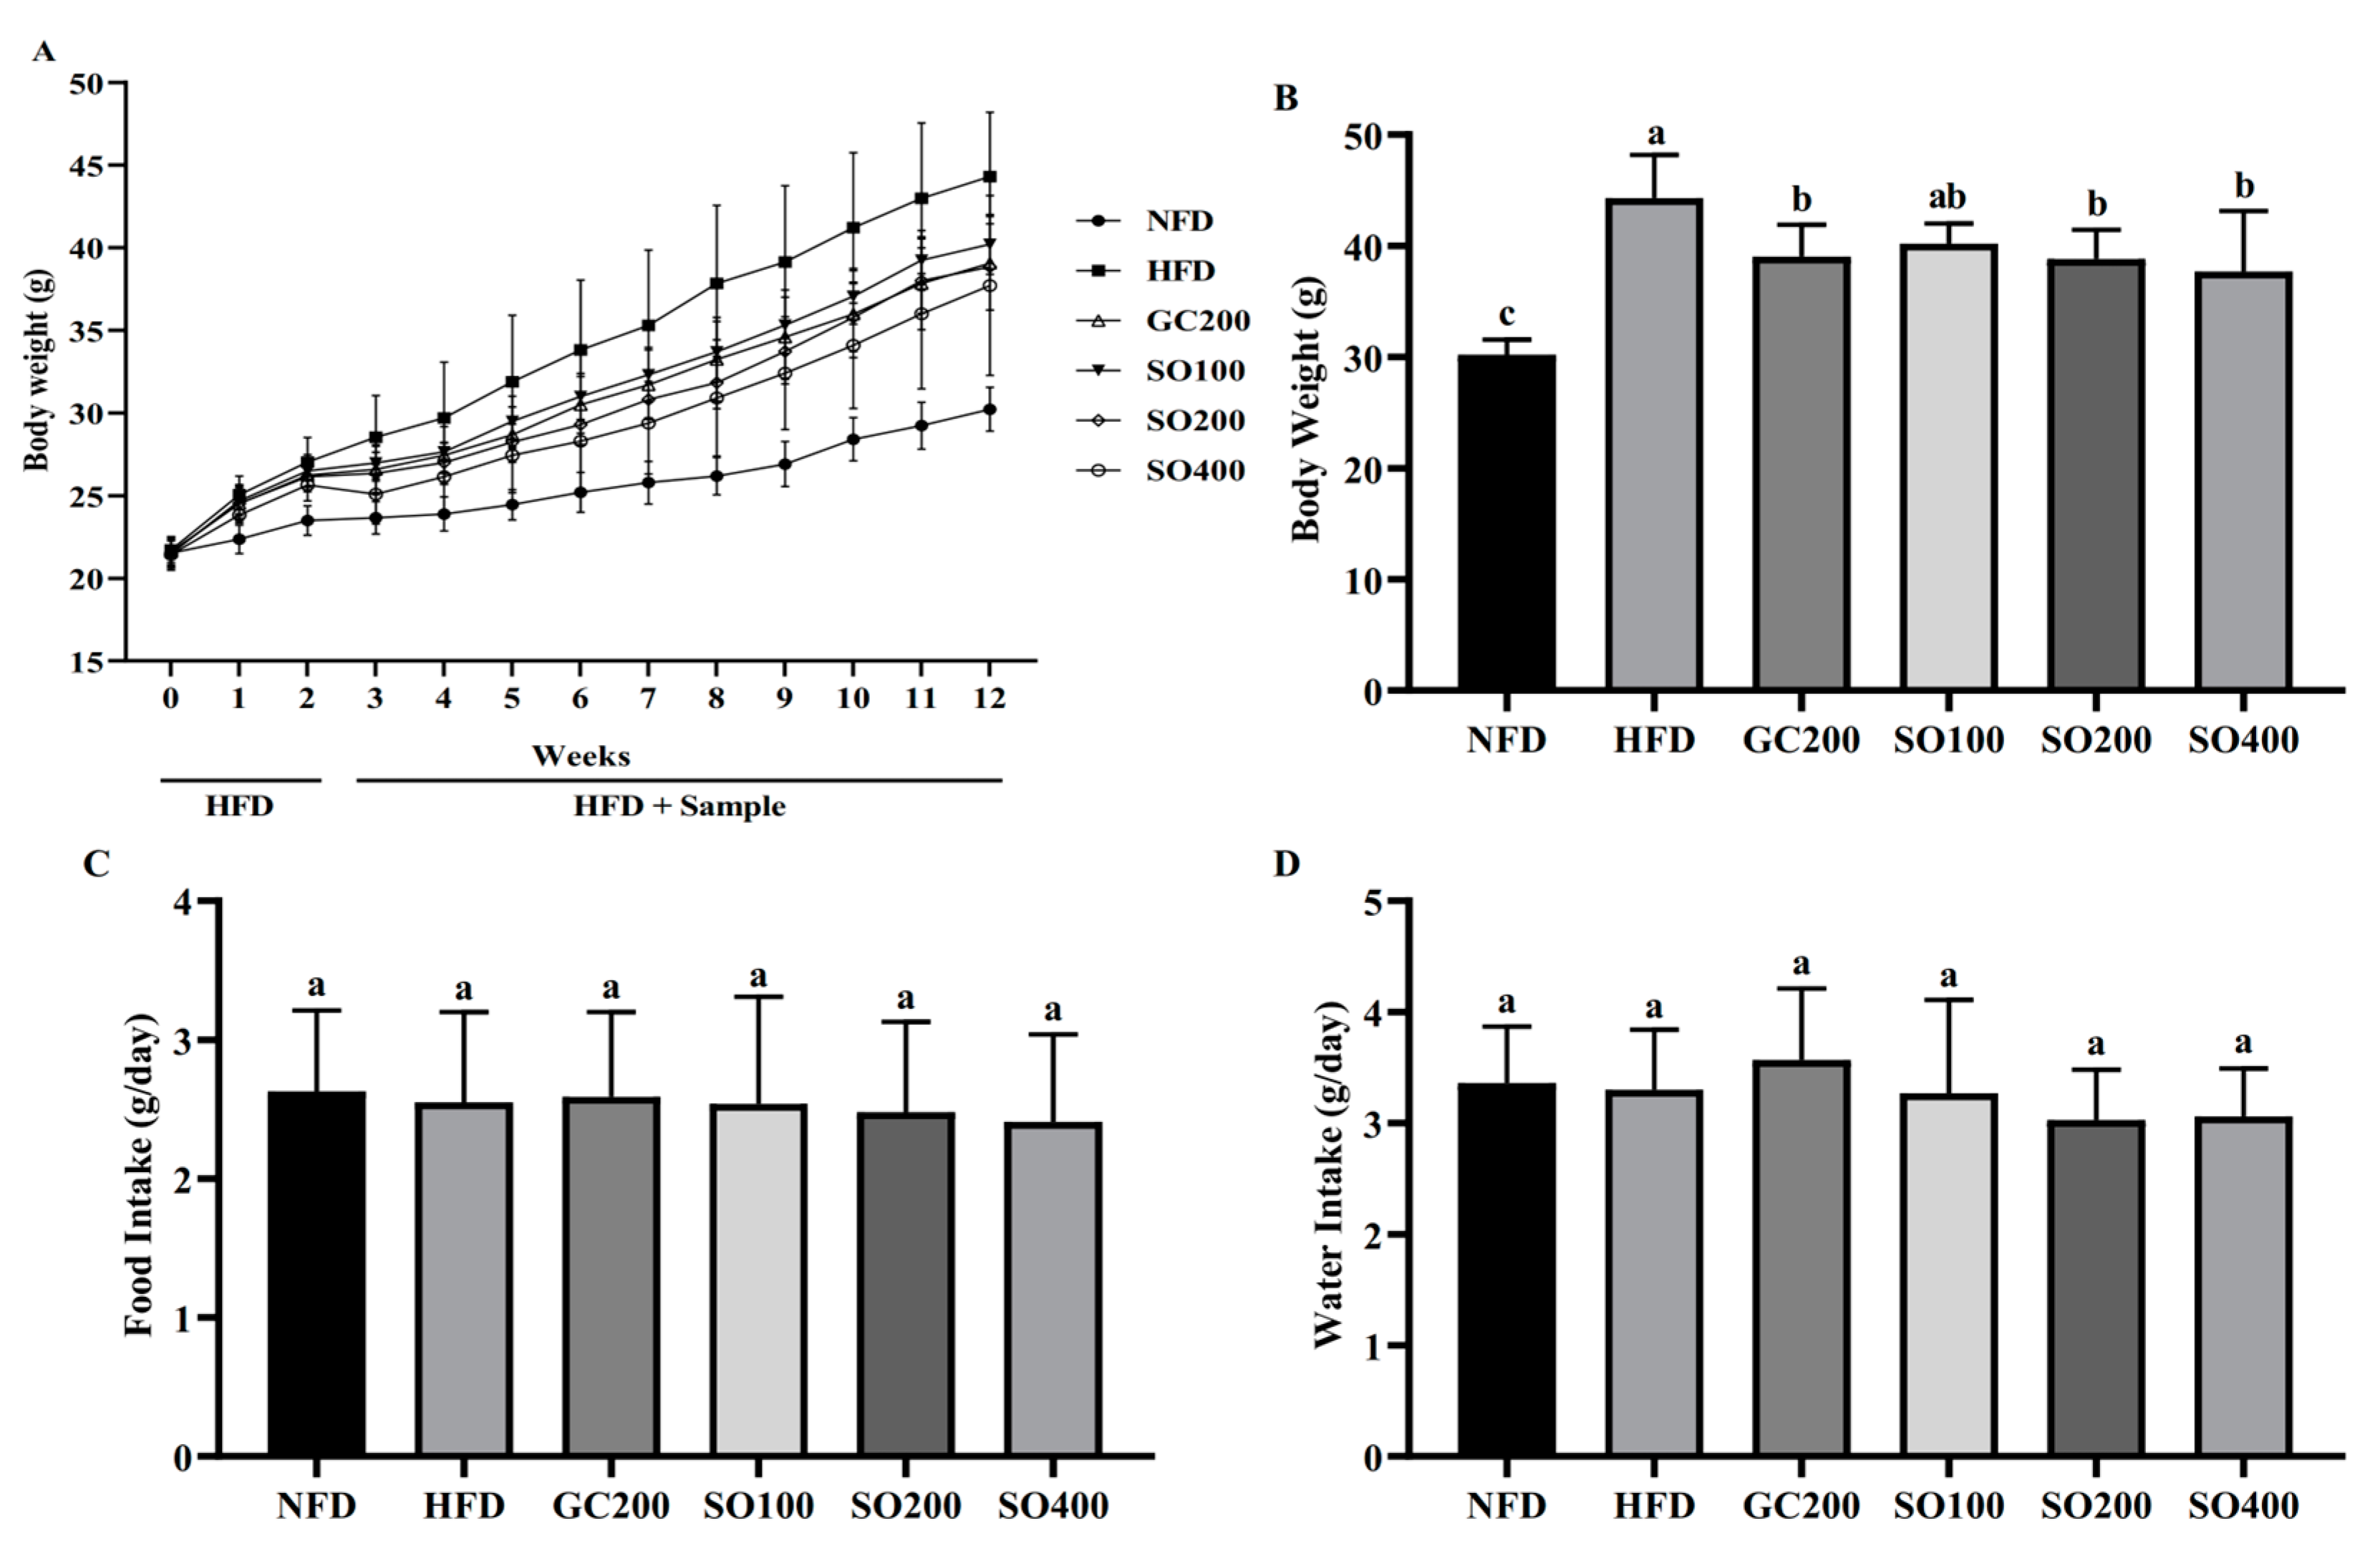
3.4. SO Attenuates Body Weight Gain in HFD-Induced Obese Mice without Affecting Appetite
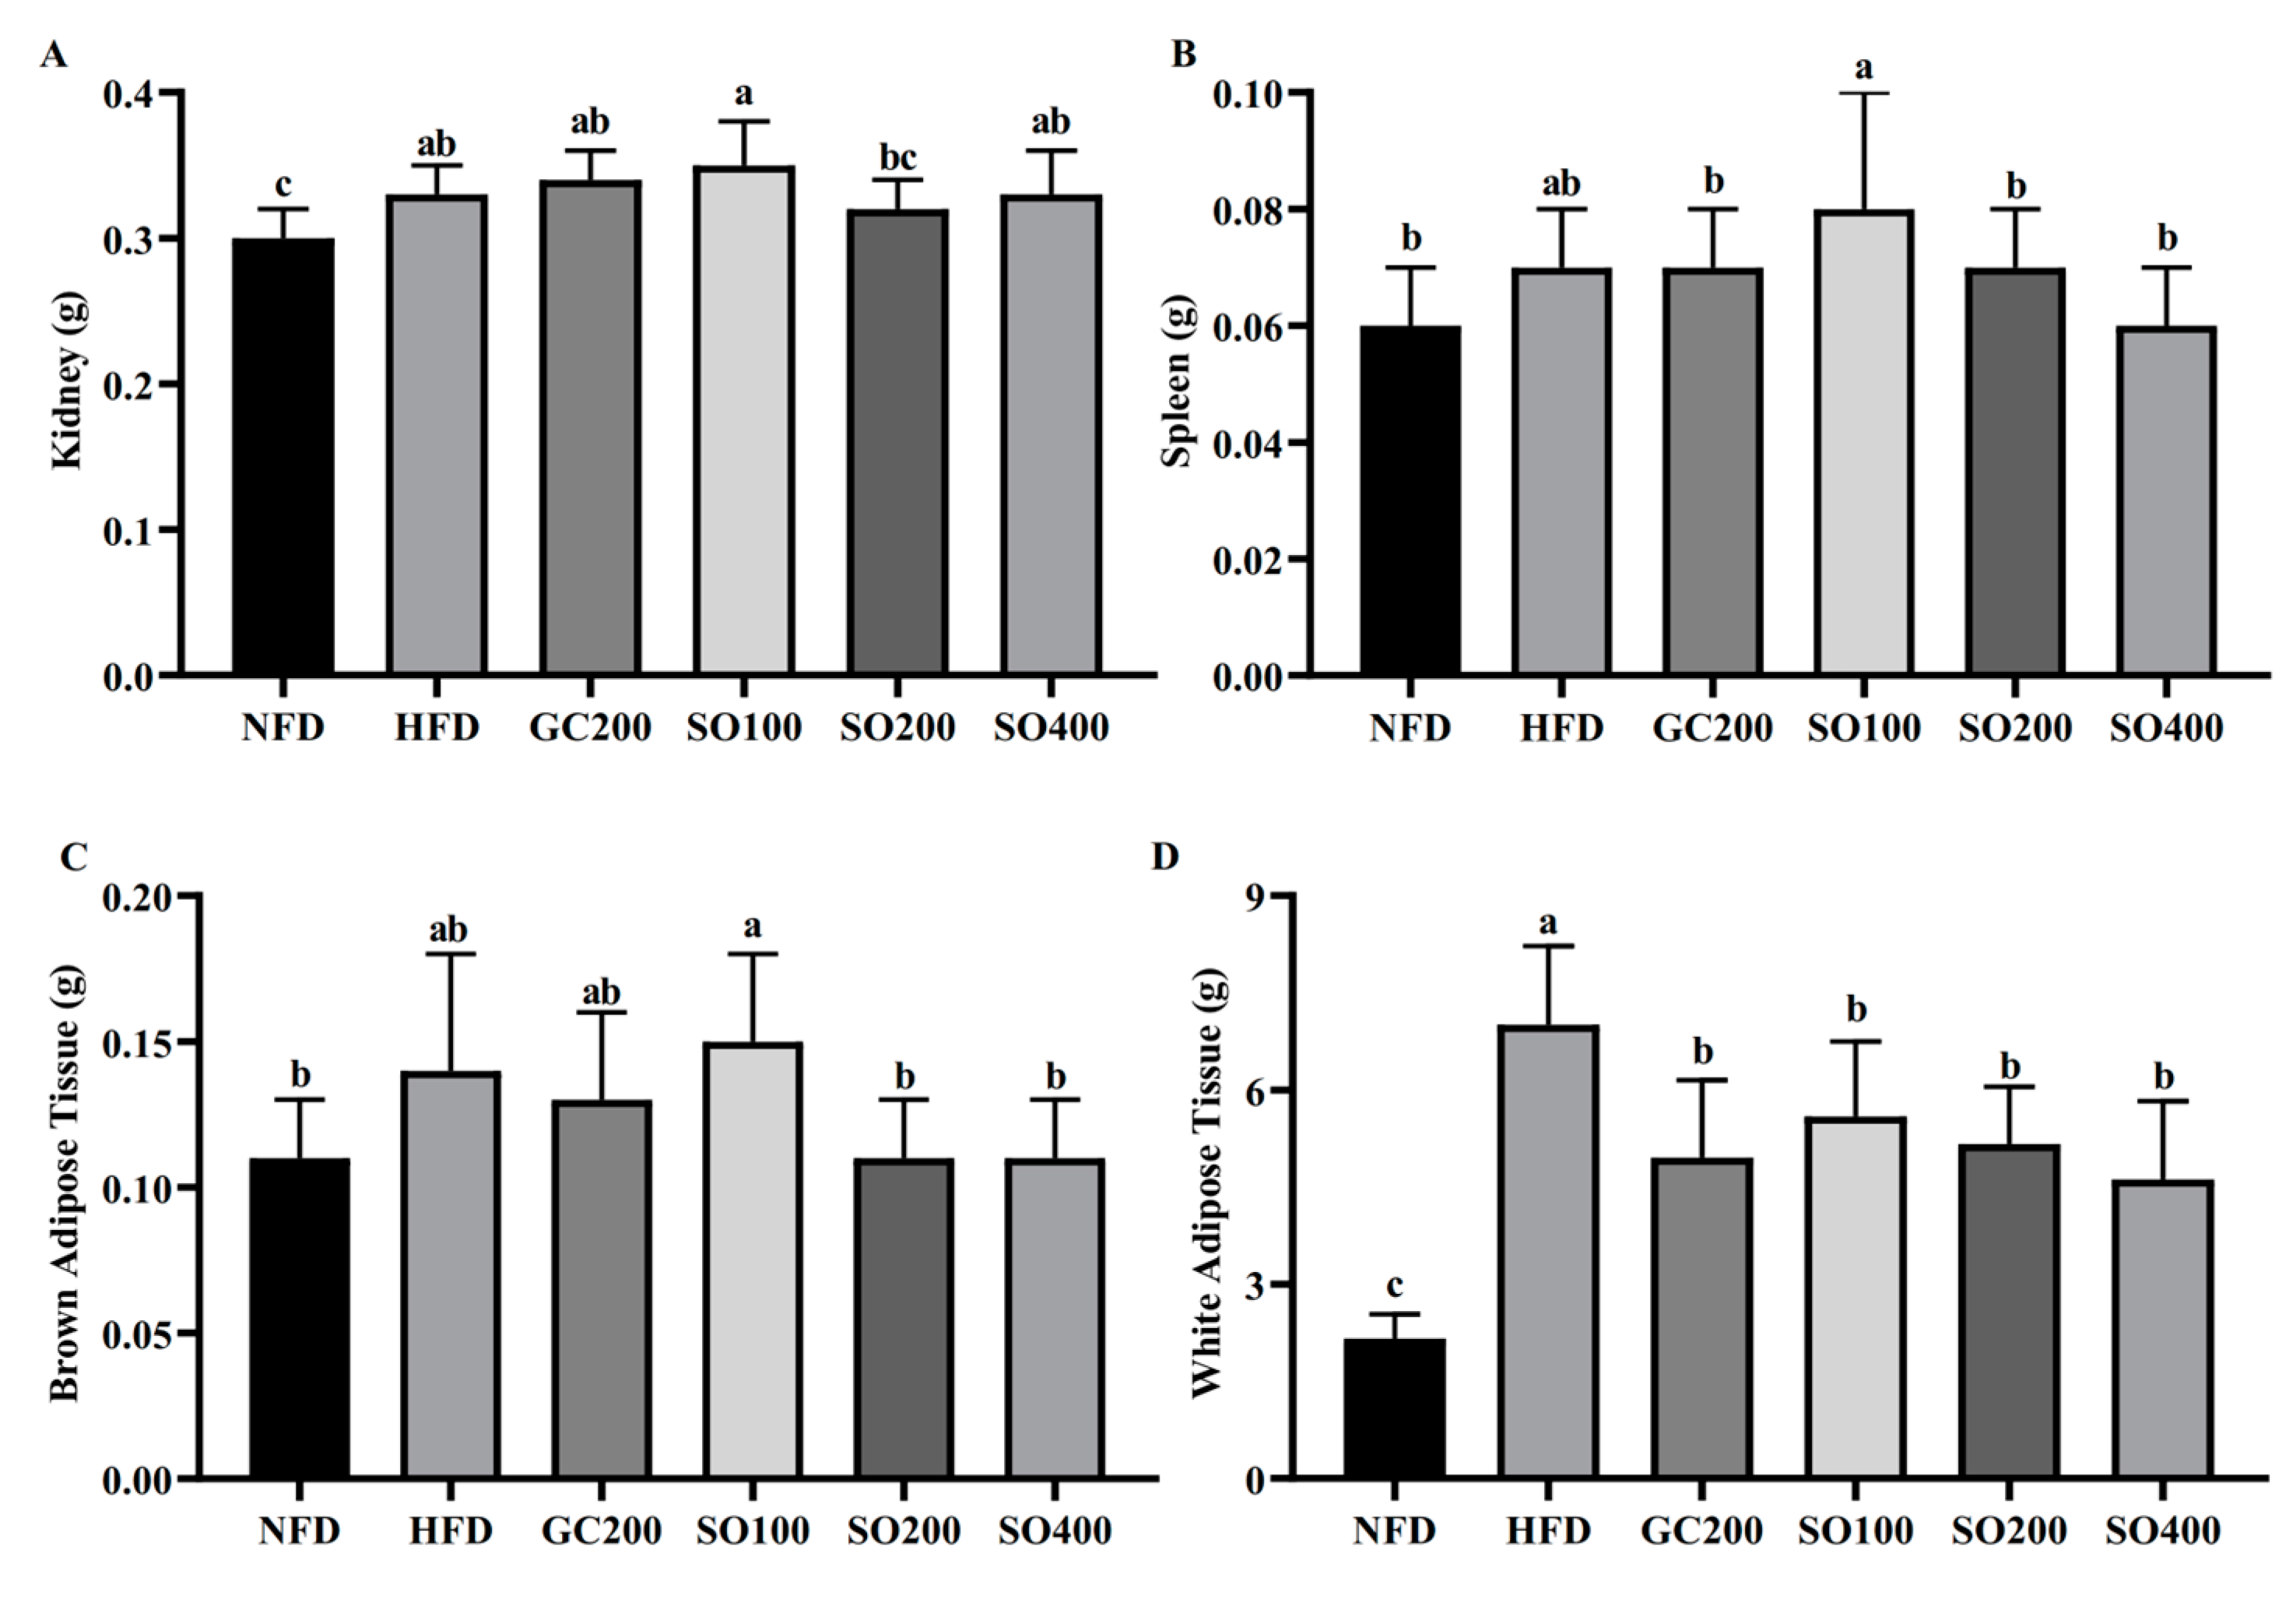
3.5. SO Reduces Adipose Tissue Weight in HFD-Induced Obese Mice
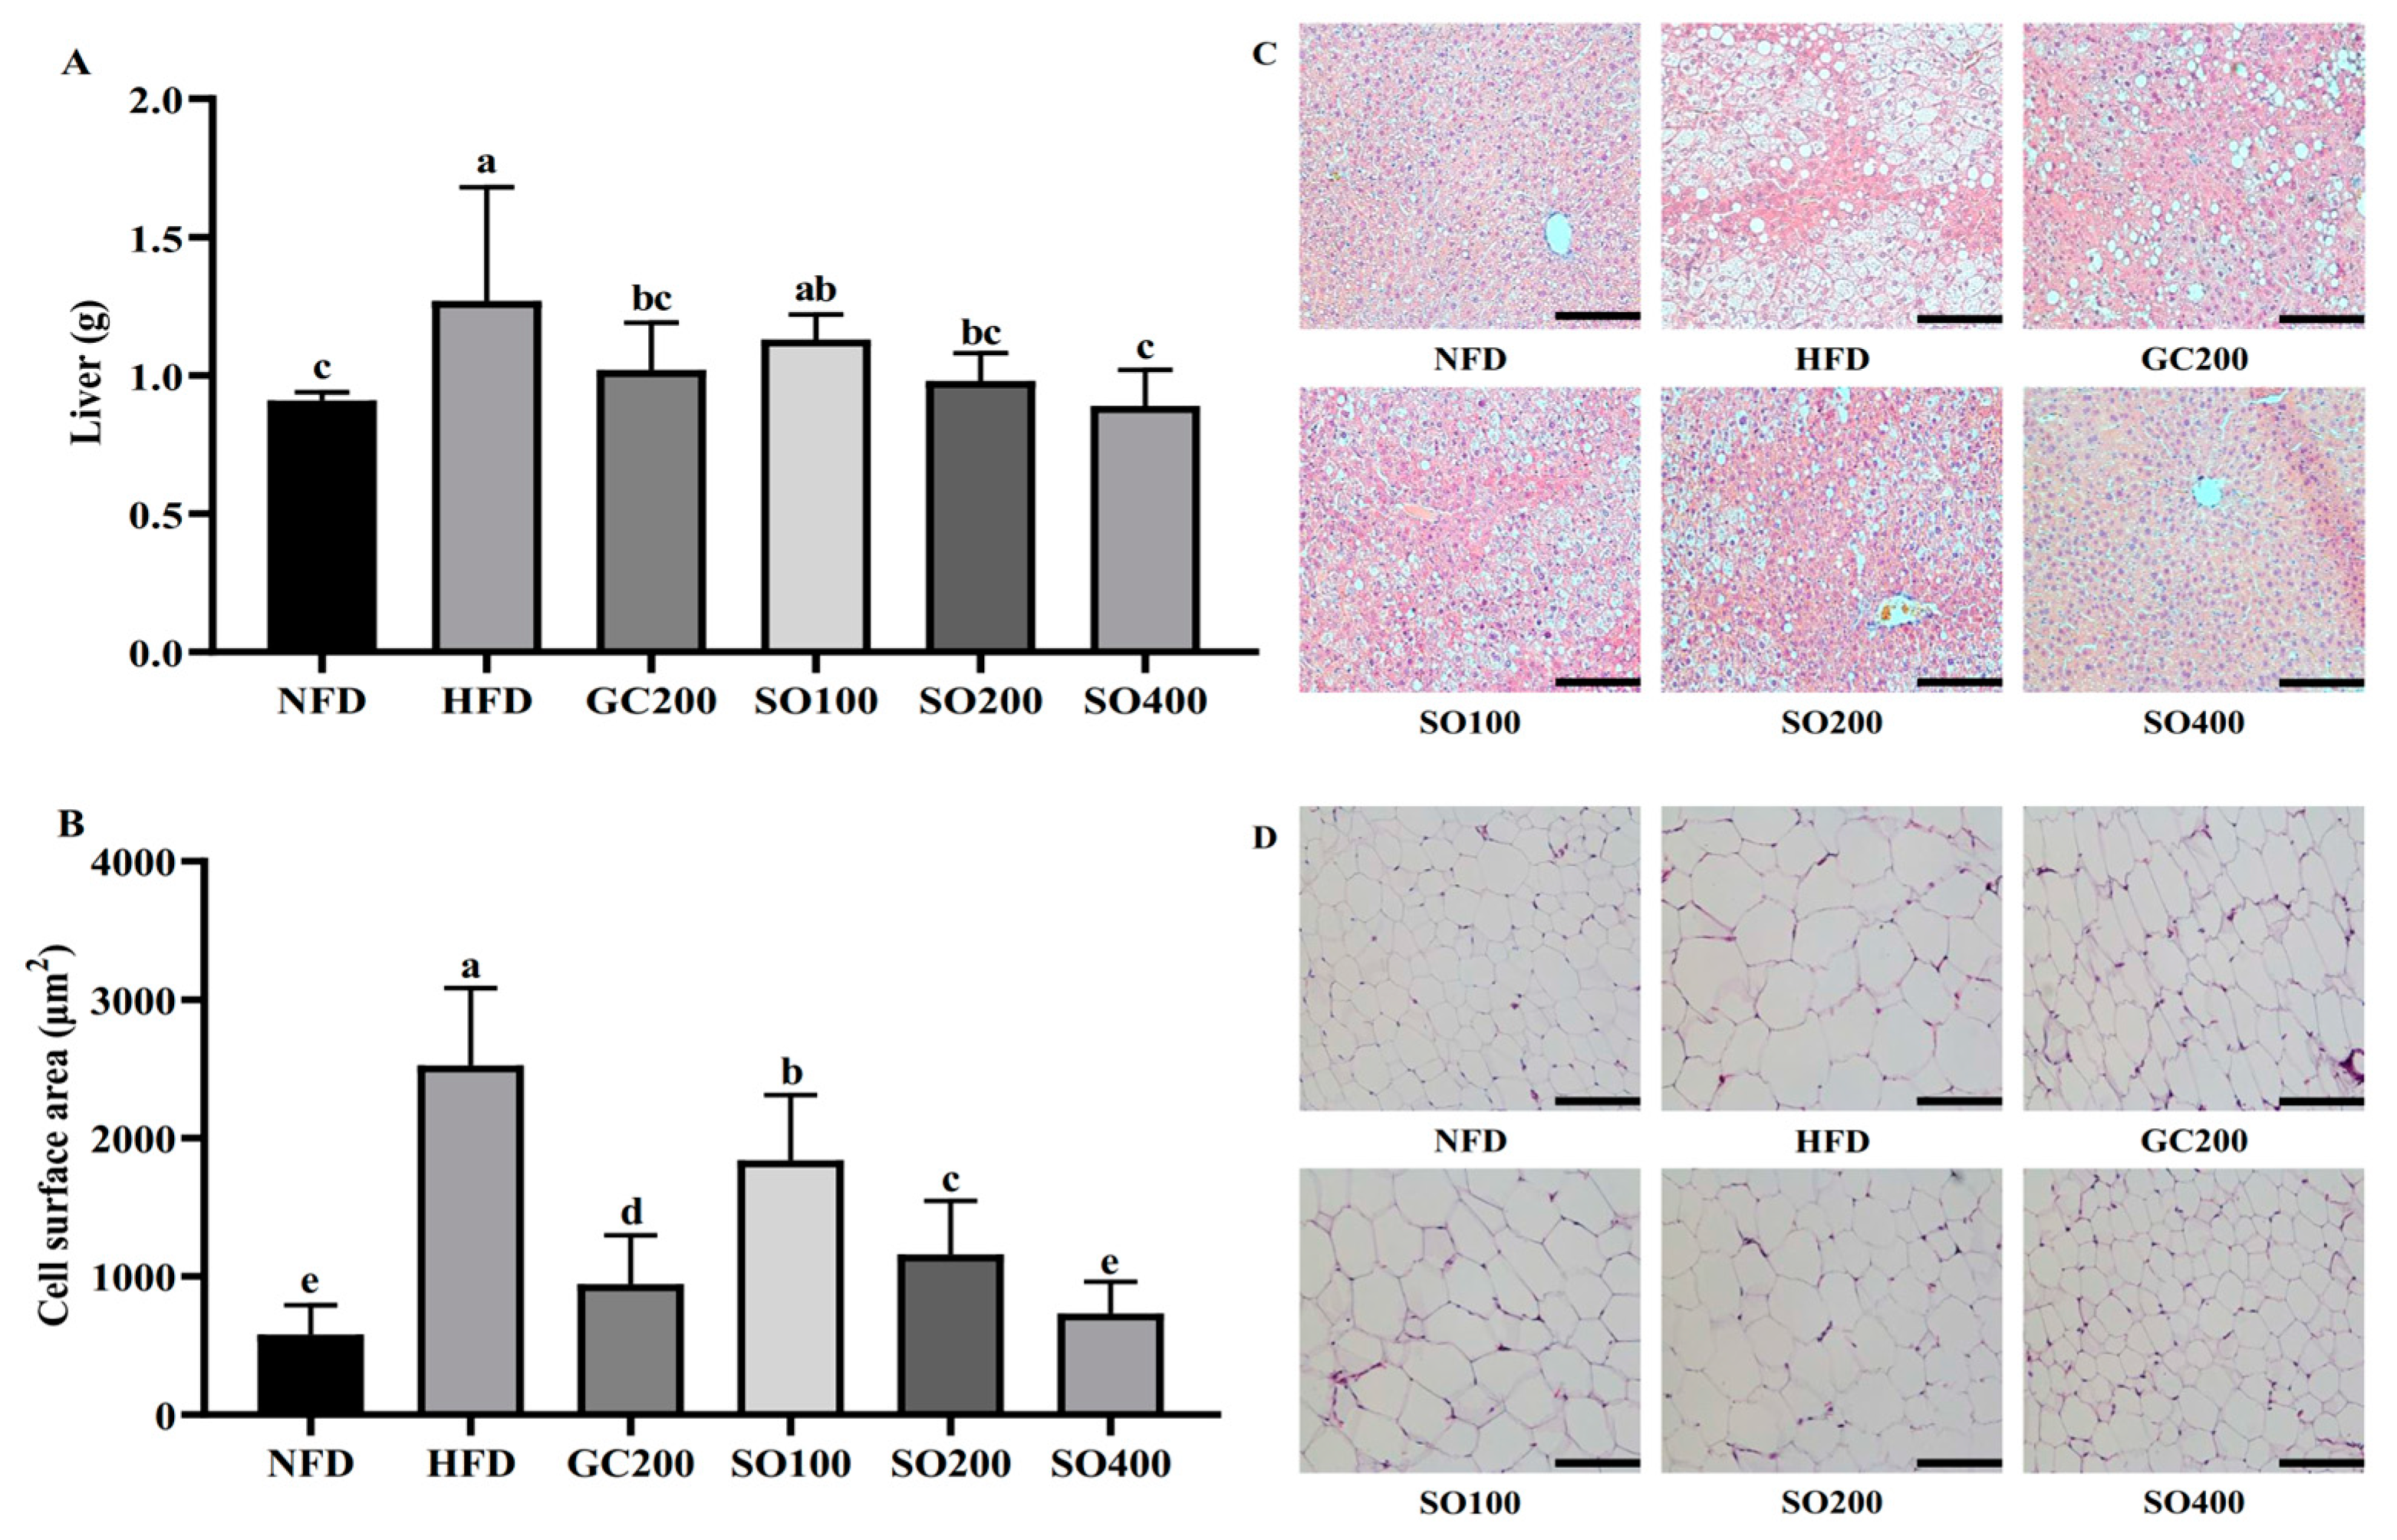
3.6. SO Ameliorates Hepatic Steatosis and Adipocyte Hypertrophy in HFD-Induced Obese Mice
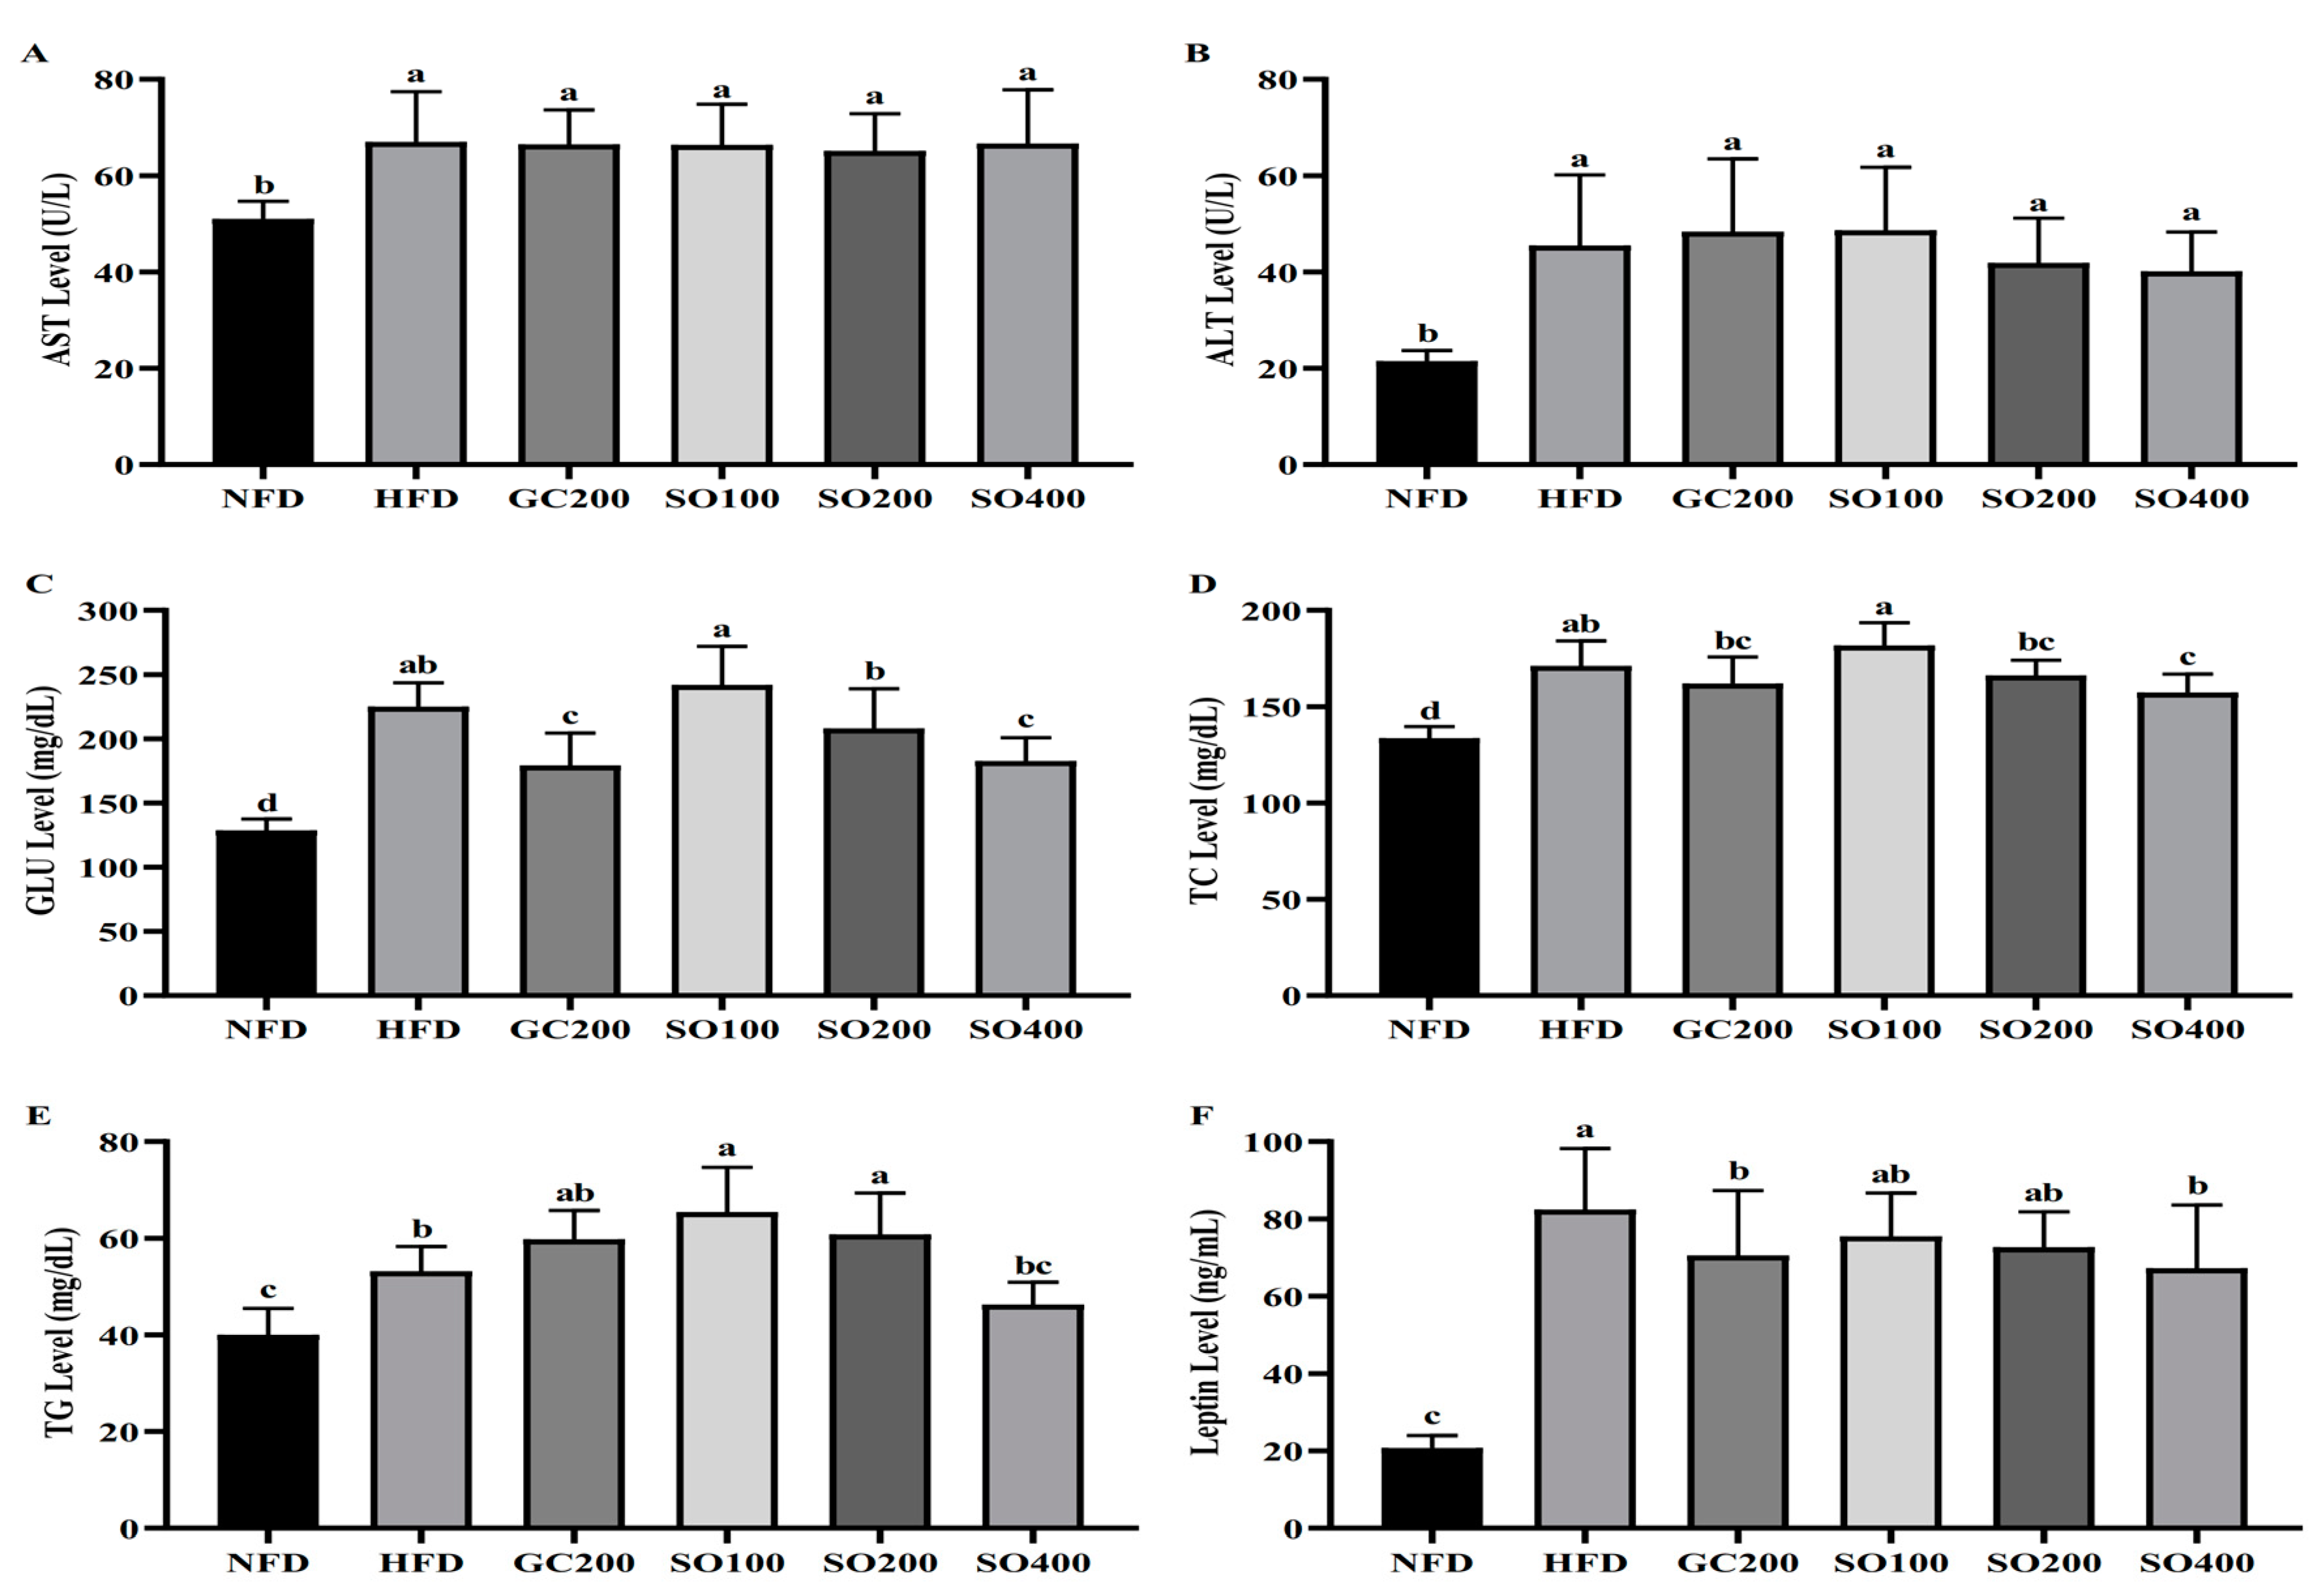
3.7. SO Improves Serum Biochemical Parameters in HFD-Induced Obese Mice
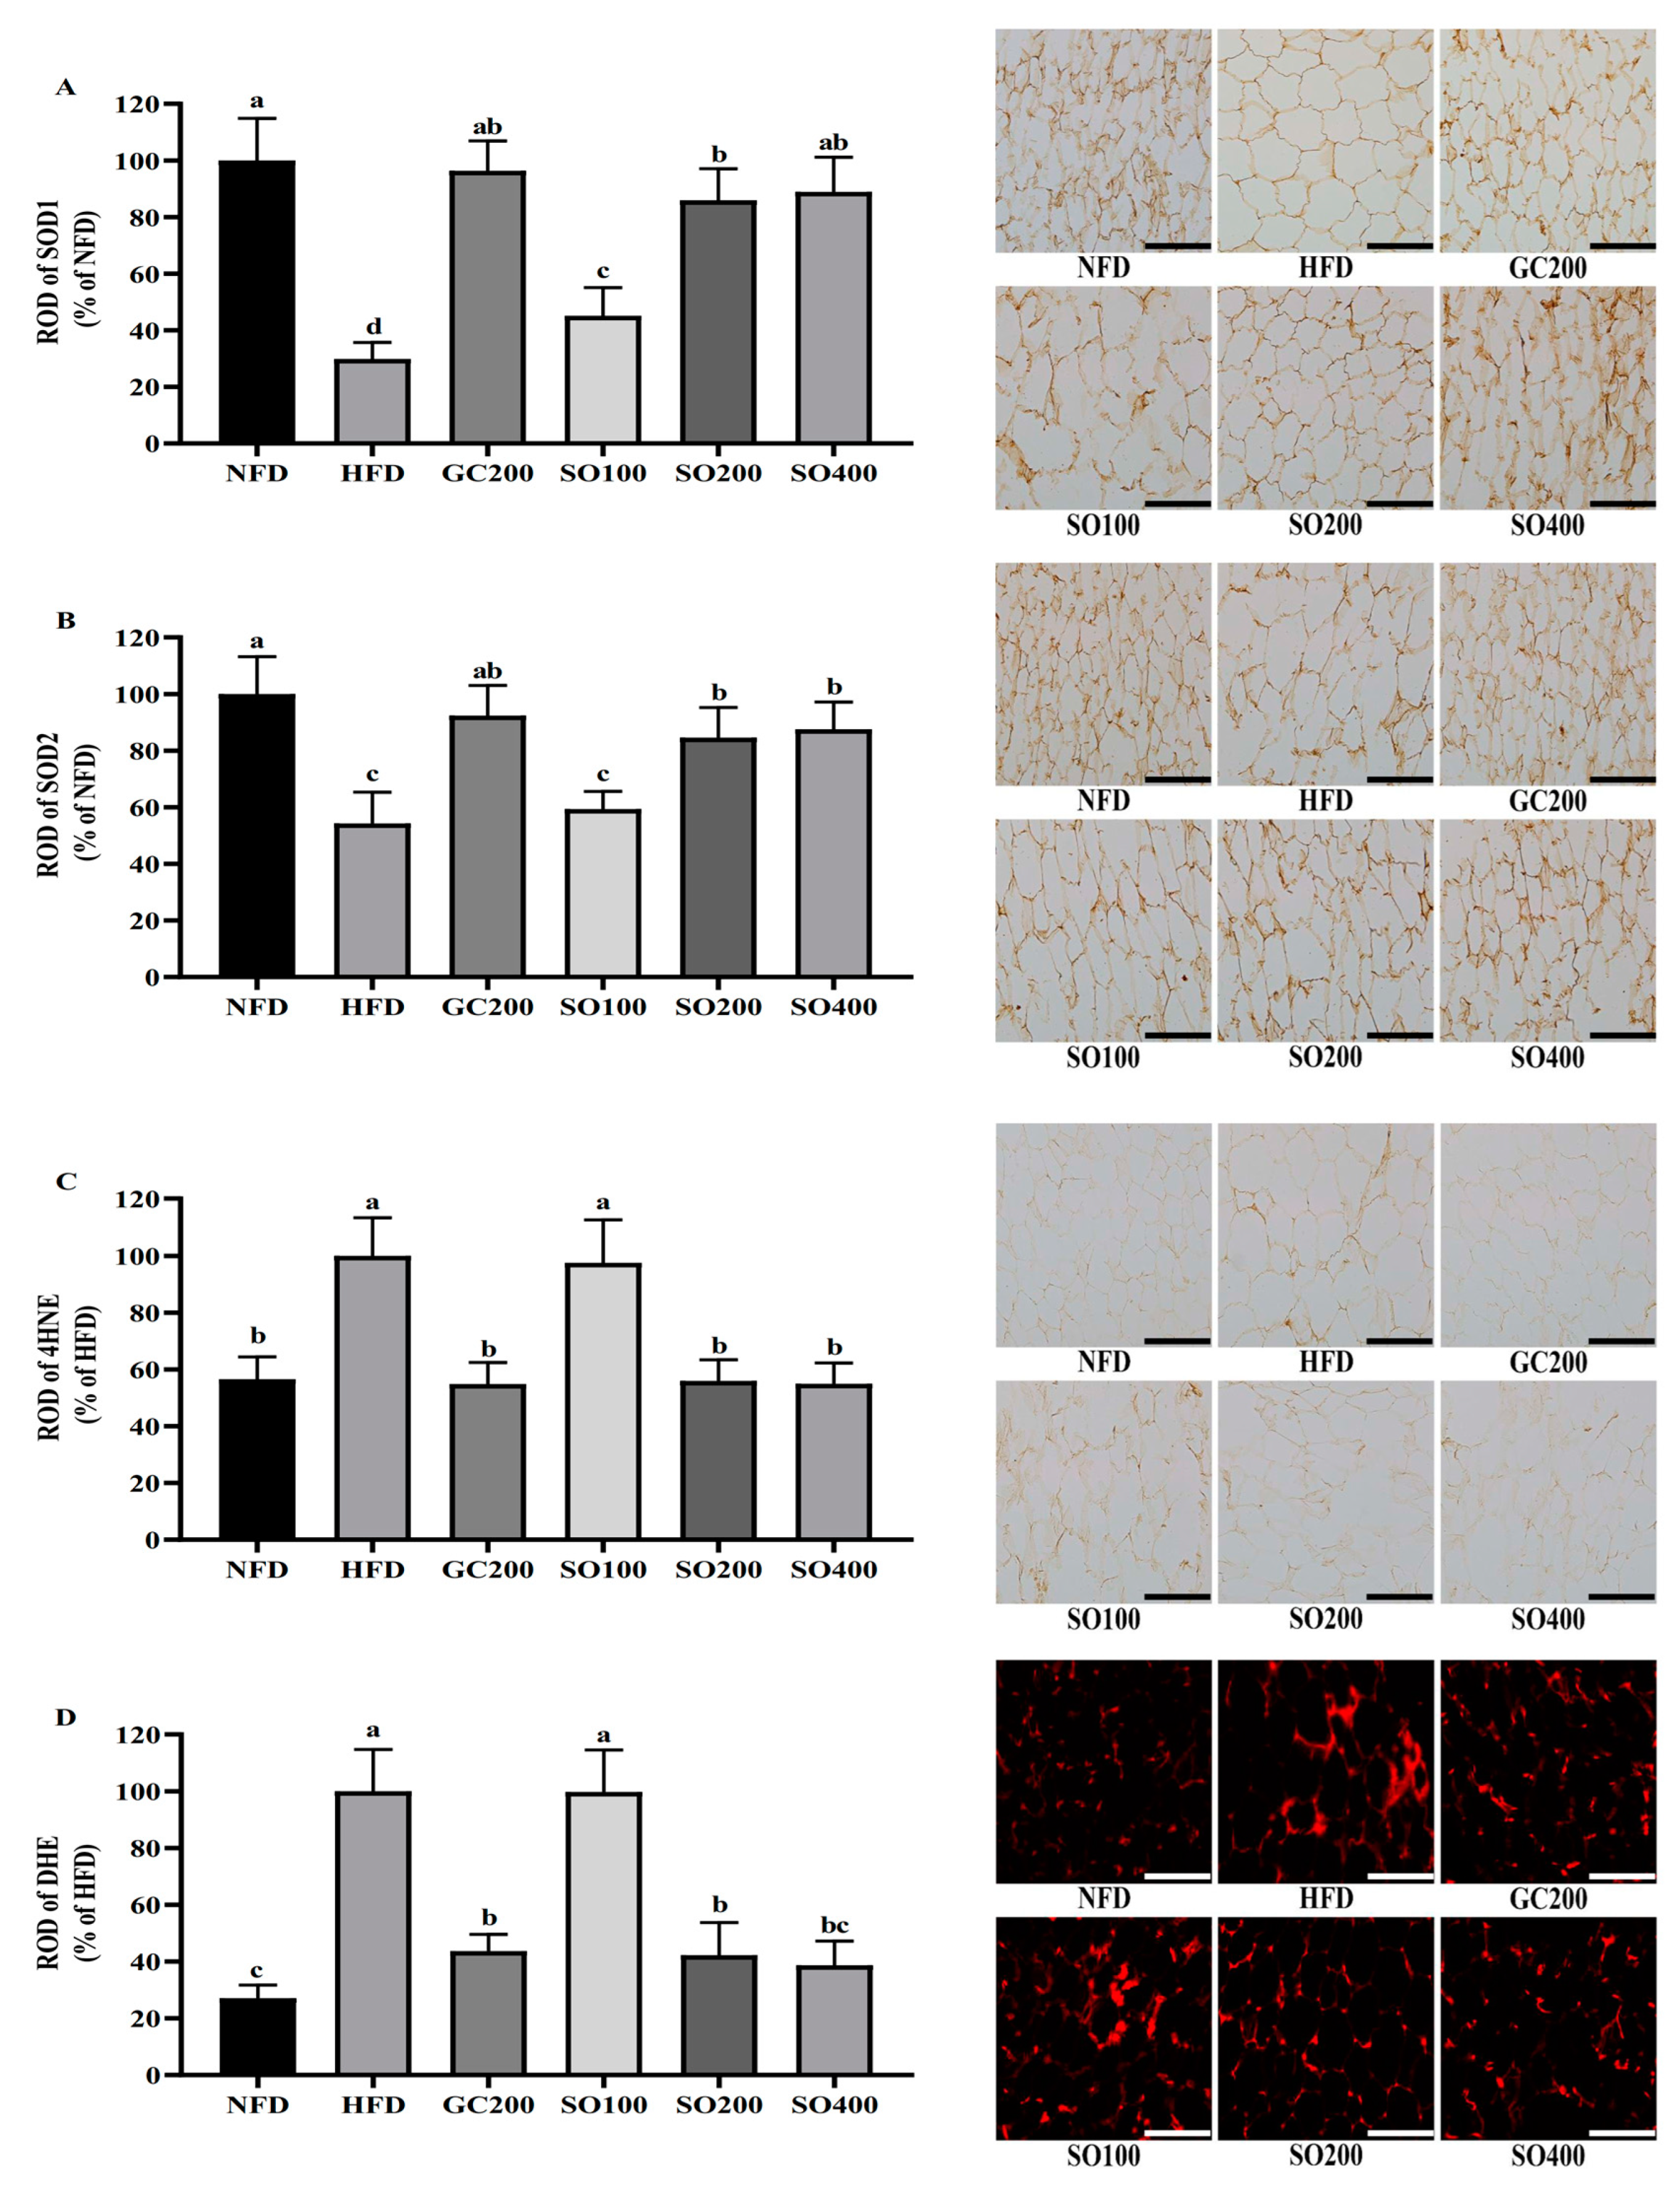
3.8. SO Increases WAT Antioxidant Enzyme Expression and Decreases Oxidative Stress in HFD-Induced Obese Mice
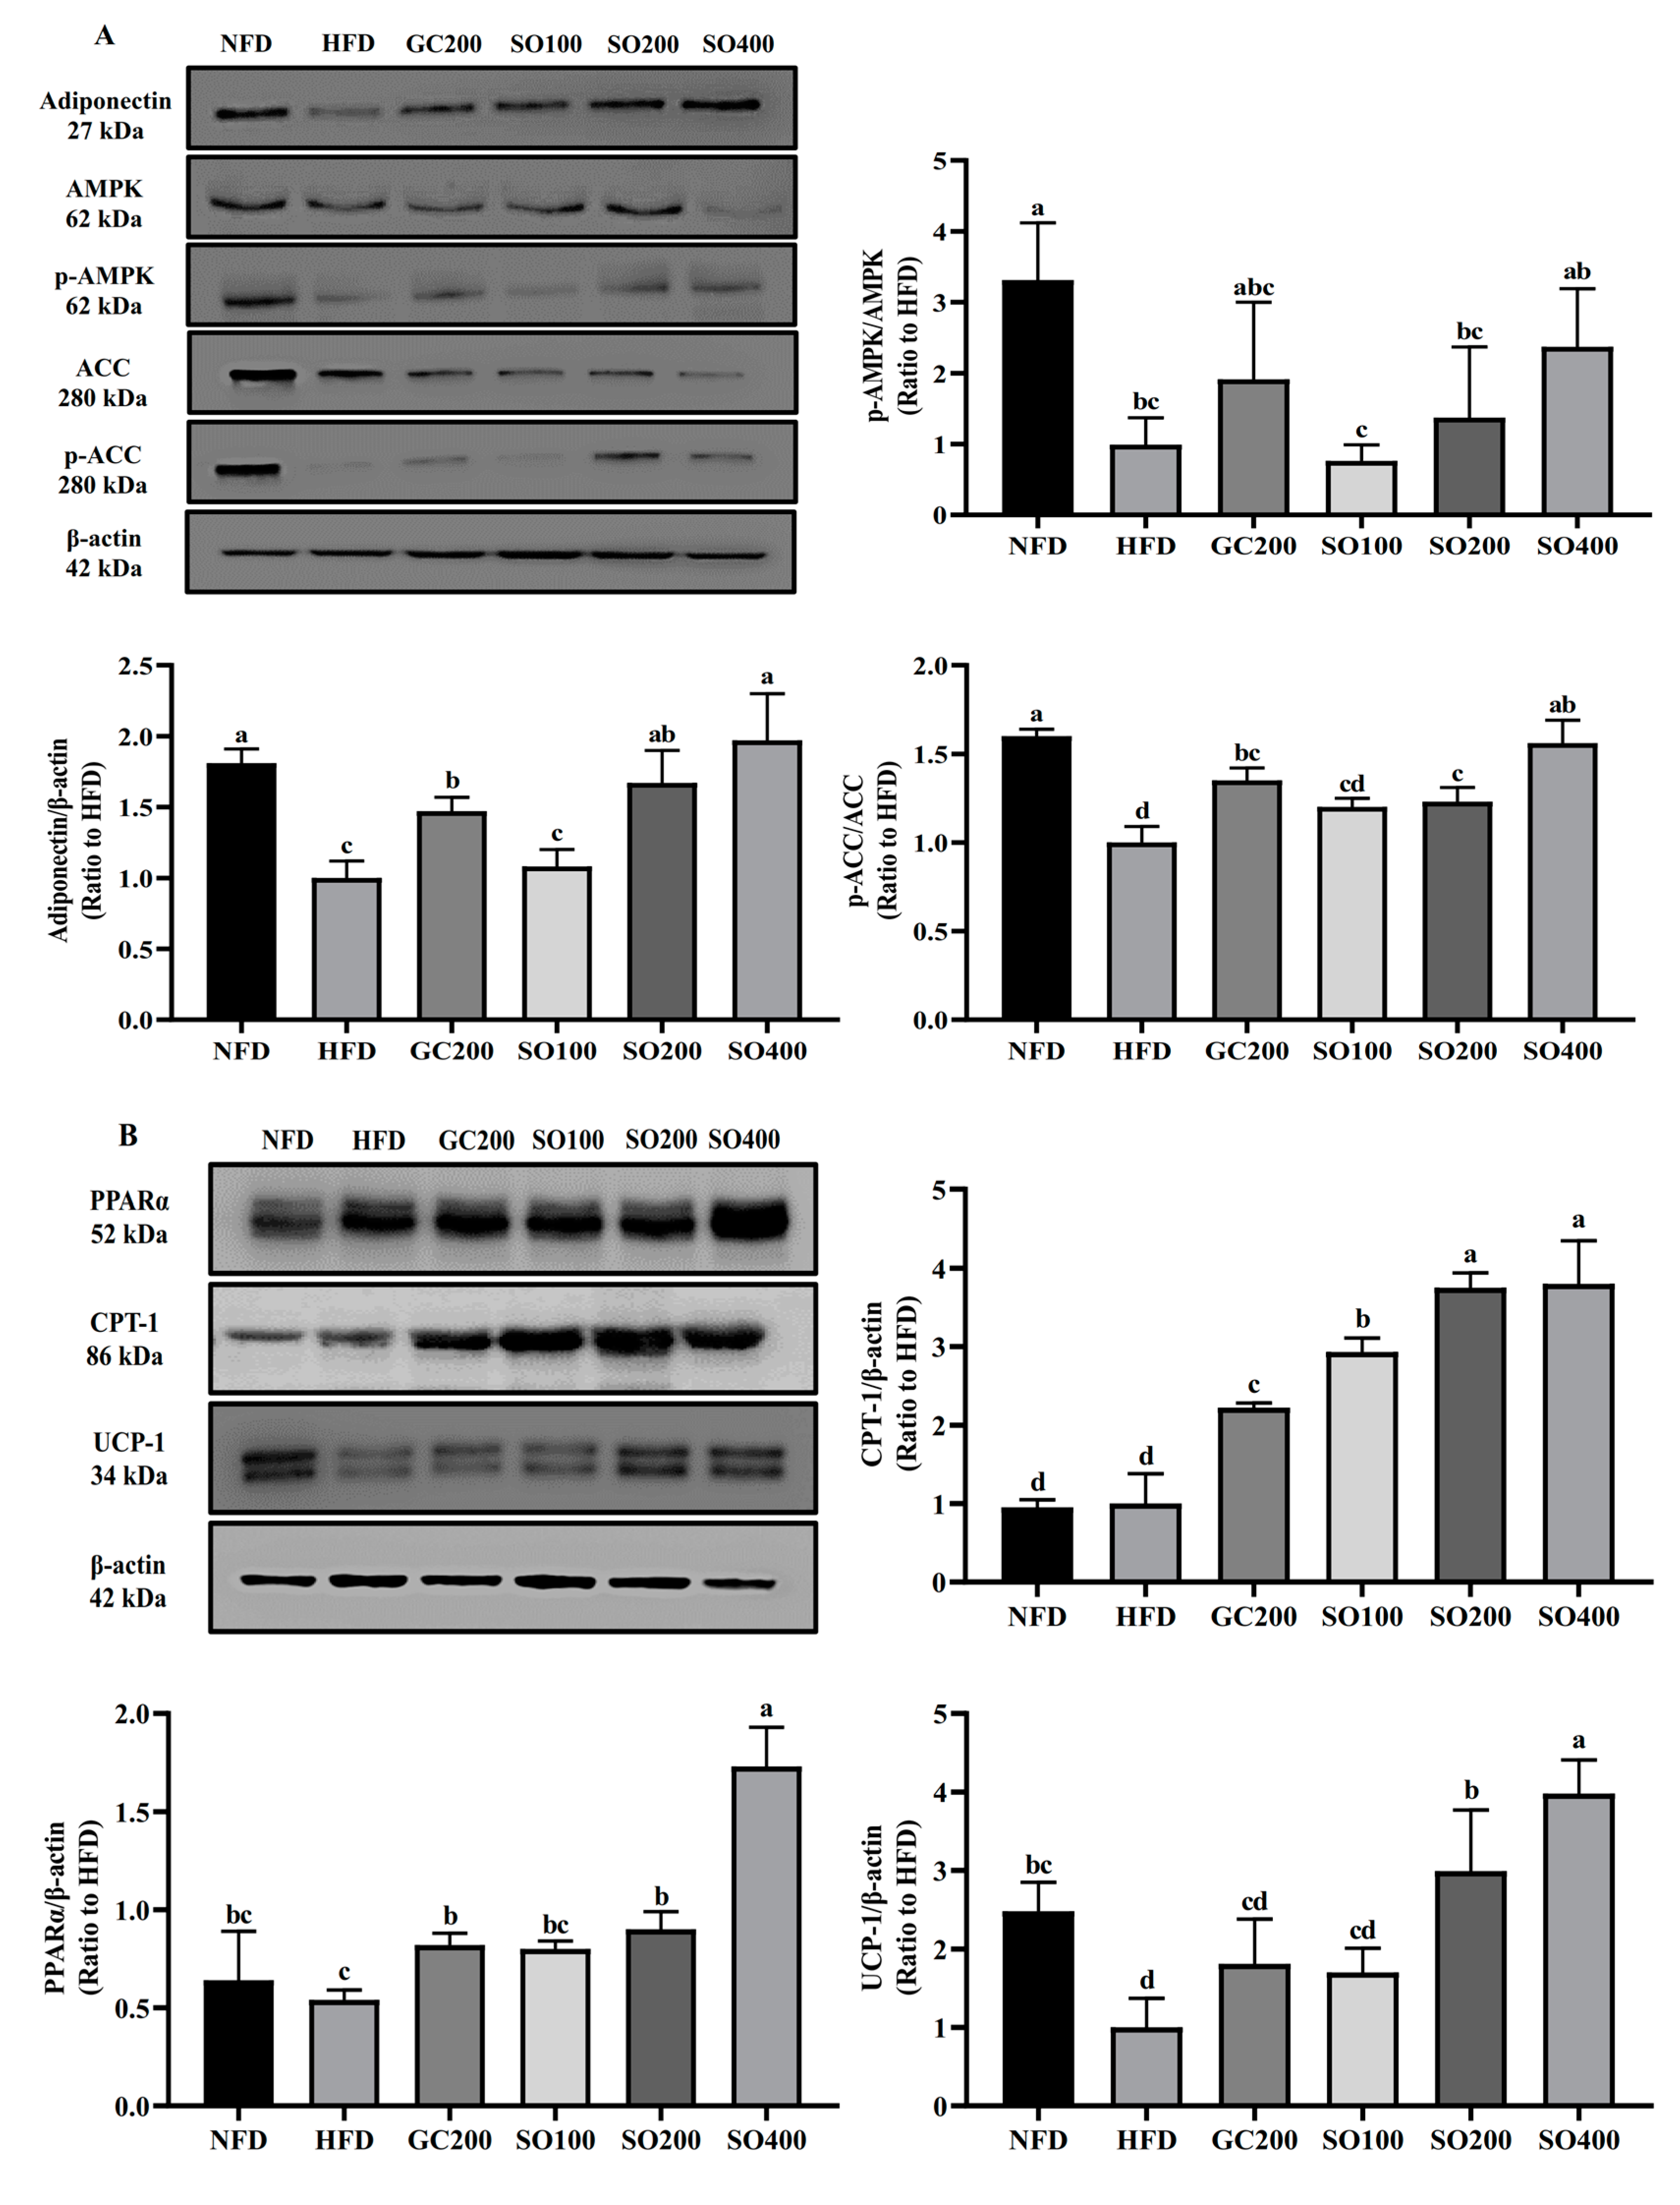
3.9. SO Improves WAT Energy Metabolism and Promotes Thermogenesis in HFD-Induced Obese Mice
4. Discussion
5. Conclusions
Author Contributions
Funding
Institutional Review Board Statement
Informed Consent Statement
Data Availability Statement
Conflicts of Interest
References
- Alharbi, K.K.; Alshammary, A.F.; Aljabri, O.S.; Ali Khan, I. Relationship between serum amyloid A1 (SAA1) gene polymorphisms studies with obesity in the Saudi population. Diabetes Metab. Syndr. Obes. 2021, 14, 895–900. [Google Scholar] [CrossRef] [PubMed]
- Grundy, S.M. Metabolic syndrome update. Trends Cardiovasc. Med. 2016, 26, 364–373. [Google Scholar] [CrossRef] [PubMed]
- Pogodziński, D.; Ostrowska, L.; Smarkusz-Zarzecka, J.; Zyśk, B. Secretome of adipose tissue as the key to understanding the endocrine function of adipose tissue. Int. J. Mol. Sci. 2022, 23, 2309. [Google Scholar] [CrossRef] [PubMed]
- Sethi, J.K.; Vidal-Puig, A.J. Thematic review series: Adipocyte biology. Adipose tissue function and plasticity orchestrate nutritional adaptation. J. Lipid Res. 2007, 48, 1253–1262. [Google Scholar] [CrossRef] [Green Version]
- Lee, Y.-H.; Mottillo, E.P.; Granneman, J.G. Adipose tissue plasticity from WAT to BAT and in between. Biochim. Biophys. Acta Bioenergy 2014, 1842, 358–369. [Google Scholar] [CrossRef] [Green Version]
- Li, Y.; Li, Z.; Ngandiri, D.A.; Llerins Perez, M.; Wolf, A.; Wang, Y. The molecular brakes of adipose tissue lipolysis. Front. Physiol. 2022, 13, 67. [Google Scholar] [CrossRef]
- Zoico, E.; Rubele, S.; De Caro, A.; Nori, N.; Mazzali, G.; Fantin, F.; Rossi, A.; Zamboni, M. Brown and beige adipose tissue and aging. Front. Endocrinol. 2019, 10, 368. [Google Scholar] [CrossRef] [Green Version]
- Cheng, L.; Wang, J.; Dai, H.; Duan, Y.; An, Y.; Shi, L.; Lv, Y.; Li, H.; Wang, C.; Ma, Q. Brown and beige adipose tissue: A novel therapeutic strategy for obesity and type 2 diabetes mellitus. Adipocyte 2021, 10, 48–65. [Google Scholar] [CrossRef]
- Ahmad, B.; Vohra, M.S.; Saleemi, M.A.; Serpell, C.J.; Fong, I.L.; Wong, E.H. Brown/Beige adipose tissues and the emerging role of their secretory factors in improving metabolic health: The batokines. Biochimie 2021, 184, 26–39. [Google Scholar] [CrossRef]
- Furukawa, S.; Fujita, T.; Shimabukuro, M.; Iwaki, M.; Yamada, Y.; Nakajima, Y.; Nakayama, O.; Makishima, M.; Matsuda, M.; Shimomura, I. Increased oxidative stress in obesity and its impact on metabolic syndrome. J. Clin. Investig. 2017, 114, 1752–1761. [Google Scholar] [CrossRef]
- Roberts, C.K.; Sindhu, K.K. Oxidative stress and metabolic syndrome. Life Sci. 2009, 84, 705–712. [Google Scholar] [CrossRef] [PubMed]
- Tirosh, A.; Potashnik, R.; Bashan, N.; Rudich, A. Oxidative stress disrupts insulin-induced cellular redistribution of insulin receptor substrate-1 and phosphatidylinositol 3-kinase in 3T3-L1 adipocytes: A putative cellular mechanism for impaired protein kinase B activation and GLUT4 translocation. J. Biol. Chem. 1999, 274, 10595–10602. [Google Scholar] [CrossRef] [Green Version]
- de Mello, A.H.; Costa, A.B.; Engel, J.D.G.; Rezin, G.T. Mitochondrial dysfunction in obesity. Life Sci. 2018, 192, 26–32. [Google Scholar] [CrossRef]
- Taherkhani, S.; Suzuki, K.; Ruhee, R.T. A brief overview of oxidative stress in adipose tissue with a therapeutic approach to taking antioxidant supplements. Antioxidants 2021, 10, 594. [Google Scholar] [CrossRef]
- Peng, C.-H.; Lin, H.-T.; Chung, D.-J.; Huang, C.-N.; Wang, C.-J. Mulberry Leaf Extracts prevent obesity-induced NAFLD with regulating adipocytokines, inflammation and oxidative stress. J. Food Drug Anal. 2018, 26, 778–787. [Google Scholar] [CrossRef] [PubMed]
- Han, J.Y.; Lee, S.; Yang, J.H.; Kim, S.; Sim, J.; Kim, M.G.; Jeong, T.C.; Ku, S.K.; Cho, I.J.; Ki, S.H. Korean Red Ginseng attenuates ethanol-induced steatosis and oxidative stress via AMPK/Sirt1 activation. J. Ginseng Res. 2015, 39, 105–115. [Google Scholar] [CrossRef] [Green Version]
- Byun, N.-Y.; Cho, J.-H.; Yim, S.-H. Correlation between antioxidant activity and anti-wrinkle effect of ethanol extracts of Sanguisorba Officinalis L. Food Sci. Technol. 2021, 41, 791–798. [Google Scholar] [CrossRef]
- Zhang, S.; Liu, X.; Zhang, Z.-L.; He, L.; Wang, Z.; Wang, G.-S. Isolation and identification of the phenolic compounds from the roots of Sanguisorba officinalis L. and their antioxidant activities. Molecules 2012, 17, 13917–13922. [Google Scholar] [CrossRef] [Green Version]
- Yu, T.; Lee, Y.J.; Yang, H.M.; Han, S.; Kim, J.H.; Lee, Y.; Kim, C.; Han, M.H.; Kim, M.-Y.; Lee, J. Inhibitory effect of Sanguisorba officinalis ethanol extract on NO and PGE2 production is mediated by suppression of NF-κB and AP-1 activation signaling cascade. J. Ethnopharmacol. 2011, 134, 11–17. [Google Scholar] [CrossRef]
- Ginovyan, M.; Ayvazyan, A.; Nikoyan, A.; Tumanyan, L.; Trchounian, A. Phytochemical screening and detection of antibacterial components from crude extracts of some Armenian herbs using TLC-bioautographic technique. Curr. Microbiol. 2020, 77, 1223–1232. [Google Scholar] [CrossRef]
- Choi, E.-S.; Kim, J.-S.; Kwon, K.-H.; Kim, H.-S.; Cho, N.-P.; Cho, S.-D. Methanol extract of Sanguisorba officinalis L. with cytotoxic activity against PC3 human prostate cancer cells. Mol. Med. Rep. 2012, 6, 670–674. [Google Scholar] [CrossRef] [PubMed] [Green Version]
- Kuang, H.-X.; Li, H.-W.; Wang, Q.-H.; Yang, B.-Y.; Wang, Z.-B.; Xia, Y.-G. Triterpenoids from the roots of Sanguisorba tenuifolia var. alba. Molecules 2011, 16, 4642–4651. [Google Scholar] [CrossRef] [PubMed] [Green Version]
- Gawron-Gzella, A.; Witkowska-Banaszczak, E.; Bylka, W.; Dudek-Makuch, M.; Odwrot, A.; Skrodzka, N. Chemical composition, antioxidant and antimicrobial activities of Sanguisorba officinalis L. extracts. Pharm. Chem. J. 2016, 50, 244–249. [Google Scholar] [CrossRef]
- Sethi, A. A review on “Garcinia cambogia-a weight controlling agent”. Int. J. Pharm. Res. Dev. 2011, 3, 13–24. [Google Scholar]
- Zheng, Y.; Lee, J.; Shin, K.-O.; Park, K.; Kang, I.-J. Synergistic action of Erigeron annuus L. Pers and Borago officinalis L. enhances anti-obesity activity in a mouse model of diet-induced obesity. Nutr. Res. 2019, 69, 58–66. [Google Scholar] [CrossRef]
- Zheng, Y.; Choi, Y.-H.; Lee, J.-H.; Lee, S.-Y.; Kang, I.-J. Anti-Obesity Effect of Erigeron annuus (L.) Pers. Extract Containing Phenolic Acids. Foods 2021, 10, 1266. [Google Scholar] [CrossRef]
- Lee, T.-K.; Kang, I.-J.; Kim, B.; Sim, H.J.; Kim, D.-W.; Ahn, J.H.; Lee, J.-C.; Ryoo, S.; Shin, M.C.; Cho, J.H. Experimental pretreatment with chlorogenic acid prevents transient ischemia-induced cognitive decline and neuronal damage in the hippocampus through anti-oxidative and anti-inflammatory effects. Molecules 2020, 25, 3578. [Google Scholar] [CrossRef]
- Al Madhoun, A.; Kochumon, S.; Al-Rashed, F.; Sindhu, S.; Thomas, R.; Miranda, L.; Al-Mulla, F.; Ahmad, R. Dectin-1 as a potential inflammatory biomarker for metabolic inflammation in adipose tissue of individuals with obesity. Cells 2022, 11, 2879. [Google Scholar] [CrossRef]
- Kim, Y.H.; Lee, T.-K.; Lee, J.-C.; Kim, D.W.; Hong, S.; Cho, J.H.; Shin, M.C.; Choi, S.Y.; Won, M.-H.; Kang, I.J. Therapeutic Administration of Oxcarbazepine Saves Cerebellar Purkinje Cells from Ischemia and Reperfusion Injury Induced by Cardiac Arrest through Attenuation of Oxidative Stress. Antioxidants 2022, 11, 2450. [Google Scholar] [CrossRef]
- Mohd-Radzman, N.H.; Ismail, W.I.W.; Jaapar, S.S.; Adam, Z.; Adam, A. Stevioside from Stevia rebaudiana Bertoni increases insulin sensitivity in 3T3-L1 adipocytes. Evid.-Based Complement. Altern. Med. 2013, 2013, 938081. [Google Scholar] [CrossRef] [Green Version]
- Im, S.H.; Wang, Z.; Lim, S.S.; Lee, O.-H.; Kang, I.-J. Bioactivity-guided isolation and identification of anti-adipogenic compounds from Sanguisorba officinalis. Pharm. Biol. 2017, 55, 2057–2064. [Google Scholar] [CrossRef] [PubMed] [Green Version]
- Zhu, H.-L.; Chen, G.; Chen, S.-N.; Wang, Q.-R.; Wan, L.; Jian, S.-P. Characterization of polyphenolic constituents from Sanguisorba officinalis L. and its antibacterial activity. Eur. Food Res. Technol. 2019, 245, 1487–1498. [Google Scholar] [CrossRef]
- Lachowicz, S.; Oszmiański, J.; Rapak, A.; Ochmian, I. Profile and content of phenolic compounds in leaves, flowers, roots, and stalks of Sanguisorba officinalis L. determined with the LC-DAD-ESI-QTOF-MS/MS analysis and their in vitro antioxidant, antidiabetic, antiproliferative potency. Pharmaceuticals 2020, 13, 191. [Google Scholar] [CrossRef] [PubMed]
- Lee, K.H.; Jeong, E.-S.; Jang, G.; Na, J.-R.; Park, S.; Kang, W.S.; Kim, E.; Choi, H.; Kim, J.S.; Kim, S. Unripe Rubus coreanus Miquel extract containing ellagic acid regulates AMPK, SREBP-2, HMGCR, and INSIG-1 signaling and cholesterol metabolism in vitro and in vivo. Nutrients 2020, 12, 610. [Google Scholar] [CrossRef] [PubMed] [Green Version]
- Huang, K.; Liang, X.c.; Zhong, Y.l.; He, W.y.; Wang, Z. 5-Caffeoylquinic acid decreases diet-induced obesity in rats by modulating PPARα and LXRα transcription. J. Sci. Food Agric. 2015, 95, 1903–1910. [Google Scholar] [CrossRef] [PubMed]
- Cai, X.; Yang, F.; Zhu, L.; Xia, Y.; Wu, Q.; Xue, H.; Lu, Y. Rosmarinic acid, the main effective constituent of Orthosiphon stamineus, inhibits intestinal epithelial apoptosis via regulation of the Nrf2 pathway in mice. Molecules 2019, 24, 3027. [Google Scholar] [CrossRef] [Green Version]
- Li, S.; Meng, F.; Liao, X.; Wang, Y.; Sun, Z.; Guo, F.; Li, X.; Meng, M.; Li, Y.; Sun, C. Therapeutic role of ursolic acid on ameliorating hepatic steatosis and improving metabolic disorders in high-fat diet-induced non-alcoholic fatty liver disease rats. PLoS ONE 2014, 9, e86724. [Google Scholar] [CrossRef] [Green Version]
- Park, H.J.; DiNatale, D.A.; Chung, M.-Y.; Park, Y.-K.; Lee, J.-Y.; Koo, S.I.; O’Connor, M.; Manautou, J.E.; Bruno, R.S. Green tea extract attenuates hepatic steatosis by decreasing adipose lipogenesis and enhancing hepatic antioxidant defenses in ob/ob mice. J. Nutr. Biochem. 2011, 22, 393–400. [Google Scholar] [CrossRef]
- Das, N.; Sikder, K.; Bhattacharjee, S.; Majumdar, S.B.; Ghosh, S.; Majumdar, S.; Dey, S. Quercetin alleviates inflammation after short-term treatment in high-fat-fed mice. Food Funct. 2013, 4, 889–898. [Google Scholar] [CrossRef]
- Weydert, C.J.; Cullen, J.J. Measurement of superoxide dismutase, catalase and glutathione peroxidase in cultured cells and tissue. Nat. Protoc. 2010, 5, 51–66. [Google Scholar] [CrossRef] [Green Version]
- Lahera, V.; de Las Heras, N.; López-Farré, A.; Manucha, W.; Ferder, L. Role of mitochondrial dysfunction in hypertension and obesity. Curr. Hypertens. Rep. 2017, 19, 11. [Google Scholar] [CrossRef]
- Cui, X.; Xiao, W.; You, L.; Zhang, F.; Cao, X.; Feng, J.; Shen, D.; Li, Y.; Wang, Y.; Ji, C. Age-induced oxidative stress impairs adipogenesis and thermogenesis in brown fat. FEBS J. 2019, 286, 2753–2768. [Google Scholar] [CrossRef]
- Chouchani, E.T.; Kazak, L.; Jedrychowski, M.P.; Lu, G.Z.; Erickson, B.K.; Szpyt, J.; Pierce, K.A.; Laznik-Bogoslavski, D.; Vetrivelan, R.; Clish, C.B. Mitochondrial ROS regulate thermogenic energy expenditure and sulfenylation of UCP1. Nature 2016, 532, 112–116. [Google Scholar] [CrossRef] [Green Version]
- Castro, J.P.; Grune, T.; Speckmann, B. The two faces of reactive oxygen species (ROS) in adipocyte function and dysfunction. Biol. Chem. 2016, 397, 709–724. [Google Scholar] [CrossRef] [Green Version]
- Sáinz, N.; Barrenetxe, J.; Moreno-Aliaga, M.J.; Martínez, J.A. Leptin resistance and diet-induced obesity: Central and peripheral actions of leptin. Metabolism 2015, 64, 35–46. [Google Scholar] [CrossRef]
- Sakurai, T.; Ogasawara, J.; Shirato, K.; Izawa, T.; Oh-Ishi, S.; Ishibashi, Y.; Radák, Z.; Ohno, H.; Kizaki, T. Exercise training attenuates the dysregulated expression of adipokines and oxidative stress in white adipose tissue. Oxidative Med. Cell. Longev. 2017, 2017, 9410954. [Google Scholar] [CrossRef] [Green Version]
- Kadowaki, T.; Yamauchi, T. Adiponectin and adiponectin receptors. Endocr. Rev. 2005, 26, 439–451. [Google Scholar] [CrossRef] [Green Version]
- Day, E.A.; Ford, R.J.; Steinberg, G.R. AMPK as a therapeutic target for treating metabolic diseases. Trends Endocrinol. Metab. 2017, 28, 545–560. [Google Scholar] [CrossRef]
- Marcinko, K.; Steinberg, G.R. The role of AMPK in controlling metabolism and mitochondrial biogenesis during exercise. Exp. Physiol. 2014, 99, 1581–1585. [Google Scholar] [CrossRef] [Green Version]
- Ronnett, G.V.; Kleman, A.M.; Kim, E.K.; Landree, L.E.; Tu, Y. Fatty acid metabolism, the central nervous system, and feeding. Obesity 2006, 14, 201S–207S. [Google Scholar] [CrossRef]
- Cannon, B.; Nedergaard, J. Brown adipose tissue: Function and physiological significance. Physiol. Rev. 2004, 84, 277–359. [Google Scholar] [CrossRef] [PubMed]
- Mottillo, E.P.; Desjardins, E.M.; Crane, J.D.; Smith, B.K.; Green, A.E.; Ducommun, S.; Henriksen, T.I.; Rebalka, I.A.; Razi, A.; Sakamoto, K. Lack of adipocyte AMPK exacerbates insulin resistance and hepatic steatosis through brown and beige adipose tissue function. Cell Metab. 2016, 24, 118–129. [Google Scholar] [CrossRef] [PubMed] [Green Version]
- Desjardins, E.M.; Steinberg, G.R. Emerging role of AMPK in brown and beige adipose tissue (BAT): Implications for obesity, insulin resistance, and type 2 diabetes. Curr. Diabetes Rep. 2018, 18, 80. [Google Scholar] [CrossRef] [PubMed]
- Thyagarajan, B.; Foster, M.T. Beiging of white adipose tissue as a therapeutic strategy for weight loss in humans. Horm. Mol. Biol. Clin. Investig. 2017, 31, 20170016. [Google Scholar] [CrossRef] [PubMed]
- Bolin, A.P.; Sousa-Filho, C.P.B.; Dos Santos, G.T.N.; Ferreira, L.T.; de Andrade, P.B.M.; Figueira, A.C.M.; Batista, F.A.H.; Otton, R. Adipogenic commitment induced by green tea polyphenols remodel adipocytes to a thermogenic phenotype. J. Nutr. Biochem. 2020, 83, 108429. [Google Scholar] [CrossRef]


Disclaimer/Publisher’s Note: The statements, opinions and data contained in all publications are solely those of the individual author(s) and contributor(s) and not of MDPI and/or the editor(s). MDPI and/or the editor(s) disclaim responsibility for any injury to people or property resulting from any ideas, methods, instructions or products referred to in the content. |
© 2023 by the authors. Licensee MDPI, Basel, Switzerland. This article is an open access article distributed under the terms and conditions of the Creative Commons Attribution (CC BY) license (https://creativecommons.org/licenses/by/4.0/).
Share and Cite
Zheng, Y.; Lee, S.-Y.; Lee, Y.; Lee, T.-K.; Kim, J.E.; Kim, T.H.; Kang, I.-J. Standardized Sanguisorba officinalis L. Extract Inhibits Adipogenesis and Promotes Thermogenesis via Reducing Oxidative Stress. Antioxidants 2023, 12, 882. https://doi.org/10.3390/antiox12040882
Zheng Y, Lee S-Y, Lee Y, Lee T-K, Kim JE, Kim TH, Kang I-J. Standardized Sanguisorba officinalis L. Extract Inhibits Adipogenesis and Promotes Thermogenesis via Reducing Oxidative Stress. Antioxidants. 2023; 12(4):882. https://doi.org/10.3390/antiox12040882
Chicago/Turabian StyleZheng, Yulong, So-Yeon Lee, Yeji Lee, Tae-Kyeong Lee, Ji Eun Kim, Tae Hyeon Kim, and Il-Jun Kang. 2023. "Standardized Sanguisorba officinalis L. Extract Inhibits Adipogenesis and Promotes Thermogenesis via Reducing Oxidative Stress" Antioxidants 12, no. 4: 882. https://doi.org/10.3390/antiox12040882