
Dibenzylideneacetone Induces Apoptosis in Cervical Cancer Cells through Ros-Mediated Mitochondrial Damage
 ,
,  and
and
Abstract
:
1. Introduction
2. Materials and Methods
2.1. Reagents
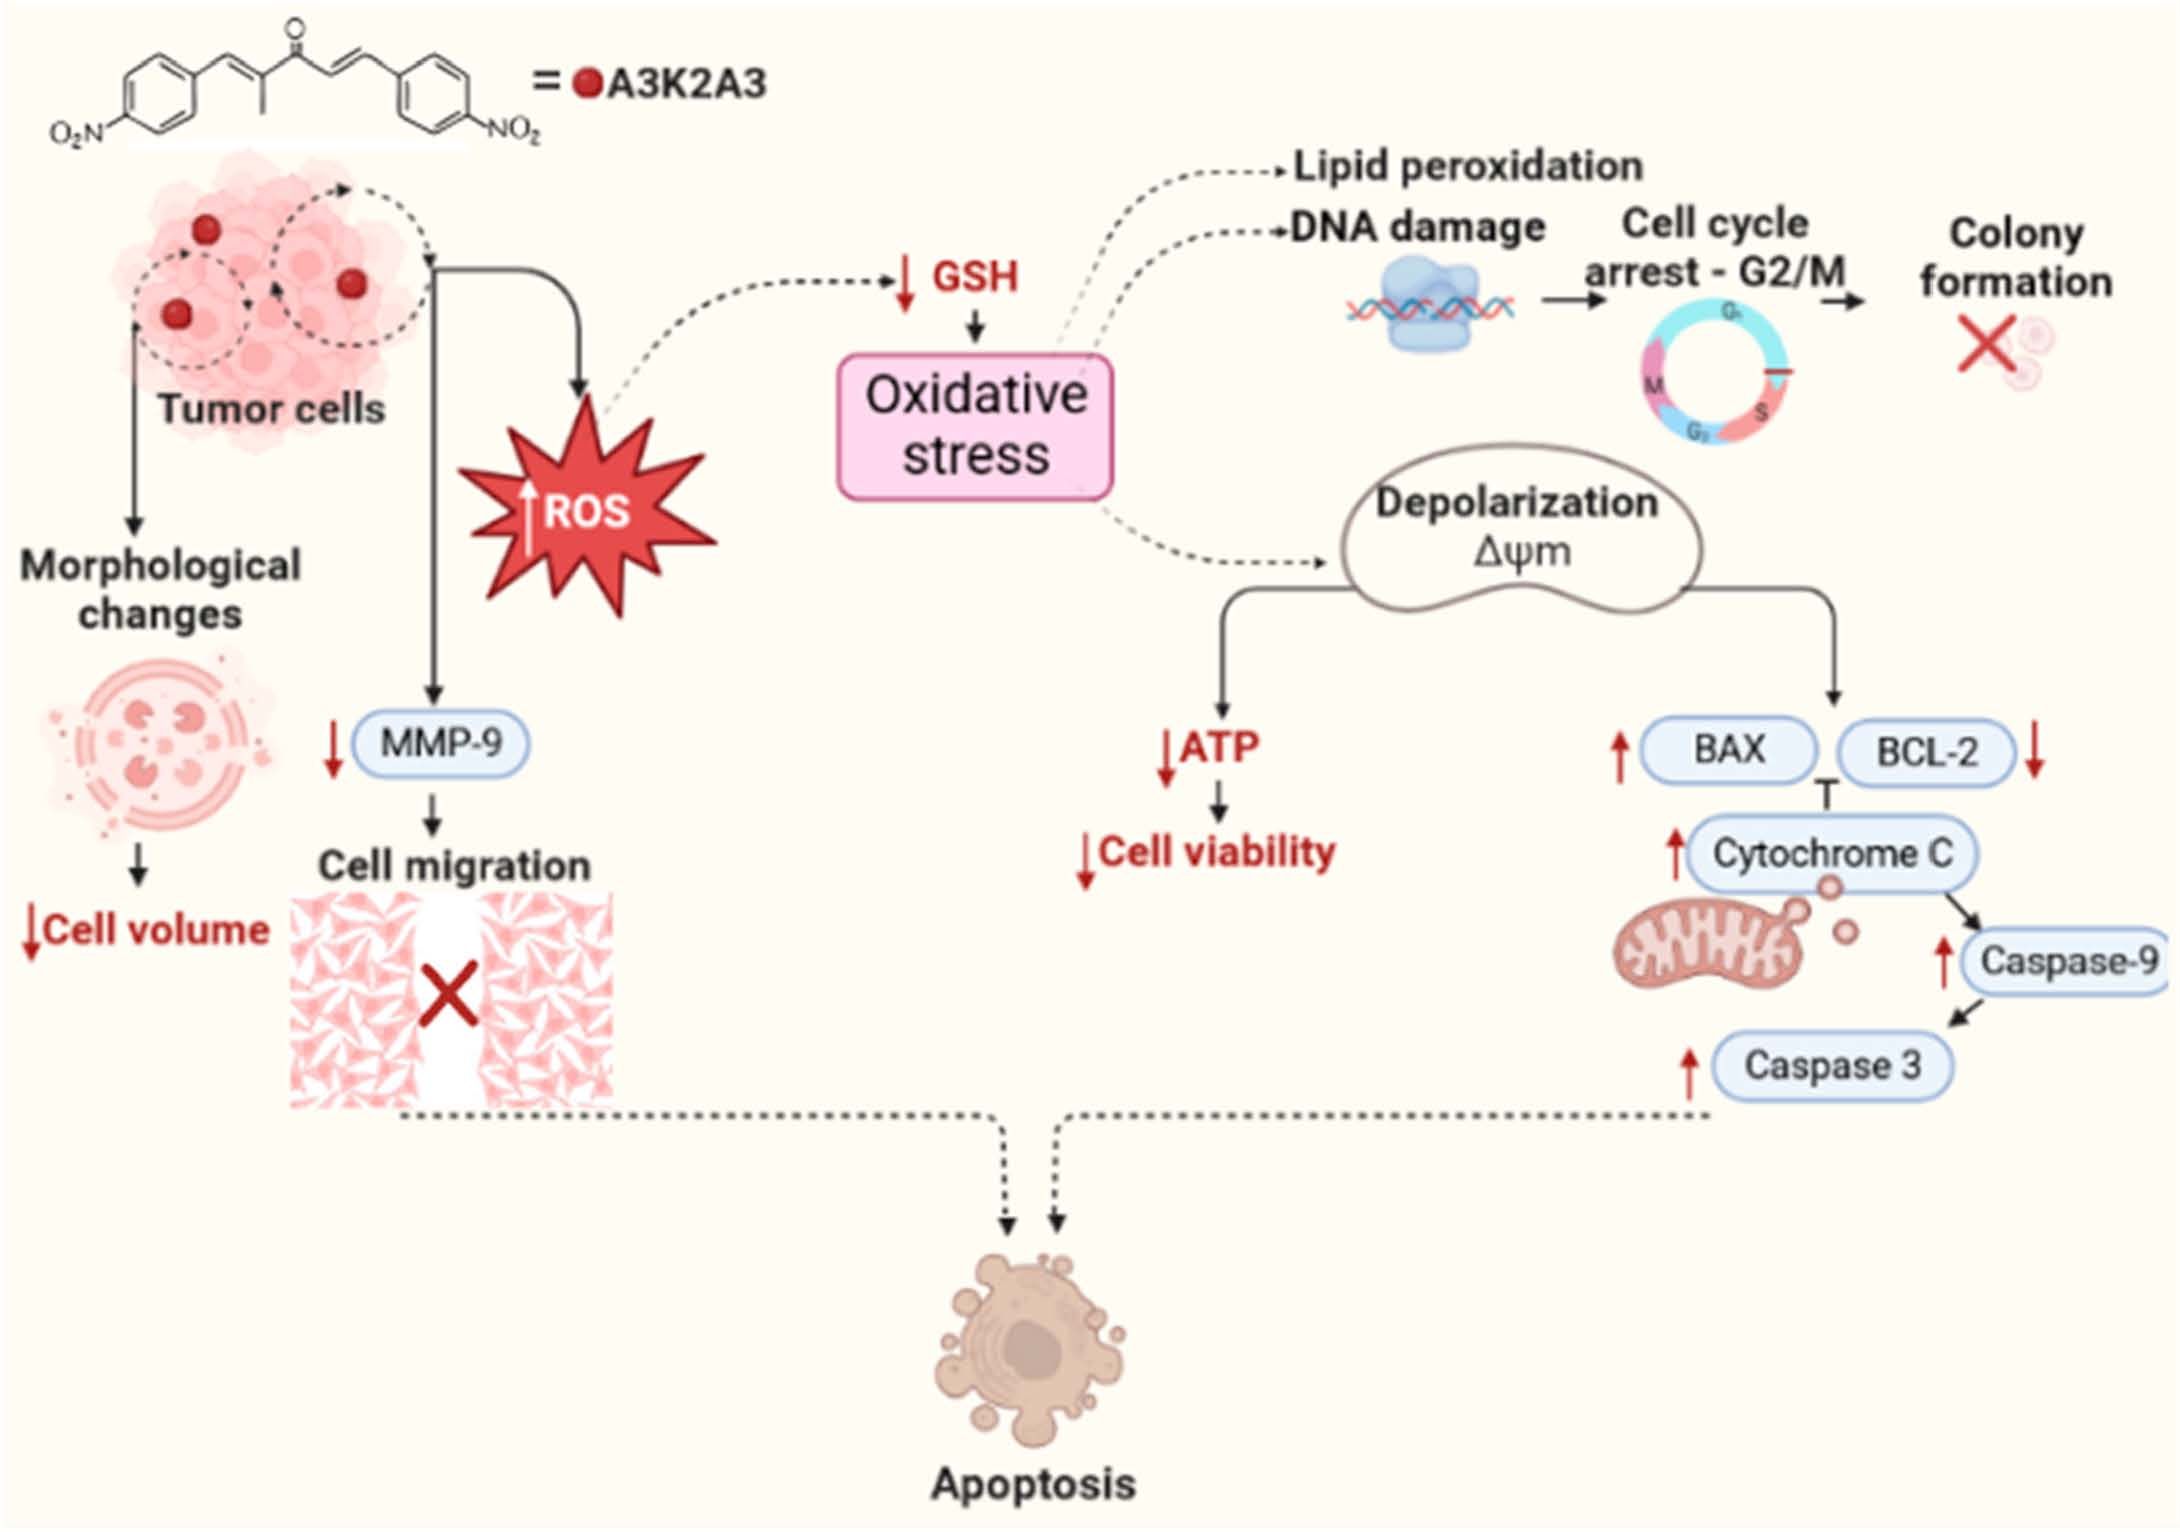
2.2. Compound
2.3. Cell Lines and Culture Conditions
2.4. Cytotoxic Activity
2.5. Assessment of the Morphology of Cervical Cancer Cells
2.5.1. Phase Contrast Microscopy
2.5.2. Scanning Electron Microscopy (SEM)
2.6. Determination of Cell Volume
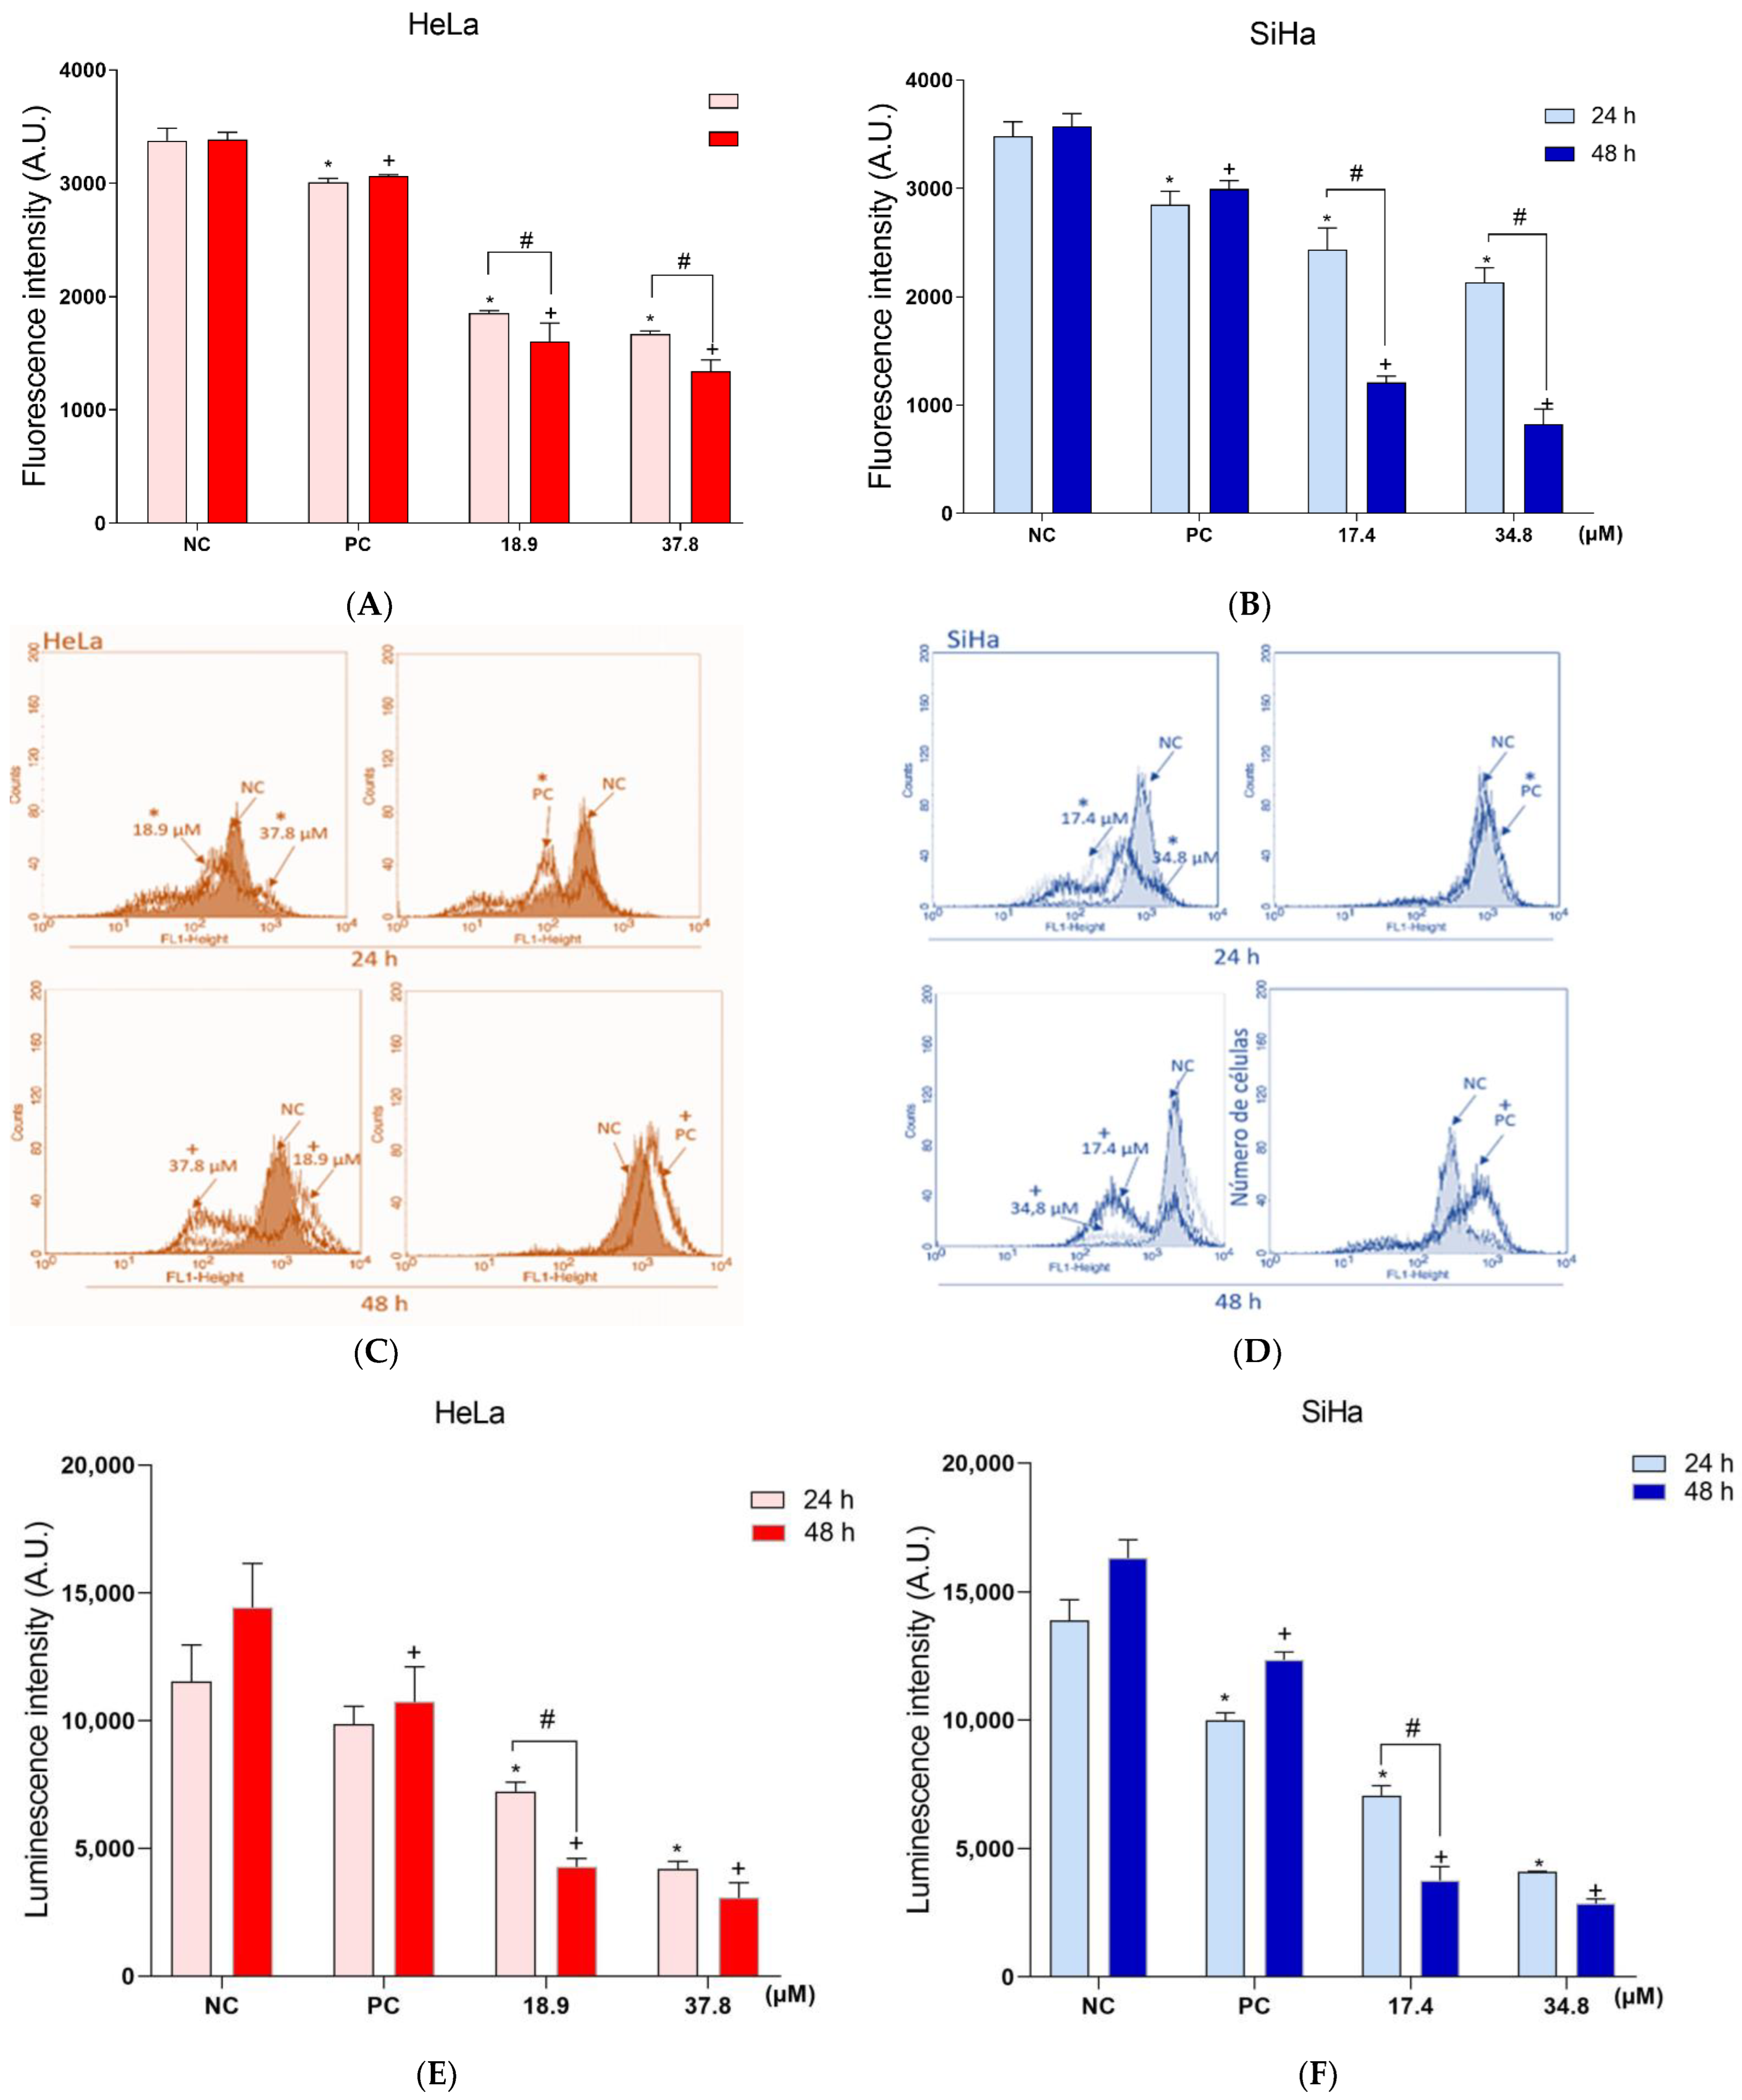
2.7. ROS Production
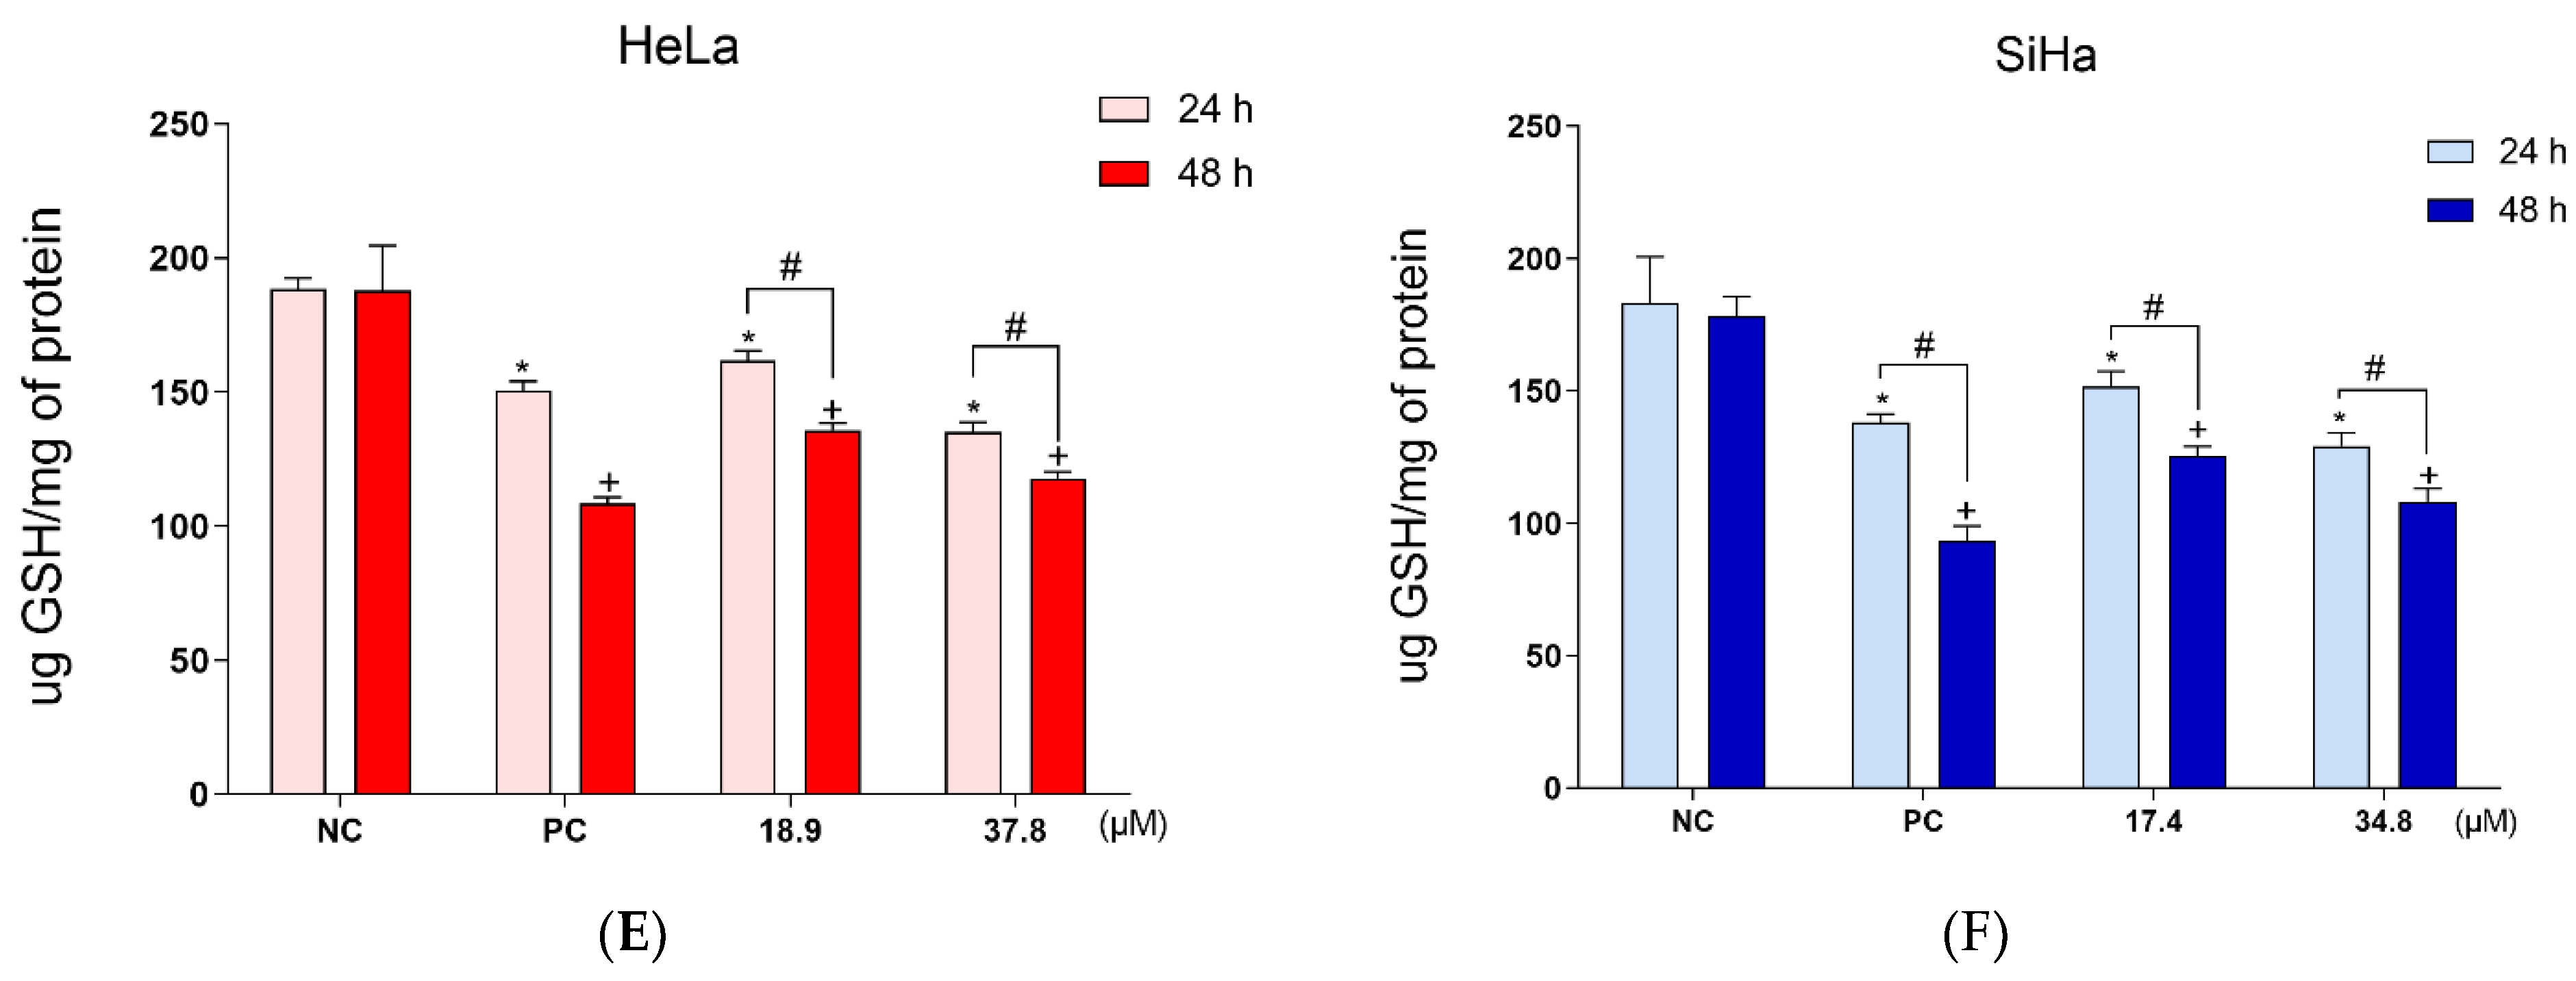
2.8. GSH Levels
2.9. Assessment of Mitochondrial Membrane Potential (Δψm)
2.9.1. TMRE Labeling
2.9.2. Marking with Rh123
2.10. Intracellular Adenosine Triphosphate (ATP) Level Determination
2.11. Cell Membrane Assessment
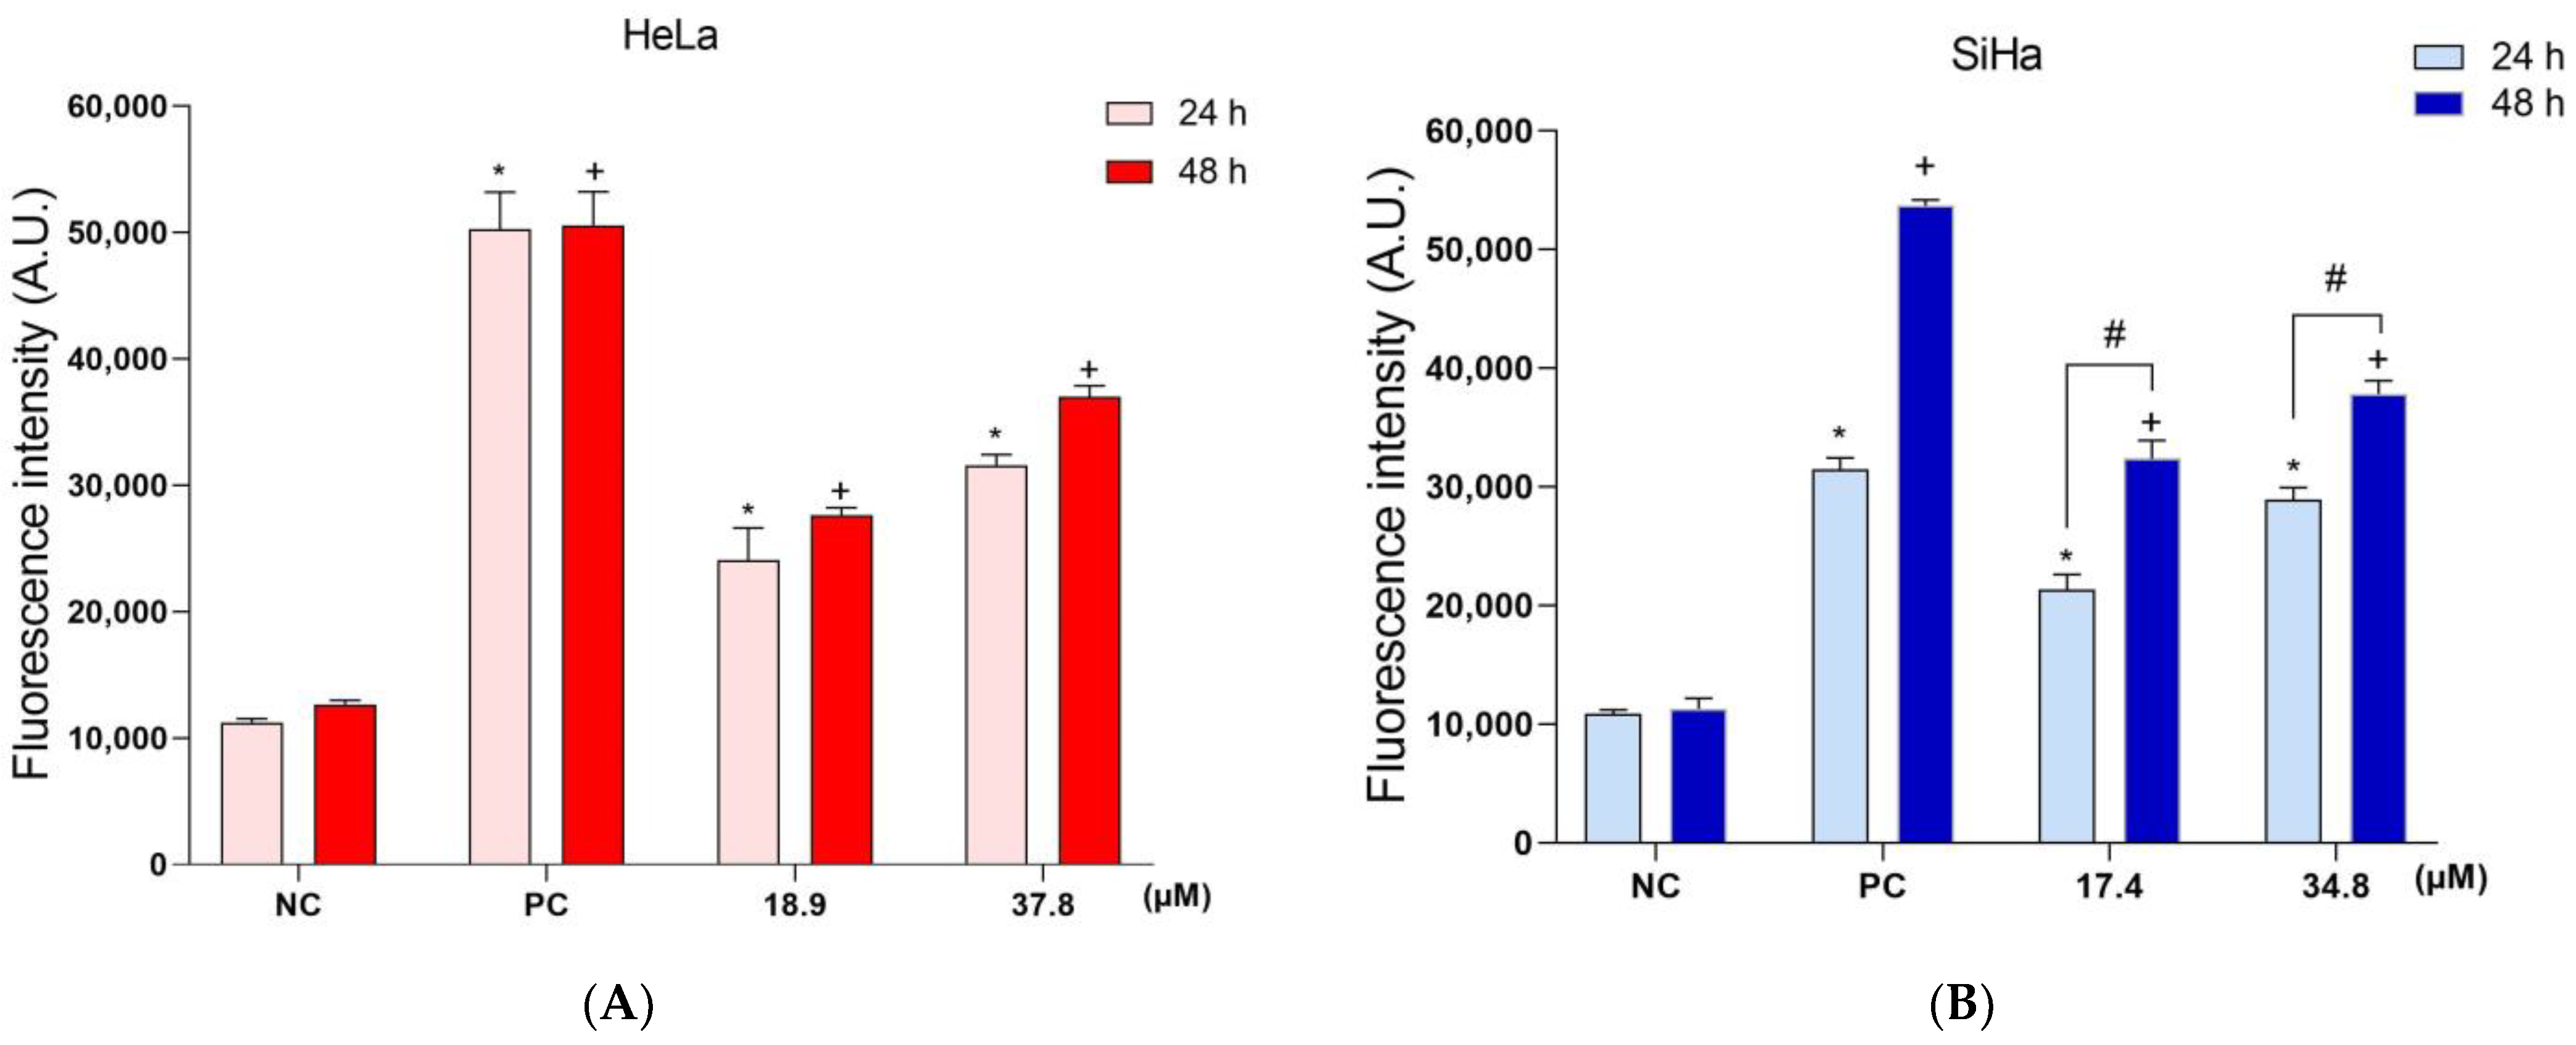
2.11.1. Lipid Peroxidation (LPO)
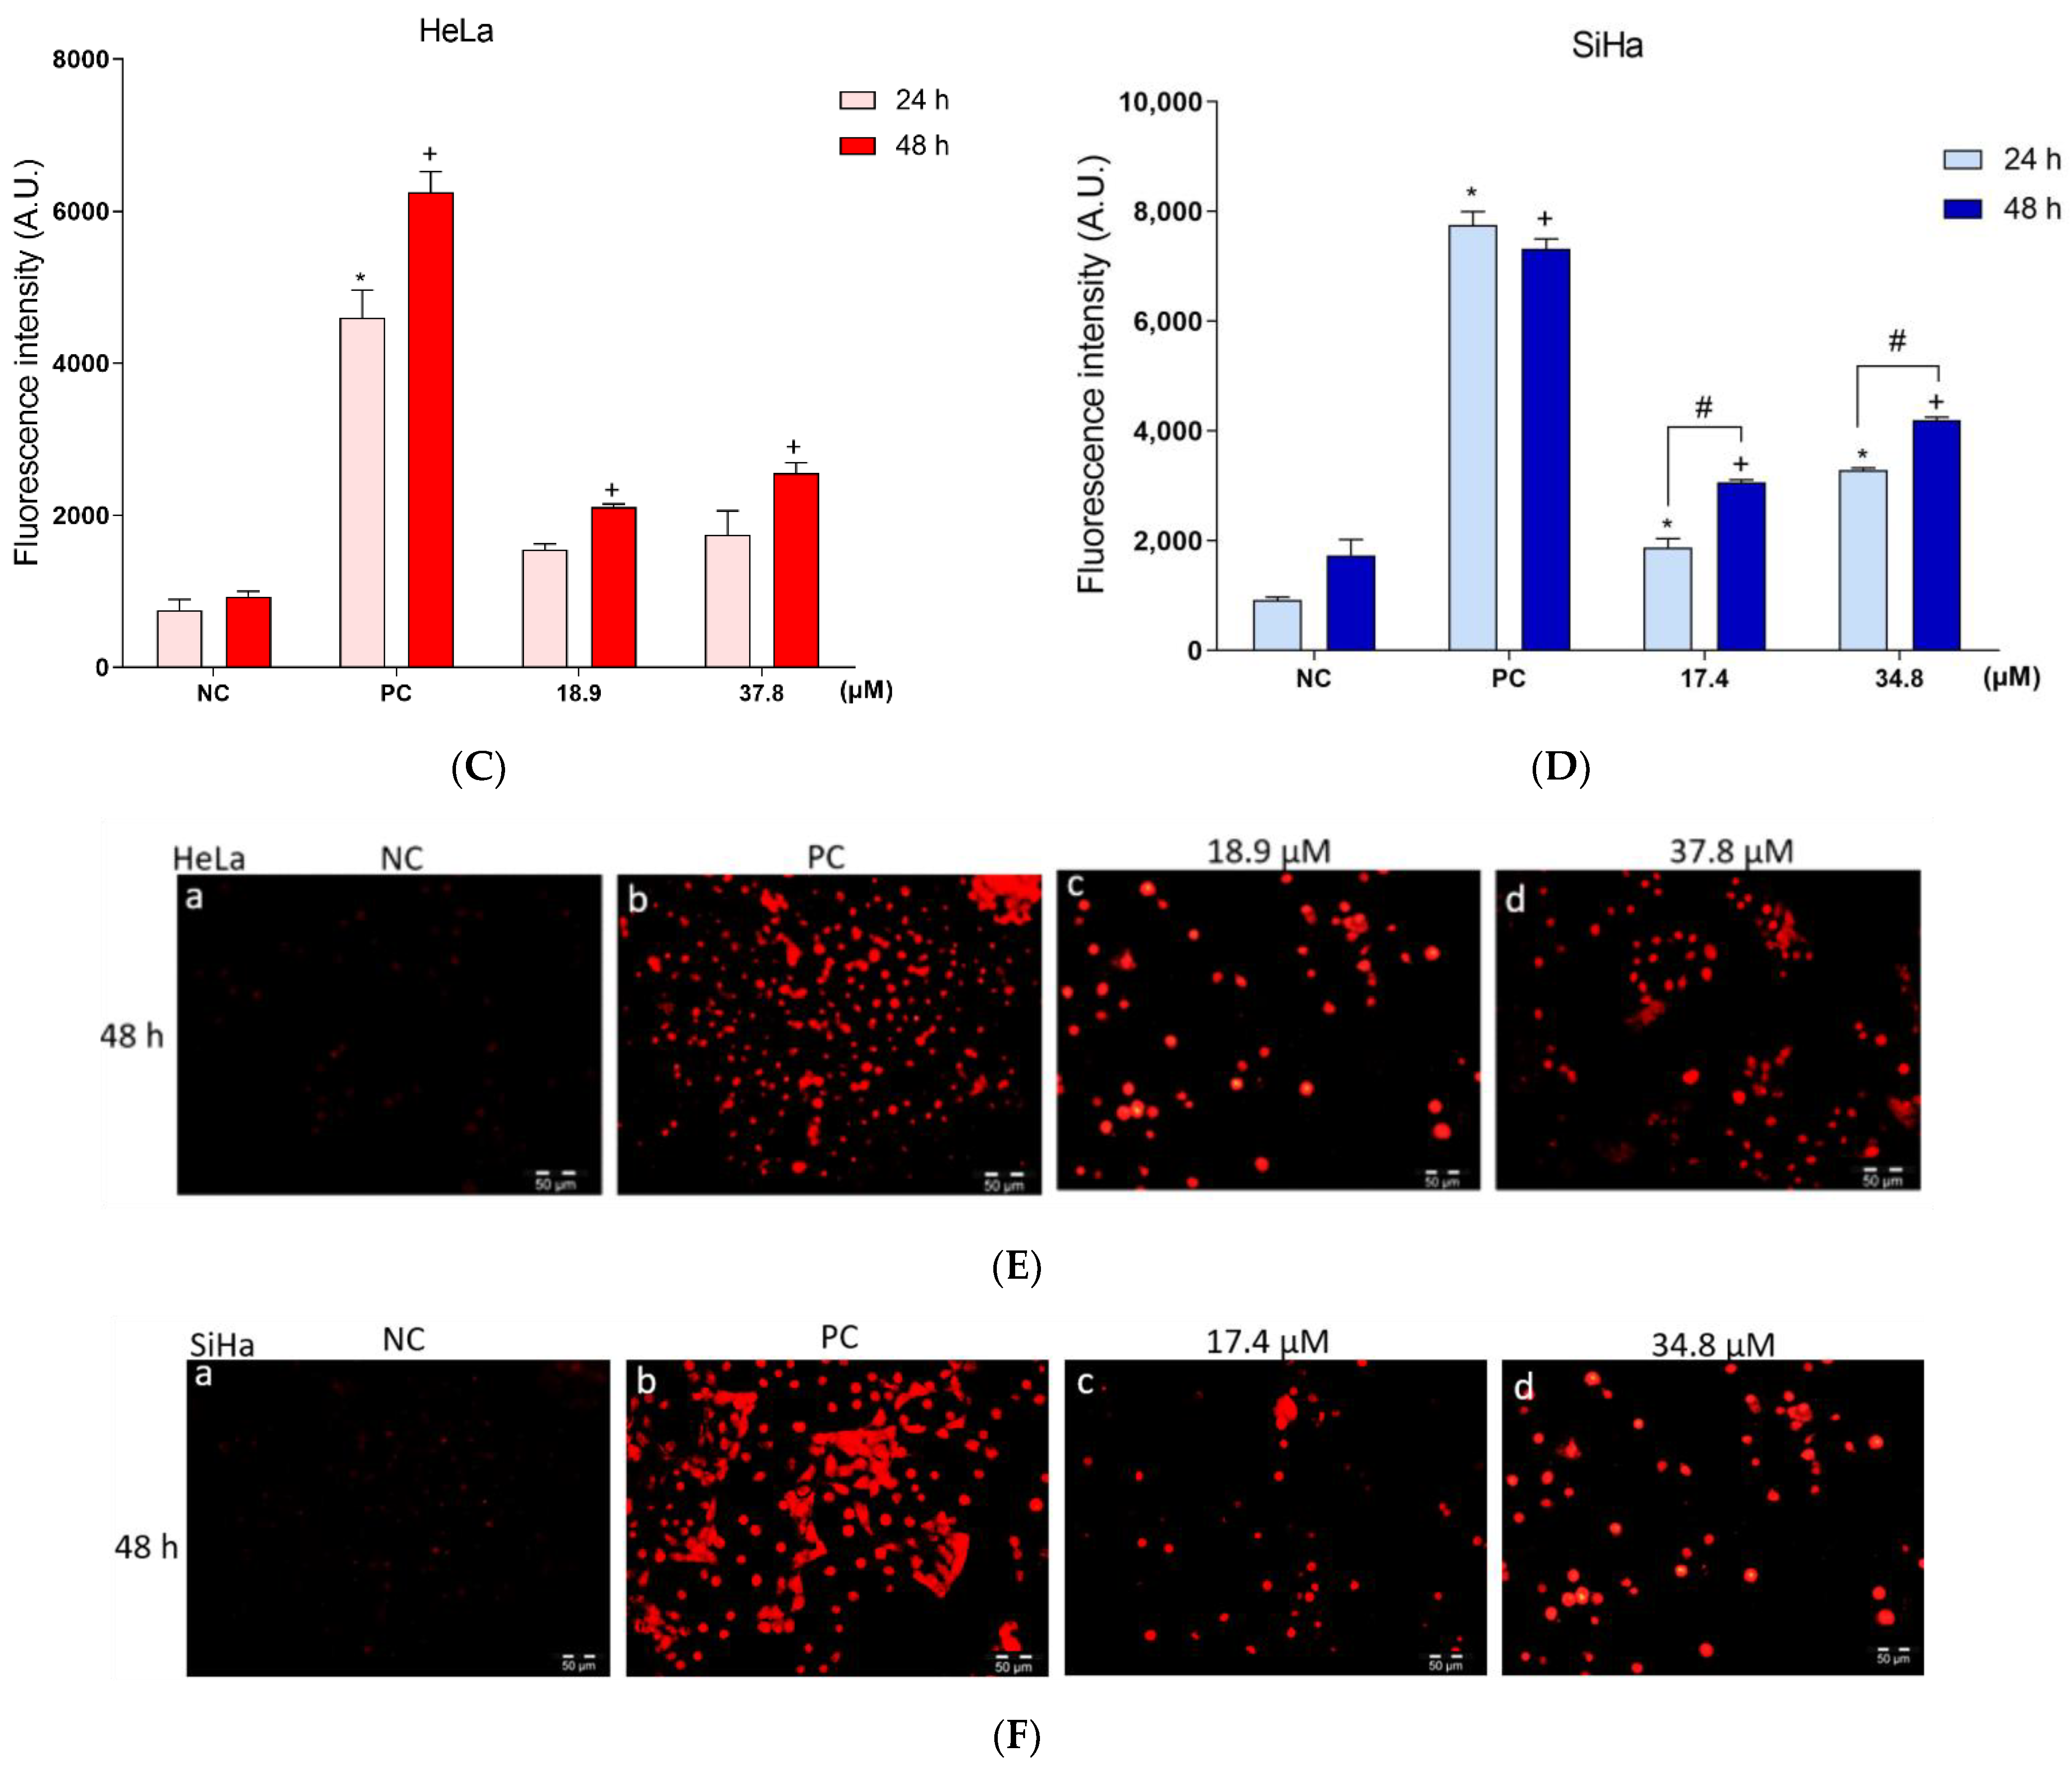
2.11.2. Cell Membrane Integrity
2.12. DNA Damage Evaluation
2.12.1. Cell Cycle
2.12.2. Hoechst 33342 Staining
2.12.3. Agarose Gel Electrophoresis
2.13. Cell Death Assessment
2.13.1. Detection of Phosphatidylserine Exposure
2.13.2. Dual Staining of AO and PI
2.13.3. Western Blotting
2.14. Clonogenic Assay
2.15. Wound Healing Assay
2.16. Statistical Analysis
3. Results
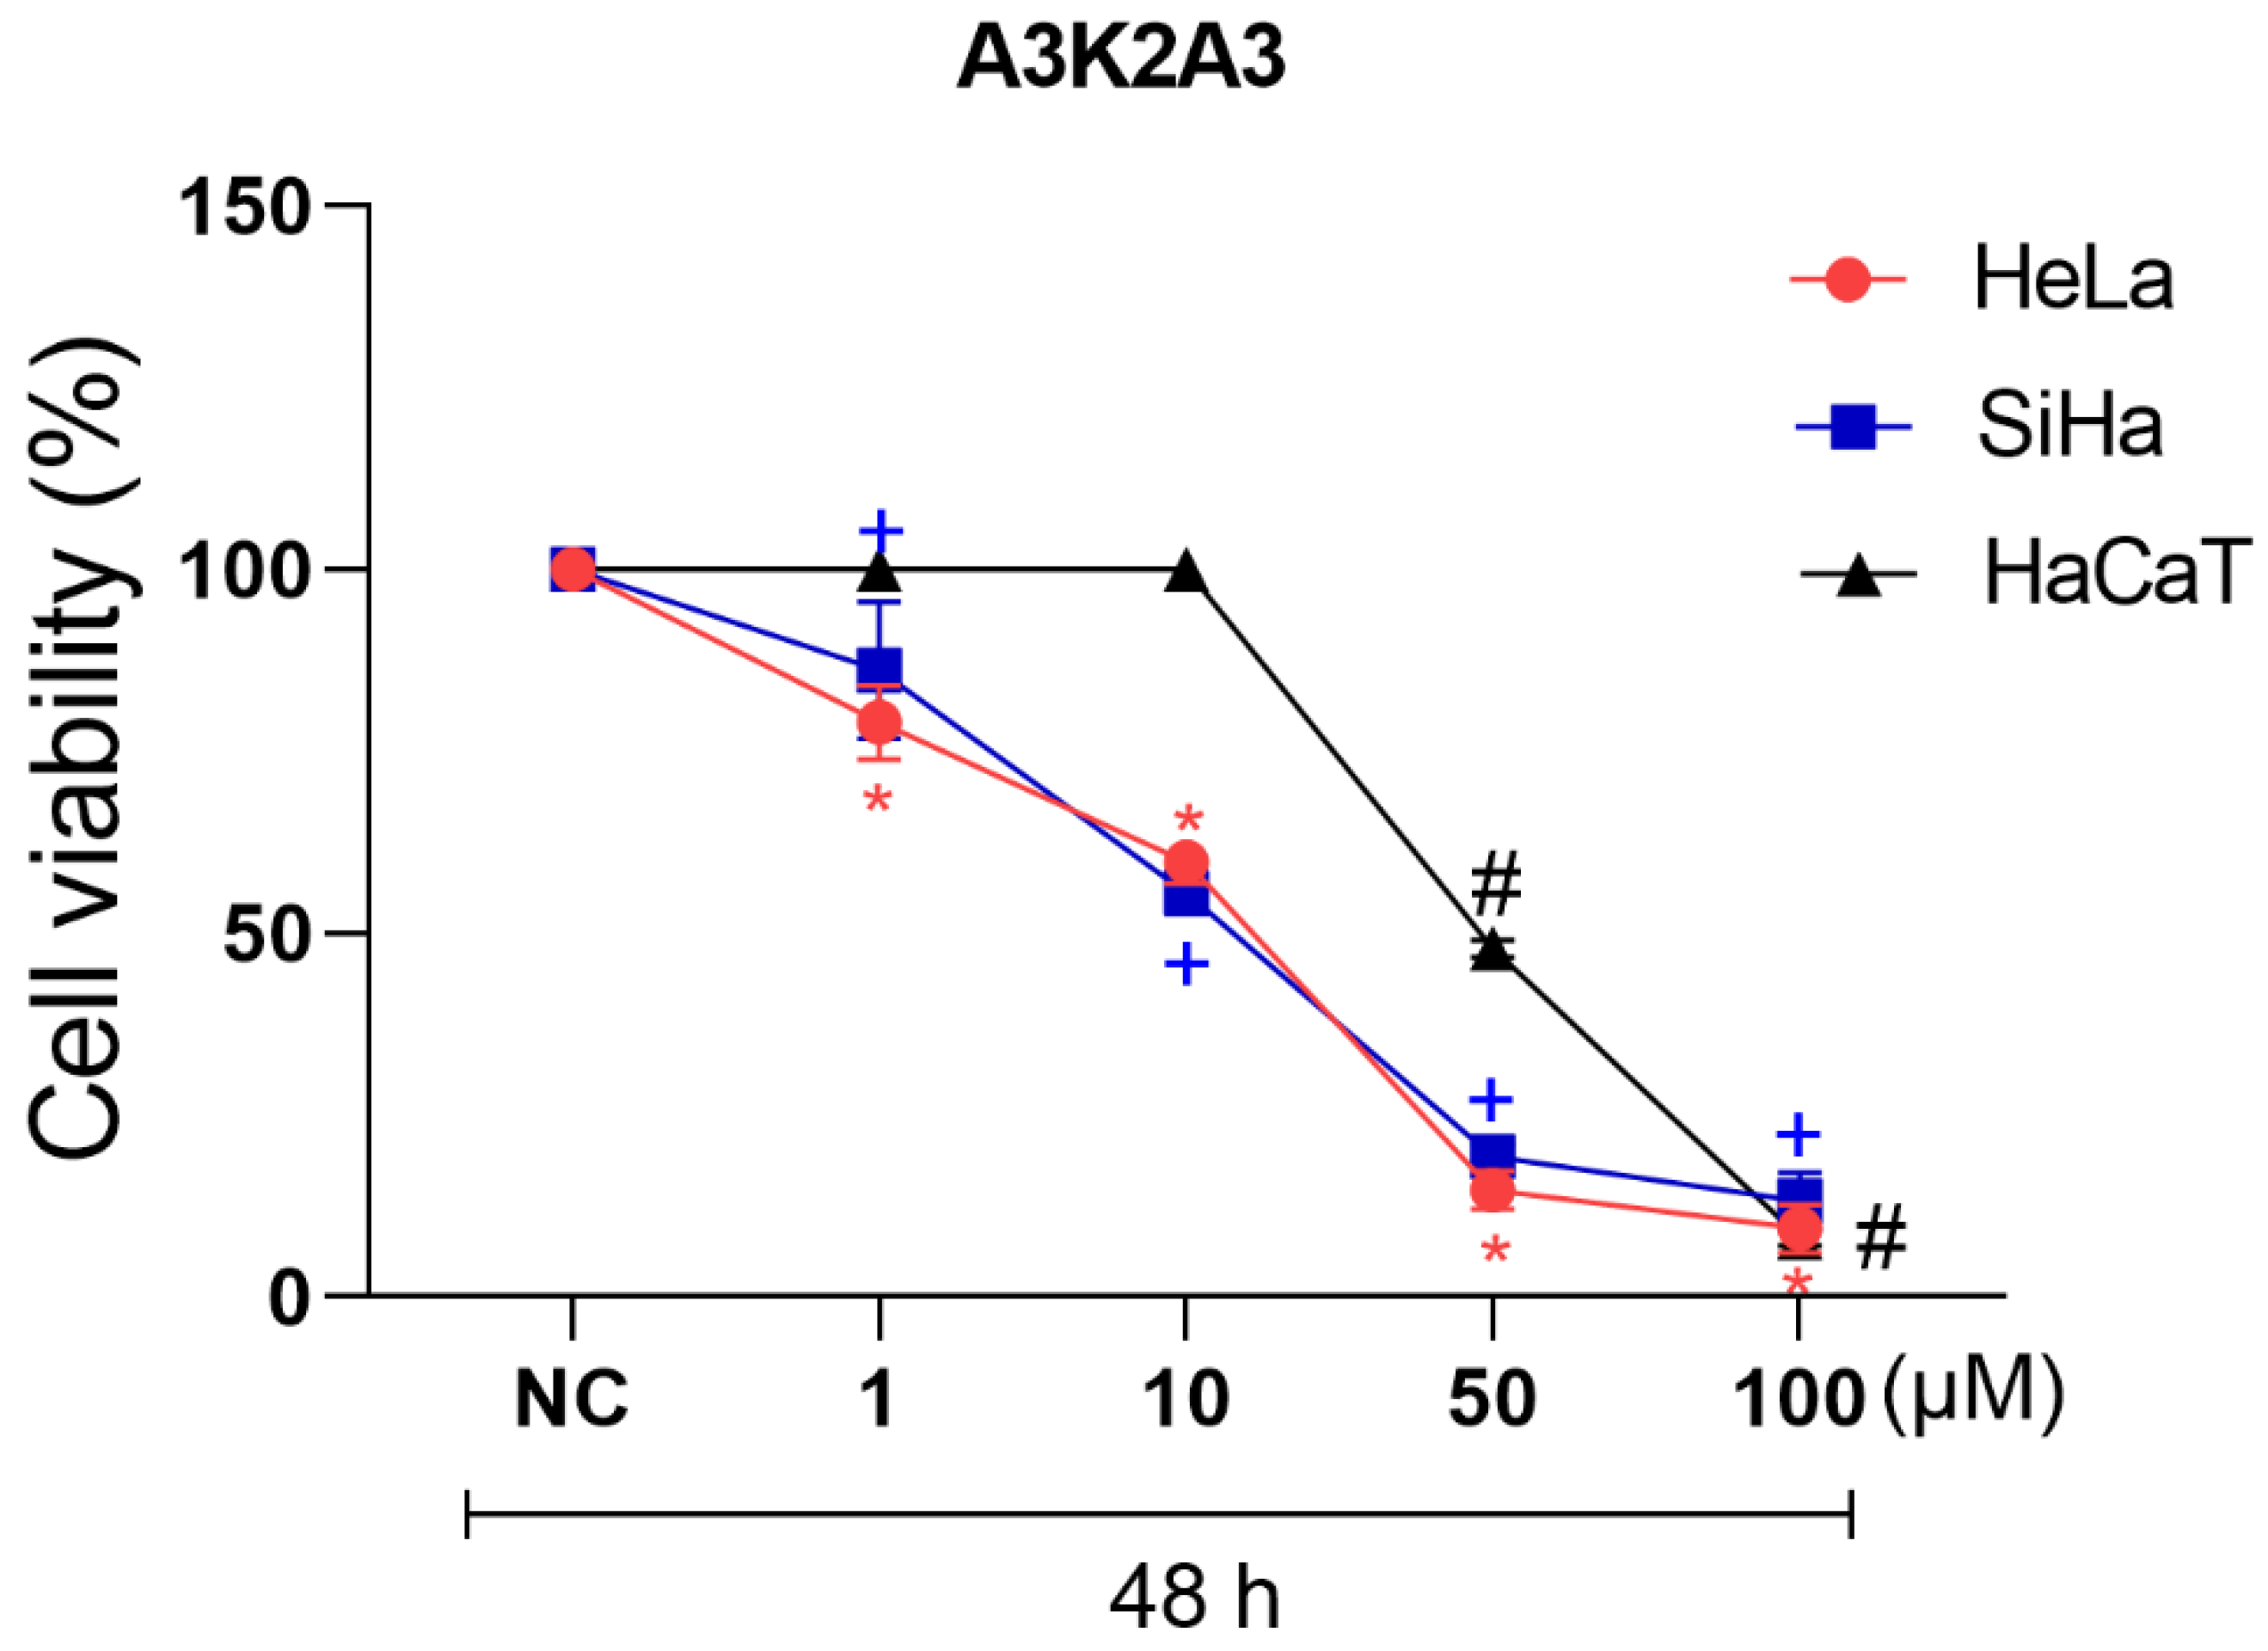
3.1. Cytotoxic Activity of A3K2A3 in Cervical Cancer Cell Lines
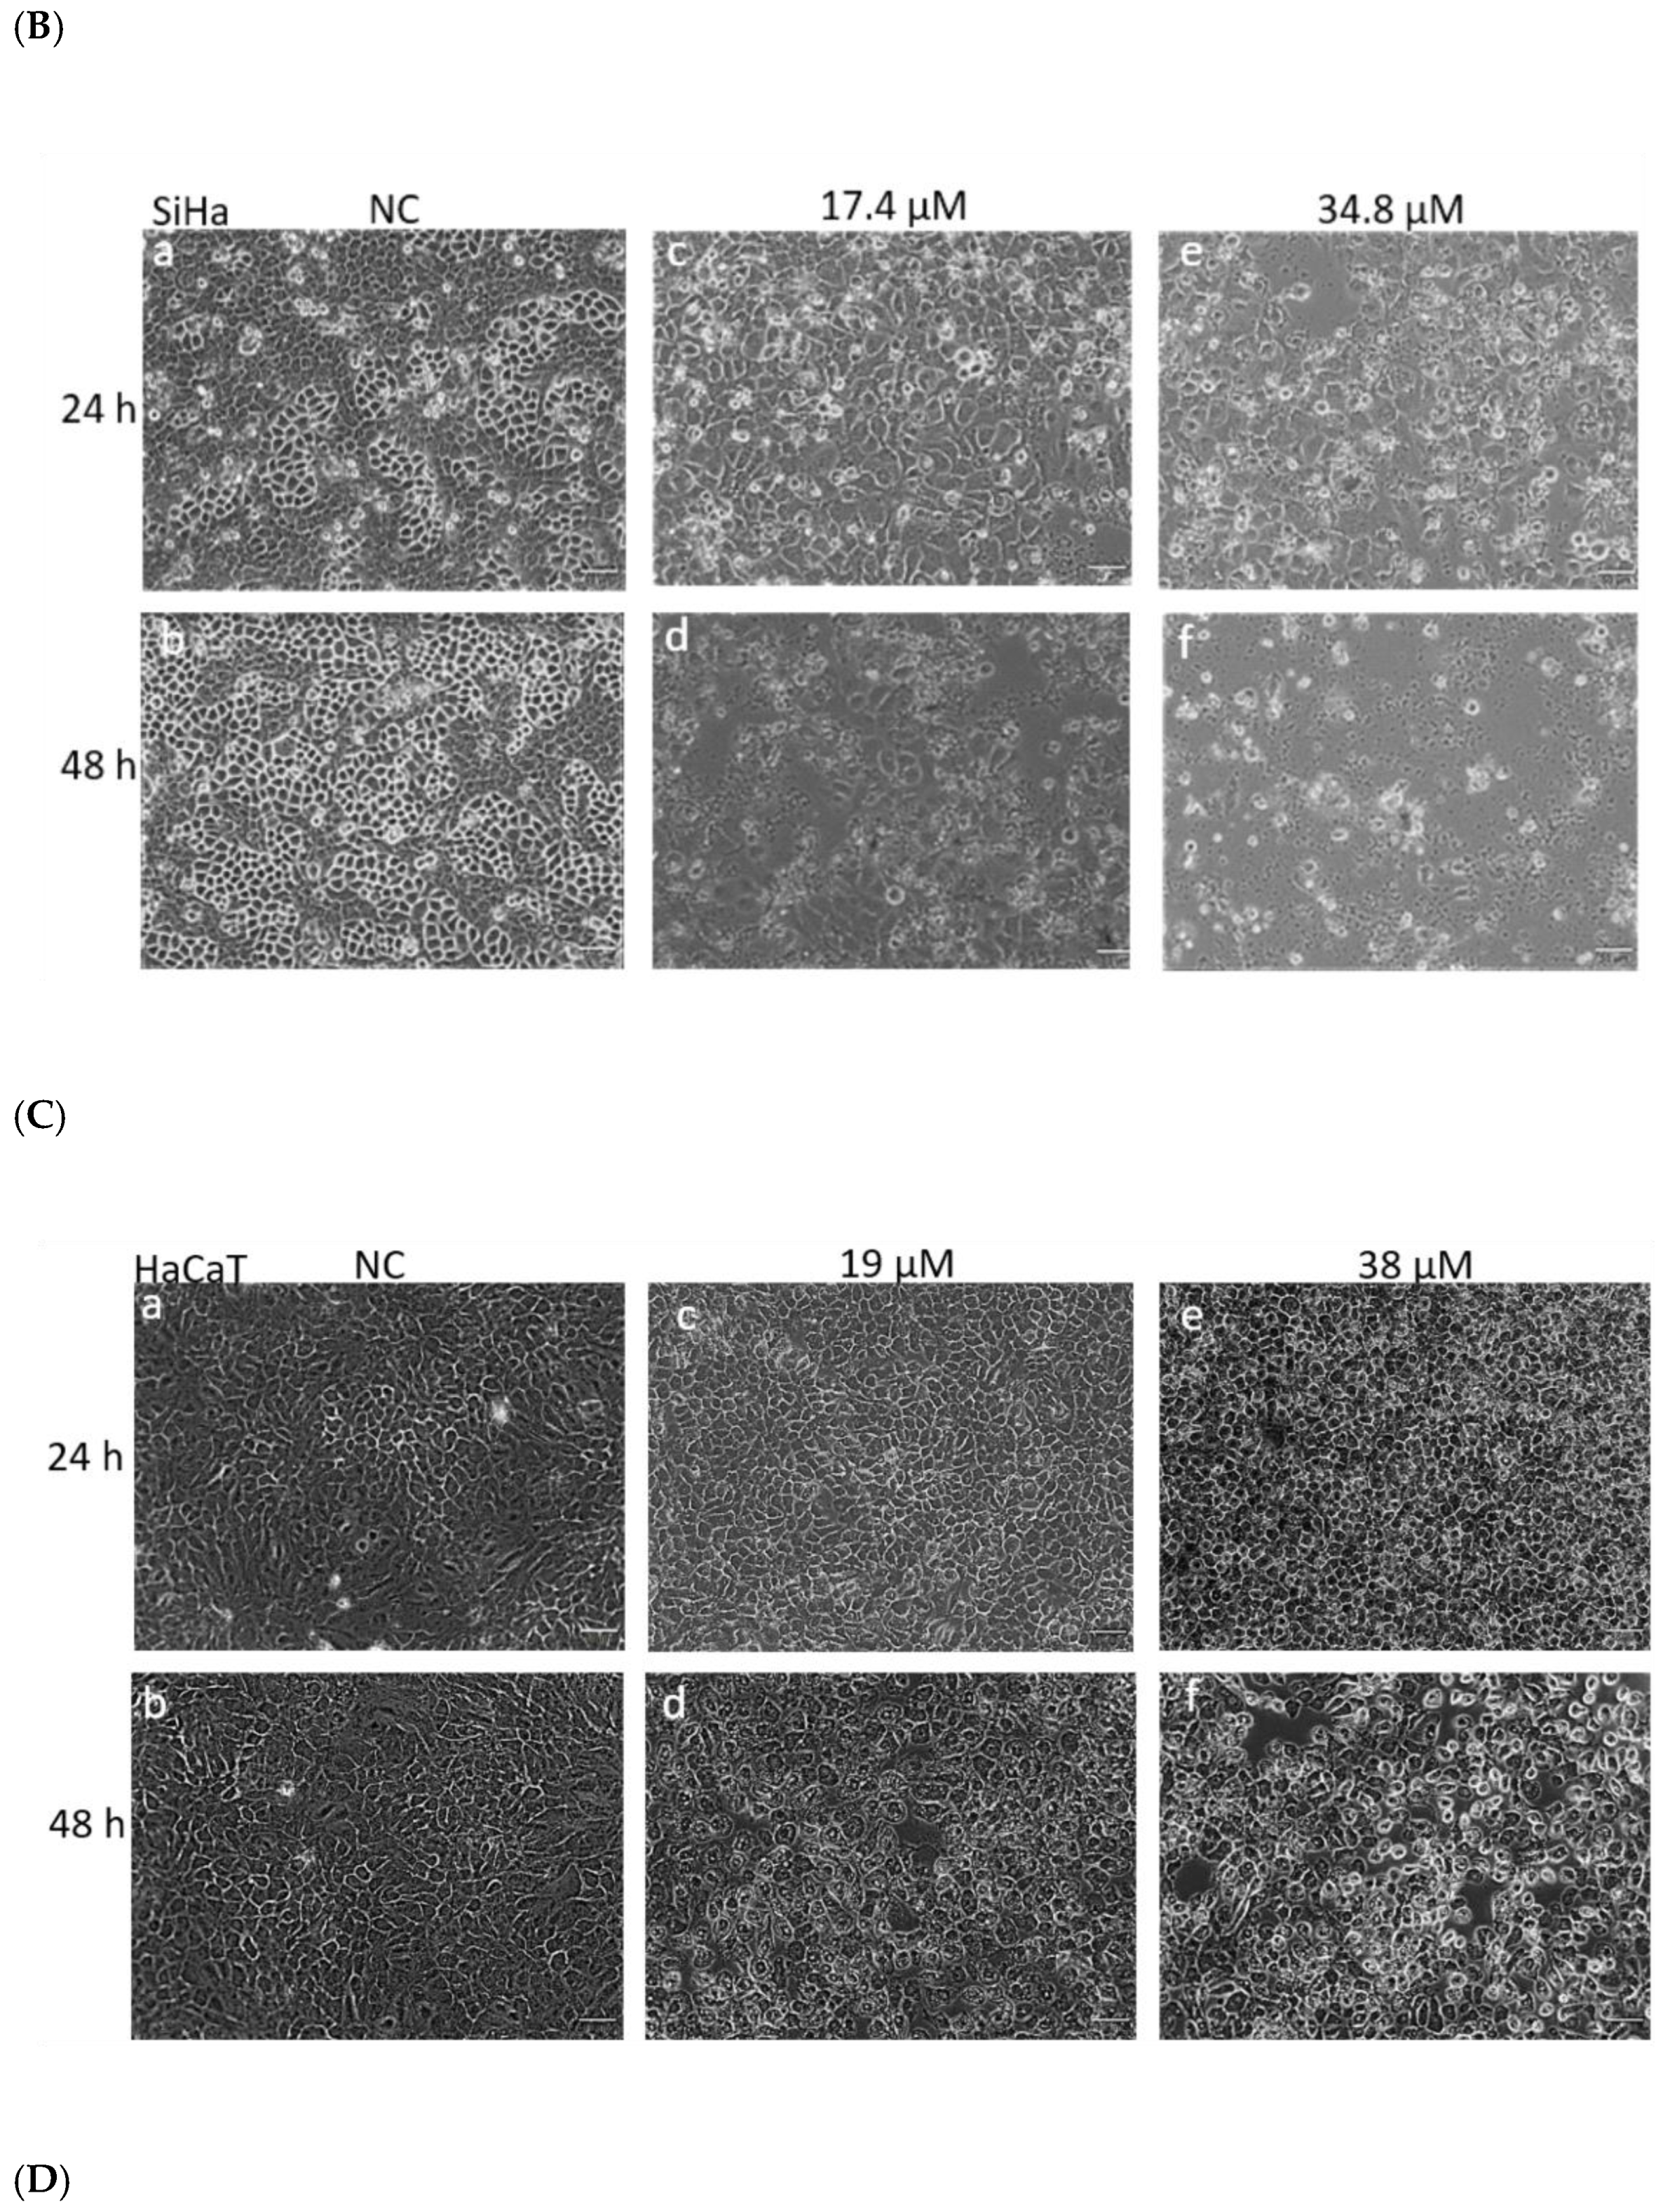
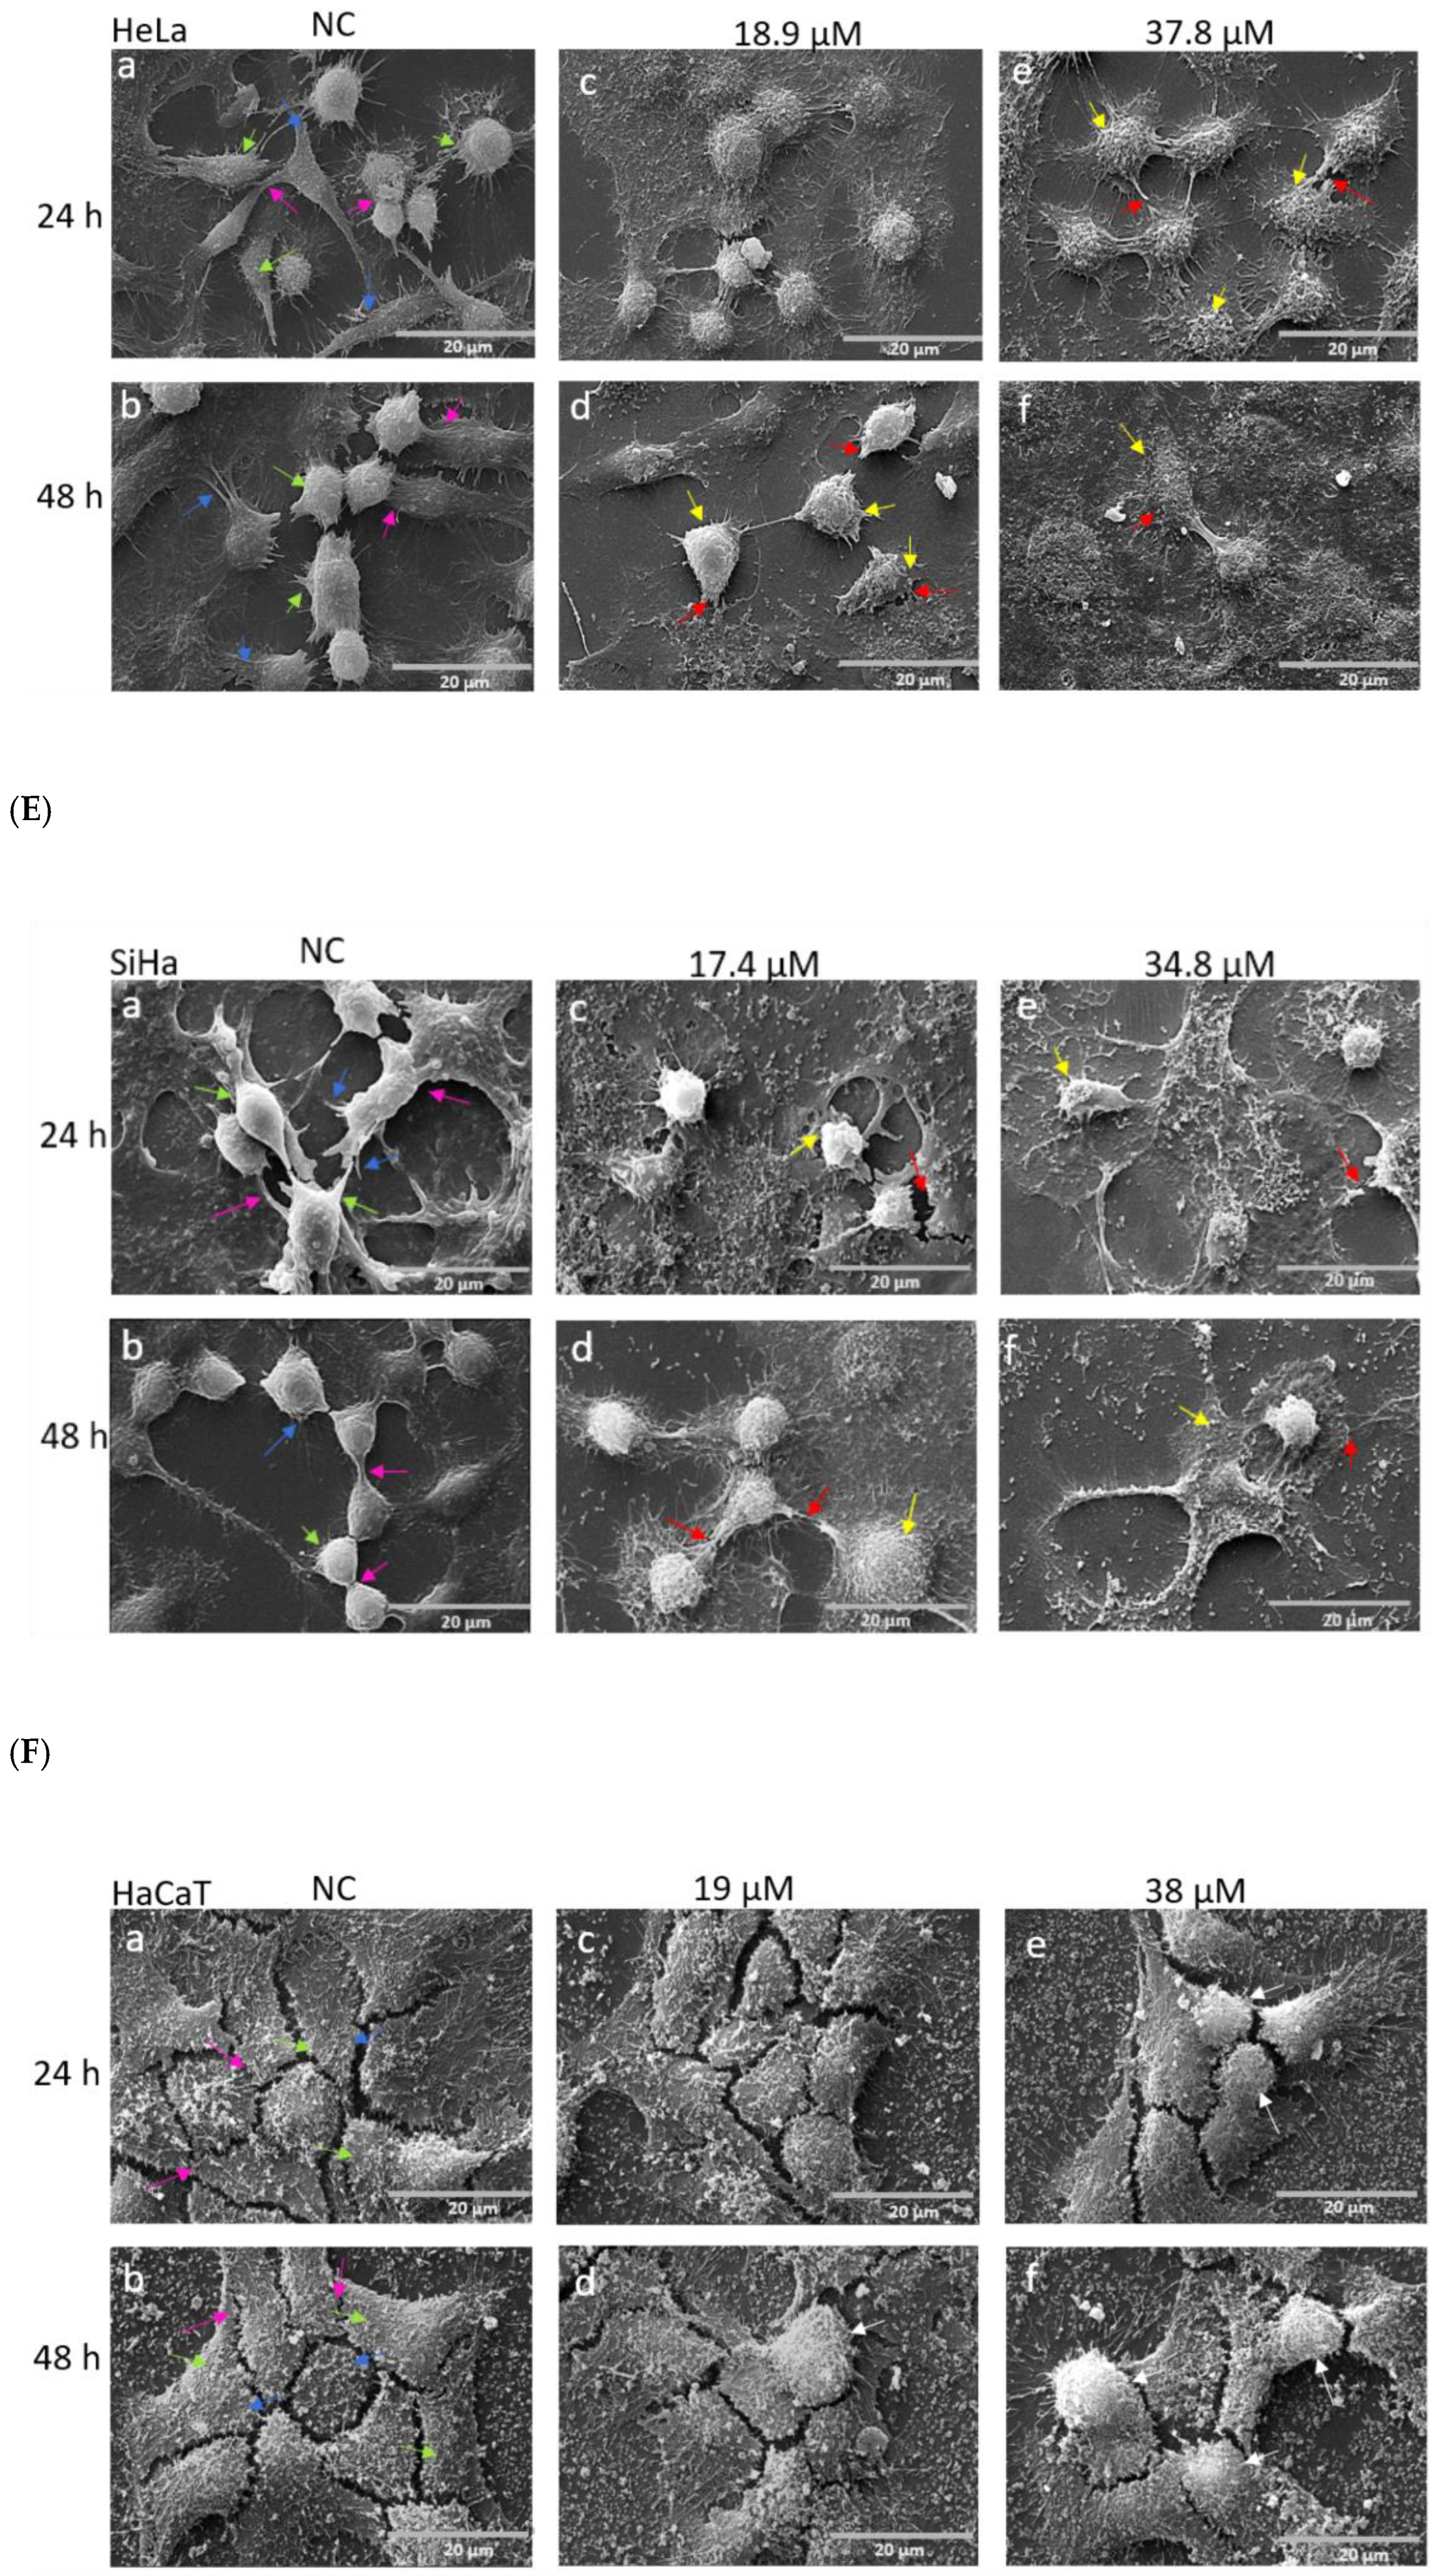
3.2. Effects of A3K2A3 on Cell Morphology
A3K2A3 Induces Changes in the Morphology of Cervical Cancer Cells Visualized by Optical and SEM
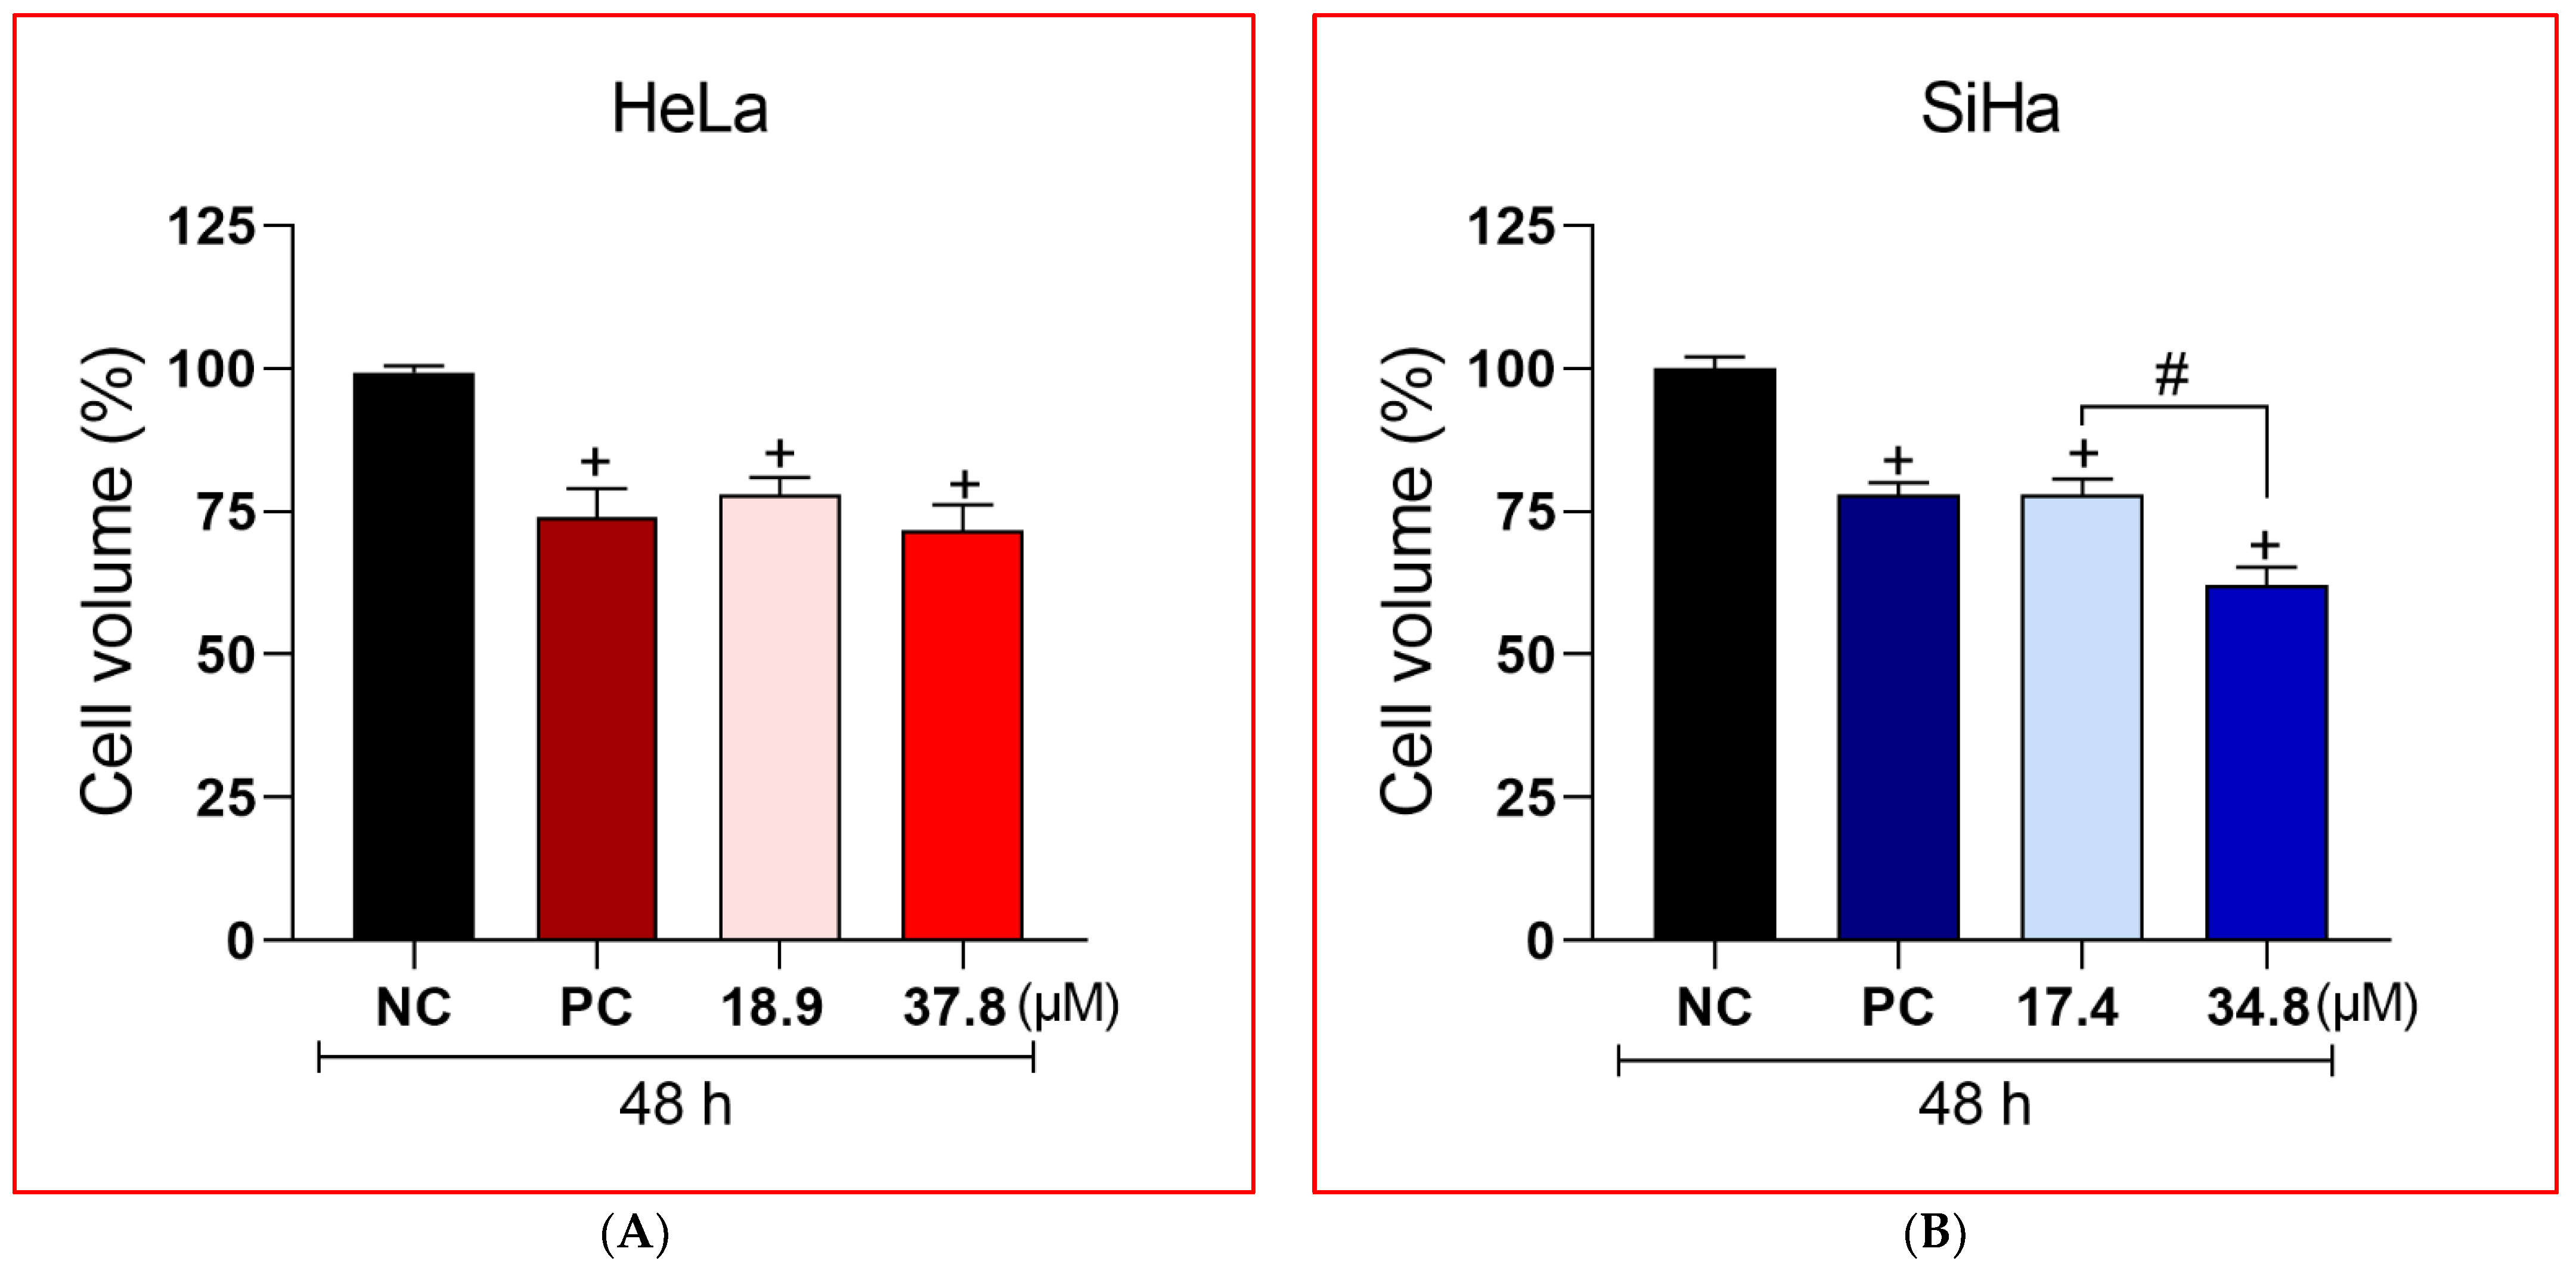
3.3. A3K2A3 Reduce Cell Volume in Cervical Cancer Cells
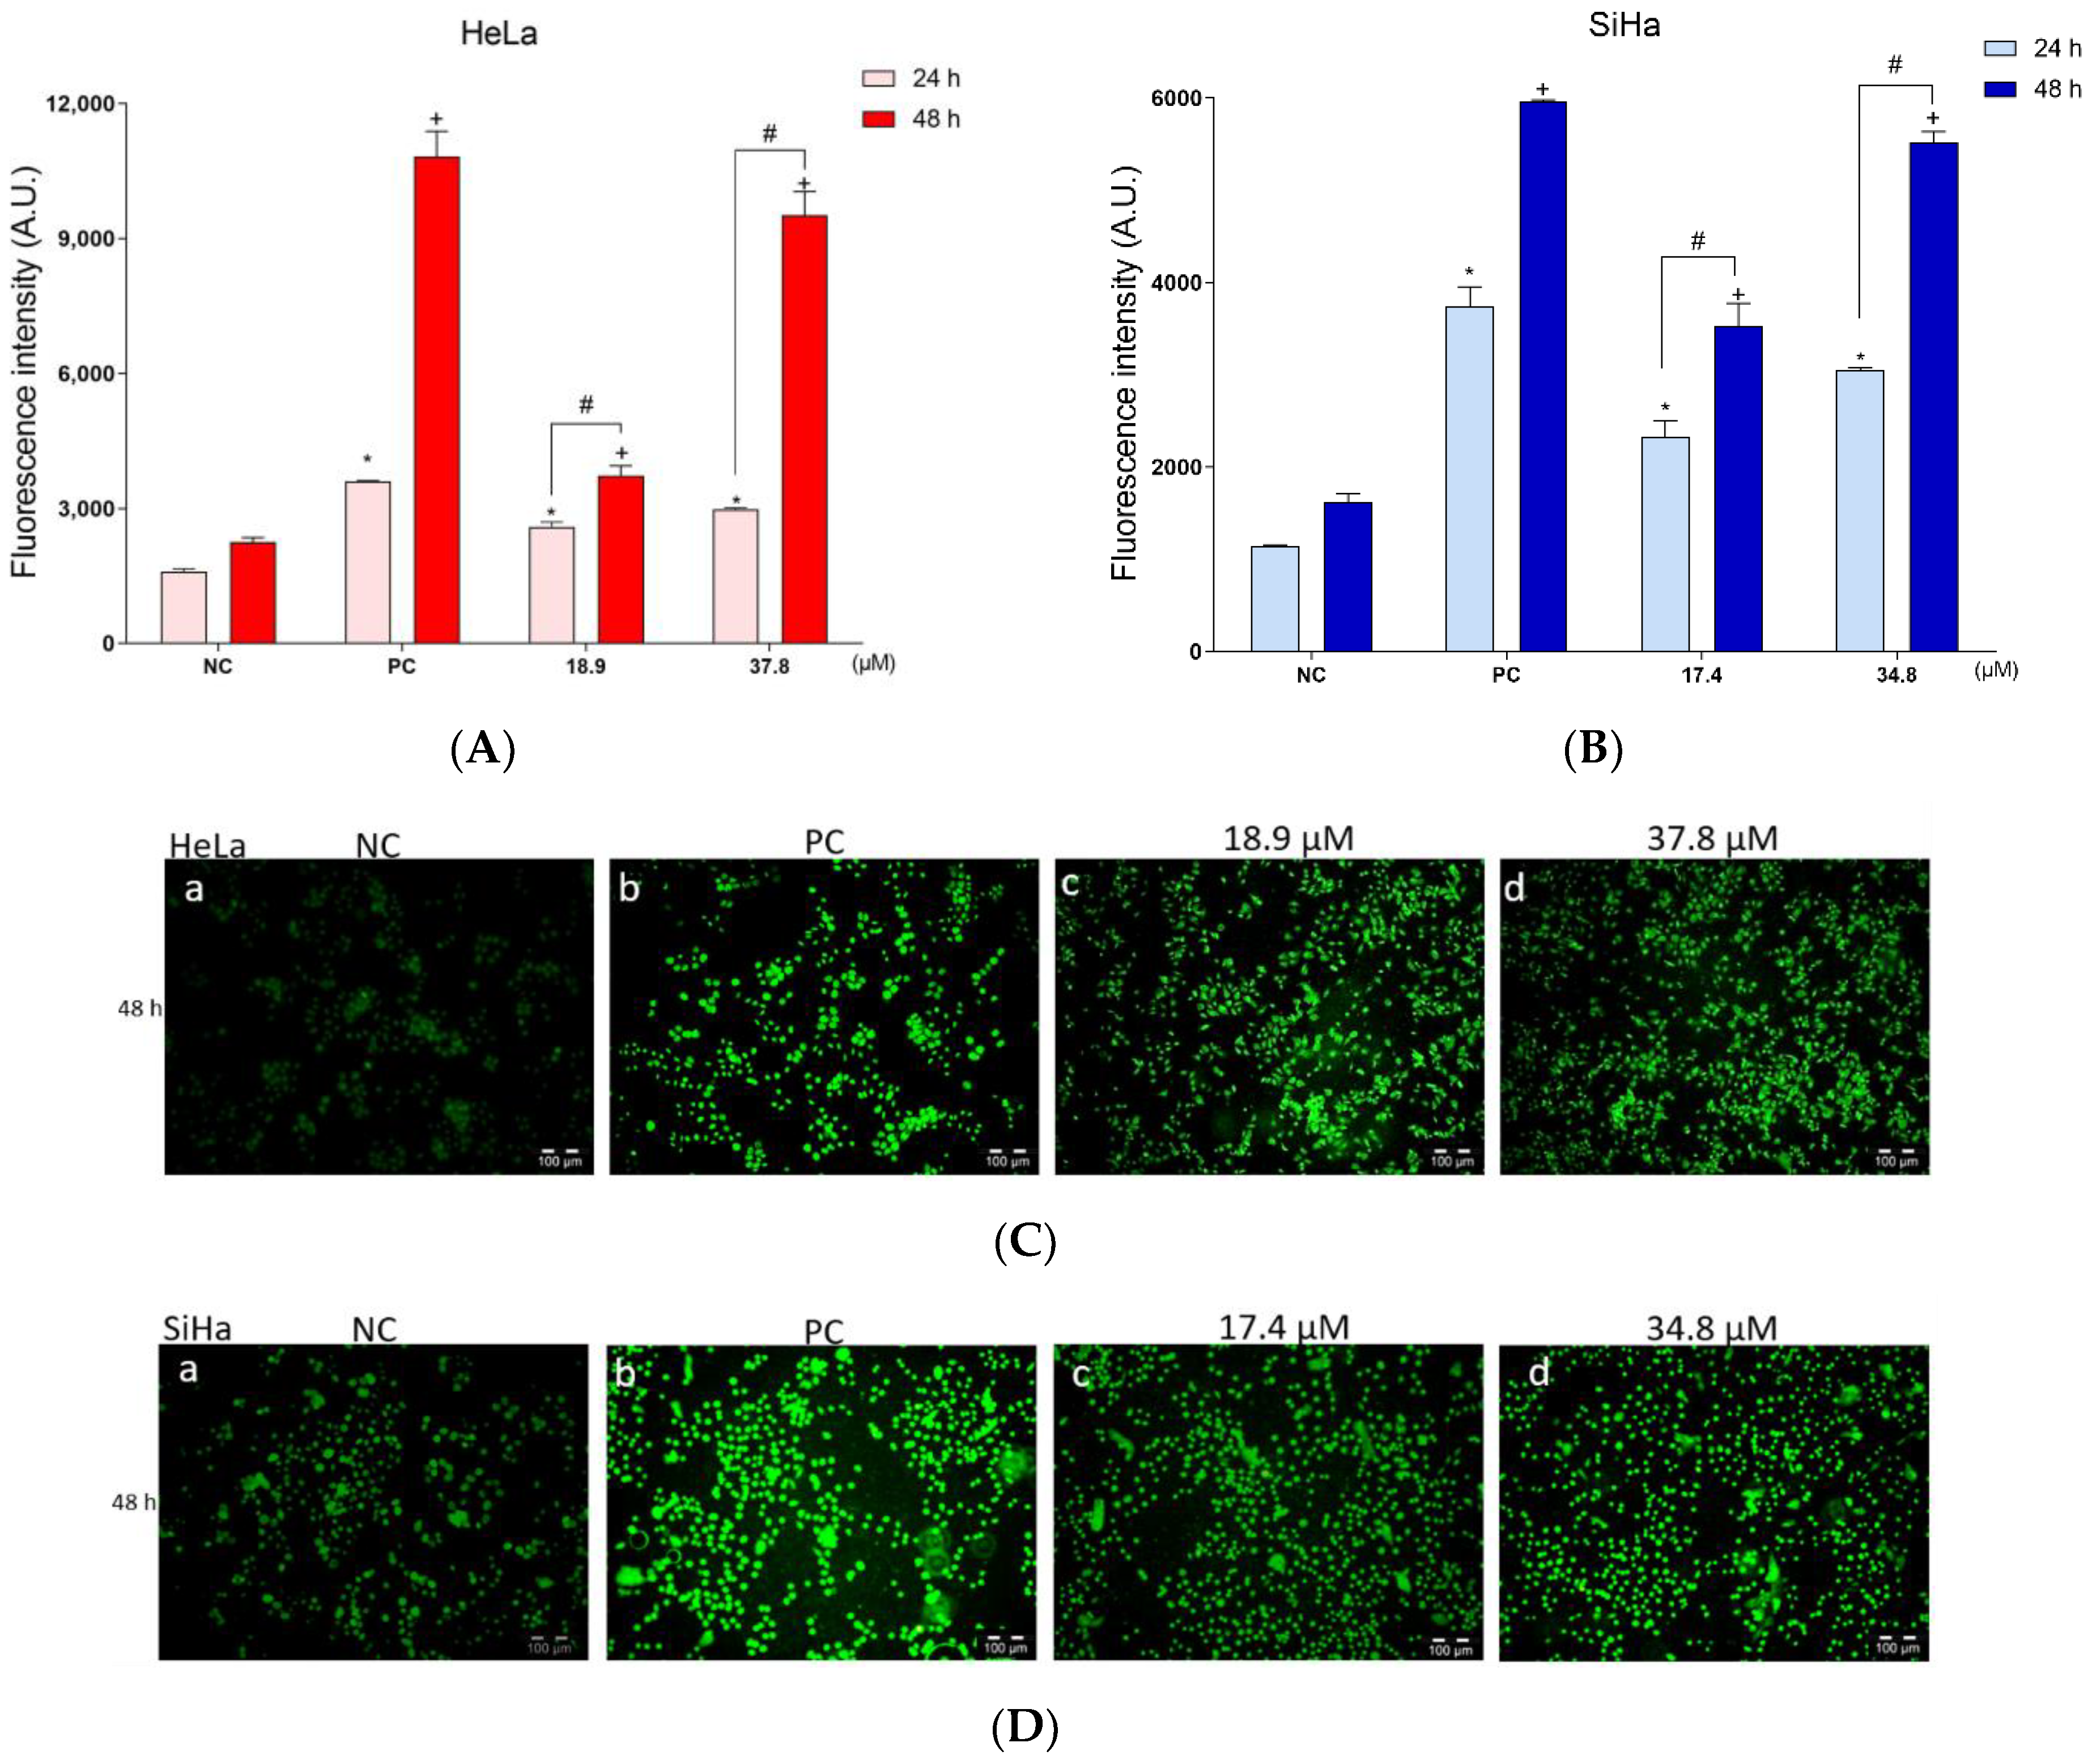
3.4. A3K2A3 Induces Oxidative Stress in Cells
Increased Production of ROS and Reduced Level of Antioxidant Defense in Cervical Cancer Cells
3.5. A3K2A3 Decreases in ΔΨm and Intracellular ATP Levels in Cervical Cancer Cell Lines
3.6. Effects of A3K2A3 on the Membrane of Cells
A3K2A3 Induce LPO and Cell Membrane Damage of Cervical Cancer Cells
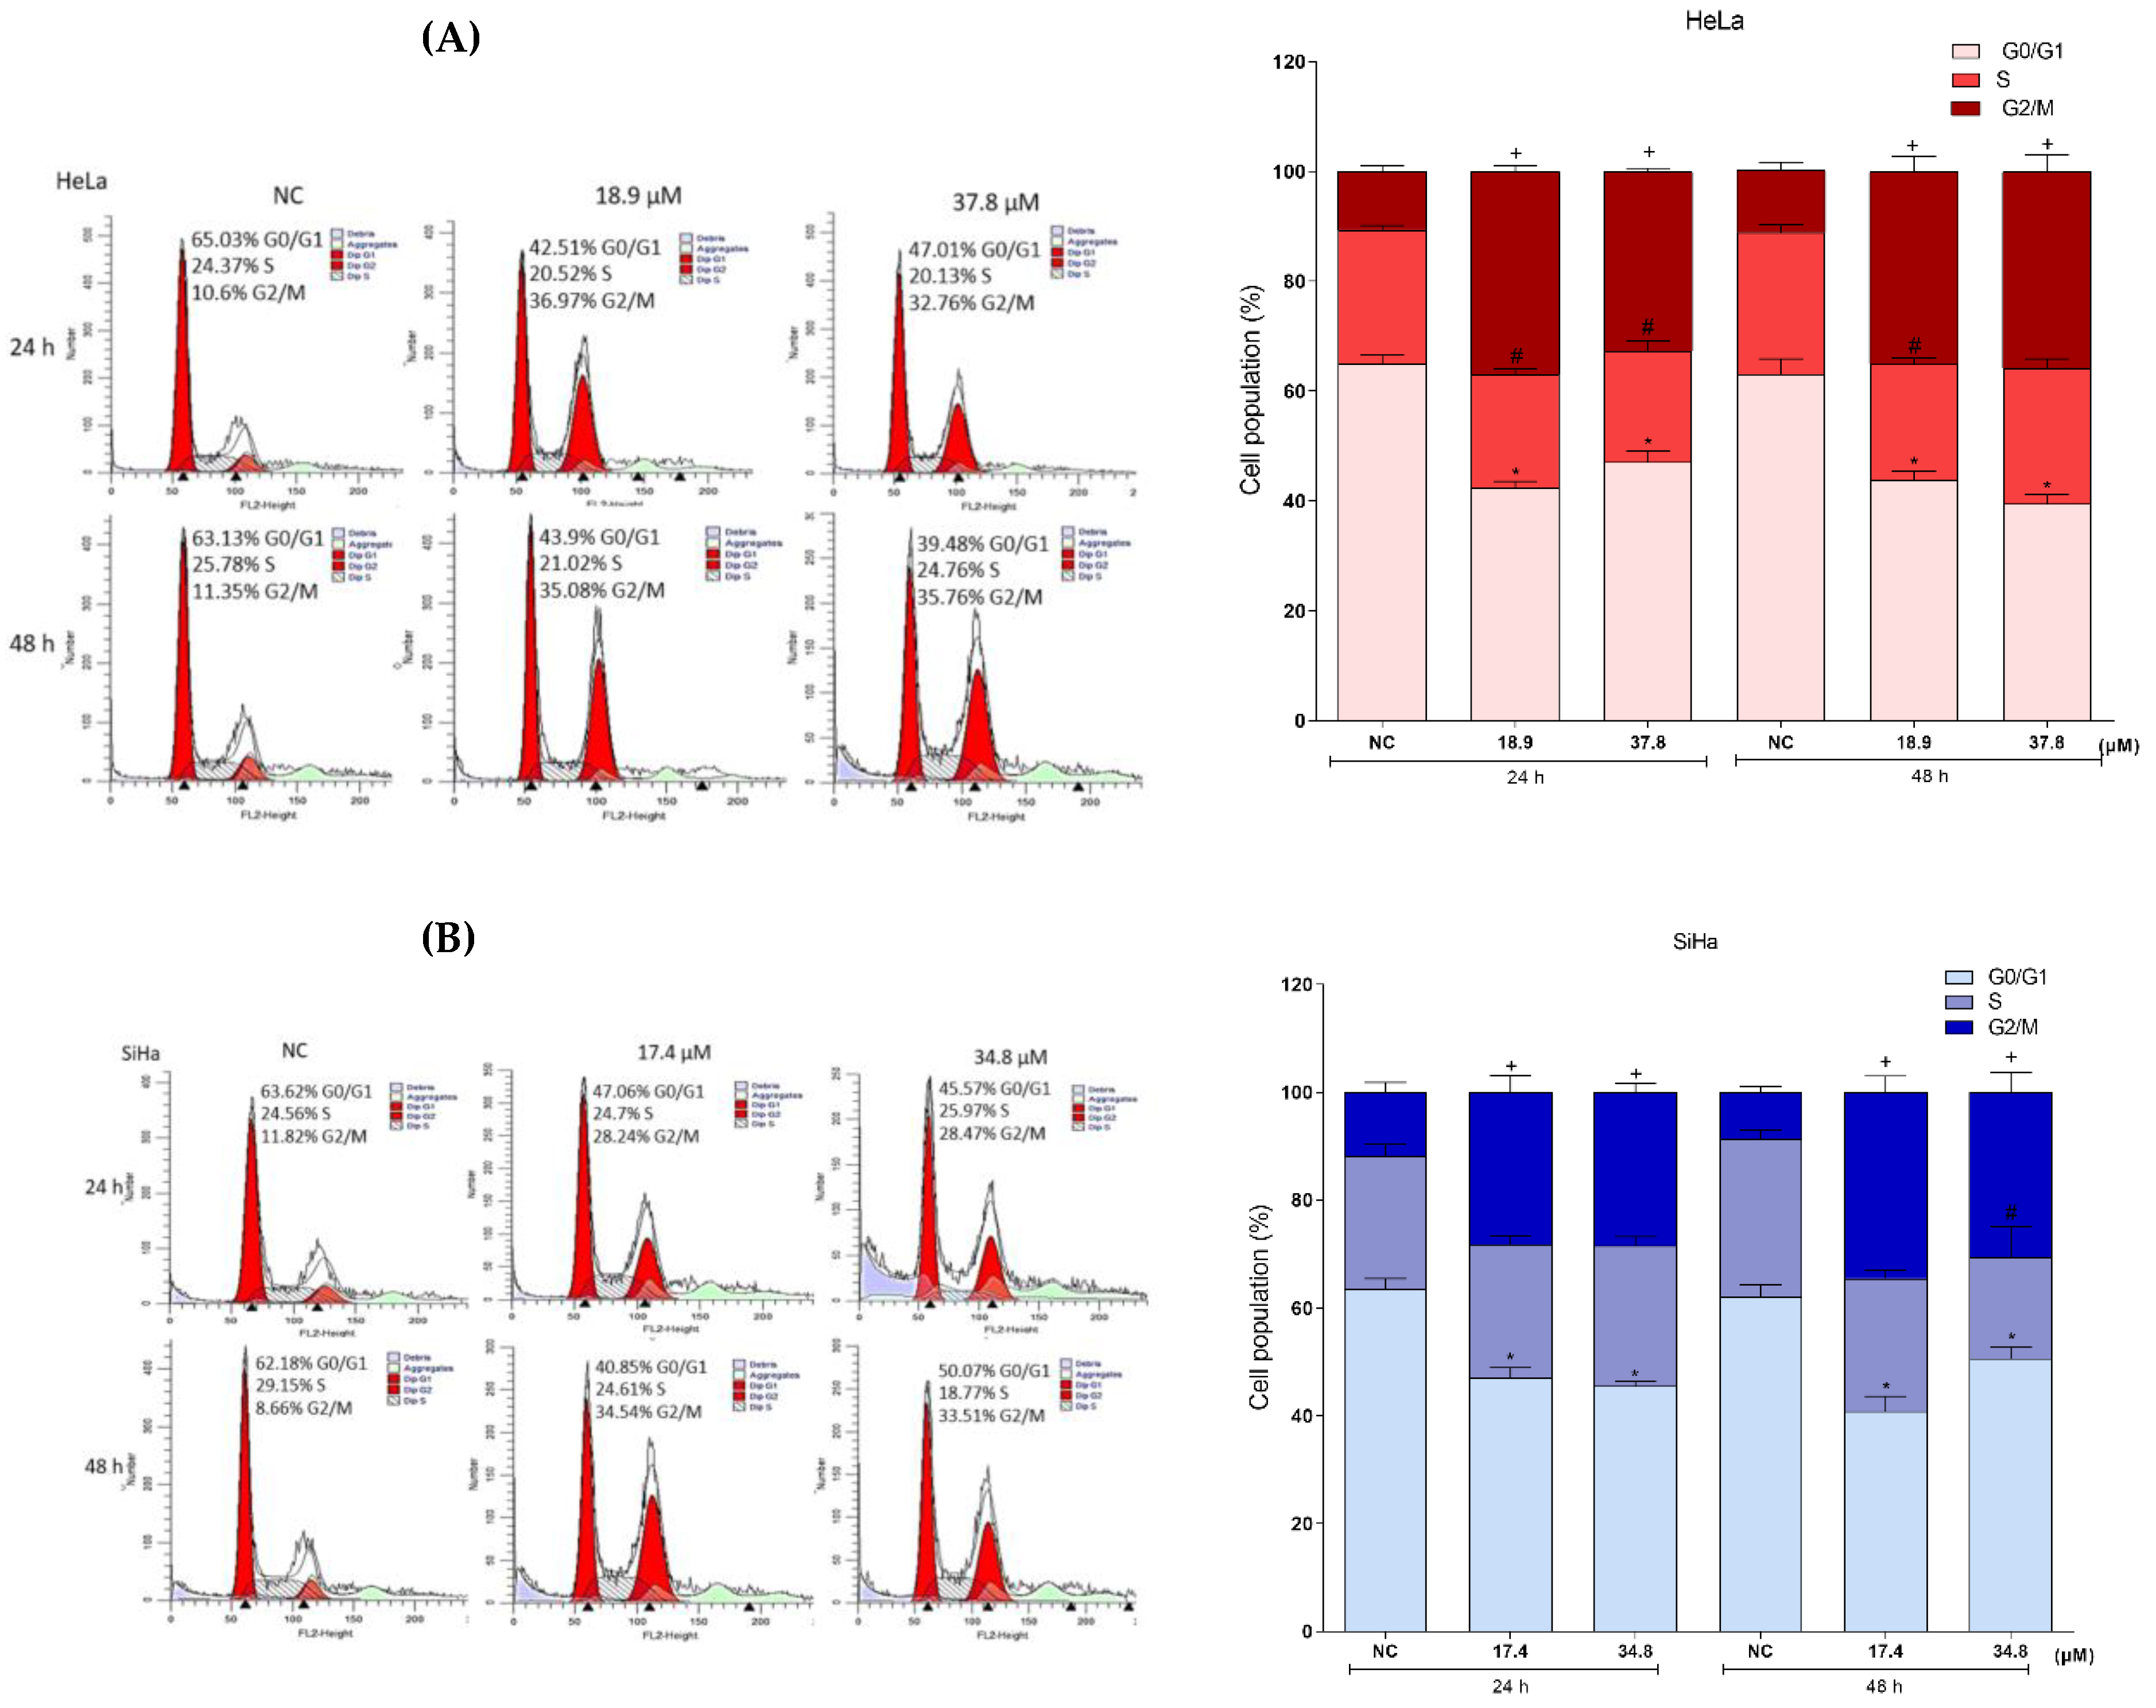
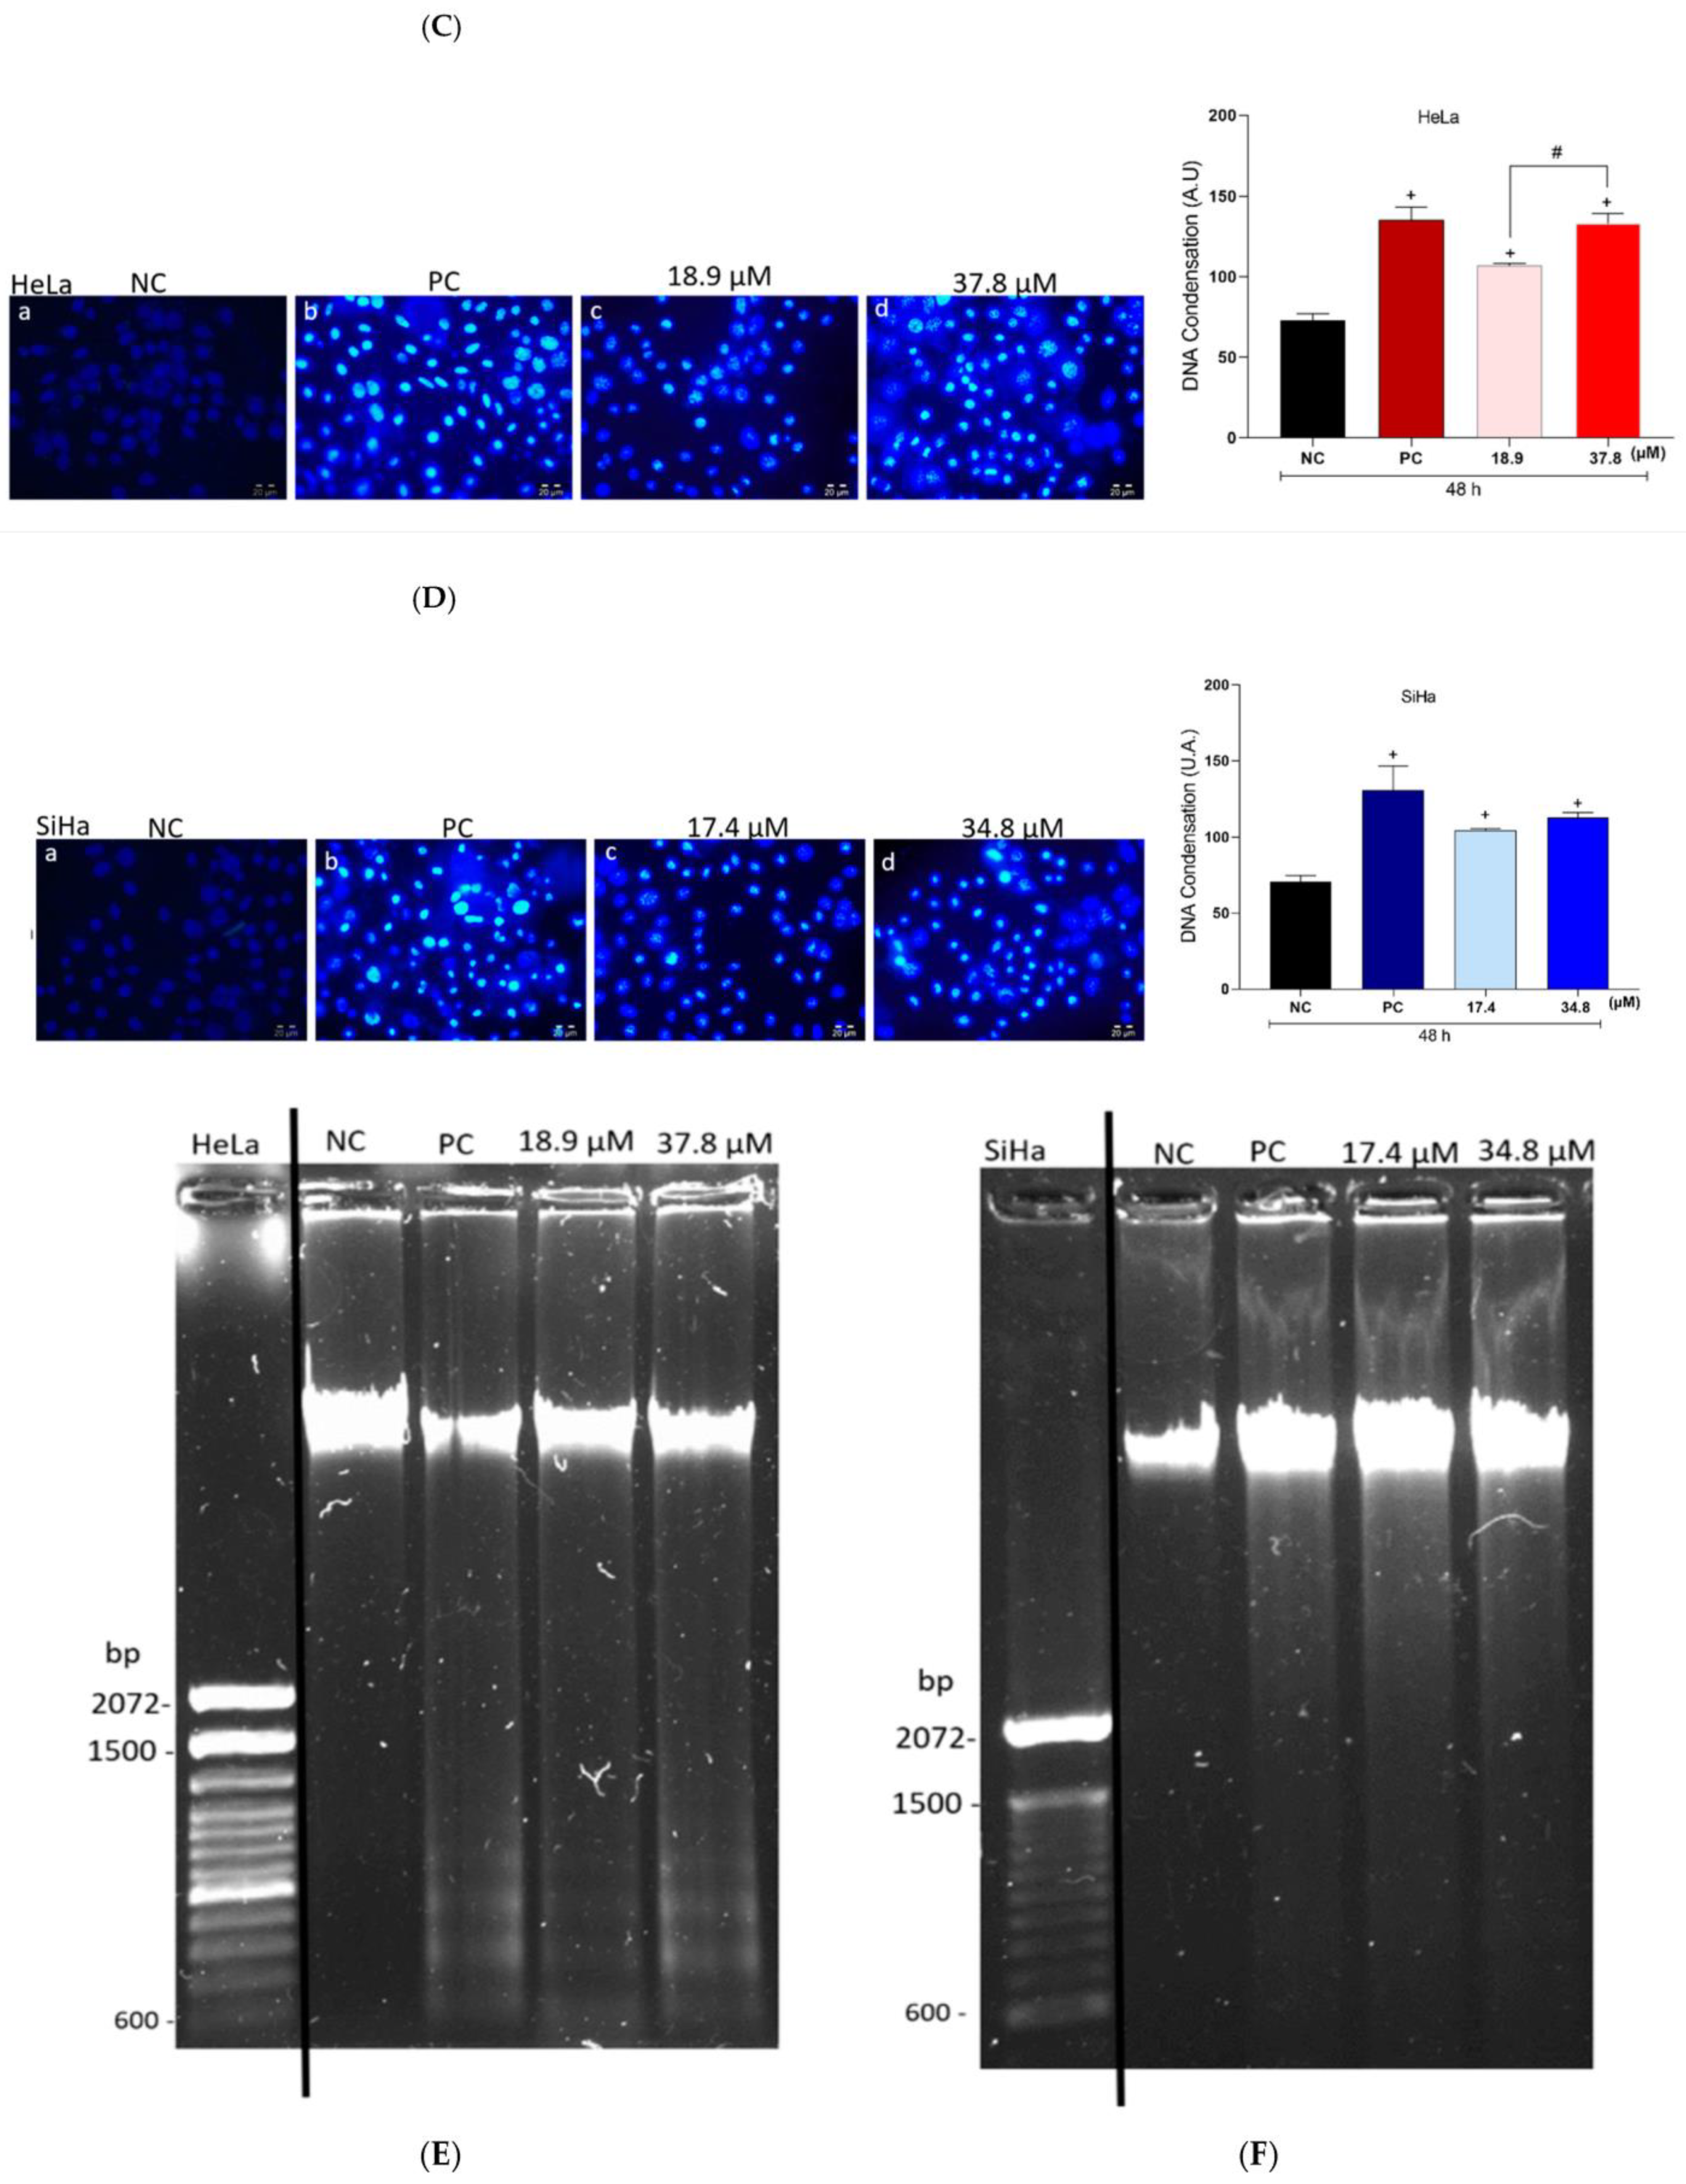
3.7. Effects of A3K2A3 on the DNA of Cells
A3K2A3 Induces Cell Cycle Arrest in G2/M, Cell Chromatin Condensation, and DNA Fragmentation in Cervical Cancer Cells
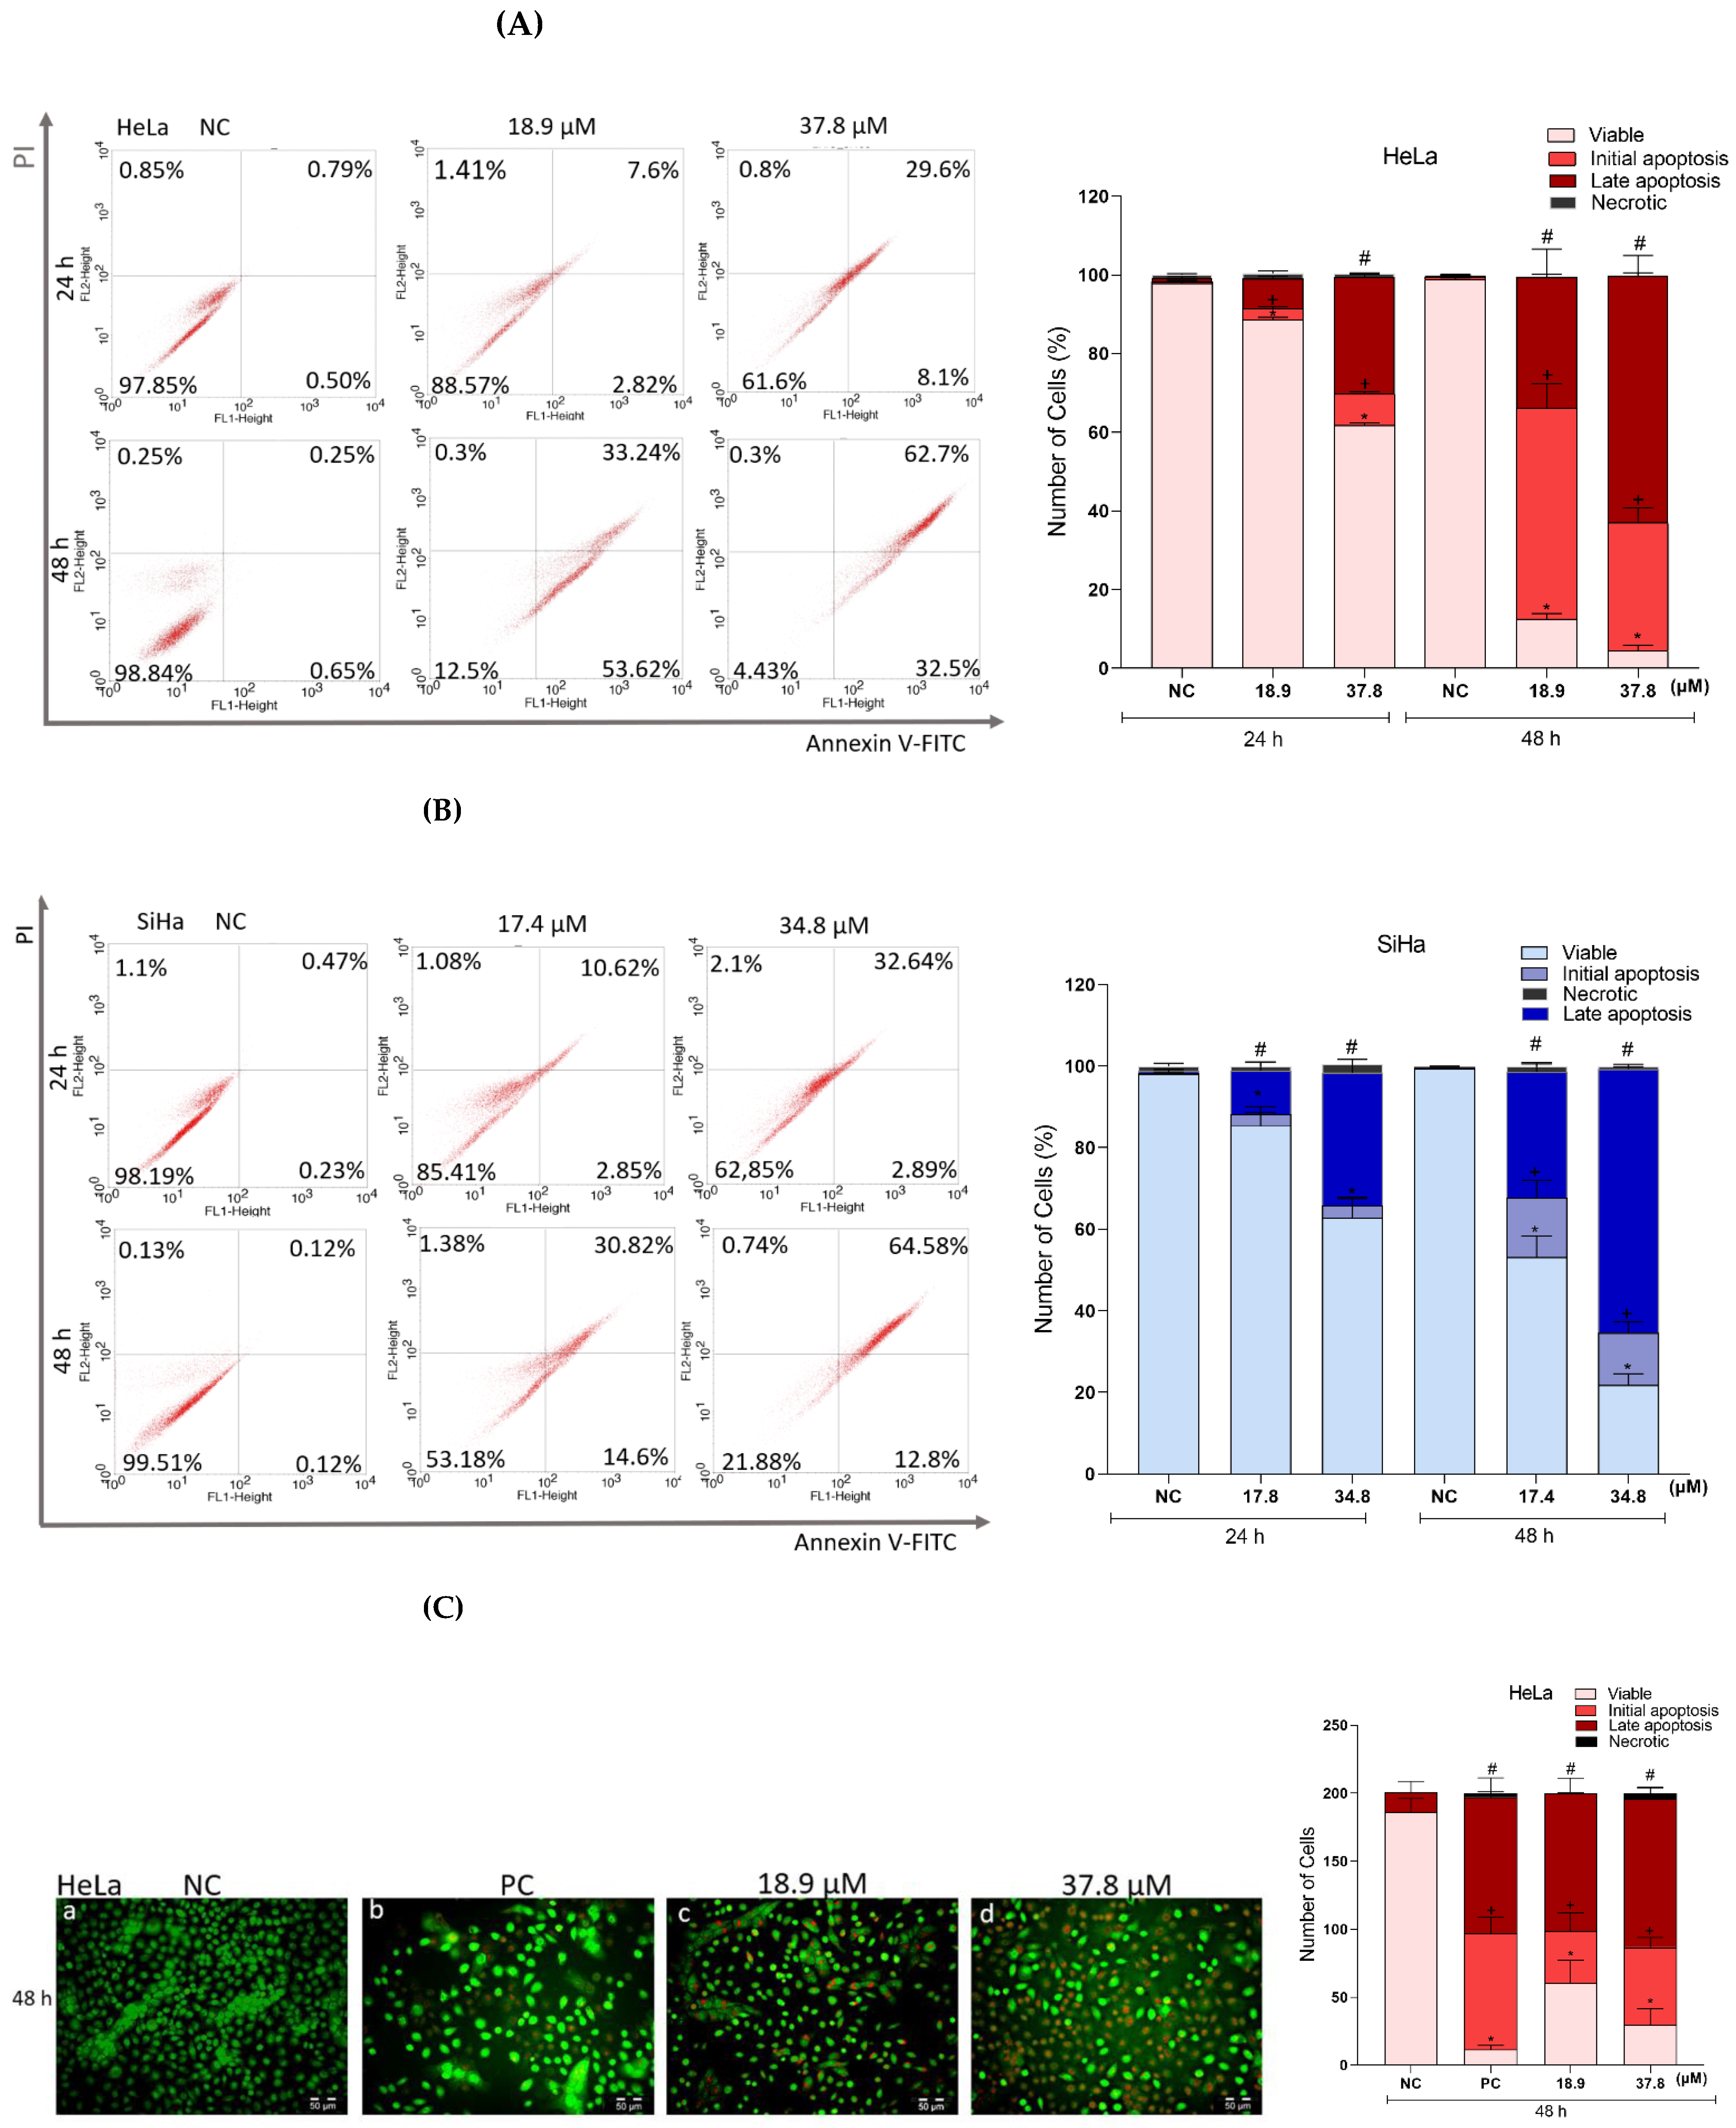
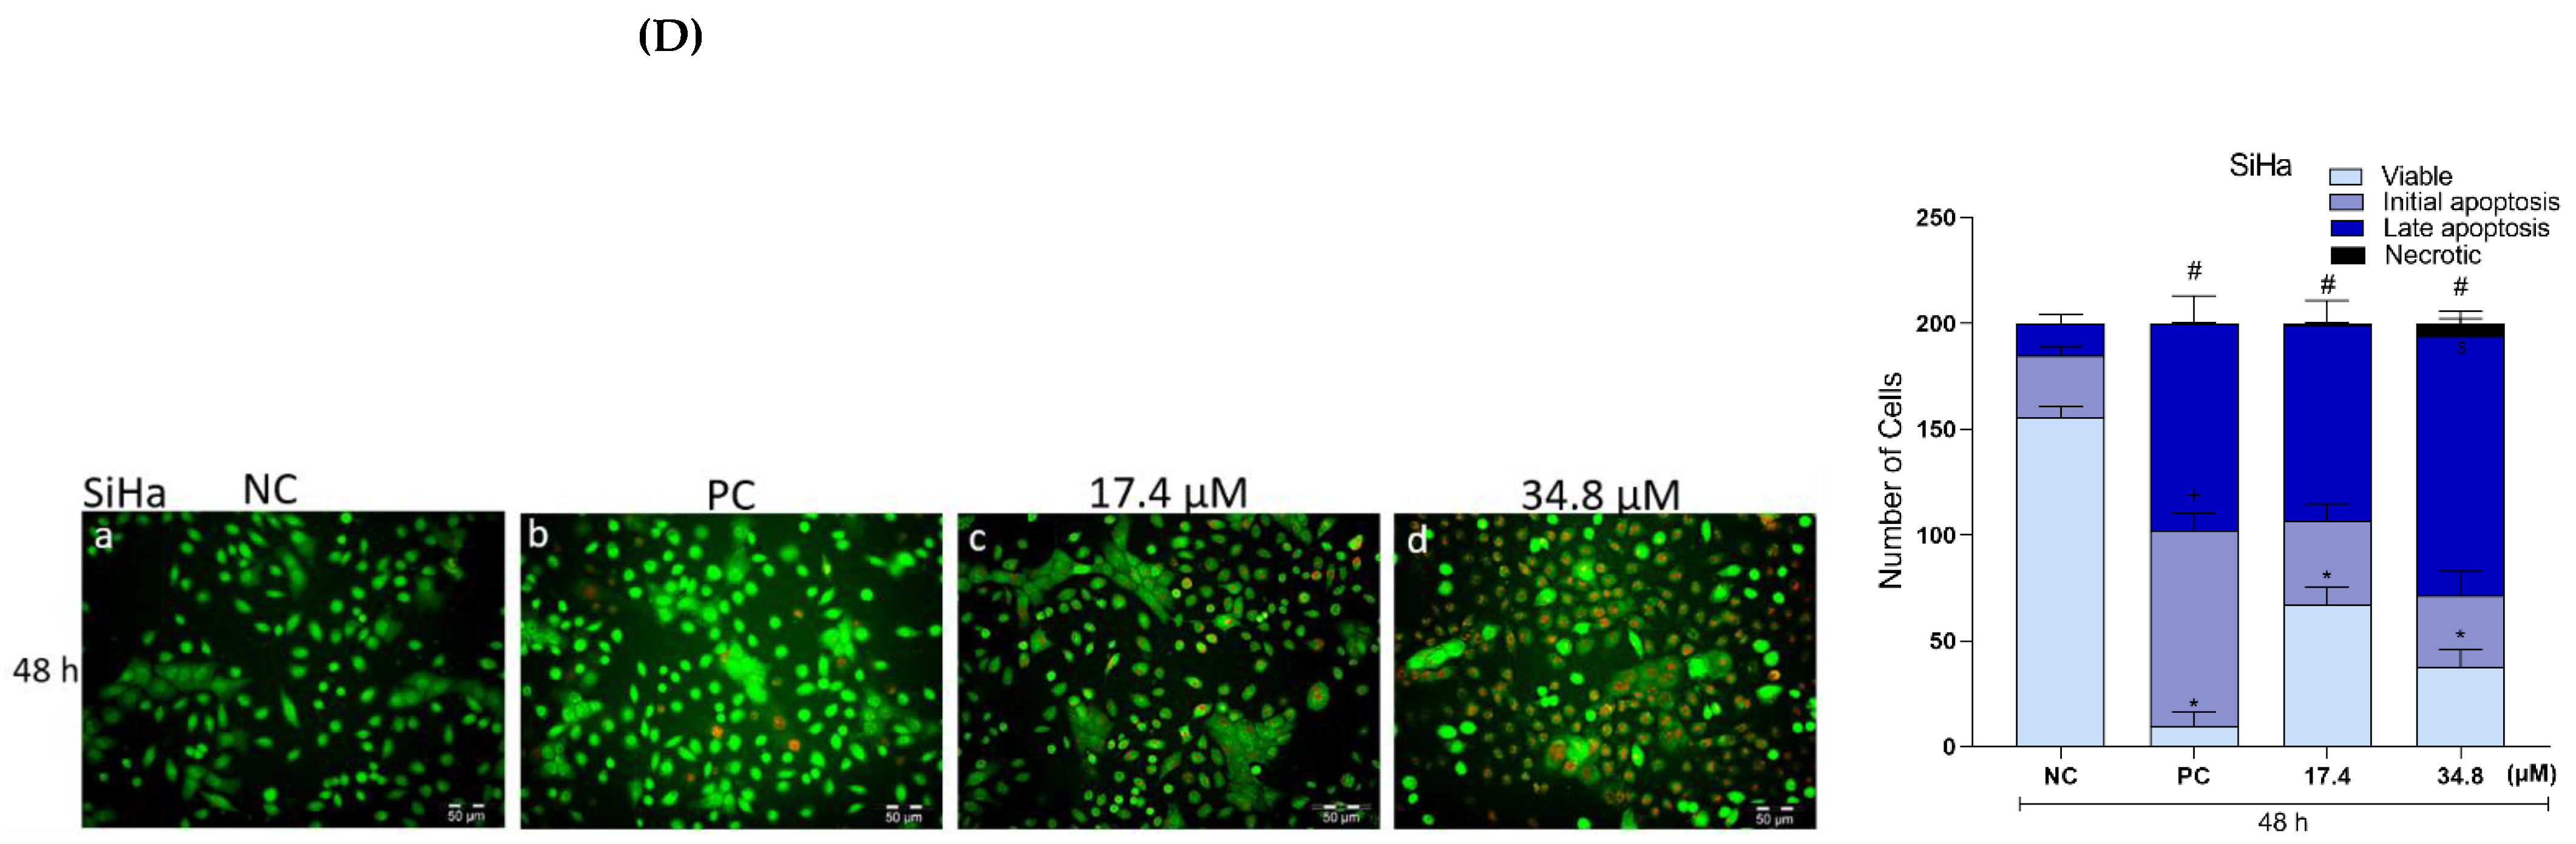
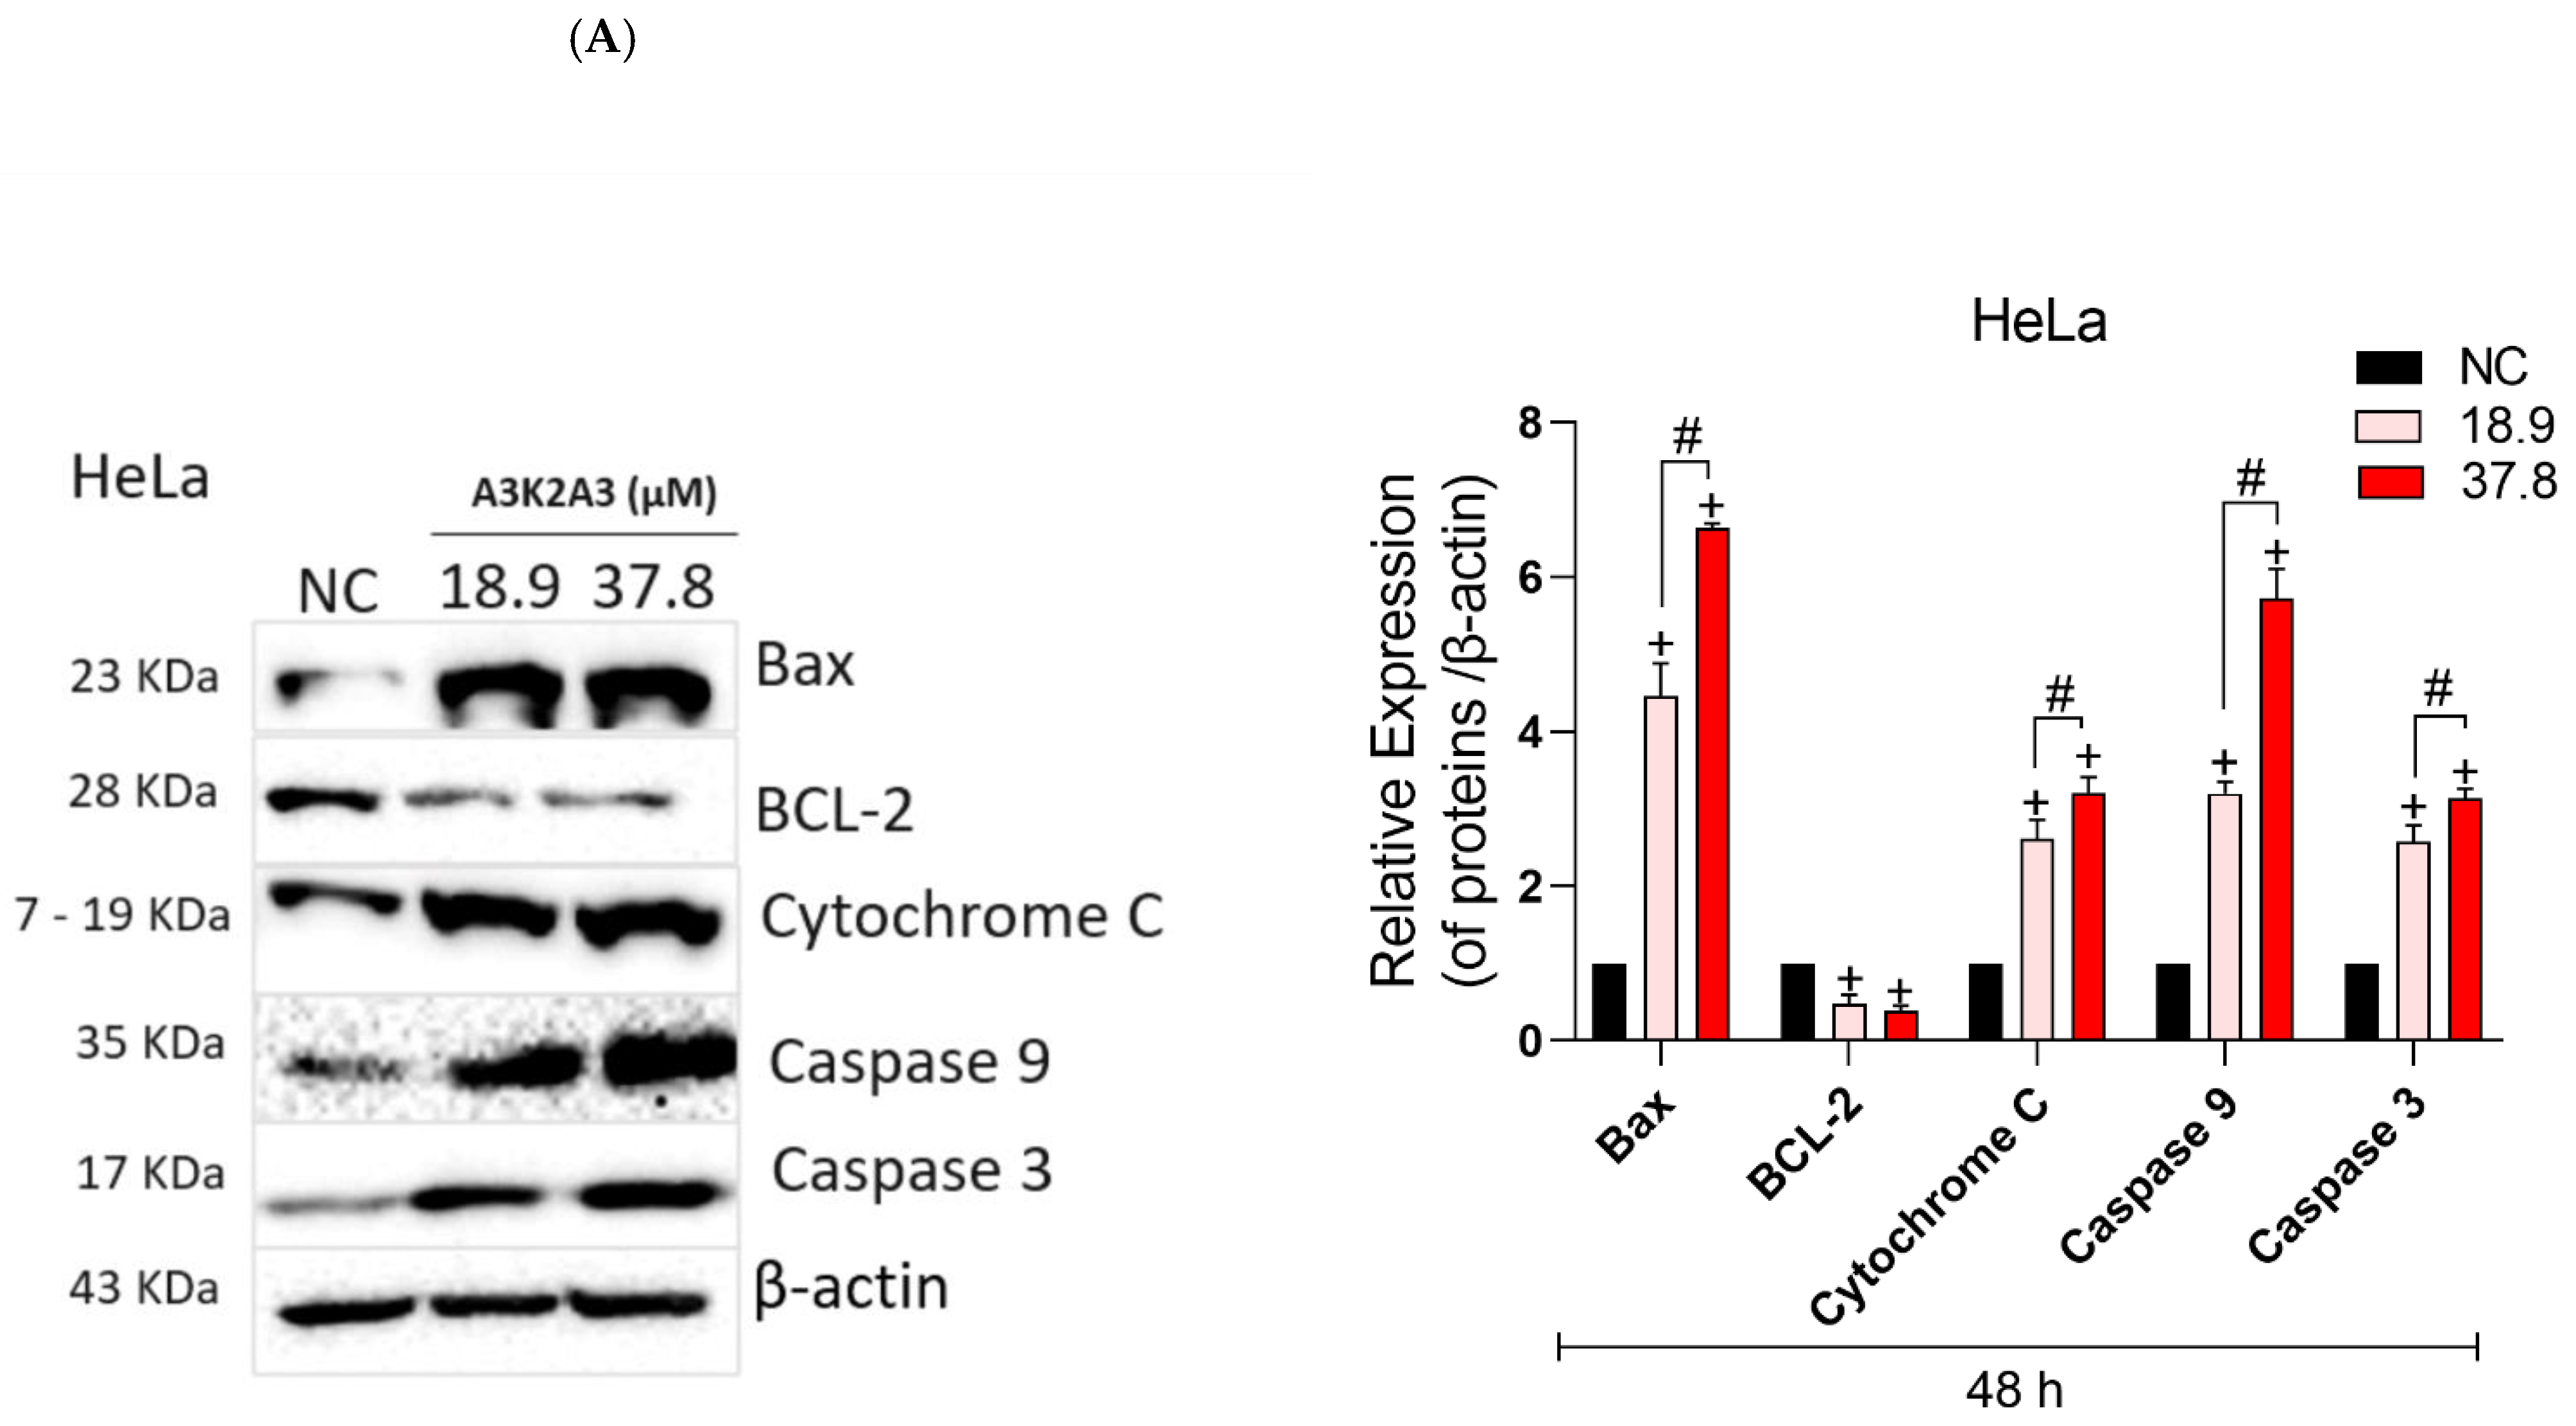
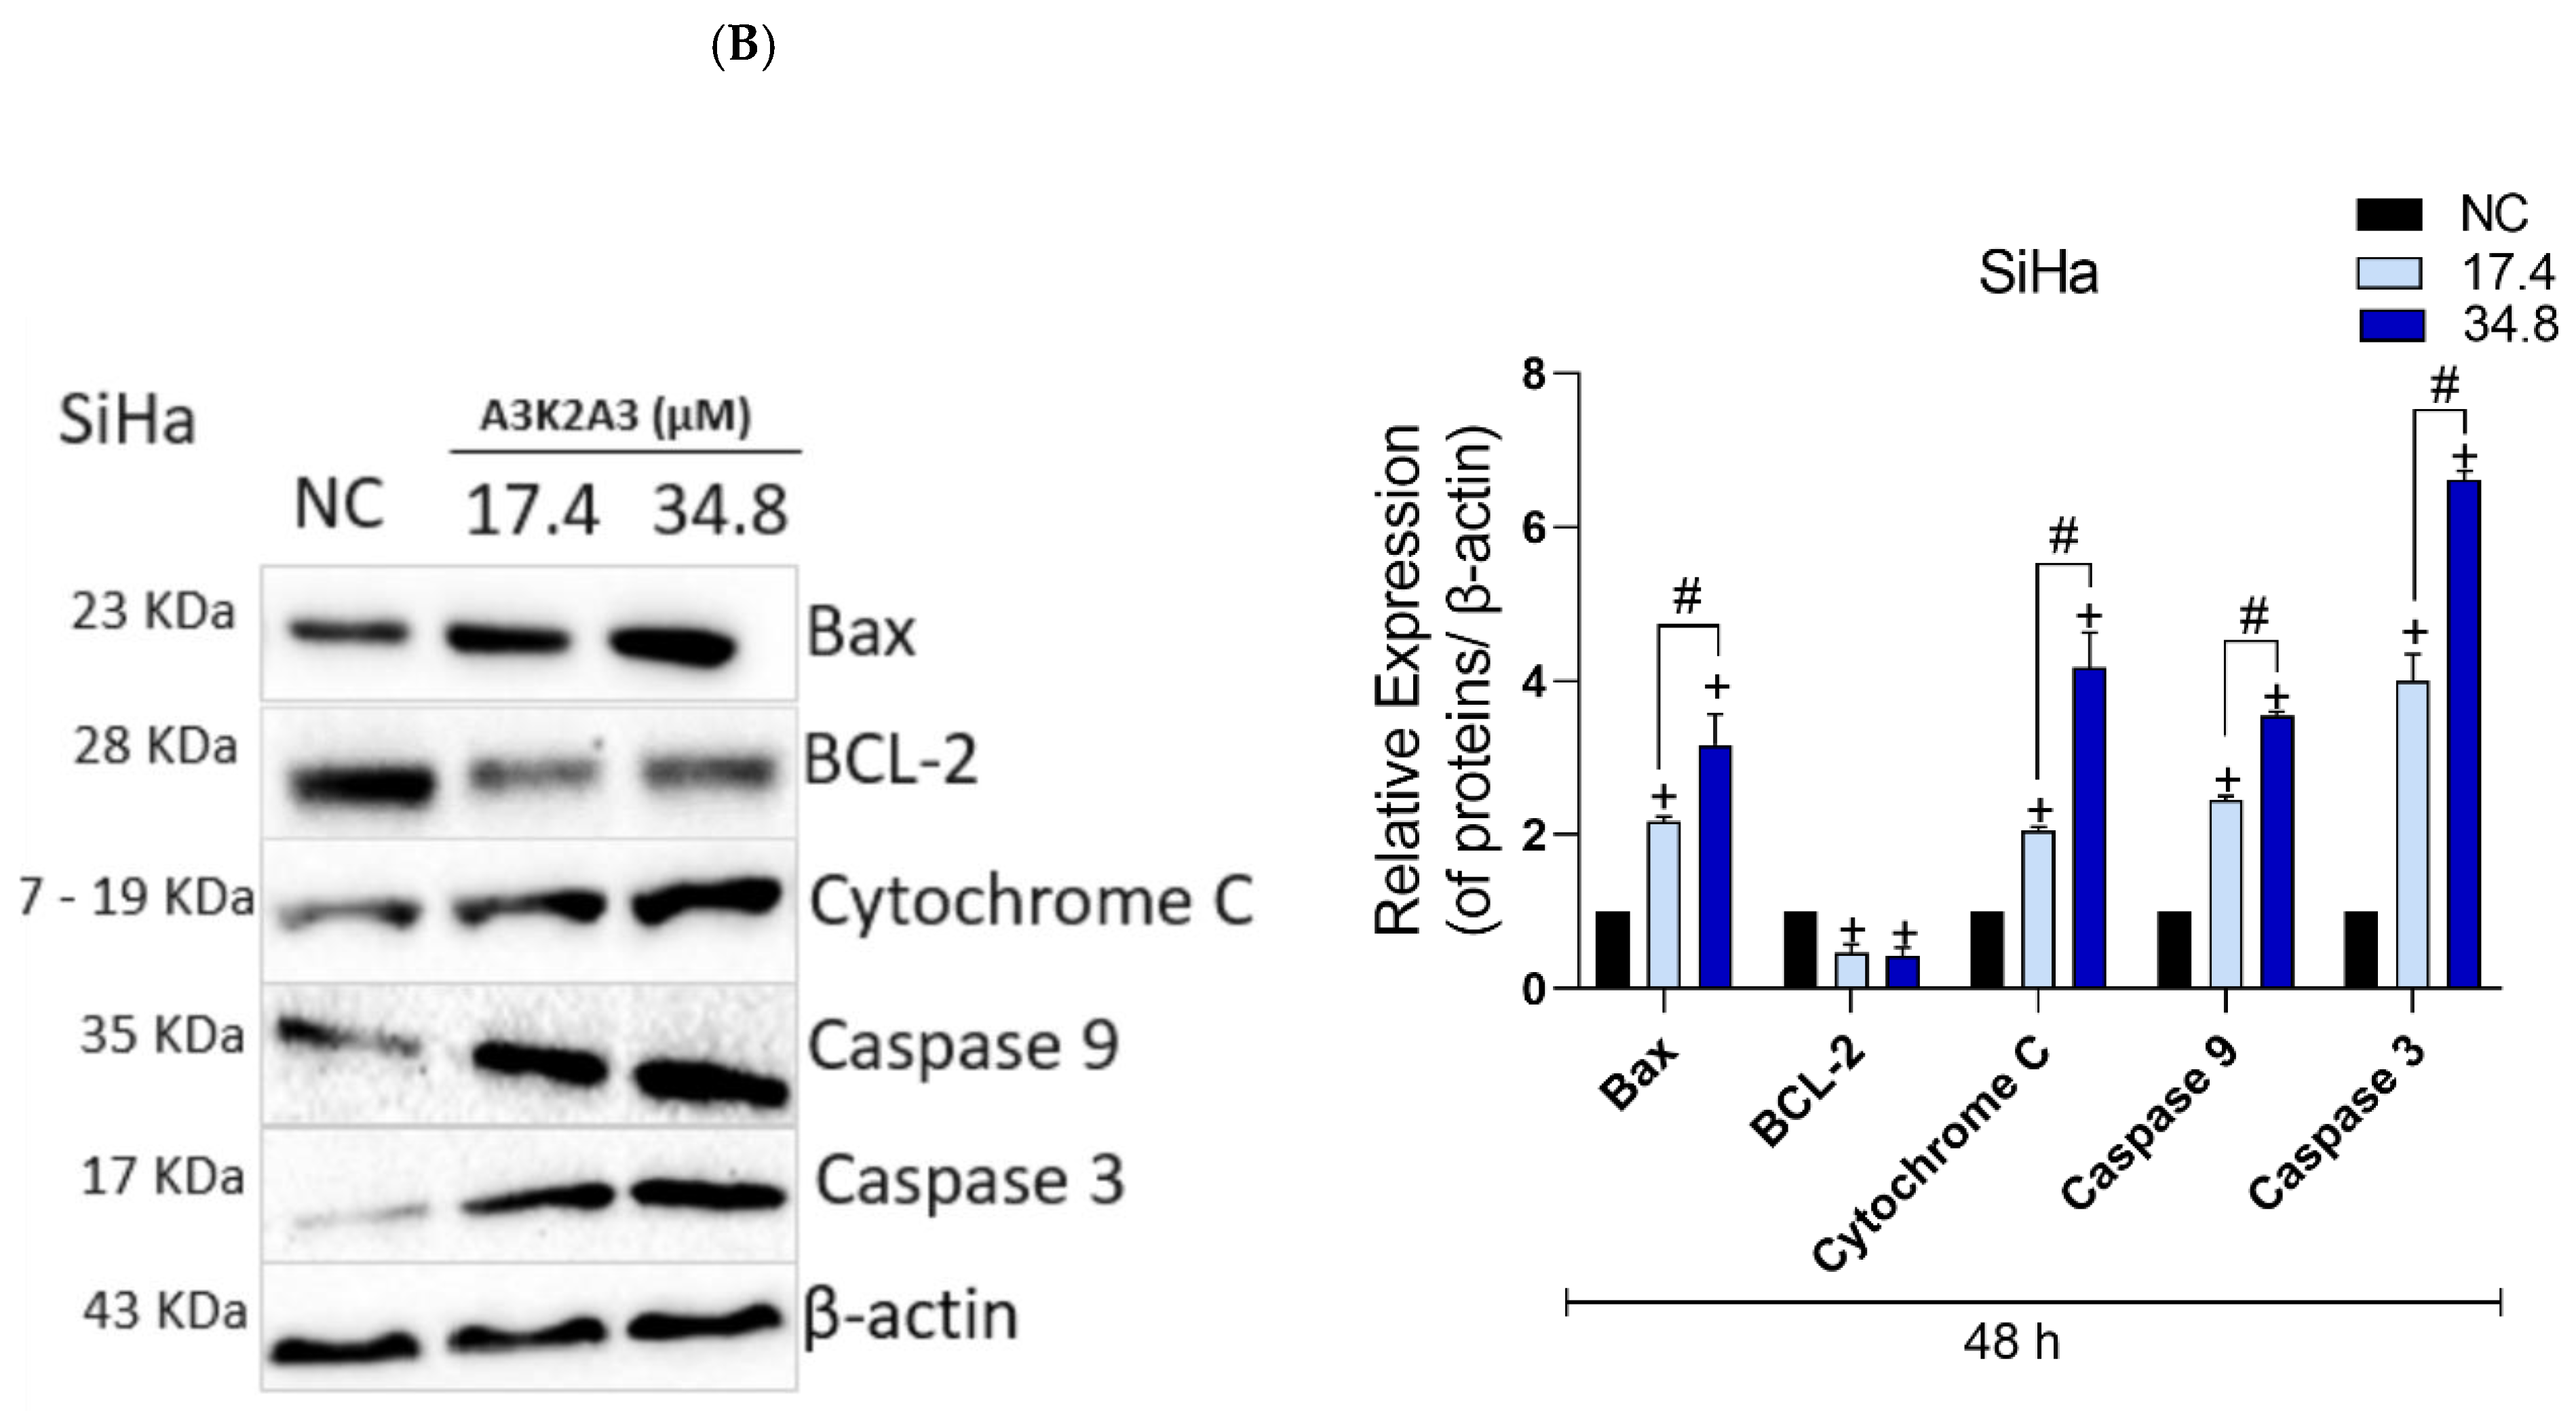
3.8. Effects of A3K2A3 on the Possible Type of Death Induced in Cells
A3K2A3 Induces Apoptosis in Cervical Cancer Cells


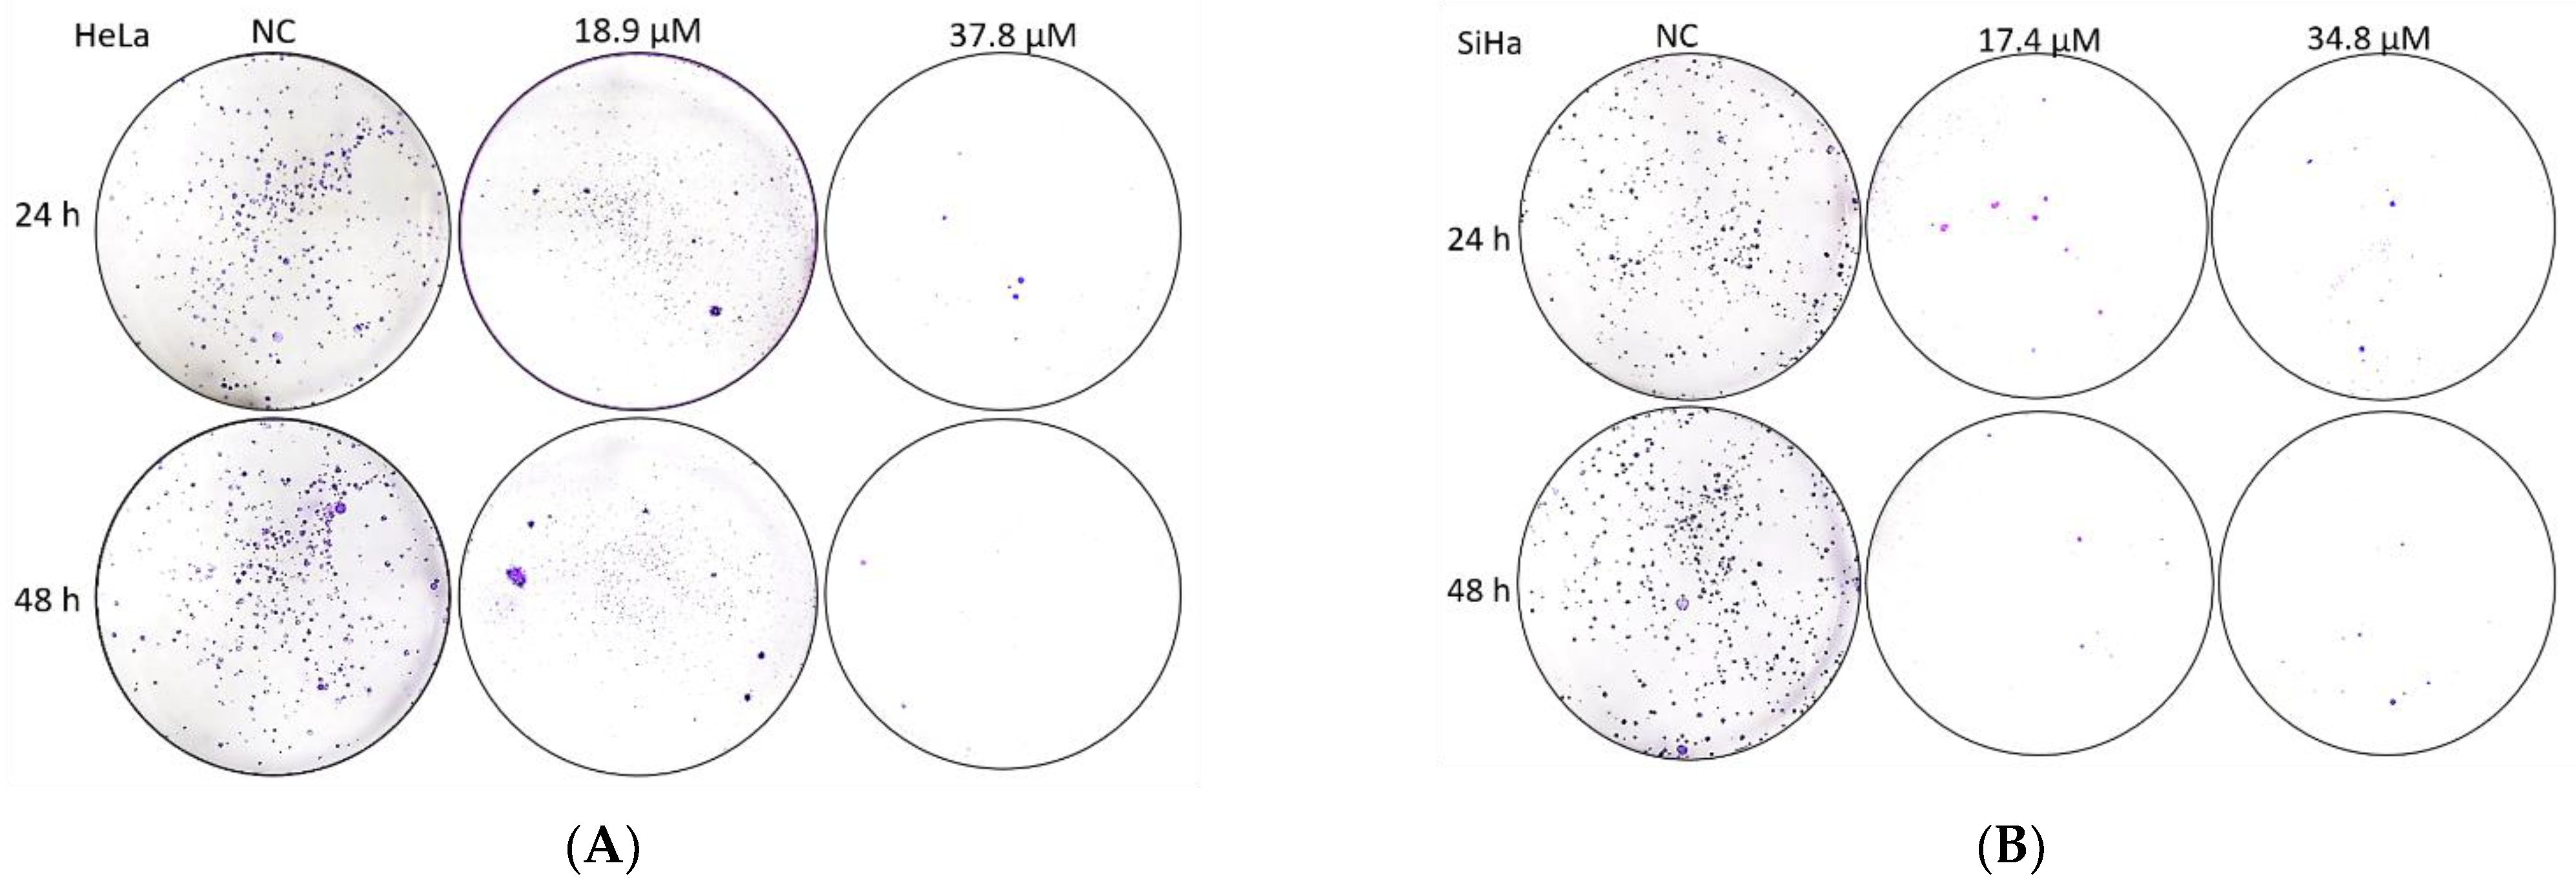
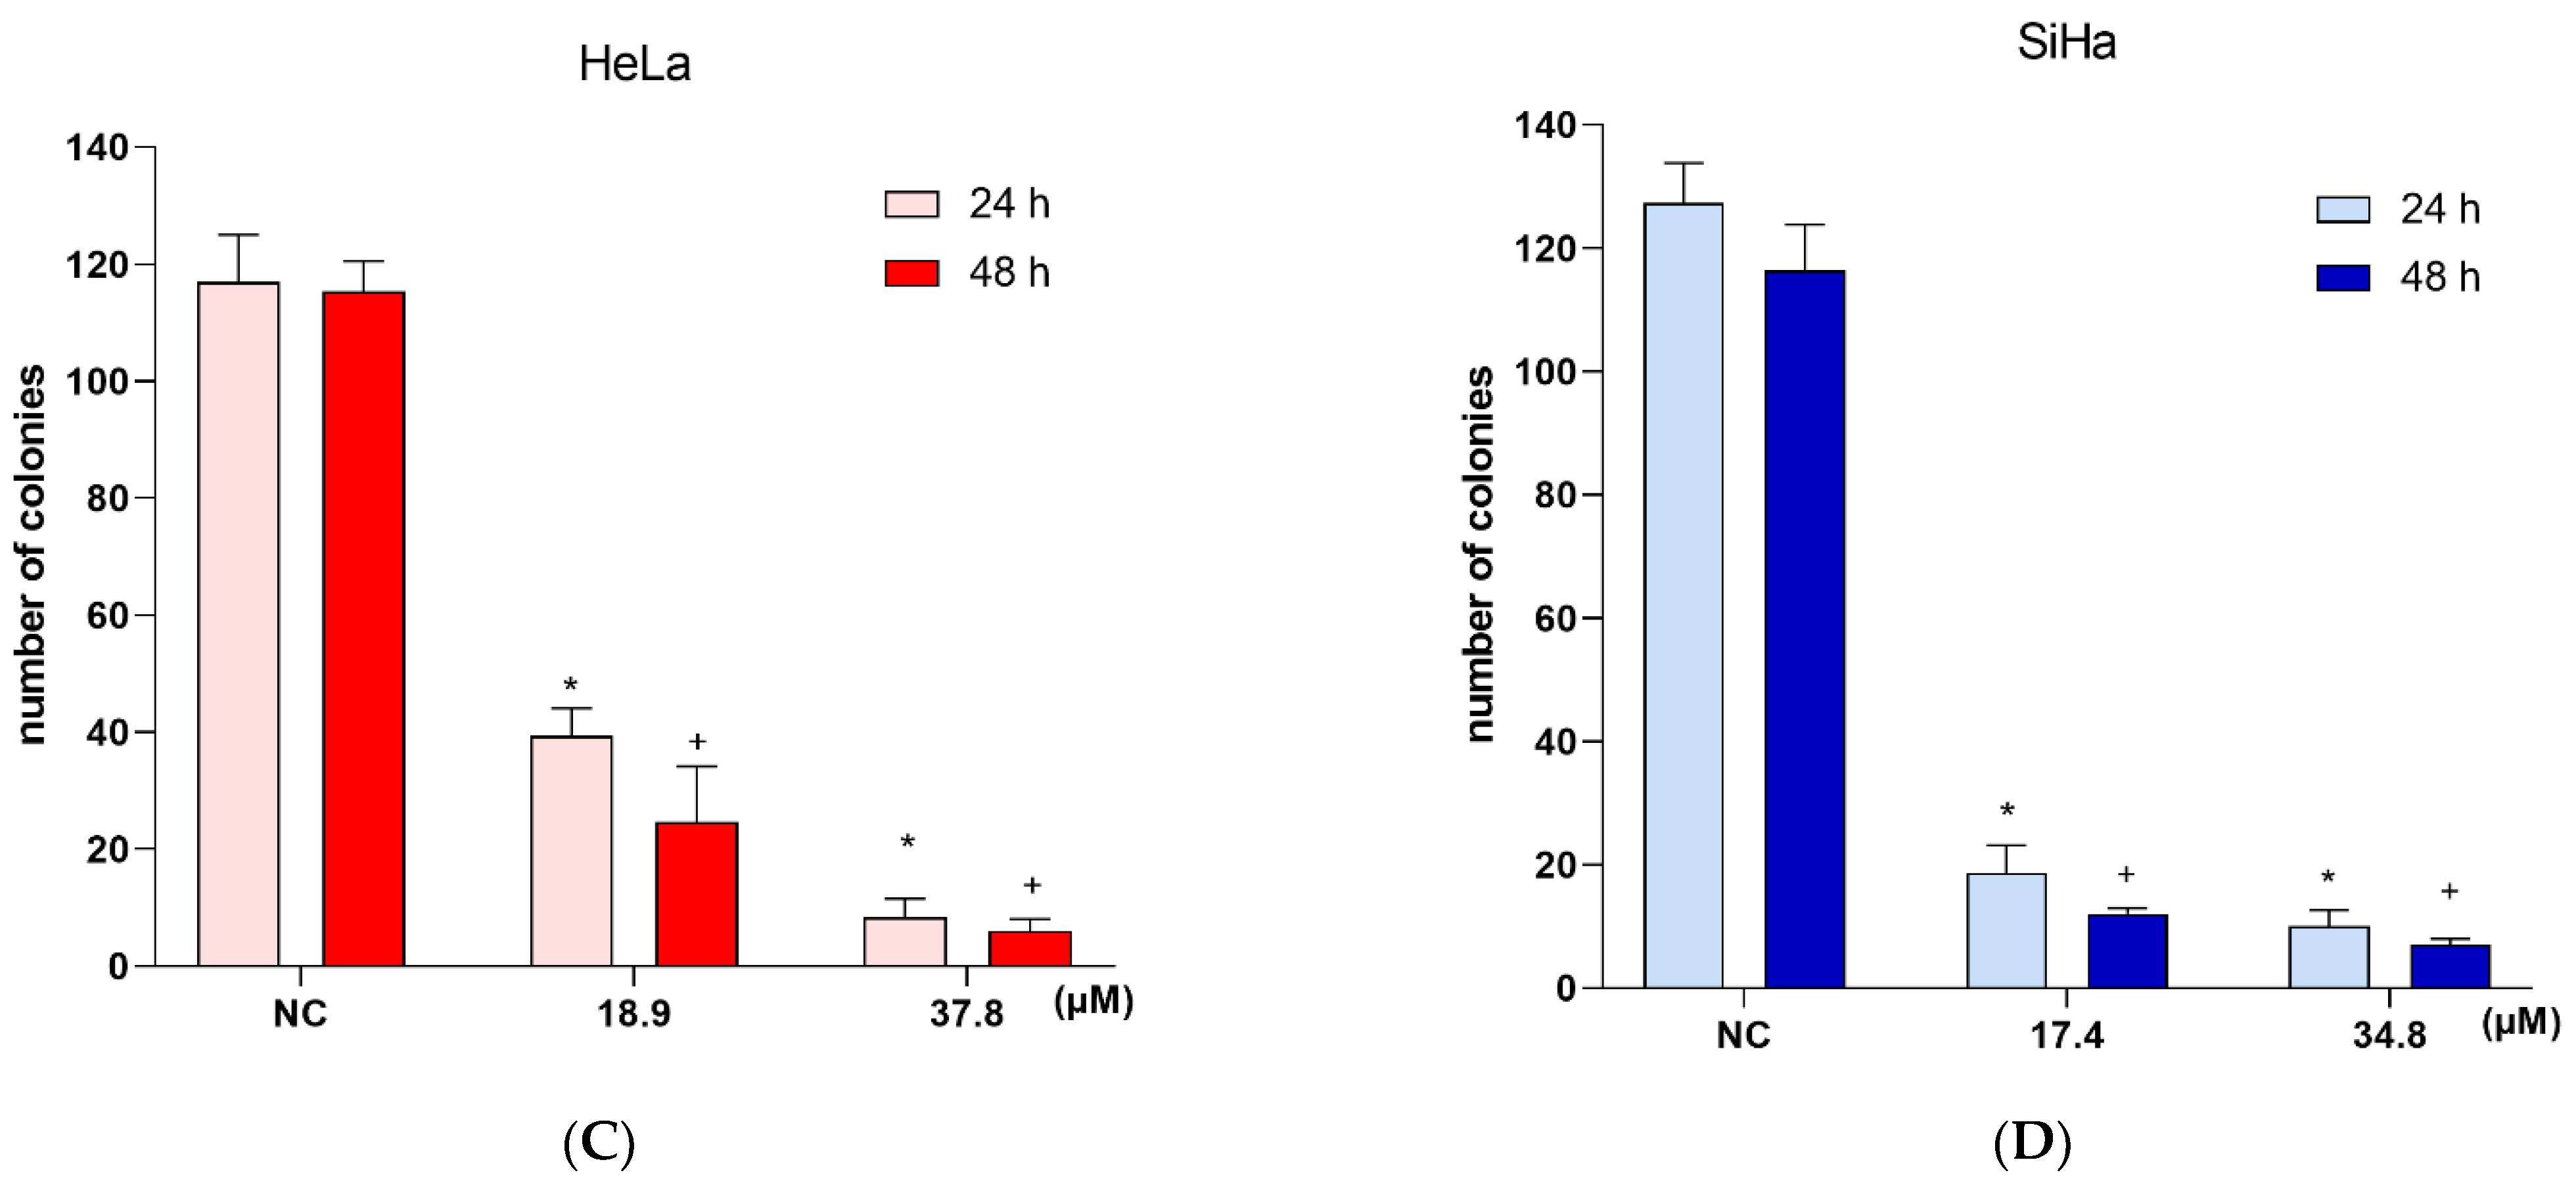
3.9. Effects of A3K2A3 on Cell Survival
A3K2A3 Reduces Colony Formation of Cervical Cancer Cells
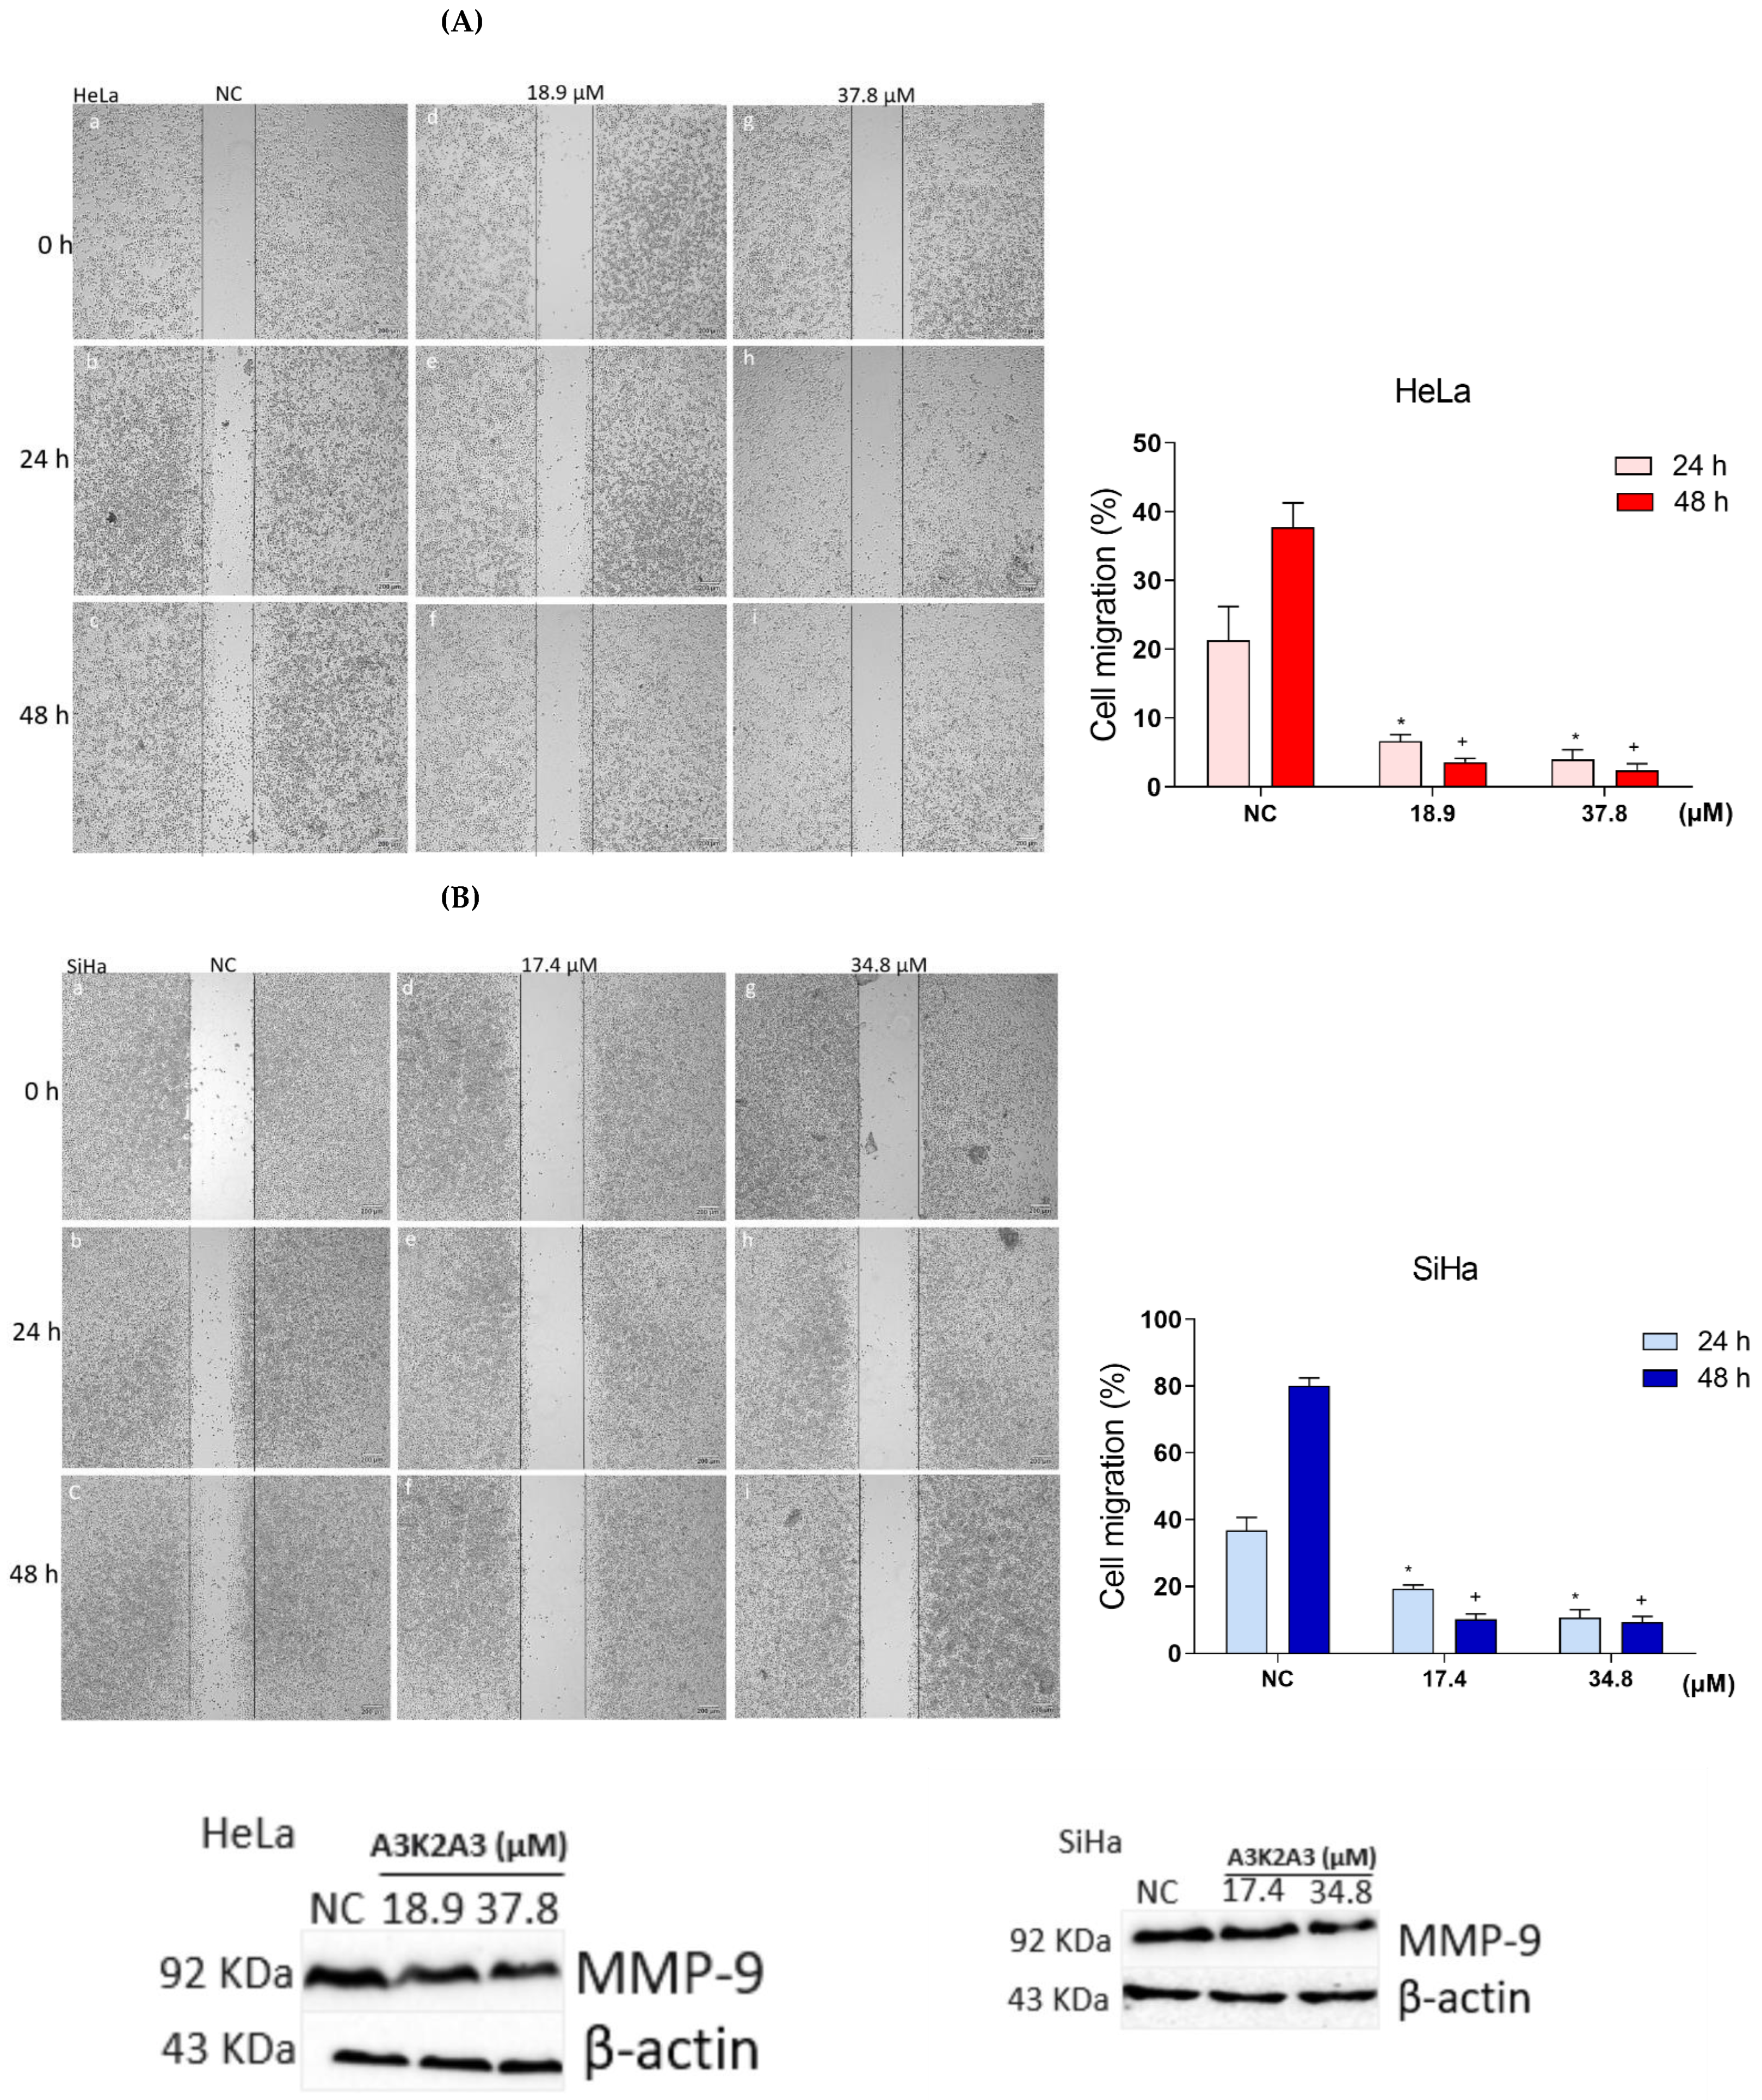
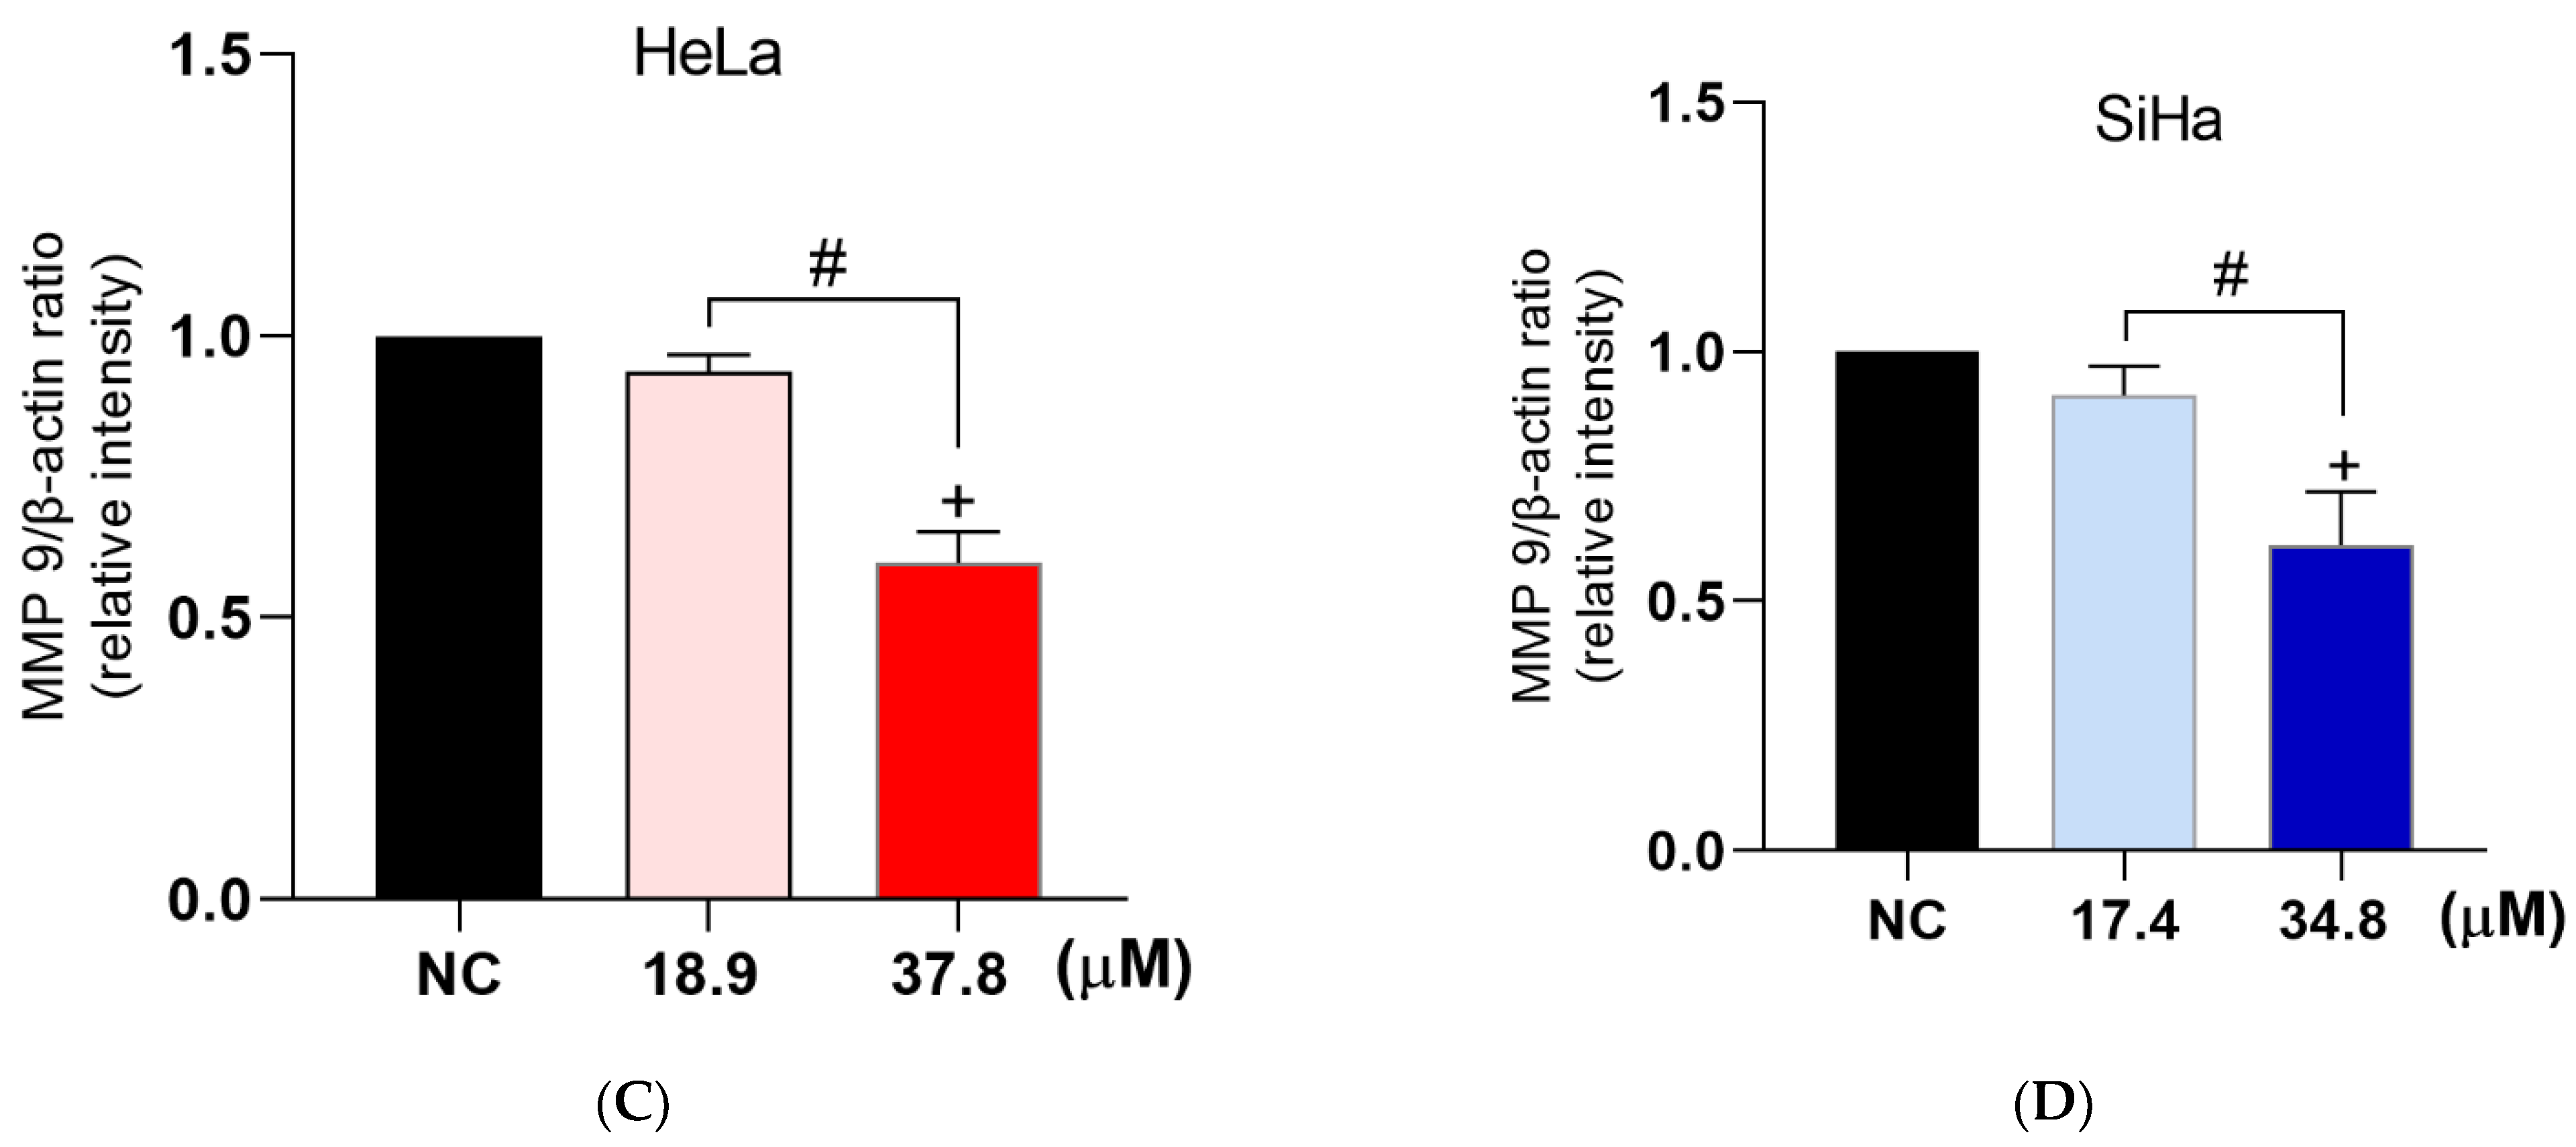
3.10. Effects of A3K2A3 on Cell Migration
A3K2A3 Inhibited Cell Migration and Decreases the Expression of MMP-9 in Cervical Cancer Cells


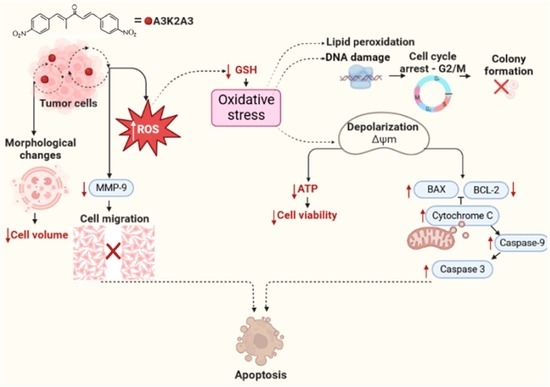
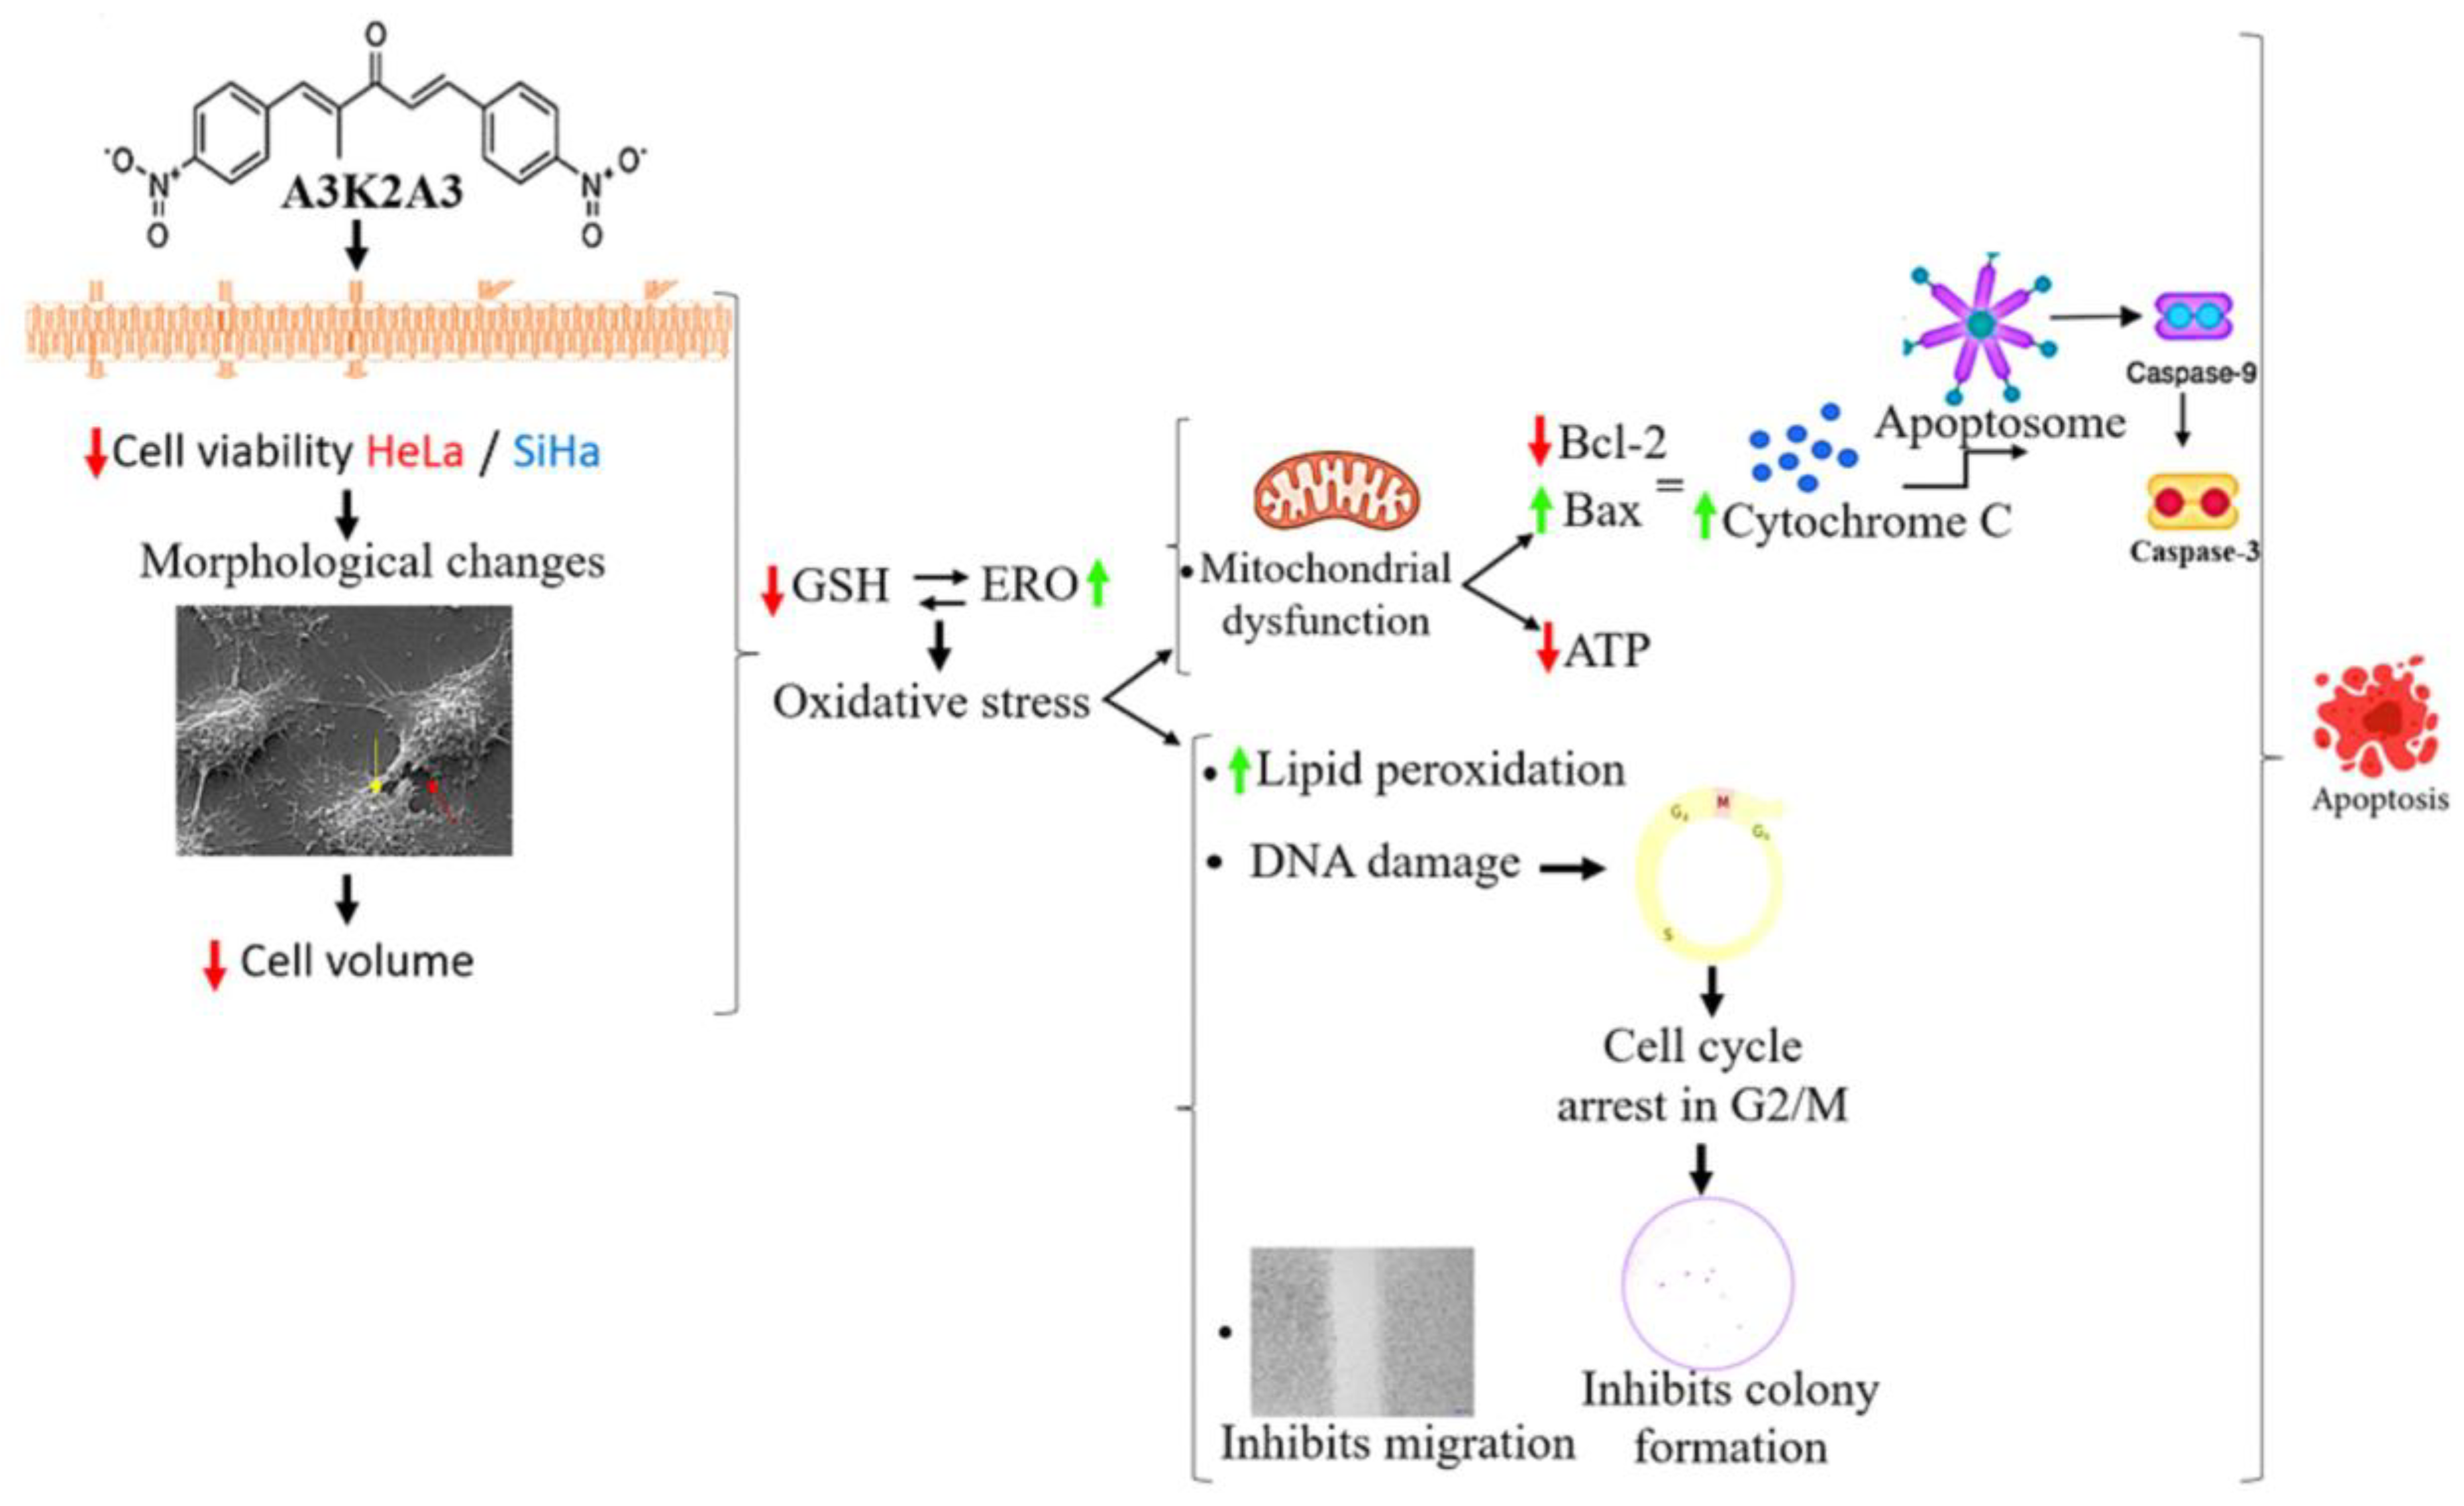
4. Discussion
5. Conclusions
Author Contributions
Funding
Institutional Review Board Statement
Informed Consent Statement
Data Availability Statement
Acknowledgments
Conflicts of Interest
References
- Cervical Cancer. World Health Organization. Available online: https://www.who.int/news-room/fact-sheets/detail/c (accessed on 1 December 2022).
- Graham, S.V. The human papillomavirus replication cycle, and its links to cancer progression: A comprehensive review. Clin. Sci. 2017, 131, 2201–2221. [Google Scholar] [CrossRef] [PubMed] [Green Version]
- Serrano, B.; Brotons, M.; Bosch, F.X.; Bruni, L. Epidemiology and burden of HPV-related disease. Best Pract. Res. Clin. Obstet. Gynaecol. 2018, 47, 14–26. [Google Scholar] [CrossRef]
- Safaeian, M.; Solomon, D.; Castle, P.E. Cervical cancer prevention d cervical screening: Science in evolution. Obstet. Gynecol. Clin. N. Am. 2007, 34, 739–760. [Google Scholar] [CrossRef] [Green Version]
- Zhang, S.; Xu, H.; Zhang, L.; Qiao, Y. Cervical cancer: Epidemiology, risk factors and screening. Chin. J. Cancer Res. 2020, 32, 720–728. [Google Scholar] [CrossRef] [PubMed]
- Denny, L.; Quinn, M.; Sankaranarayanan, R. Chapter 8: Screening for cervical cancer in developing countries. Vaccine 2006, 24, 71–77. [Google Scholar] [CrossRef] [PubMed]
- Bray, F.; Ferlay, J.; Soerjomataram, I. Global Cancer Statistics 2018: GLOBOCAN Estimates of incidence and mortality worldwide for 36 cancers in 185 countries. A Cancer J. Clin. 2018, 68, 394–424. [Google Scholar] [CrossRef] [PubMed] [Green Version]
- Zhang, X.T.; Hu, J.; Su, L.H.; Geng, C.A.; Chen, J.J. Artematrolide A inhibited cervical cancer cell proliferation via ROS/ERK/mTOR pathway and metabolic shift. Phytomedicine 2021, 91, 153707. [Google Scholar] [CrossRef] [PubMed]
- Nimlamool, W.; Chansakaow, S.; Potikanond, S.; Nitwan, W.; Phateep, H.; Jirapak, R.; Phatarawat, T. The leaf extract of mitrephora chulabhorniana suppresses migration and invasion and induces human cervical cancer cell apoptosis through caspase-dependent pathway. Biomed Res. Int. 2022, 2022, 2028082. [Google Scholar] [CrossRef] [PubMed]
- Souza, R.P.; Bonfim-Mendonça, P.D.S.; Gimenes, F.; Ratti, B.A.; Kaplum, V.; Bruschi, M.L.; Nakamura, C.V.; Silva, S.O.; Maria-Engler, S.S.; Consolaro, M.E.L. Oxidative stress triggered by apigenin induces apoptosis in a comprehensive panel of human cervical cancer-derived cell lines. Oxidative Med. Cell. Longev. 2017, 2017, 1512745. [Google Scholar] [CrossRef] [Green Version]
- Zhu, H.; Tang, L.; Zhang, C.; Wei, B.; Yang, P.; He, D.; Zheng, L.; Zhang, Y. Synthesis of chalcone derivatives: Inducing apoptosis of HepG2 cells via regulating reactive oxygen species and mitochondrial pathway. Front. Pharmacol. 2019, 10, 1341. [Google Scholar] [CrossRef] [PubMed]
- Shi, M.; Cai, Q.; Yao, L.; Mao, Y.; Ming, Y.; Ouyang, G. Antiproliferation and apoptosis induced by curcumin in human ovarian cancer cells. Cell Biol. Int. 2006, 30, 221–226. [Google Scholar] [CrossRef] [PubMed]
- Prakobwong, S.; Gupta, S.C.; Kim, J.H.; Sung, B.; Pinlaor, P.; Hiraku, Y.; Wongkham, S.; Sripa, B.; Somchai Pinlaor, S.; Aggarwa, B.B. Curcumin suppresses proliferation and induces apoptosis in human biliary cancer cells through modulation of multiple cell signaling pathways. Carcinogenesis 2011, 32, 1372–1380. [Google Scholar] [CrossRef]
- Prakobwong, S.; Khoontawad, J.; Yongvanit, P.; Pairojkul, C.; Hiraku, Y. Curcumin decreases cholangiocarcinogenesis in hamsters by suppressing inflammation-mediated molecular. Int. J. Cancer 2011, 100, 88–100. [Google Scholar] [CrossRef] [PubMed]
- Yan, J.; Chen, J.; Zhang, S.; Hu, J.; Huang, L.; Li, X. Synthesis, evaluation, and mechanism study of novel indole-chalcone derivatives exerting effective antitumor activity through microtubule destabilization in vitro and in vivo. J. Med. Chem. 2016, 59, 5264–5283. [Google Scholar] [CrossRef]
- Wang, Y.; Xue, S.; Li, R.; Zheng, Z.; Yi, H.; Li, Z. Synthesis and biological evaluation of novel synthetic chalcone derivatives as anti-tumor agents targeting Cat L and Cat K. Bioorganic Med. Chem. 2018, 26, 8–16. [Google Scholar] [CrossRef]
- Ud Din, Z.; Fill, T.P.; Assis, F.F.; Lazarin-Bidóia, D.; Kaplum, V.; Garcia, F.P.; Nakamura, C.V.; Oliveira, K.T.; Rodrigues-Filho, E. Unsymmetrical 1,5-diaryl-3-oxo-1,4-pentadienyls and their evaluation as antiparasitic agents. Bioorganic Med. Chem. 2014, 22, 1121–1127. [Google Scholar] [CrossRef] [Green Version]
- Bhandarkar, S.S.; Bromberg, J.; Carrillo, C.; Selvakumar, P.; Sharma, R.K.; Perry, B.N.; Govindarajan, B.; Fried, L.; Sohn, A.; Reddy, K.; et al. Tris (dibenzylideneacetone) dipalladium, a N-myristoyltransferase-1 inhibitor, is effective against melanoma growth in vitro and in vivo. Clin. Cancer Res. 2008, 14, 5743–5748. [Google Scholar] [CrossRef] [PubMed] [Green Version]
- Lee, H.E.; Choi, E.S.; Jung, J.Y.; You, M.J.; Kim, L.H.; Cho, S.D. Inhibition of specificity protein 1 by dibenzylideneacetone, a curcumin analogue, induces apoptosis in mucoepidermoid carcinomas and tumor xenografts through Bim and truncated Bid. Oral Oncol. 2014, 50, 189–195. [Google Scholar] [CrossRef] [PubMed]
- Yu, H.; Shin, J.; Nam, J.; Kang, B.S.; Cho, S. Apoptotic effect of dibenzylideneacetone on oral cancer cells via modulation of specificity protein 1 and Bax. Oral Dis. 2013, 19, 767–774. [Google Scholar] [CrossRef]
- Prasad, S.; Yadav, V.R.; Ravindran, J.; Aggarwal, B.B. ROS and CHOP are critical for dibenzylideneacetone to sensitize tumor cells to TRAIL through induction of death receptors and downregulation of cell survival proteins. Cancer Res. 2011, 71, 538–549. [Google Scholar] [CrossRef]
- Garcia, F.P.; Rodrigues, J.H.S.; Din, Z.U.; Rodrigues-Filho, E.; Ueda-Nakamura, T.; Auzély-Velty, R.; Nakamura, C.V. A3K2A3-induced apoptotic cell death of Leishmania amazonensis occurs through caspase- and ATP-dependent mitochondrial dysfunction. Apoptosis 2017, 22, 57–71. [Google Scholar] [CrossRef] [PubMed]
- Lazarin-Bidóia, D.; Desoti, C.; Martins, C.; Ribeiro, M.; Ud Din, Z.; Chem, B.M. Dibenzylideneacetones are potent trypanocidal compounds that affect the Trypanosoma cruzi redox system. Antimicrob. Agents Chemother. 2016, 60, 890–903. [Google Scholar] [CrossRef] [PubMed] [Green Version]
- Peron, F.; Lazarin-Bidóia, D.; Ud Din, Z.; Rodrigues-Filho, E.; Ueda-Nakamura, T.; Silva, S.O.; Nakamura, C.V. Effects of (1e,4e)-2-methyl-1,5-bis(4-nitrophenyl)penta-1,4-dien-3-one on Trypanosoma cruzi and its combinational effect with benznidazole, ketoconazole, or fluconazole. BioMed Res. Int. 2017, 2017, 7254193. [Google Scholar] [CrossRef] [PubMed] [Green Version]
- Montoya-Gómez, A.; Montealegre-Sánchez, L.; García-Perdomo, H.A.; Jiménez-Charris, E. Cervical cancer and potential pharmacological treatment with snake venoms. Mol. Biol. Rep. 2020, 47, 4709–4721. [Google Scholar] [CrossRef] [PubMed]
- Pi, J.; Cai, H.; Jin, H.; Yang, F.; Jiang, J.; Wu, A.; Zhu, H.; Liu, J.; Su, X.; Yang, P.; et al. Qualitative and quantitative analysis of ROS-mediated oridonin-induced oesophageal cancer KYSE-150 cell apoptosis by atomic force microscopy. PLoS ONE 2015, 10, e0140935. [Google Scholar] [CrossRef]
- Cui, Q.; Wang, J.Q.; Assaraf, Y.G. Modulating ROS to overcome multidrug resistance in cancer. Drug Resist. Updat. 2018, 41, 1–25. [Google Scholar] [CrossRef]
- Sosa, V.; Moliné, T.; Somoza, R.; Paciucci, R.; Kondoh, H.; LLeonart, M.E. Oxidative stress and cancer: An overview. Ageing Res. Rev. 2013, 12, 376–390. [Google Scholar] [CrossRef]
- Fulda, S.; Gorman, A.M.; Hori, O.; Samali, A. Cellular stress responses: Cell survival and cell death. Int. J. Cell Biol. 2010, 2010, 214074. [Google Scholar] [CrossRef] [Green Version]
- Pedersen, S.F.; Hoffmann, E.K.; Novak, I. Cell volume regulation in epithelial physiology and cancer. Front. Physiol. 2013, 4, 233. [Google Scholar] [CrossRef] [Green Version]
- Shukla, A.K.; Patra, S.; Dubey, V.K. Iridoid glucosides from Nyctanthes arbortristis result in increased reactive oxygen species and cellular redox homeostasis imbalance in Leishmania parasite. Eur. J. Med. Chem. 2012, 54, 49–58. [Google Scholar] [CrossRef]
- Daré, R.G.; Nakamura, C.V.; Ximenes, V.F.; Lautenschlager, S.O.S. Tannic acid, a promising anti-photoaging agent: Evidences of its antioxidant and anti-wrinkle potentials, and its ability to prevent photodamage and MMP-1 expression in L929 fibroblasts exposed to UVB. Free Radic. Biol. Med. 2020, 160, 342–355. [Google Scholar] [CrossRef] [PubMed]
- Crowley, L.C.; Christensen, M.E.; Waterhouse, N.J. Measuring mitochondrial transmembrane potential by TMRE staining. Cold Spring Harb. Protoc. 2016, 2016, 1092–1096. [Google Scholar] [CrossRef] [PubMed]
- Menna-Barreto, R.F.S.; Goncalves, R.L.S.; Costa, E.M. The effects on Trypanosoma cruzi of novel synthetic naphthoquinones are mediated by mitochondrial dysfunction. Free Radic. Biol. Med. 2009, 47, 644–653. [Google Scholar] [CrossRef]
- Okimoto, Y.; Watanabe, A.; Niki, E.; Yamashita, T.; Noguchi, N. A novel fluorescent probe diphenyl-1-pyrenylphosphine to follow lipid peroxidation in cell membranes. FEBS Lett. 2000, 474, 137–140. [Google Scholar] [CrossRef] [PubMed] [Green Version]
- Pec, M.K.; Aguirre, A.; Moser-Thier, K.; Fernandez, J.J.; Souto, M.L.; Dortab, J.; Gonzalez, F.D.; Villara, J. Induction of apoptosis in estrogen dependent and independent breast cancer cells by the marine terpenoid dehydrothyrsiferol. Biochem. Pharmacol. 2003, 65, 1451–1461. [Google Scholar] [CrossRef] [PubMed]
- Kasibhatla, S.; Amarante-Mendes, G.P.; Finucane, D.; Brunner, T.; Bossy-Wetzel, E.; Green, D.R. Propidium iodide (PI) uptake assay to detect apoptosis. Cold Spring Harb. Protoc. 2006, 2006, pdb-prot4495. [Google Scholar] [CrossRef]
- Jimenez, V.; Paredes, R.; Sosa, M.A.; Galanti, N. Natural programmed cell death in T. cruzi epimastigotes maintained in axenic cultures. J. Cell Biochem. 2008, 105, 688–698. [Google Scholar] [CrossRef]
- Oliveira, M.M.; Ratti, B.A.; Daré, R.G. Dihydrocaffeic acid prevents UVB-induced oxidative stress leading to the inhibition of apoptosis and MMP-1 expression via p38 signaling pathway. Oxidative Med. Cell. Longev. 2019, 2019, 2419096. [Google Scholar] [CrossRef]
- Kaplum, V.; Ramos, A.C.; Consolaro, M.E.L.; Fernandez, M.A.; Ueda-Nakamura, T.; Dias-Filho, B.P.; Silva, S.O.; Nakamura, C.V.; Mello, J.C.P. Proanthocyanidin polymer-rich fraction of Stryphnodendron adstringens promotes in vitro and in vivo cancer cell death via oxidative stress. Front. Pharmacol. 2018, 9, 694. [Google Scholar] [CrossRef] [Green Version]
- Franken, N.A.P.; Rodermond, H.M.; Stap, J.; Haveman, J.; Van Bree, C. Clonogenic assay of cells in vitro. Nat. Protoc. 2006, 1, 2315–2319. [Google Scholar] [CrossRef]
- Rattanapornsompong, K.; Khattiya, J.; Phannasil, P.; Phaonakrop, N.; Roytrakul, S.; Jitrapakdee, S.; Akekawatchai, C. Impaired G2/M cell cycle arrest induces apoptosis in pyruvate carboxylase knockdown MDA-MB-231 cells. Biochem. Biophys. Rep. 2021, 25, 100903. [Google Scholar] [CrossRef]
- Lemp, J.M.; De Neve, J.W.; Bussmann, H. Lifetime prevalence of cervical cancer screening in 55 low-and middle-income countries. JAMA—J. Med. Assoc. 2020, 324, 1532–1542. [Google Scholar] [CrossRef] [PubMed]
- Vaccarella, S.; Laversanne, M.; Ferlay, J.; Bray, F. Cervical cancer in Africa, Latin America and the Caribbean and Asia: Regional inequalities and changing trends. Int. J. Cancer 2017, 141, 1997–2001. [Google Scholar] [CrossRef] [Green Version]
- Choudhari, A.S.; Suryavanshi, S.A.; Kaul-Ghanekar, R. The aqueous extract of Ficus religiosa induces cell cycle arrest in human cervical cancer cell lines SiHa (HPV-16 Positive) and apoptosis in HeLa (HPV-18 Positive). PLoS ONE 2013, 8, e70127. [Google Scholar] [CrossRef] [PubMed]
- Aher, R.B.; Wanare, G.; Kawathekar, N.; Kumar, R.R.; Kaushik, N.K.; Sahal, D.; Chauhan, V.S. Dibenzylideneacetone analogues as novel Plasmodium falciparum inhibitors. Bioorganic Med. Chem. Lett. 2011, 21, 3034–3036. [Google Scholar] [CrossRef] [PubMed]
- Awang, N.; Kamaludin, N.F.; Chan, K.M. Cytotoxicity and mode of cell death induced by triphenyltin (IV) compounds in vitro. J. Biol. Sci. 2014, 14, 84–93. [Google Scholar] [CrossRef] [Green Version]
- Badisa, R.B.; Darling-Reed, S.F.; Joseph, P.; Cooperwood, J.S.; Latinwo, L.M.; Goodman, C.B. Selective cytotoxic activities of two novel synthetic drugs on human breast carcinoma MCF-7 cells. Anticancer Res. 2009, 29, 2993–2996. [Google Scholar]
- Kroemer, G.; Galluzzi, L.; Vandenabeele, P. Classification of cell death: Recommendations of the nomenclature committee on cell death 2009. Cell Death Differ. 2009, 16, 3–11. [Google Scholar] [CrossRef]
- Huang, X.; Wu, Y.; Huang, Y.; Liu, Q.; Chen, H.; Dai, F.; Liang, F.; Gan, C. Studies on apoptosis induced by B-norcholesteryl benzimidazole compounds in HeLa cells. Steroids 2021, 168, 108802. [Google Scholar] [CrossRef]
- Ralph, S.J.; Rodríguez-Enríquez, S.; Neuzil, J.; Moreno-Sánchez, R. Bioenergetic pathways in tumor mitochondria as targets for cancer therapy and the importance of the ROS-induced apoptotic trigger. Mol. Asp. Med. 2010, 31, 29–59. [Google Scholar] [CrossRef] [Green Version]
- Redza-Dutordoir, M.; Averill-Bates, D.A. Activation of apoptosis signalling pathways by reactive oxygen species. Biochim. Biophys. Acta—Mol. Cell Res. 2016, 1863, 2977–2992. [Google Scholar] [CrossRef]
- Gorrini, C.; Harris, I.S.; Mak, T.W. Modulation of oxidative stress as an anticancer strategy. Nat. Rev. Drug Discov. 2013, 12, 931–947. [Google Scholar] [CrossRef] [PubMed]
- Al-Oqail, M.M.; Siddiqui, M.A.; Al-Sheddi, E.S. Verbesina encelioides: Cytotoxicity, cell cycle arrest, and oxidative DNA damage in human liver cancer (HepG2) cell line. BMC Complement. Altern. Med. 2016, 16, 126. [Google Scholar] [CrossRef] [PubMed] [Green Version]
- Abdullah, A.S.H.; Mohammed, A.S.; Rasedee, A.; Saeed Mirghani, M.E. Oxidative stress-mediated apoptosis induced by ethanolic mango seed extract in cultured estrogen receptor positive breast cancer MCF-7 cells. Int. J. Mol. Sci. 2015, 16, 3528–3536. [Google Scholar] [CrossRef] [PubMed] [Green Version]
- Dasari, S.; Bakthavachalam, V.; Chinnapaka, S.; Venkatesan, R.; Samy, A.L.P.A.; Munirathinam, G. Neferine, an alkaloid from lotus seed embryo targets HeLa and SiHa cervical cancer cells via pro-oxidant anticancer mechanism. Phyther. Res. 2020, 34, 2366–2384. [Google Scholar] [CrossRef] [PubMed]
- Wageesha, N.D.A.; Soysa, P.; Atthanayake, K.; Choudhary, M.I.; Ekanayake, M. A traditional poly herbal medicine “Le Pana Guliya” induces apoptosis in HepG2 and HeLa cells but not in CC1 cells: An in vitro assessment. Chem. Cent. J. 2017, 11, 2. [Google Scholar] [CrossRef] [PubMed] [Green Version]
- Xia, X.; Xiang, X.; Huang, F.; Zheng, M.; Zhang, Z.; Han, L. Dietary canolol induces apoptosis in human cervical carcinoma HeLa cells through ROS-MAPK mediated mitochondrial signaling pathway: In vitro and in vivo. Chem. Biol. Interact. 2019, 300, 138–150. [Google Scholar] [CrossRef]
- Sinha, K.; Das, J.; Pal, P.B.; Sil, P.C. Oxidative stress: The mitochondria-dependent and mitochondria-independent pathways of apoptosis. Arch Toxicol. 2013, 87, 1157–1180. [Google Scholar] [CrossRef]
- Shrivastava, S.; Kulkarni, P.; Thummuri, D.; Jeengar, M.K.; Naidu, V.G.M.; Alvala, M.; Redddy, G.B.; Ramakrishna, S. Piperlongumine, an alkaloid causes inhibition of PI3 K/Akt/mTOR signaling axis to induce caspase-dependent apoptosis in human triple-negative breast cancer cells. Apoptosis 2014, 19, 1148–1164. [Google Scholar] [CrossRef]
- Ali, E.M.M.; Hamdy, S.M.; Mohamed, T.M. Nitric oxide synthase and oxidative stress: Regulation of nitric oxide synthase. Oxidative Stress-Mol. Mech. Biol. Eff. 2012, 61–72. [Google Scholar] [CrossRef] [Green Version]
- Birben, E.; Sahiner, U.M.; Sackesen, C.; Erzurum, S.; Kalayci, O. Oxidative stress and antioxidant defense. World Allergy Organ. J. 2012, 5, 9–19. [Google Scholar] [CrossRef] [PubMed]
- Ayala, A.; Muñoz, M.F.; Argüelles, S. Lipid peroxidation: Production, metabolism, and signaling mechanisms of malondialdehyde and 4-hydroxy-2-nonenal. Oxidative Med. Cell. Longev. 2014, 2014, 360438. [Google Scholar] [CrossRef] [PubMed] [Green Version]
- Kudryavtseva, A.V.; Krasnov, G.S.; Dmitriev, A.A. Mitochondrial dysfunction and oxidative stress in aging and cancer. Oncotarget 2016, 7, 44879–44905. [Google Scholar] [CrossRef] [PubMed] [Green Version]
- Prokhorova, E.A.; Zamaraev, A.V.; Kopeina, G.S.; Zhivotovsky, B.; Lavrik, I.N. Role of the nucleus in apoptosis: Signaling and execution. Cell Mol. Life Sci. 2015, 72, 4593–4612. [Google Scholar] [CrossRef] [PubMed]
- You, Y.; He, Q.; Lu, H.; Chen, L.; Liu, H.; Lu, Z.; Liu, D.; Liu, Y.; Zuo, D.; Fu, X.; et al. Silibinin induces G2/M cell cycle arrest by activating drp1-dependent mitochondrial fission in cervical cancer. Front. Pharmacol. 2020, 11, 271. [Google Scholar] [CrossRef] [Green Version]
- Park, M.; Chae, H.D.; Yun, J.; Jung, M.; Kim, Y.; Kim, S.; Han, M.H.; Shin, D.Y. Constitutive activation of cyclin B1-associated cdc2 kinase overrides p53-mediated G2-M arrest. Cancer Res. 2000, 60, 542–545. [Google Scholar]
- Hassaneen, H.M.; Abdelhamid, I.A. Molecular docking study, cytotoxicity, cell cycle arrest and apoptotic induction of novel chalcones incorporating Thiadiazolyl Isoquinoline in cervical cancer. Anti-Cancer Agents Med. Chem. Agents Med. Chem. 2020, 20, 70–83. [Google Scholar] [CrossRef]
- Li, C.; Zhang, L.; Liu, C.; He, X.; Chen, M.; Chen, J. Lipophilic grape seed Proanthocyanidin exerts anti-cervical cancer effects in HeLa cells and a HeLa-derived xenograft zebrafish model. Antioxidants 2022, 11, 422. [Google Scholar] [CrossRef]
- Ray, A.; Jena, S.; Dash, B.; Sahoo, A.; Kar, B.; Patnaik, J.; Panda, P.C.; Nayak, S.; Mahapatra, N. Hedychium coronarium extract arrests cell cycle progression, induces apoptosis, and impairs migration and invasion in HeLa cervical cancer cells. Cancer Manag. Res. 2019, 11, 483–500. [Google Scholar] [CrossRef] [Green Version]
- Guerra, M.T.; Fonseca, E.A.; Melo, F.M. Mitochondrial calcium regulates rat liver regeneration through the modulation of apoptosis. Hepatology 2011, 54, 296–306. [Google Scholar] [CrossRef] [Green Version]
- Yang, Y.; Zong, M.; Xu, W.; Zhang, Y.; Wang, B.O.; Yang, M.; Tao, L. Natural pyrethrins induces apoptosis in human hepatocyte cells via Bax- and Bcl-2-mediated mitochondrial pathway. Chem. Biol. Interact. 2017, 262, 38–45. [Google Scholar] [CrossRef] [PubMed]
- Hata, A.N.; Engelman, J.A.; Faber, A.C. The BCL2 family: Key mediators of the apoptotic response to targeted anticancer therapeutics. Cancer Discov. 2016, 5, 475–487. [Google Scholar] [CrossRef] [PubMed]
- Choi, J.Y.; Lee, N.K.; Wang, Y.Y.; Hong, J.; Son, S.R.; Gu, D.; Jang, D.S.; Choi, J. 1′-Acetoxyeugenol acetate isolated from Thai ginger induces apoptosis in human ovarian cancer cells by ROS production via NADPH oxidase. Antioxidants 2022, 11, 293. [Google Scholar] [CrossRef] [PubMed]
- Pei, X.D.; Long, Z.; Hong, H.; Xiao, J.; Li, L.; Gu, J.; Shi, P.; Wang, J.; Jiang, L. 6-Shogaol from ginger shows anti-tumor effect in cervical carcinoma via PI3K/Akt/mTOR pathway. Eur. J. Nutr. 2021, 60, 2781–2793. [Google Scholar] [CrossRef] [PubMed]
- Nunes, D.C.D.O.; Bispo-Da-Silva, L.B.; Napolitano, D.R. In vitro additive interaction between ketoconazole and antimony against intramacrophage Leishmania (Leishmania) amazonensis amastigotes. PLoS ONE 2017, 12, e0180530. [Google Scholar] [CrossRef] [Green Version]
- Tosi, D.; Pérez-Gracia, E.; Atis, S. Rational development of synergistic combinations of chemotherapy and molecular targeted agents for colorectal cancer treatment. BMC Cancer 2018, 18, 812. [Google Scholar] [CrossRef]


| A3K2A3 | IC50 (µM) | SI |
|---|---|---|
| HeLa | 18.9 ± 1 2.68 | 2.54 |
| SiHa HaCaT | 17.4 ± 2.89 48.06 ± 2.92 | 2.75 |
Disclaimer/Publisher’s Note: The statements, opinions and data contained in all publications are solely those of the individual author(s) and contributor(s) and not of MDPI and/or the editor(s). MDPI and/or the editor(s) disclaim responsibility for any injury to people or property resulting from any ideas, methods, instructions or products referred to in the content. |
© 2023 by the authors. Licensee MDPI, Basel, Switzerland. This article is an open access article distributed under the terms and conditions of the Creative Commons Attribution (CC BY) license (https://creativecommons.org/licenses/by/4.0/).
Share and Cite
Zani, A.P.; Zani, C.P.; Din, Z.U.; Rodrigues-Filho, E.; Ueda-Nakamura, T.; Garcia, F.P.; de Oliveira Silva, S.; Nakamura, C.V. Dibenzylideneacetone Induces Apoptosis in Cervical Cancer Cells through Ros-Mediated Mitochondrial Damage. Antioxidants 2023, 12, 317. https://doi.org/10.3390/antiox12020317
Zani AP, Zani CP, Din ZU, Rodrigues-Filho E, Ueda-Nakamura T, Garcia FP, de Oliveira Silva S, Nakamura CV. Dibenzylideneacetone Induces Apoptosis in Cervical Cancer Cells through Ros-Mediated Mitochondrial Damage. Antioxidants. 2023; 12(2):317. https://doi.org/10.3390/antiox12020317
Chicago/Turabian StyleZani, Aline Pinto, Caroline Pinto Zani, Zia Ud Din, Edson Rodrigues-Filho, Tânia Ueda-Nakamura, Francielle Pelegrin Garcia, Sueli de Oliveira Silva, and Celso Vataru Nakamura. 2023. "Dibenzylideneacetone Induces Apoptosis in Cervical Cancer Cells through Ros-Mediated Mitochondrial Damage" Antioxidants 12, no. 2: 317. https://doi.org/10.3390/antiox12020317