Article

Bilirubin Levels Are Negatively Correlated with Adiposity in Obese Men and Women, and Its Catabolized Product, Urobilin, Is Positively Associated with Insulin Resistance

1
Department of Pharmacology and Nutritional Sciences, University of Kentucky, 760 Press Avenue, Healthy Kentucky Research Building, Lexington, KY 40508, USA
2
Department of Internal Medicine, Division of Endocrinology, University of Kentucky, Lexington, KY 40508, USA
3
Barnstable Brown Diabetes Center, University of Kentucky, Lexington, KY 40508, USA
4
Markey Cancer Center, University of Kentucky, Lexington, KY 40508, USA
*
Author to whom correspondence should be addressed.
Antioxidants 2023, 12(1), 170; https://doi.org/10.3390/antiox12010170
Submission received: 10 December 2022 / Revised: 3 January 2023 / Accepted: 9 January 2023 / Published: 11 January 2023
(This article belongs to the Special Issue Pharmacological and Clinical Significance of Heme Oxygenase-1 2022)

Abstract

:
Bilirubin levels in obese humans and rodents have been shown to be lower than in their lean counterparts. Some studies have proposed that the glucuronyl UGT1A1 enzyme that clears bilirubin from the blood increases in the liver with obesity. UGT1A1 clearance of bilirubin allows more conjugated bilirubin to enter the intestine, where it is catabolized into urobilin, which can be then absorbed via the hepatic portal vein. We hypothesized that when bilirubin levels are decreased, the urobilin increases in the plasma of obese humans, as compared to lean humans. To test this, we measured plasma levels of bilirubin and urobilin, body mass index (BMI), adiposity, blood glucose and insulin, and HOMA IR in a small cohort of obese and lean men and women. We found that bilirubin levels negatively correlated with BMI and adiposity in obese men and women, as compared to their lean counterparts. Contrarily, urobilin levels were positively associated with adiposity and BMI. Only obese women were found to be insulin resistant based on significantly higher HOMA IR, as compared to lean women. The urobilin levels were positively associated with HOMA IR in both groups, but women had a stronger linear correlation. These studies indicate that plasma urobilin levels are associated with obesity and its comorbidities, such as insulin resistance.

1. Introduction

The worldwide rates of obesity are at an all-time high, which is characterized by a body mass index (BMI, kg/m2) greater than 30 [1]. While excessive food intake and a sedentary lifestyle are the primary drivers of increased obesity, there has been little progress in developing effective treatments for reducing adiposity and body weight. There have been many large omics analyses, such as RNA sequencing, that have indicated a genetic component for obesity. However, some factors are not observable in these types of extensive bioinformatic analyses. In the context of obesity, how physiological responses to weight gain affect the functionality of the detoxifying cytochrome P450 or glucuronyl UGT enzymes in regulating catabolism and the transport of non-gene-related molecules is mostly unexplored.
One notable non-gene-derived molecule is bilirubin, which is a catabolized product of heme [2,3,4,5,6,7] that, for unknown reasons, has been shown to be lower in obese humans and rodents [2,3]. Bilirubin is a strong antioxidant and robust anti-inflammatory [8,9,10,11] that has been shown to reduce body weight in obese rodents via its hormonal actions on the PPARα nuclear receptor [2,3,5,6,12,13,14,15,16,17]. Some studies have demonstrated that the glucuronyl UGT1A1 enzyme that clears bilirubin from the blood increases in the liver with obesity [18,19]. The UGT1A1 glucuronosyltransferase conjugates bilirubin to lower levels (clearance) [20]. The conjugated bilirubin is excreted to bile and then to the intestine, where it is catabolized into urobilin [6]. The freshly produced urobilin can be absorbed and enter the systemic circulation via the hepatic portal vein [6]. The physiological function of urobilin has not been well studied. In humans, urobilin plasma levels are associated with a higher visceral fat area in the obese [21], heart failure [22], and all-cause mortality in diabetic patients [23].
Here, we provide intriguing data that urobilin levels are positively associated with adiposity and BMI in obese men and women and also with insulin resistance in women, which was determined using the Homeostatic Model Assessment for Insulin Resistance (HOMA IR), a measurement of insulin sensitivity [24]. We demonstrate that plasma urobilin and bilirubin levels are inversely correlated. Our data indicate that urobilin is a factor in obese people that may be linked with worsened obesity-associated comorbidities, such as insulin-resistant diabetes. The findings in this study help to understand better the factors that are changed in obesity and how these are related to obesity-induced comorbidities.

2. Materials and Methods

2.1. Human Subject Participation

Blood-derived phenotypic data were collected from adult participants (aged 18–80 years) donated to the Center for Muscle Biology (CMB) at the University of Kentucky under an Institutional Review Board (IRB), which was reviewed and approved (IRB protocol #46746), using the Center for Clinical and Translational Science (CCTS) grant #UL1TR001998. Samples were selected based on a BMI >30 for obese women and men (n = 13 total (obese women n = 8 and obese men n = 5)) and a BMI <25 for lean (n = 17 total (lean women n = 8 and lean men n = 9)). None of the obese subjects had diabetes, hypertension, heart disease, or other significant complications. All healthy volunteers did not report any known evidence of cardiovascular, metabolic, or neuromuscular disease and were non-smokers. All data and blood samples were collected during the same visit after at least an 8 h fast. Height and weight were collected using the same stadiometer and scale, whereas body mass index (BMI) was calculated as kg/m2. Body composition was determined using a Lunar Prodigy (GE Lunar Inc., Madison, WI) dual-energy X-ray absorptiometry (DEXA) bone densitometer and analyzed with GE Lunar software version 10.0 software for bone mineral content (BMC), bone mineral density (BMD), fat-free mass (FFM), mineral-free lean mass (MFL), fat mass, and fat percent. The patients fasted, and blood was collected (20–30 mL) by venipuncture. Fasting glucose and insulin levels were measured by a YSI 2900 Biochemistry Analyzer and an Insulin Chemiluminescence ELISA (ALPCO), respectively. HOMA IR was calculated by the following formula: HOMA-IR = (fasting glucose × fasting insulin)/22.5 [24]. The additional blood that was stored at the CMB was used for additional measures, such as bilirubin and urobilin measures, as described below. The data in Table 1 and Table 2 are displayed in mean ± standard deviation.

2.2. Plasma Bilirubin Measurements

Total bilirubin was measured by using a colorimetric method according to the manufacturer’s kit booklet (Cayman Chemical, Ann Arbor, MI, USA). Briefly, after adding 100 µL of bilirubin assay catalyst into each well of 96-well plates, 50 µL of plasma was added into designated wells, followed by 10 min of incubation at room temperature. After another incubation of 15 min following the addition of 25 µL of freshly prepared reagent mix or background mix, 75 µL of total bilirubin probe was added into each well, followed by a third incubation period for 5 min. Then, the absorbance was read at 600 nm. The total bilirubin concentration of each sample was calculated based on the standard curve.

2.3. Plasma Urobilin Measurements

Plasma urobilin was measured by spectrophotometry, which was performed as described before [25,26,27]. Urobilin hydrochloride (Frontier Specialty Chemicals, Logan, UT, USA) was dissolved in DMSO to make the urobilin standard curve using 0~125 µM urobilin. DMSO/saline was used as the blank of standard/plasma. All blanks, standards, and samples were attained using the same extraction method to form the oxidation products of urobilin-zinc complexes. Briefly, 10 µL of standards or plasma samples were added to 60 µL of 54 mM zinc acetate (in DMSO) in each tube, followed by adding 12 µL of 25 mM iodine (dissolved in 120 mM potassium iodine). After vigorously mixing for 30 s, 5 µL of 82 mM cysteine HCL was added to each sample, followed by another vortex. Then, they were centrifuged at 5000× g for 3 min. First, supernatants were collected into the newly designated tubes. Each pellet underwent a repeated extraction. Two supernatants were combined. A total of 50 µL of 1 M HCL was added to the blanks to eliminate the background fluorescence. The liquid extracted from each sample was added to a 96-well plate, and then absorbance was read at 508 nm. Each sample was performed in duplicate. The urobilin concentration of the samples was calculated using the linear regression equation of the standard curve.

2.4. Statistical Analysis

The data were graphed and analyzed using Prism 9 (GraphPad Software, San Diego, CA, USA), and an analysis of variance and Tukey’s post hoc test were used to compare the groups’ means. A two-tailed unpaired t-test was used to determine statistical significance when comparing the two groups. To determine correlation, a linear regression line was fitted to the data, and the linear equation and R2 value were calculated for each comparison. Finally, p-values of 0.05 or smaller were considered statistically significant.

3. Results

3.1. Bilirubin and Urobilin Levels in Obese and Lean Men and Women

Phenotyping of Obese and Lean Men and Women

To determine the relationship between bilirubin and urobilin in obese and lean men and women, body weight, BMI, total fat, and body fat percentage were quantitated, and blood was drawn for the plasma analysis of the levels of total bilirubin, urobilin, glucose, and insulin (Table 1 and Table 2). The glucose and insulin levels were used for quantifying the HOMA IR.
The plasma measurements show that bilirubin levels were lower in obese men and women but not significantly. The urobilin levels were significantly (p = 0.0262) higher in the obese subjects, as compared to the lean. However, this was only seen in obese females (p = 0.0278) and not in obese males. One factor that might regulate these differences is that the obese women were insulin resistant, as indicated by a significantly higher insulin level (p = 0.0127) and HOMA IR (p = 0.0160). Next, to determine the correlation of urobilin or bilirubin with these metabolic dysfunctions, we performed Pearson’s coefficients to calculate their relationships.

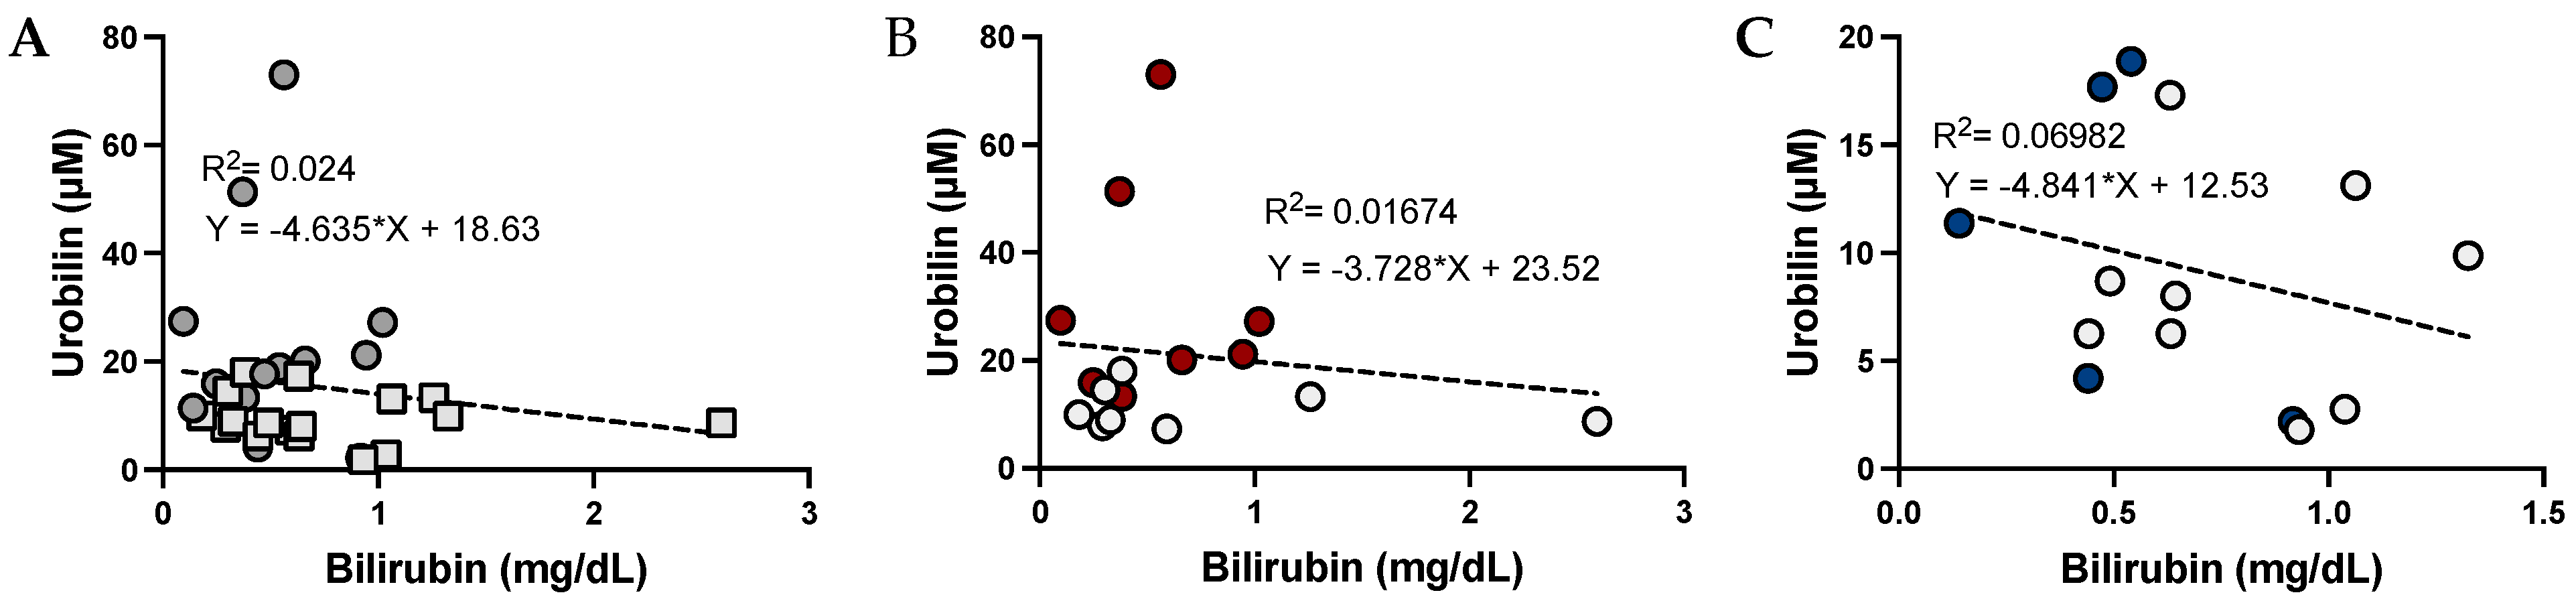
3.2. The Relationship between Urobilin and Bilirubin Levels

To determine whether urobilin and bilirubin levels are interrelated, we performed a Pearson’s coefficient graph with a line to fit the data (Figure 1). The data show that urobilin is negatively associated with bilirubin levels in women and men.

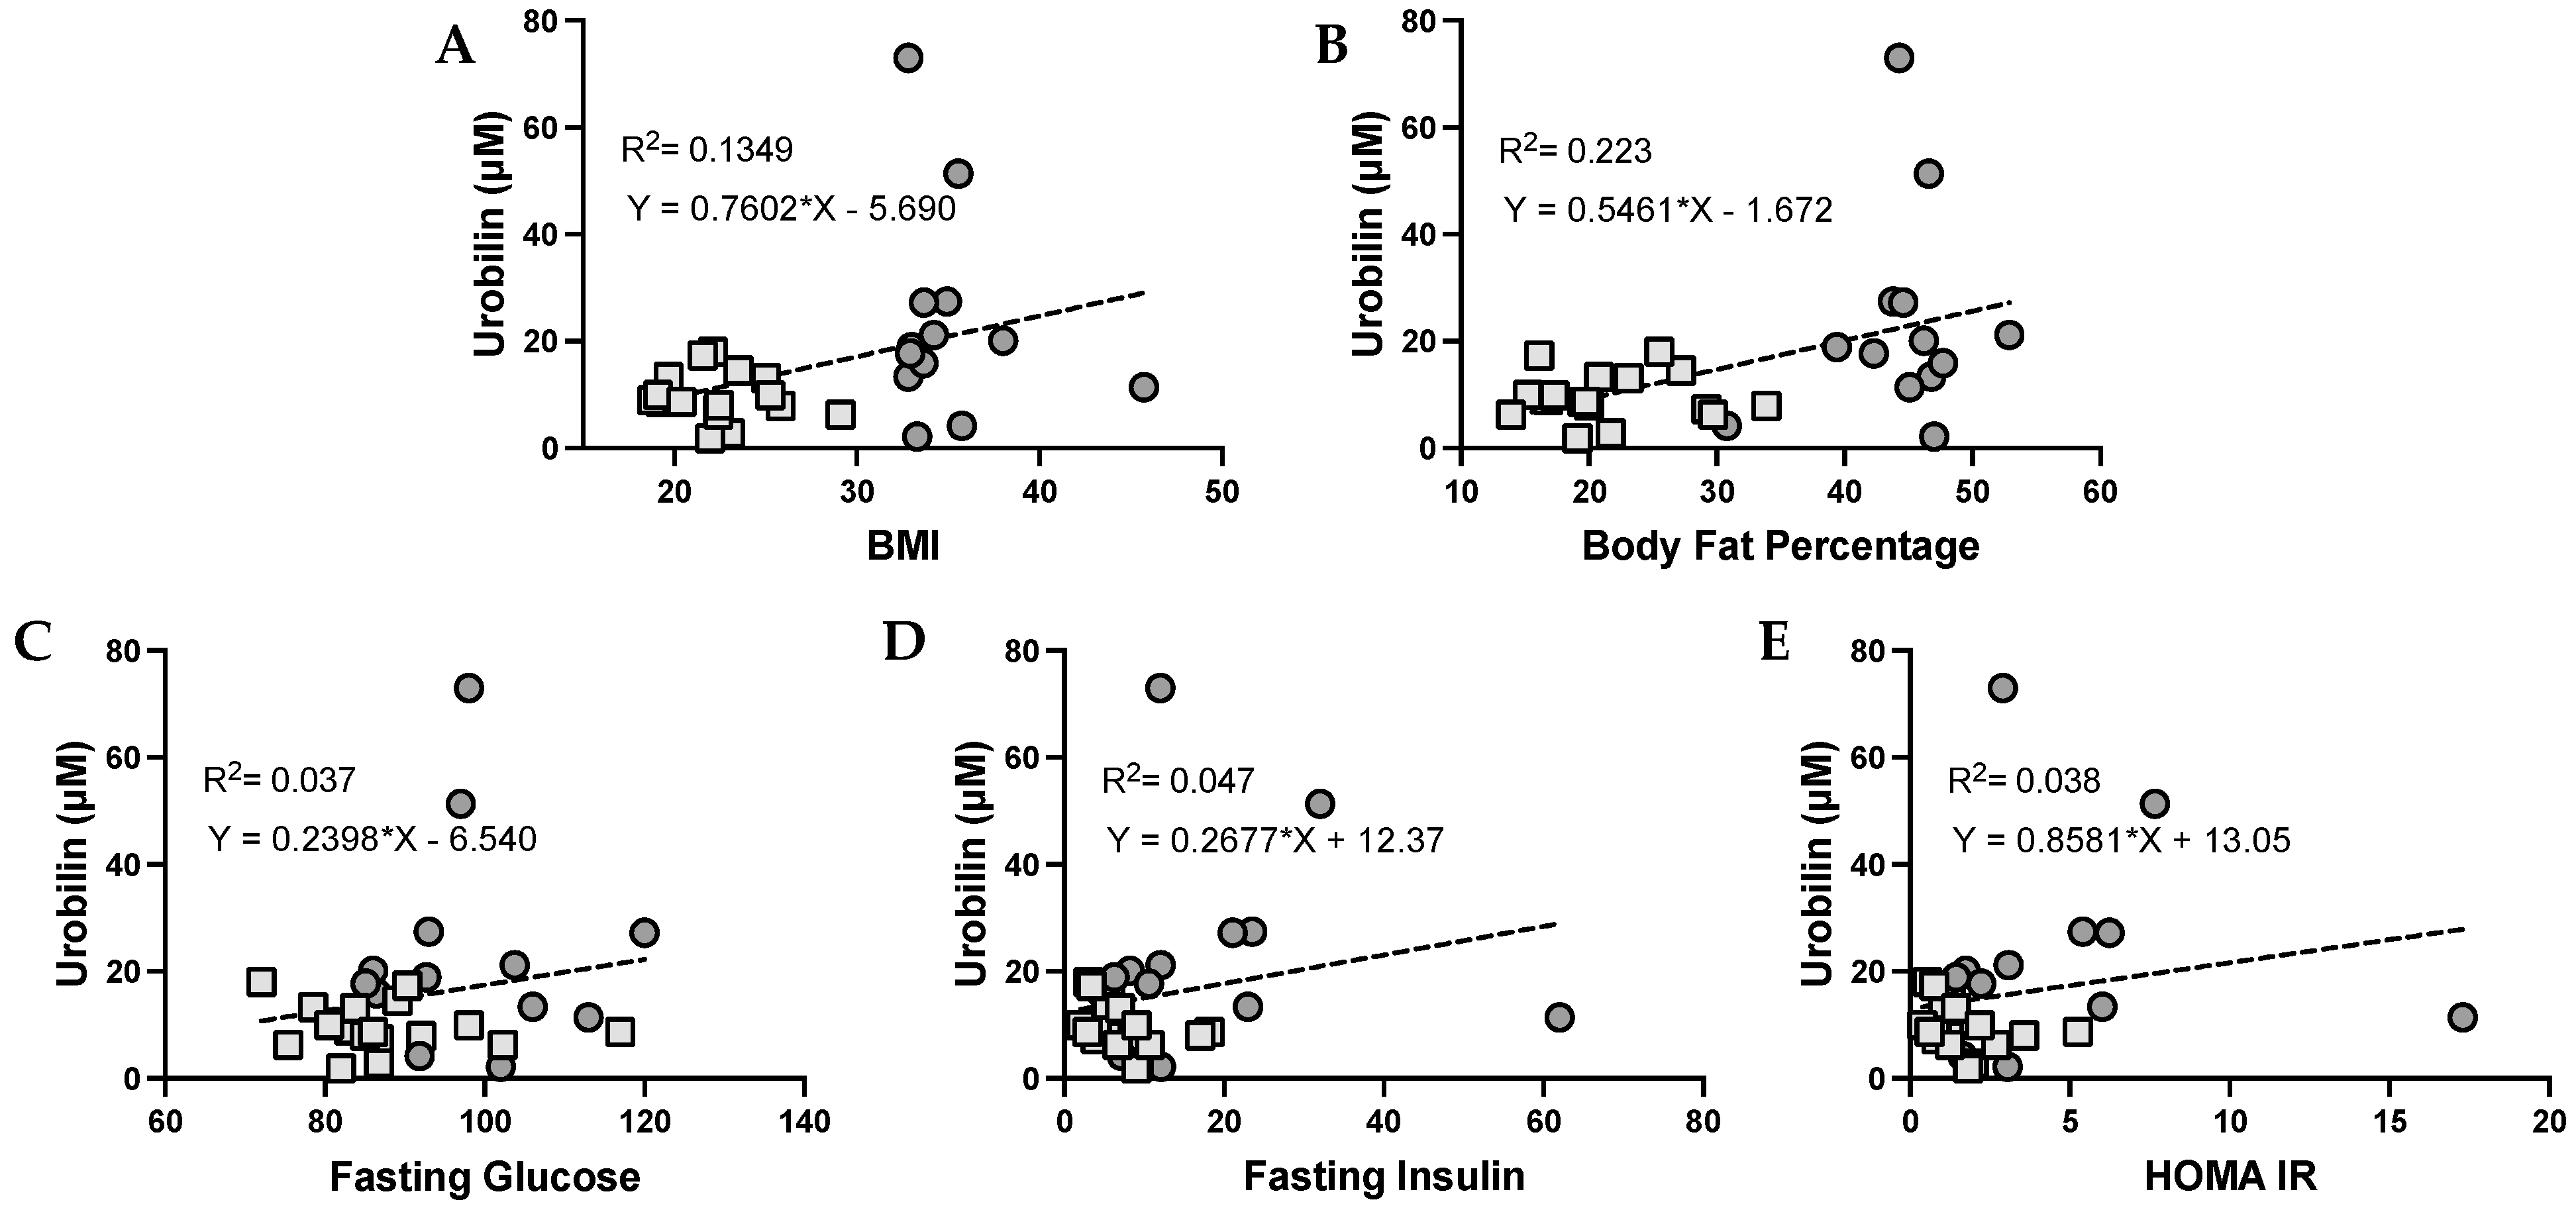
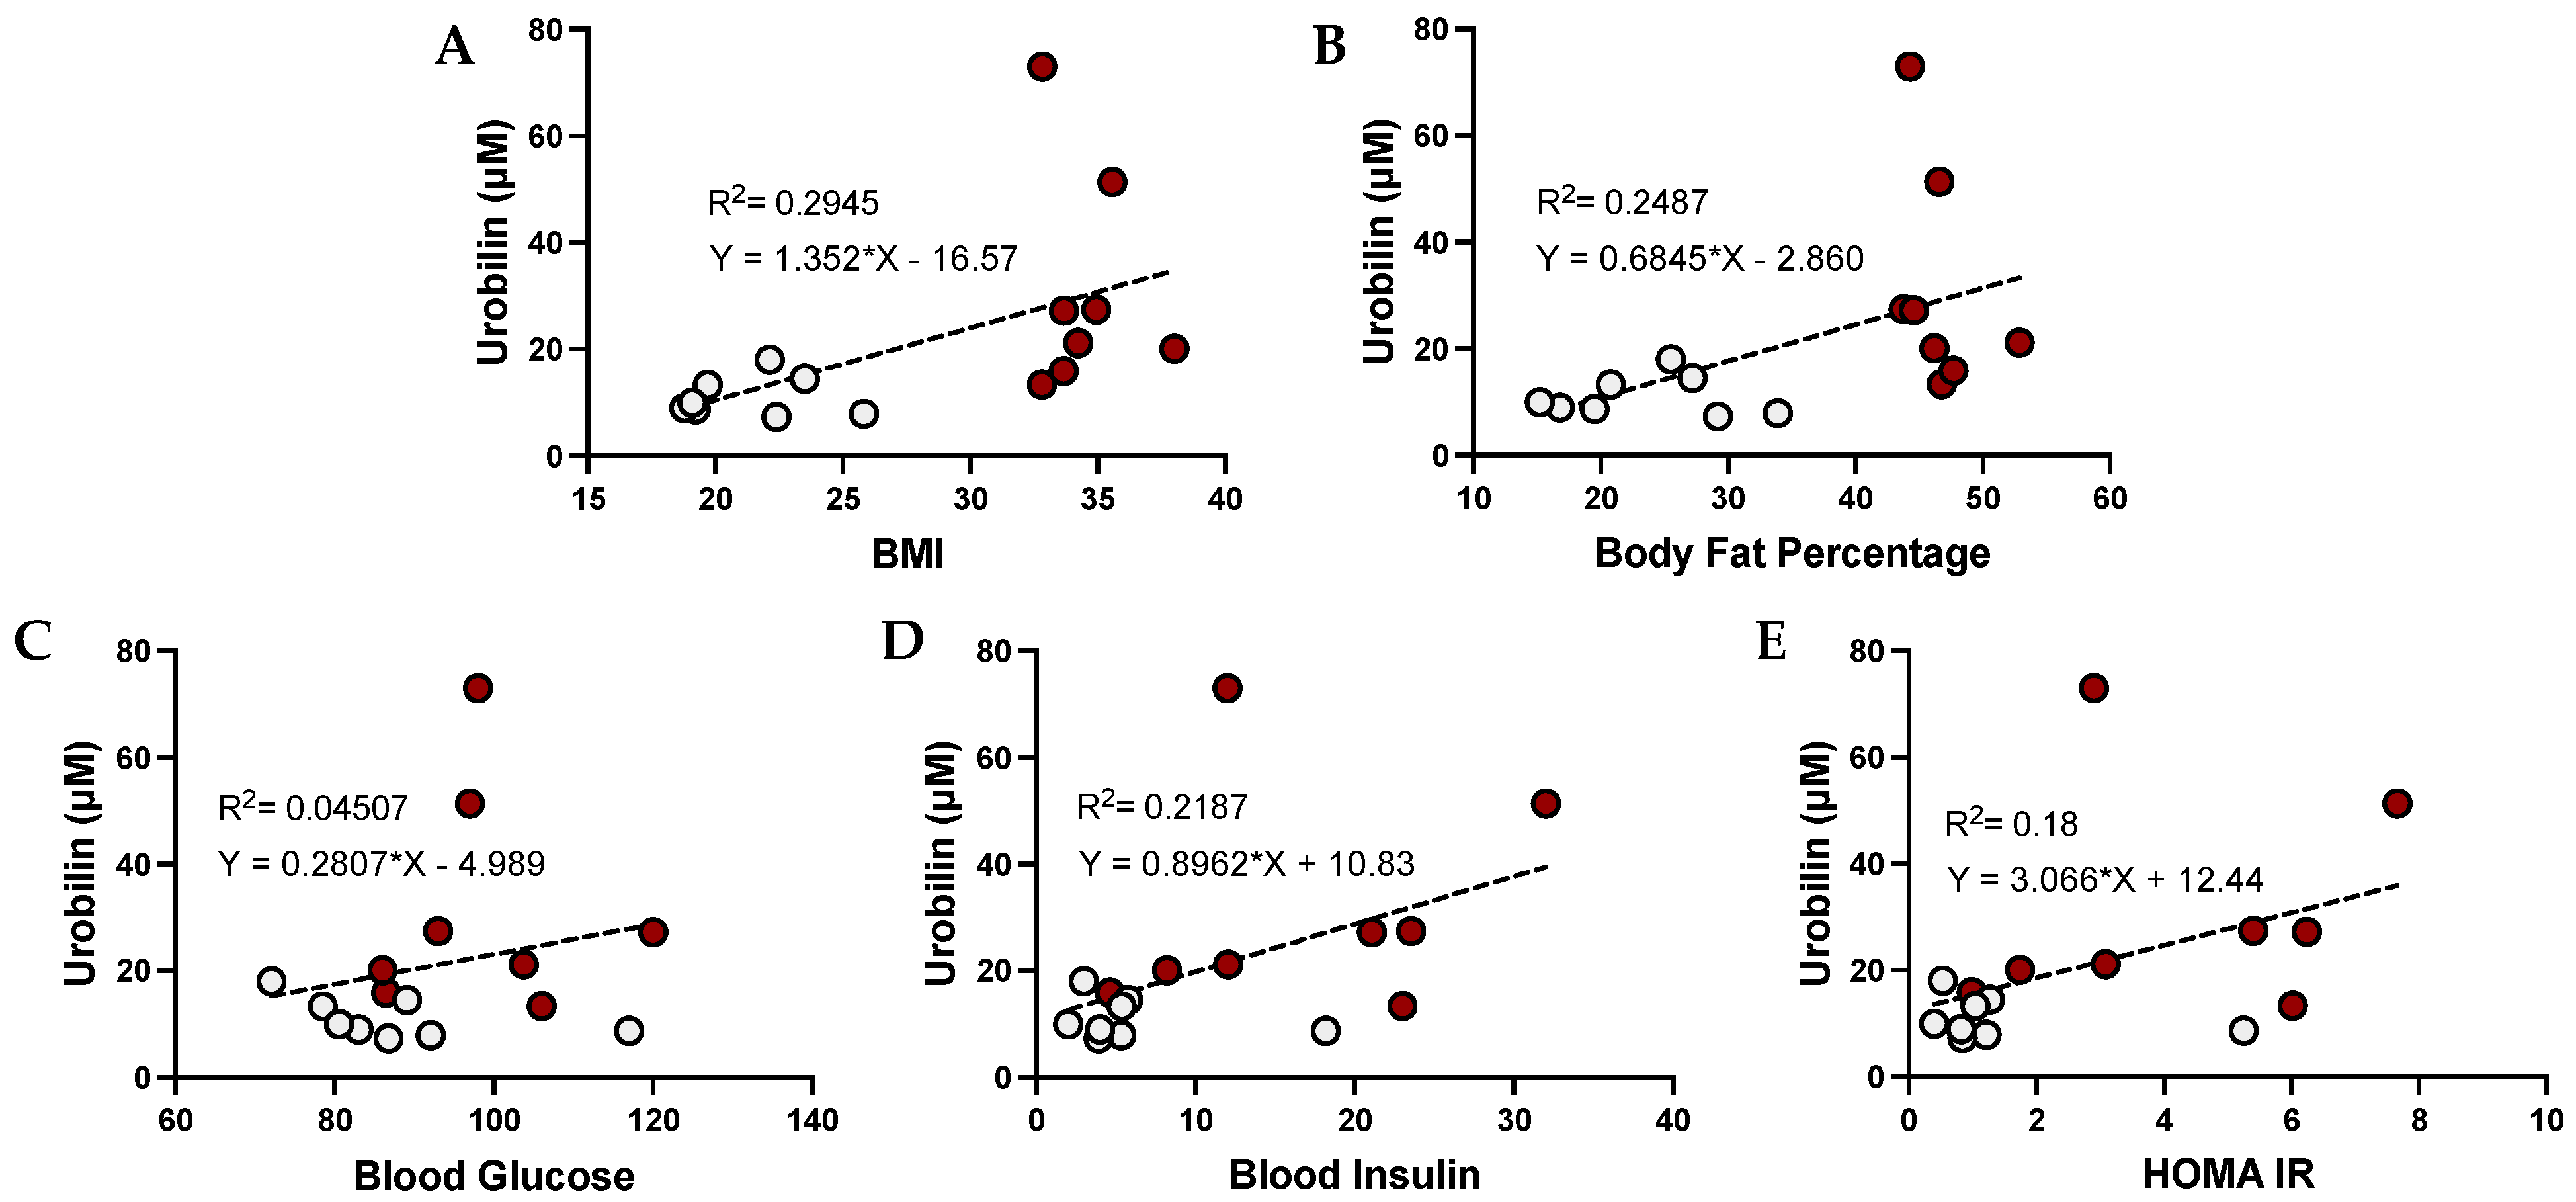
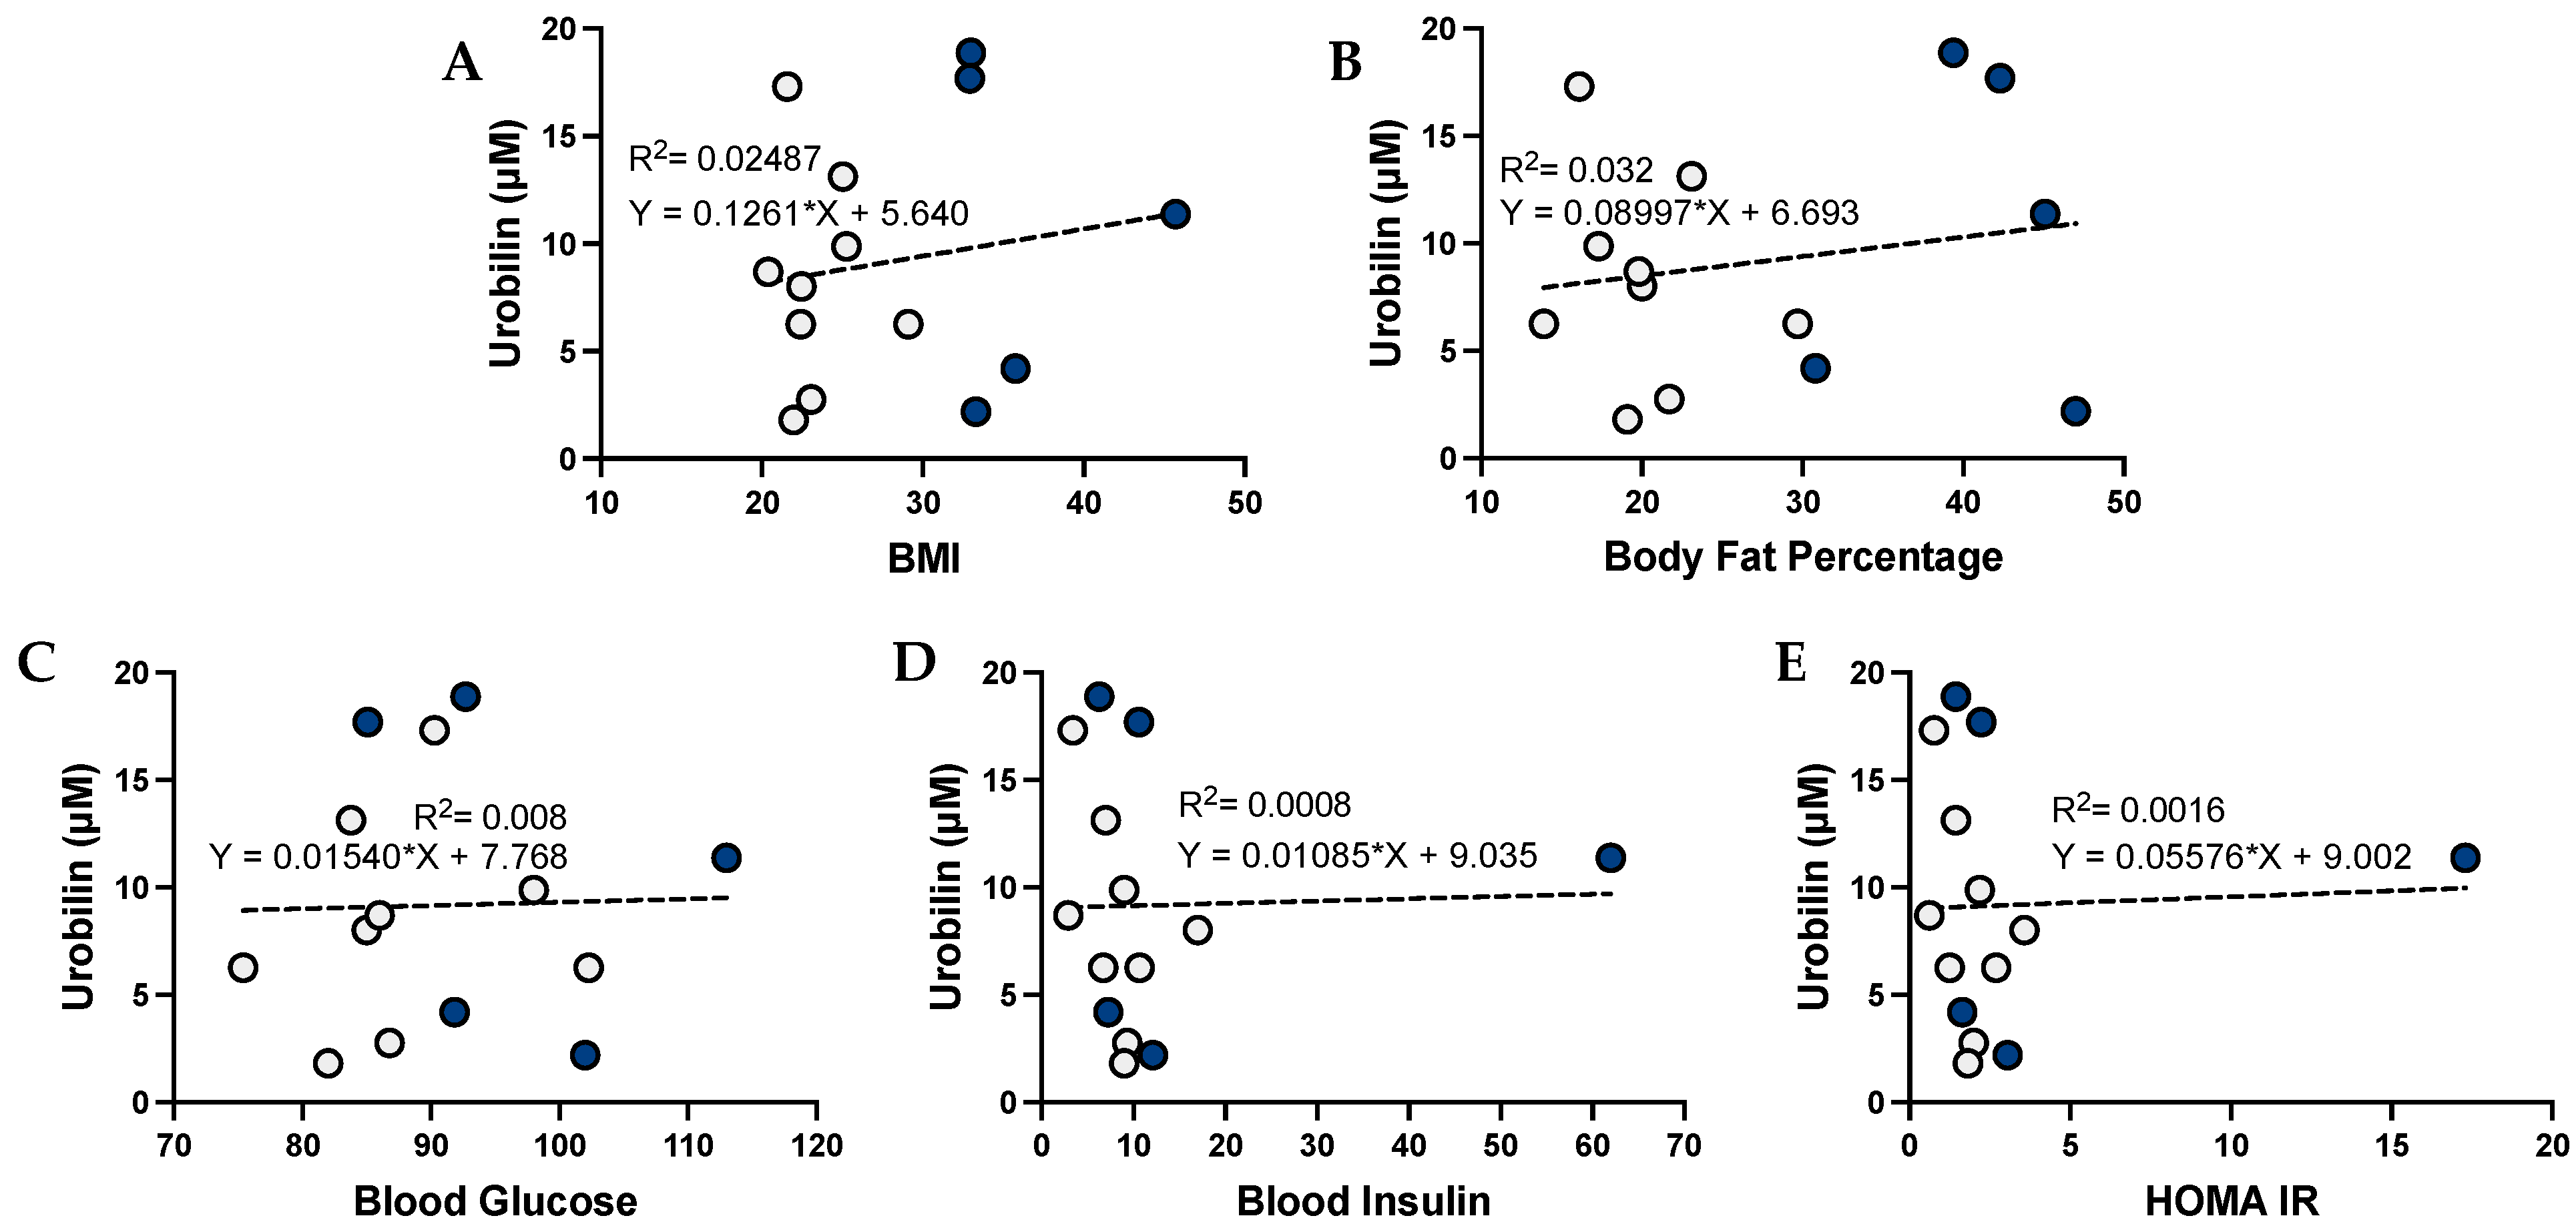
3.3. Urobilin and Its Correlation with Metabolic Dysfunction in Humans

The level of urobilin in the plasma has been previously associated with adiposity. We found that urobilin was positively correlated with BMI (p = 0.0459), body fat percentage (p = 0.0084), plasma glucose, plasma insulin, and HOMA IR (Figure 2). We then wanted to analyze whether this correlation was sex specific. We found that urobilin was positively correlated with higher BMI, body fat percentage, plasma insulin, and HOMA IR in females (Figure 3). In men, urobilin levels were positively associated with these but weakly with R2 below 0.03 (Figure 4).

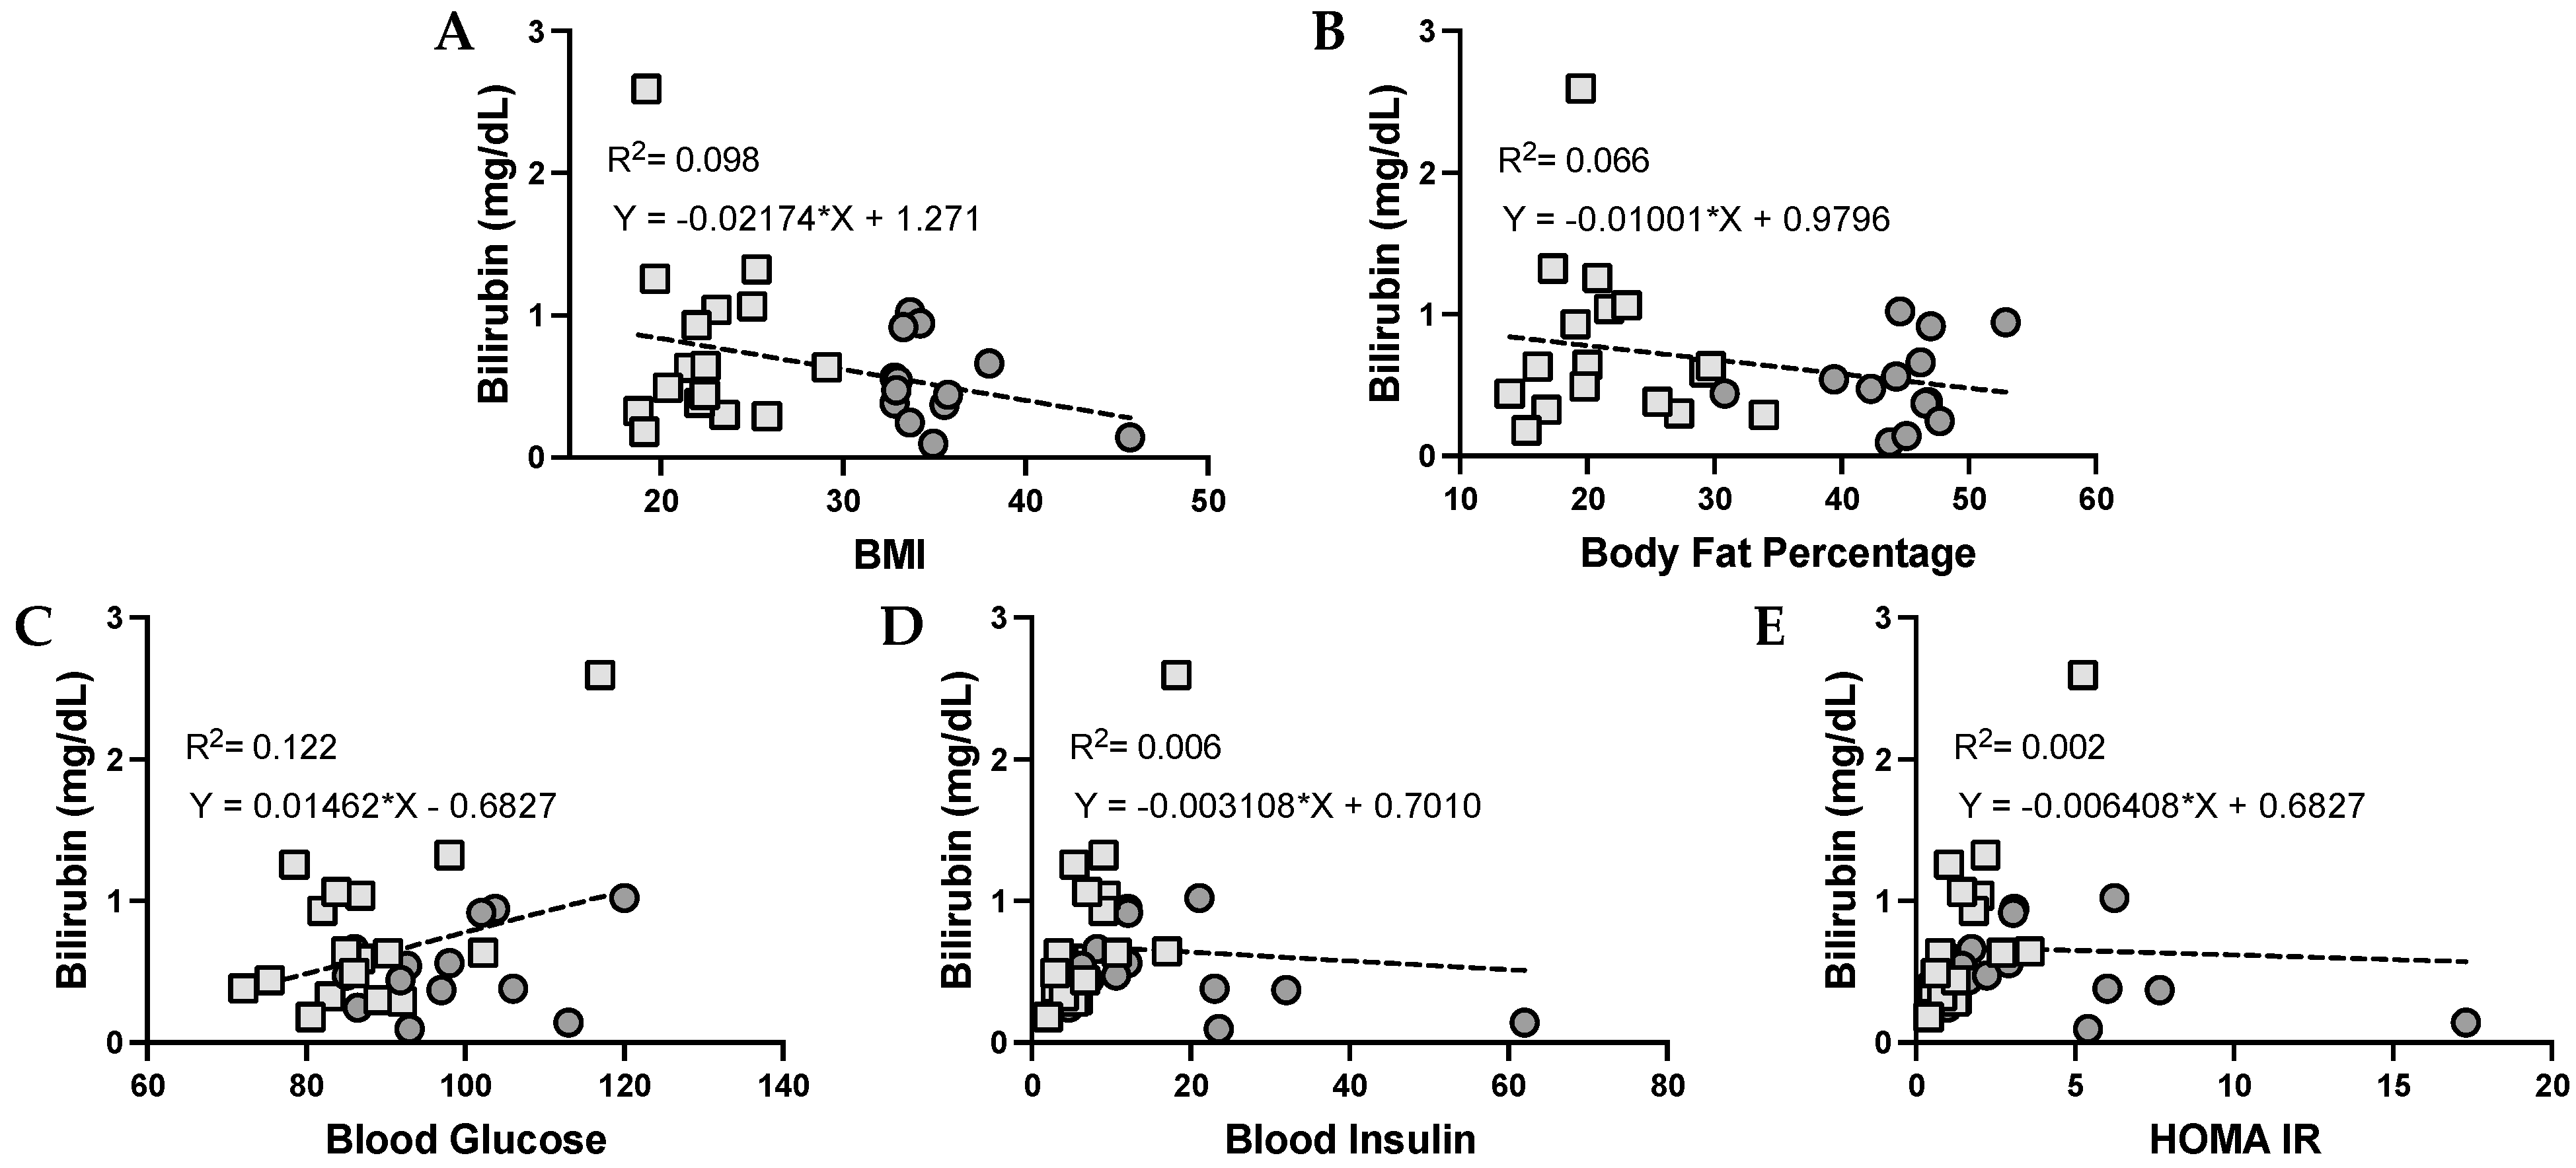
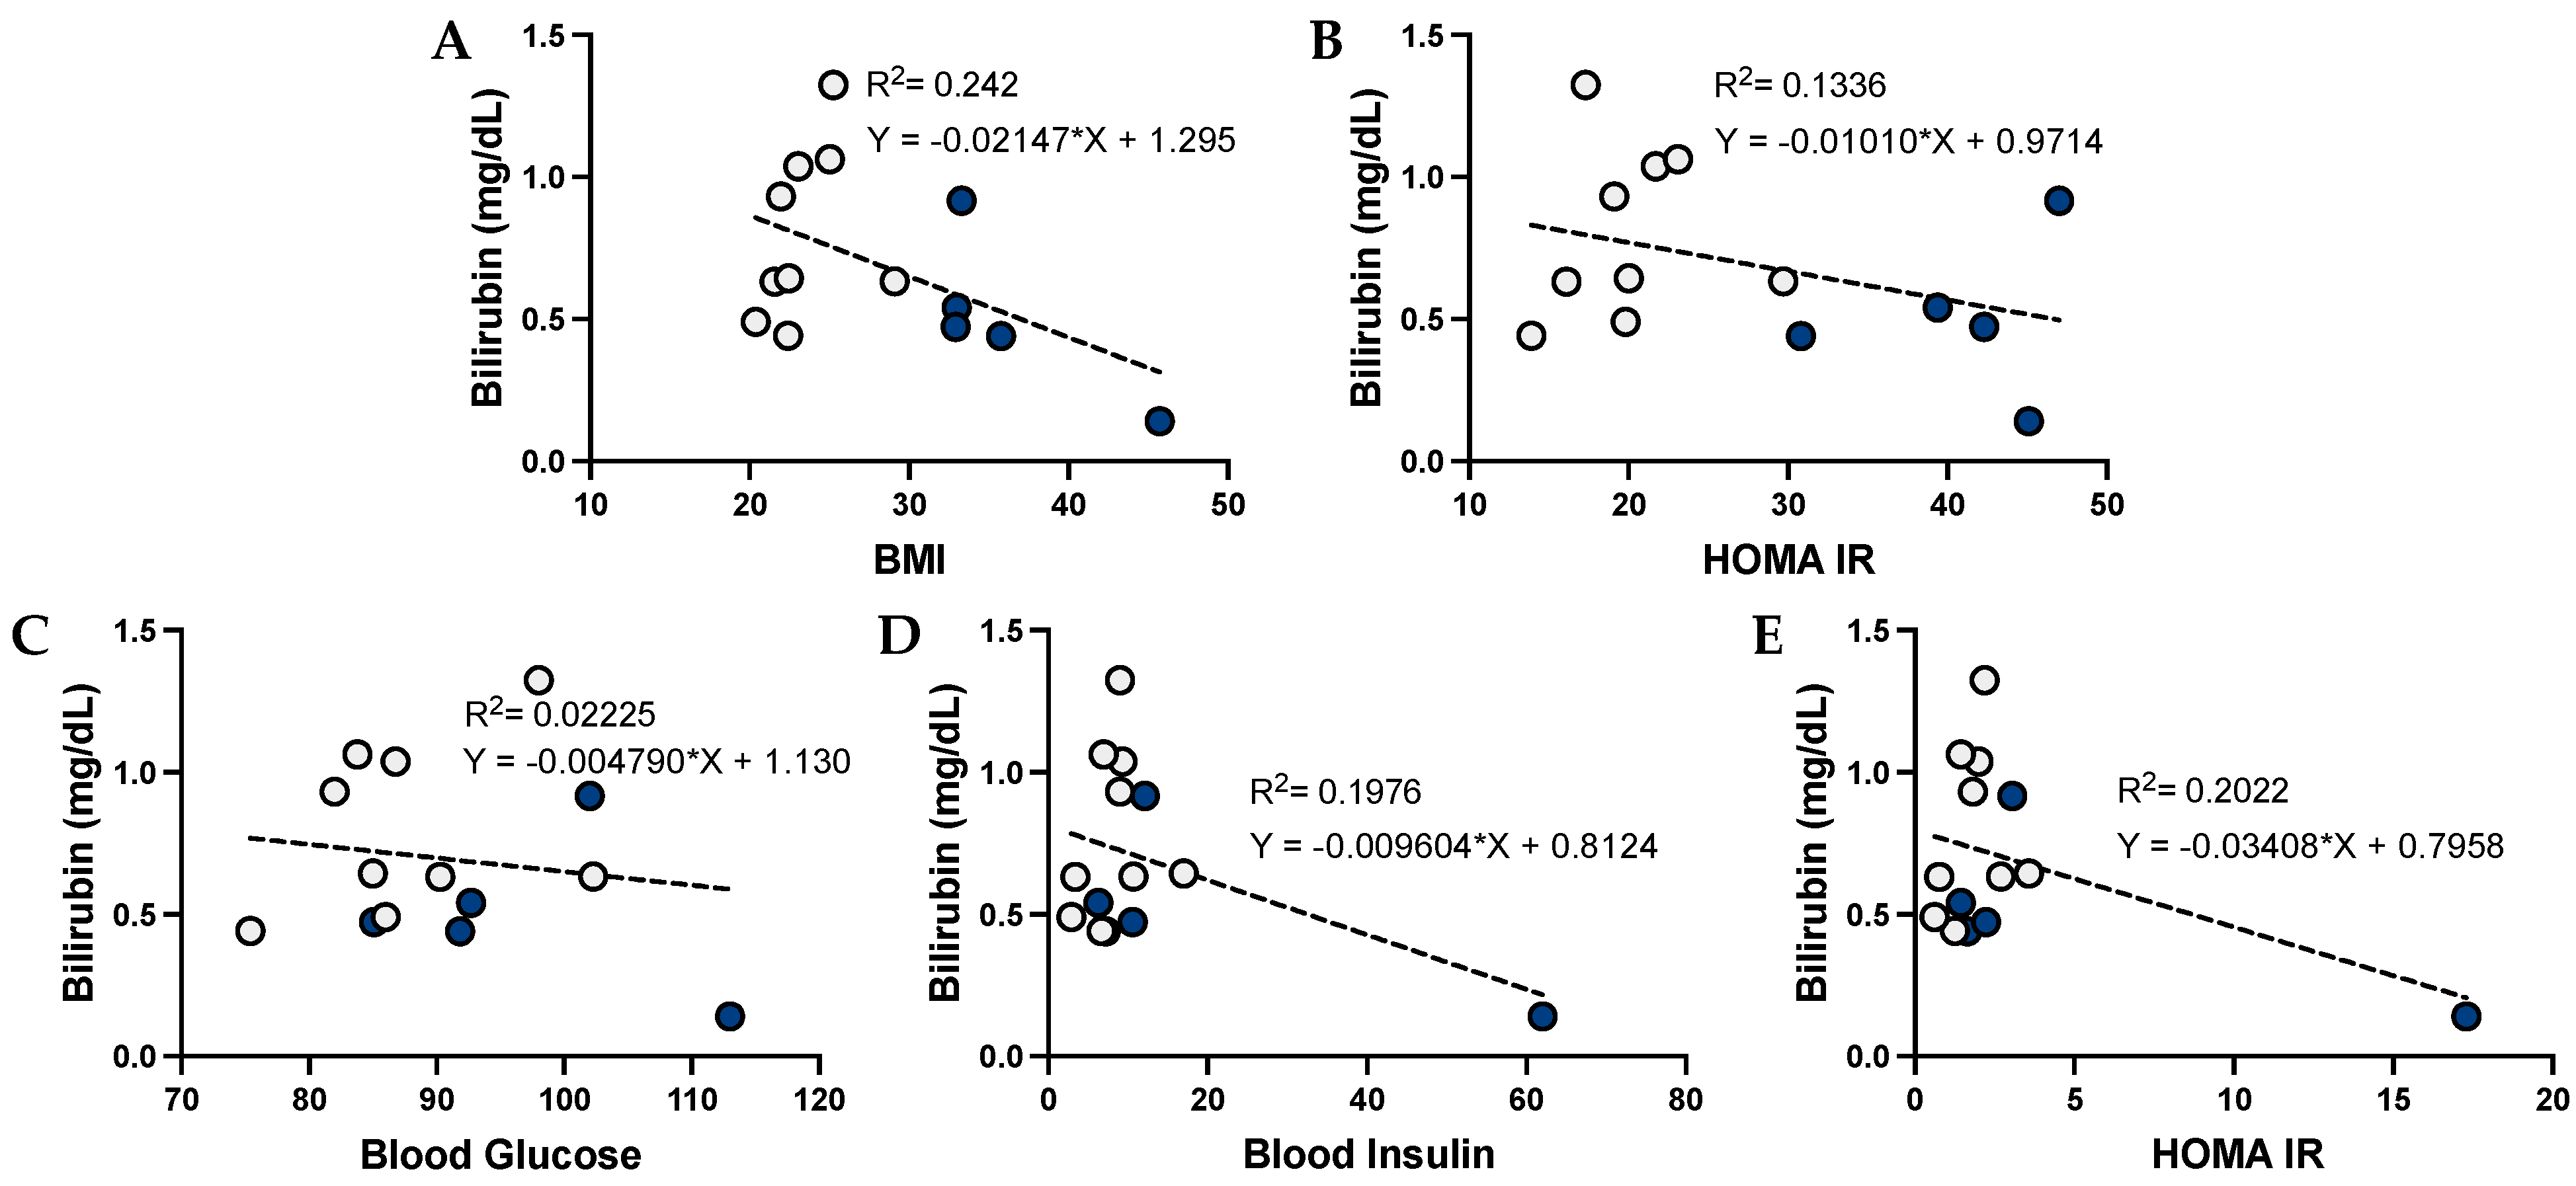
3.4. Bilirubin and Its Correlation with Metabolic Dysfunction in Humans

To determine whether bilirubin might have the opposite correlations to those observed with urobilin, we compared plasma total bilirubin levels with the metabolic readouts. Plasma bilirubin levels were negatively associated with BMI (p = 0.0924) and body fat percentage in women and men combined (Figure 5). This association was still seen when the sexes were analyzed separately (Figure 6 and Figure 7). Interestingly, the negative association was stronger in males, with an R2 = 0.242 for BMI and R2 = 0.1336 for body fat percentage, as compared to R2 = 0.065 in females for BMI and R2 = 0.047 for body fat percentage.

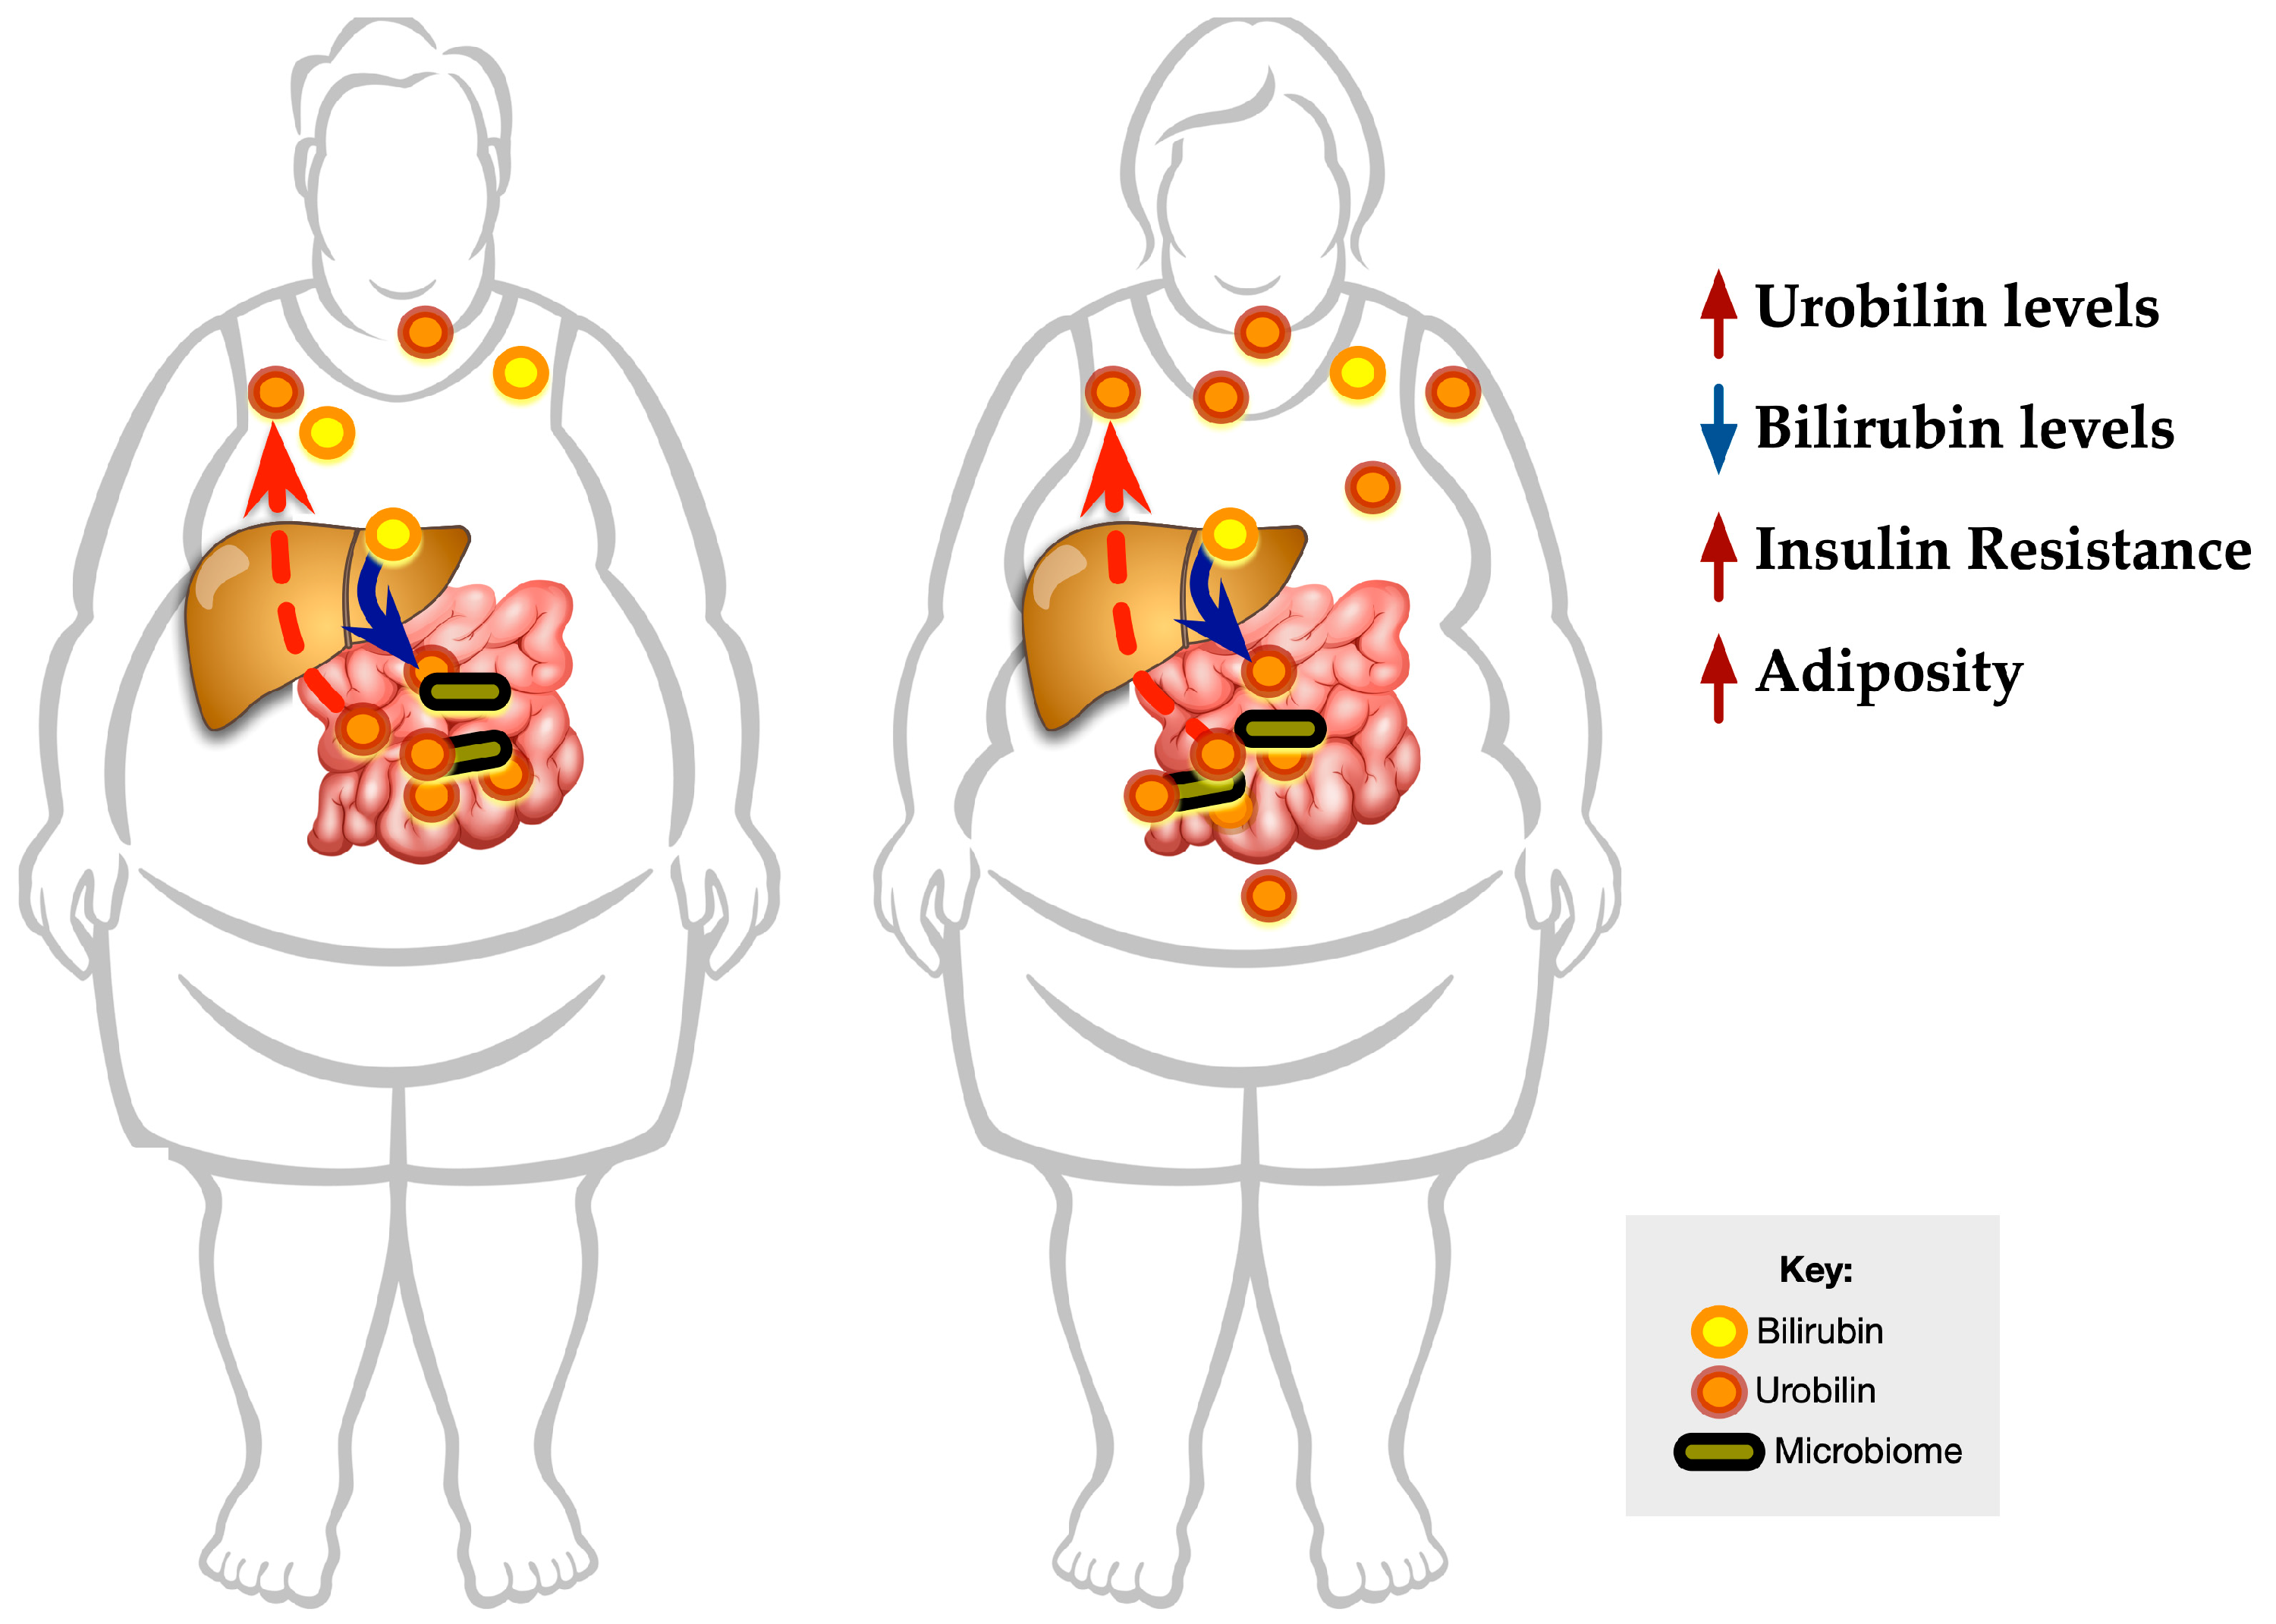
3.5. Graphical Representation of the Data

The data above indicate that higher plasma urobilin levels are associated with insulin resistance in the obese. The metabolic rearrangements in obesity are likely linked to lower plasma bilirubin and higher urobilin levels. Additionally, urobilin might be a factor that worsens obesity-associated comorbidities, such as insulin resistance and cardiovascular diseases (Figure 8).

4. Discussion

The significance of our study is in the finding that urobilin may have negative consequences pertinent to insulin resistance and may worsen obesity-related comorbidities. To our knowledge, the involvement of urobilin in insulin resistance in humans has not previously been reported. In experimental animals, studies in obese and lean mice using non-targeting mass spectrophotometry found that urobilin was higher in the liver and colon of the obese [28,29], and urobilin was the most associated cecal metabolite for acute myocardial ischemia [29]. Whether nutrients from the diet or other factors increase urobilin levels are unknown. Earlier studies in the late 1990s on bilirubin showed that plasma levels are typically reduced in obese humans, which influenced numerous studies in humans and rodents comparing the levels in those with metabolic dysfunction (reviewed in [2]).
In 1997, work by Torgerson et al. first showed that plasma bilirubin levels were decreased in humans with metabolic syndrome, even though they had elevated aminotransferases (AST and ALT) [30]. We found a similar finding with bilirubin levels in our study, such as that obese men and women had a negative correlation with adiposity and body weight. The studies that demonstrated that the UGT1A1 enzyme is higher in obese mice [18,19] made us curious whether lower bilirubin levels were associated with an increase in its catabolized product, urobilin. Our data here from obese and lean women and men indicate that urobilin might be a factor that either contributes to adiposity or might worsen obesity-associated comorbidities.
The urobilin levels were likely raised due to the increased expression of the UGT1A1 glucuronosyltransferase that conjugates bilirubin [20], providing more substrates to the gut for catabolism into urobilin [6]. The UGT1A1 expression has been shown to be higher in obese mice, as compared to lean mice [18,19]. This aspect is in line with the findings that plasma bilirubin levels are lower in the obese. However, these mechanisms have yet to be proven and could be multifactorial. For instance, a study in high aerobic-capacity running rats showed that they have significantly higher plasma bilirubin levels because the enzyme that converts biliverdin to bilirubin, biliverdin reductase A (BVRA) [7], was significantly higher in the liver, and UGT1A1 was lower [31]. Some studies have focused solely on the induction of heme oxygenase-1 (HO-1) as the means of increasing plasma bilirubin levels [32]. None of the studies that have measured the heme oxygenase pathway have also analyzed the urobilin levels in the serum or intestine. Based on our findings here, this might be useful for understanding the metabolic state.
In a recent study in elite athletes, serum bilirubin levels were observed to be substantially higher [33]. However, only the bilirubin levels were quantitated and not the urobilin. They also found that the prevalence of Gilbert’s syndrome and hyperbilirubinemia in athletes was significant [33]. These observations suggest that moderately increasing plasma bilirubin predisposes a better physical performance, which is also supported by the finding that regular physical activity elevates serum bilirubin concentrations [34,35] (and was also reviewed in [36,37]). Rats that had a loss-of-function mutation in their Ugt1a1 gene exhibited hyperbilirubinemia and were protected against hypertension and end-stage organ damage [38,39,40,41,42]. New findings have shown that bilirubin is a hormone that directly binds to the fat-burning nuclear receptor PPARα [13,15,17]. A knockout of the enzyme that generates bilirubin, BVRA, causes a bilirubin deficiency that induces oxidative stress, increases lipid accumulation, and reduces PPARα activity [12,43,44,45,46,47]. The bilirubin-PPARα interaction activates a response that lowers lipid accumulation in the liver and adipose tissues [2,3,4,5,6,13,14,15,16,17,31,48,49,50]. Hence, the therapeutic use of bilirubin has been proposed for improving obesity and metabolic dysfunction [2,3,5].
The antioxidant [8,9,10], anti-inflammatory [36], and fat-burning traits of bilirubin make it an ideal therapeutic, especially since it has been shown to also improve cardiovascular function [2,3,4,5,11,12,31,32,48,49,51,52,53]. Bilirubin nanoparticle treatments in obese mice have been shown to increase lean mass, reduce adiposity, and lower blood glucose [15]. Numerous human studies have shown that unconjugated bilirubin levels are inversely associated with non-alcoholic fatty liver disease (NAFLD) and non-alcoholic steatohepatitis (NASH) [30,54,55,56,57,58]. There has been some published work showing that unconjugated bilirubin levels could be higher in some fatty liver patients or were not causally associated with a decreased risk of NAFLD [59,60]. Another study using a diet-induced obesity fatty liver model demonstrated that increasing plasma bilirubin and bilirubin nanoparticle treatments improved NAFLD while not causing liver toxicity [14,17,50], they actually improved NAFLD and liver function by reducing the AST liver dysfunction biomarker, lowered hepatic inflammation, and decreased the percent liver fat content [14,50]. These suggest that higher bilirubin levels may promote physical and hepatic health.
The negative correlation of plasma bilirubin found in obese men and women in this study is not surprising, as this has been reported numerous times. There is plausible evidence that low bilirubin levels are deleterious and contribute to metabolic diseases [30,61,62,63,64,65,66,67,68,69]. Investigations on factors that mediate bilirubin and urobilin levels are needed to understand their interplay better. For instance, the finding that urobilin levels were not significantly higher in obese men but were in women was surprising. There could be many variables involved, such as that the men were not insulin resistant. Another could be that the gut microbiome may be different between the sexes and contain fewer bacteria that express bilirubin reductase, which is the enzyme thought to catabolize conjugated bilirubin into urobilin [6]. However, the bilirubin reductase enzyme has yet to be identified. Studies to identify bilirubin reductase and the bacteria that express it are needed. An approach being investigated is the suppression of the hepatic UGT1A1 for increasing the half-life of circulating bilirubin as a possible means of treating obesity [2].
Humans with Gilbert’s polymorphism UGT1A1*28 have a significantly reduced expression of the UGT1A1 enzyme as a result of a base pair insertion in the gene promoter (TA7/7 promoter gene variant) [2]. Studies have shown that patients with Gilbert’s polymorphism and higher plasma bilirubin levels have less incidence of metabolic diseases, such as obesity and type 2 diabetes mellitus (T2DM) [2,6,70]. Experimental studies in mice with the human Gilbert’s syndrome polymorphism (UGT1A1*28) were shown to have moderate hyperbilirubinemia and were protected from high-fat diet-induced hepatic steatosis (NAFLD) and insulin resistance [50]. The studies here found that plasma total bilirubin and urobilin are inversely associated, likely due to increased UGT1A1 expression, indicating that regulating its expression may benefit metabolic dysfunction.

5. Conclusions

A better understanding of the indications of plasma levels of bilirubin and urobilin is needed as well as what implications their levels have in various disease states. Our study here, using a small cohort of lean and obese humans, is the first to report that plasma urobilin levels are positively associated with obesity-induced comorbidities, such as insulin resistance. It should be noted that a limitation of this study is the sample size, and larger investigations are needed to determine whether urobilin is indeed a player in adiposity and insulin resistance, including pre-clinical studies to determine causality. Others have reported that urobilin levels are associated with significantly more visceral fat in obese humans [21], cardiovascular disease [22], and mortality in diabetic patients [23]. These findings indicate that larger human association studies are needed to better understand the impact that urobilin might have on obesity-induced comorbidities. There needs to be more known about the physiology and function of urobilin. Studies to identify bilirubin reductase in bacteria and those that express it are also needed. Future studies to determine mechanisms that reduce urobilin and increase bilirubin levels in the plasma could benefit those with metabolic and cardiovascular complications.

Author Contributions

T.D.H.J. conceived the project and designed the experiments; M.X., E.A.B. and W.-H.L. measured the plasma urobilin; M.X. completed the bilirubin measurements; Z.A.K. created the graphs, performed the correlation analysis, and generated the figures; Z.A.K., M.X. and E.A.B. analyzed and interpreted the data; Z.A.K., M.X., P.A.K. and T.D.H.J. wrote the manuscript; Z.A.K., M.X., E.A.B., W.-H.L., P.A.K. and T.D.H.J. reviewed and revised the final manuscript. All authors have read and agreed to the published version of the manuscript.

Funding

This work was supported by the National Institutes of Health R01DK121797 (T.D.H.J.). The sample collection was supported by the Center for Clinical and Translational Science (CCTS) grant UL1TR001998 at the University of Kentucky. The content is solely the responsibility of the authors and does not necessarily represent the official views of the National Institutes of Health.

Institutional Review Board Statement

The study was conducted in accordance with the Declaration of Helsinki and approved by the Institutional Review Board (or Ethics Committee) of the University of Kentucky (protocol #46746 and approval 6 May 2021).

Informed Consent Statement

Informed consent was obtained from all subjects involved in the study.

Data Availability Statement

The data presented in this study are available on request from the corresponding author.

Acknowledgments

The human plasma samples were provided by the University of Kentucky Center for Muscle Biology. The authors thank Hunter Moseley at the Institute for Biomedical Informatics at the University of Kentucky for his close review of our manuscript and data.

Conflicts of Interest

T.D.H.J. has submitted patents on bilirubin and obesity-related disorders. The other authors have nothing to declare or any conflict of interest.

References

  1. Weir, C.B.; Jan, A. BMI Classification Percentile and Cut Off Points; StatPearls: Treasure Island, FL, USA, 2022. [Google Scholar]
  2. Creeden, J.F.; Gordon, D.M.; Stec, D.E.; Hinds, T.D., Jr. Bilirubin as a metabolic hormone: The physiological relevance of low levels. Am. J. Physiol. Endocrinol. Metab. 2021, 320, E191–E207. [Google Scholar] [CrossRef] [PubMed]
  3. Hinds, T.D., Jr.; Stec, D.E. Bilirubin Safeguards Cardiorenal and Metabolic Diseases: A Protective Role in Health. Curr. Hypertens. Rep. 2019, 21, 87. [Google Scholar] [CrossRef] [PubMed]
  4. Weaver, L.; Hamoud, A.R.; Stec, D.E.; Hinds, T.D., Jr. Biliverdin reductase and bilirubin in hepatic disease. Am. J. Physiol. Gastrointest. Liver Physiol. 2018, 314, G668–G676. [Google Scholar] [CrossRef]
  5. Hinds, T.D., Jr.; Stec, D.E. Bilirubin, a Cardiometabolic Signaling Molecule. Hypertension 2018, 72, 788–795. [Google Scholar] [CrossRef]
  6. Hamoud, A.R.; Weaver, L.; Stec, D.E.; Hinds, T.D., Jr. Bilirubin in the Liver-Gut Signaling Axis. Trends Endocrinol. Metab. 2018, 29, 140–150. [Google Scholar] [CrossRef] [PubMed]
  7. O’Brien, L.; Hosick, P.A.; John, K.; Stec, D.E.; Hinds, T.D., Jr. Biliverdin reductase isozymes in metabolism. Trends Endocrinol. Metab. 2015, 26, 212–220. [Google Scholar] [CrossRef] [Green Version]
  8. Jansen, T.; Daiber, A. Direct Antioxidant Properties of Bilirubin and Biliverdin. Is there a Role for Biliverdin Reductase? Front. Pharm. 2012, 3, 30. [Google Scholar] [CrossRef] [Green Version]
  9. Stocker, R.; Yamamoto, Y.; McDonagh, A.F.; Glazer, A.N.; Ames, B.N. Bilirubin is an antioxidant of possible physiological importance. Science 1987, 235, 1043–1046. [Google Scholar] [CrossRef]
  10. Stocker, R.; Peterhans, E. Antioxidant properties of conjugated bilirubin and biliverdin: Biologically relevant scavenging of hypochlorous acid. Free Radic. Res. Commun. 1989, 6, 57–66. [Google Scholar] [CrossRef]
  11. Li, Y.; Huang, B.; Ye, T.; Wang, Y.; Xia, D.; Qian, J. Physiological concentrations of bilirubin control inflammatory response by inhibiting NF-κB and inflammasome activation. Int. Immunopharmacol. 2020, 84, 106520. [Google Scholar] [CrossRef]
  12. Chen, W.; Tumanov, S.; Fazakerley, D.J.; Cantley, J.; James, D.E.; Dunn, L.L.; Shaik, T.; Suarna, C.; Stocker, R. Bilirubin deficiency renders mice susceptible to hepatic steatosis in the absence of insulin resistance. Redox Biol. 2021, 47, 102152. [Google Scholar] [CrossRef] [PubMed]
  13. Gordon, D.M.; Hong, S.H.; Kipp, Z.A.; Hinds, T.D., Jr. Identification of Binding Regions of Bilirubin in the Ligand-Binding Pocket of the Peroxisome Proliferator-Activated Receptor-A (PPARalpha). Molecules 2021, 26, 2975. [Google Scholar] [CrossRef] [PubMed]
  14. Hinds, T.D., Jr.; Creeden, J.F.; Gordon, D.M.; Stec, D.F.; Donald, M.C.; Stec, D.E. Bilirubin Nanoparticles Reduce Diet-Induced Hepatic Steatosis, Improve Fat Utilization, and Increase Plasma beta-Hydroxybutyrate. Front. Pharm. 2020, 11, 594574. [Google Scholar] [CrossRef]
  15. Gordon, D.M.; Neifer, K.L.; Hamoud, A.A.; Hawk, C.F.; Nestor-Kalinoski, A.L.; Miruzzi, S.A.; Morran, M.P.; Adeosun, S.O.; Sarver, J.G.; Erhardt, P.W.; et al. Bilirubin remodels murine white adipose tissue by reshaping mitochondrial activity and the coregulator profile of peroxisome proliferator-activated receptor alpha. J. Biol. Chem. 2020, 295, 9804–9822. [Google Scholar] [CrossRef]
  16. Gordon, D.M.; Blomquist, T.M.; Miruzzi, S.A.; McCullumsmith, R.; Stec, D.E.; Hinds, T.D., Jr. RNA sequencing in human HepG2 hepatocytes reveals PPAR-alpha mediates transcriptome responsiveness of bilirubin. Physiol. Genom. 2019, 51, 234–240. [Google Scholar] [CrossRef]
  17. Stec, D.E.; John, K.; Trabbic, C.J.; Luniwal, A.; Hankins, M.W.; Baum, J.; Hinds, T.D., Jr. Bilirubin Binding to PPARalpha Inhibits Lipid Accumulation. PLoS ONE 2016, 11, e0153427. [Google Scholar] [CrossRef] [Green Version]
  18. Wang, P.; Shao, X.; Bao, Y.; Zhu, J.; Chen, L.; Zhang, L.; Ma, X.; Zhong, X.B. Impact of obese levels on the hepatic expression of nuclear receptors and drug-metabolizing enzymes in adult and offspring mice. Acta Pharm. Sin. B 2020, 10, 171–185. [Google Scholar] [CrossRef]
  19. Xu, J.; Kulkarni, S.R.; Li, L.; Slitt, A.L. UDP-glucuronosyltransferase expression in mouse liver is increased in obesity- and fasting-induced steatosis. Drug Metab. Dispos. Biol. Fate Chem. 2012, 40, 259–266. [Google Scholar] [CrossRef] [Green Version]
  20. Sundararaghavan, V.L.; Sindhwani, P.; Hinds, T.D., Jr. Glucuronidation and UGT isozymes in bladder: New targets for the treatment of uroepithelial carcinomas? Oncotarget 2017, 8, 3640–3648. [Google Scholar] [CrossRef] [Green Version]
  21. Baek, S.H.; Kim, M.; Kim, M.; Kang, M.; Yoo, H.J.; Lee, N.H.; Kim, Y.H.; Song, M.; Lee, J.H. Metabolites distinguishing visceral fat obesity and atherogenic traits in individuals with overweight. Obesity 2017, 25, 323–331. [Google Scholar] [CrossRef]
  22. Stenemo, M.; Ganna, A.; Salihovic, S.; Nowak, C.; Sundstrom, J.; Giedraitis, V.; Broeckling, C.D.; Prenni, J.E.; Svensson, P.; Magnusson, P.K.E.; et al. The metabolites urobilin and sphingomyelin (30:1) are associated with incident heart failure in the general population. ESC Heart Fail. 2019, 6, 764–773. [Google Scholar] [CrossRef] [Green Version]
  23. Ottosson, F.; Smith, E.; Fernandez, C.; Melander, O. Plasma Metabolites Associate with All-Cause Mortality in Individuals with Type 2 Diabetes. Metabolites 2020, 10, 315. [Google Scholar] [CrossRef]
  24. Matthews, D.R.; Hosker, J.P.; Rudenski, A.S.; Naylor, B.A.; Treacher, D.F.; Turner, R.C. Homeostasis model assessment: Insulin resistance and beta-cell function from fasting plasma glucose and insulin concentrations in man. Diabetologia 1985, 28, 412–419. [Google Scholar] [CrossRef] [Green Version]
  25. Culliton, K.; Louati, H.; Laneuville, O.; Ramsay, T.; Trudel, G. Six degrees head-down tilt bed rest caused low-grade hemolysis: A prospective randomized clinical trial. npj Microgravity 2021, 7, 4. [Google Scholar] [CrossRef]
  26. Kotal, P.; Fevery, J. Quantitation of urobilinogen in feces, urine, bile and serum by direct spectrophotometry of zinc complex. Clin. Chim. Acta 1991, 202, 1–9. [Google Scholar] [CrossRef] [PubMed]
  27. Trudel, G.; Uhthoff, H.K.; Laneuville, O. Hemolysis during and after 21 days of head--down--tilt bed rest. Physiol. Rep. 2017, 5, e13469. [Google Scholar] [CrossRef] [PubMed]
  28. Walker, A.; Pfitzner, B.; Neschen, S.; Kahle, M.; Harir, M.; Lucio, M.; Moritz, F.; Tziotis, D.; Witting, M.; Rothballer, M.; et al. Distinct signatures of host-microbial meta-metabolome and gut microbiome in two C57BL/6 strains under high-fat diet. ISME J. 2014, 8, 2380–2396. [Google Scholar] [CrossRef] [Green Version]
  29. Sun, L.; Jia, H.; Li, J.; Yu, M.; Yang, Y.; Tian, D.; Zhang, H.; Zou, Z. Cecal Gut Microbiota and Metabolites Might Contribute to the Severity of Acute Myocardial Ischemia by Impacting the Intestinal Permeability, Oxidative Stress, and Energy Metabolism. Front. Microbiol. 2019, 10, 1745. [Google Scholar] [CrossRef] [PubMed] [Green Version]
  30. Torgerson, J.S.; Lindroos, A.K.; Sjostrom, C.D.; Olsson, R.; Lissner, L.; Sjostrom, L. Are elevated aminotransferases and decreased bilirubin additional characteristics of the metabolic syndrome? Obes. Res. 1997, 5, 105–114. [Google Scholar] [CrossRef] [PubMed]
  31. Hinds, T.D., Jr.; Creeden, J.F.; Gordon, D.M.; Spegele, A.C.; Britton, S.L.; Koch, L.G.; Stec, D.E. Rats Genetically Selected for High Aerobic Exercise Capacity Have Elevated Plasma Bilirubin by Upregulation of Hepatic Biliverdin Reductase-A (BVRA) and Suppression of UGT1A1. Antioxidants 2020, 9, 889. [Google Scholar] [CrossRef] [PubMed]
  32. Stec, D.E.; Hinds, T.D., Jr. Natural Product Heme Oxygenase Inducers as Treatment for Nonalcoholic Fatty Liver Disease. Int. J. Mol. Sci. 2020, 21, 9493. [Google Scholar] [CrossRef] [PubMed]
  33. Woronyczova, J.; Novákova, M.; Lenicek, M.; Batovsky, M.; Bolek, E.; Cifkova, R.; Vitek, L. Serum bilirubin concentrations and the prevalence of Gilbert syndrome in elite athletes. Sport. Med. Open Access 2022, 8, 84. [Google Scholar] [CrossRef]
  34. Swift, D.L.; Johannsen, N.M.; Earnest, C.P.; Blair, S.N.; Church, T.S. Effect of different doses of aerobic exercise training on total bilirubin levels. Med. Sci. Sport. Exerc. 2012, 44, 569–574. [Google Scholar] [CrossRef] [Green Version]
  35. Loprinzi, P.D.; Abbott, K. Physical activity and total serum bilirubin levels among insulin sensitive and insulin resistant U.S. adults. J. Diabetes Metab. Disord. 2014, 13, 47. [Google Scholar] [CrossRef] [PubMed] [Green Version]
  36. Thomas, D.T.; DelCimmuto, N.R.; Flack, K.D.; Stec, D.E.; Hinds, T.D., Jr. Reactive Oxygen Species (ROS) and Antioxidants as Immunomodulators in Exercise: Implications for Heme Oxygenase and Bilirubin. Antioxidants 2022, 11, 179. [Google Scholar] [CrossRef]
  37. Flack, K.D.; Vítek, L.; Fry, C.; Stec, D.E.; Hinds, T.D., Jr. Cutting Edge Concepts: Does Bilirubin Enhance Exercise Performance? Front. Sport. Act. Living 2022, 4, 509. [Google Scholar] [CrossRef]
  38. Nath, K.A.; d’Uscio, L.V.; Juncos, J.P.; Croatt, A.J.; Manriquez, M.C.; Pittock, S.T.; Katusic, Z.S. An analysis of the DOCA-salt model of hypertension in HO-1-/- mice and the Gunn rat. Am. J. Physiol. Heart Circ. Physiol. 2007, 293, H333–H342. [Google Scholar] [CrossRef] [PubMed] [Green Version]
  39. Pflueger, A.; Croatt, A.J.; Peterson, T.E.; Smith, L.A.; d’Uscio, L.V.; Katusic, Z.S.; Nath, K.A. The hyperbilirubinemic Gunn rat is resistant to the pressor effects of angiotensin II. Am. J. Physiol. Ren. Physiol. 2005, 288, F552–F558. [Google Scholar] [CrossRef]
  40. Bakrania, B.; Du Toit, E.F.; Ashton, K.J.; Kiessling, C.J.; Wagner, K.H.; Headrick, J.P.; Bulmer, A.C. Hyperbilirubinemia modulates myocardial function, aortic ejection, and ischemic stress resistance in the Gunn rat. Am. J. Physiol. Heart Circ. Physiol. 2014, 307, H1142–H1149. [Google Scholar] [CrossRef] [Green Version]
  41. Bakrania, B.; Du Toit, E.F.; Ashton, K.J.; Wagner, K.H.; Headrick, J.P.; Bulmer, A.C. Chronically elevated bilirubin protects from cardiac reperfusion injury in the male Gunn rat. Acta Physiol. 2017, 220, 461–470. [Google Scholar] [CrossRef]
  42. Bianco, A.; Pinci, S.; Tiribelli, C.; Bellarosa, C. Life-Long Hyperbilirubinemia Exposure and Bilirubin Priming Prevent In Vitro Metabolic Damage. Front Pharm. 2021, 12, 646953. [Google Scholar] [CrossRef] [PubMed]
  43. Gordon, D.M.; Adeosun, S.O.; Ngwudike, S.I.; Anderson, C.D.; Hall, J.E.; Hinds, T.D., Jr.; Stec, D.E. CRISPR Cas9-mediated deletion of biliverdin reductase A (BVRA) in mouse liver cells induces oxidative stress and lipid accumulation. Arch. Biochem. Biophys. 2019, 672, 108072. [Google Scholar] [CrossRef] [PubMed]
  44. Hinds, T.D., Jr.; Burns, K.A.; Hosick, P.A.; McBeth, L.; Nestor-Kalinoski, A.; Drummond, H.A.; AlAmodi, A.A.; Hankins, M.W.; Vanden Heuvel, J.P.; Stec, D.E. Biliverdin reductase A attenuates hepatic steatosis by inhibition of glycogen synthase kinase (GSK) 3beta phosphorylation of serine 73 of peroxisome proliferator-activated receptor (PPAR) alpha. J. Biol. Chem. 2016, 291, 25179–25191. [Google Scholar] [CrossRef] [Green Version]
  45. Stec, D.E.; Gordon, D.M.; Nestor-Kalinoski, A.L.; Donald, M.C.; Mitchell, Z.L.; Creeden, J.F.; Hinds, T.D., Jr. Biliverdin Reductase A (BVRA) Knockout in Adipocytes Induces Hypertrophy and Reduces Mitochondria in White Fat of Obese Mice. Biomolecules 2020, 10, 387. [Google Scholar] [CrossRef] [Green Version]
  46. Chen, W.; Maghzal, G.J.; Ayer, A.; Suarna, C.; Dunn, L.L.; Stocker, R. Absence of the biliverdin reductase-a gene is associated with increased endogenous oxidative stress. Free Radic. Biol. Med. 2018, 115, 156–165. [Google Scholar] [CrossRef] [PubMed]
  47. Adeosun, S.O.; Moore, K.H.; Lang, D.M.; Nwaneri, A.C.; Hinds, T.D., Jr.; Stec, D.E. A Novel Fluorescence-Based Assay for the Measurement of Biliverdin Reductase Activity. React. Oxyg. Species 2018, 5, 35–45. [Google Scholar] [CrossRef] [PubMed] [Green Version]
  48. Hong, S.; Gordon, D.; Stec, D.E.; Hinds, T.D. Bilirubin: A Ligand of the PPARα Nuclear Receptor. In Nuclear Receptors: The Art and Science of Modulator Design and Discovery; Badr, M.Z., Ed.; Springer International Publishing: Cham, Switzerland, 2021; pp. 463–482. [Google Scholar] [CrossRef]
  49. Sundararaghavan, V.L.; Binepal, S.; Stec, D.E.; Sindhwani, P.; Hinds, T.D., Jr. Bilirubin, a new therapeutic for kidney transplant? Transplant. Rev. 2018, 32, 234–240. [Google Scholar] [CrossRef]
  50. Hinds, T.D., Jr.; Hosick, P.A.; Hankins, M.W.; Nestor-Kalinoski, A.; Stec, D.E. Mice with hyperbilirubinemia due to Gilbert’s Syndrome polymorphism are resistant to hepatic steatosis by decreased serine 73 phosphorylation of PPARalpha. Am. J. Physiol. Endocrinol. Metab. 2017, 312, E244–E252. [Google Scholar] [CrossRef] [Green Version]
  51. Adeosun, S.O.; Gordon, D.M.; Weeks, M.F.; Moore, K.H.; Hall, J.E.; Hinds, T.D., Jr.; Stec, D.E. Loss of biliverdin reductase-A promotes lipid accumulation and lipotoxicity in mouse proximal tubule cells. Am. J. Physiol. Renal Physiol. 2018, 315, F323–F331. [Google Scholar] [CrossRef]
  52. Vitek, L.; Tiribelli, C. Bilirubin: The yellow hormone? J. Hepatol. 2021, 75, 1485–1490. [Google Scholar] [CrossRef]
  53. Ai, W.; Bae, S.; Ke, Q.; Su, S.; Li, R.; Chen, Y.; Yoo, D.; Lee, E.; Jon, S.; Kang, P.M. Bilirubin Nanoparticles Protect Against Cardiac Ischemia/Reperfusion Injury in Mice. J. Am. Heart Assoc. 2021, 10, e021212. [Google Scholar] [CrossRef]
  54. Hjelkrem, M.; Morales, A.; Williams, C.D.; Harrison, S.A. Unconjugated hyperbilirubinemia is inversely associated with non-alcoholic steatohepatitis (NASH). Aliment. Pharmacol. Ther. 2012, 35, 1416–1423. [Google Scholar] [CrossRef]
  55. Petrtyl, J.; Dvorak, K.; Stritesky, J.; Lenicek, M.; Jiraskova, A.; Smid, V.; Haluzik, M.; Bruha, R.; Vitek, L. Association of Serum Bilirubin and Functional Variants of Heme Oxygenase 1 and Bilirubin UDP-Glucuronosyl Transferase Genes in Czech Adult Patients with Non-Alcoholic Fatty Liver Disease. Antioxidants 2021, 10, 2000. [Google Scholar] [CrossRef]
  56. Salomone, F.; Li Volti, G.; Rosso, C.; Grosso, G.; Bugianesi, E. Unconjugated bilirubin, a potent endogenous antioxidant, is decreased in patients with non-alcoholic steatohepatitis and advanced fibrosis. J. Gastroenterol. Hepatol. 2013, 28, 1202–1208. [Google Scholar] [CrossRef]
  57. Kwak, M.S.; Kim, D.; Chung, G.E.; Kang, S.J.; Park, M.J.; Kim, Y.J.; Yoon, J.H.; Lee, H.S. Serum bilirubin levels are inversely associated with nonalcoholic fatty liver disease. Clin. Mol. Hepatol. 2012, 18, 383–390. [Google Scholar] [CrossRef]
  58. Badmus, O.O.; Hillhouse, S.A.; Anderson, C.D.; Hinds, T.D.; Stec, D.E. Molecular mechanisms of metabolic associated fatty liver disease (MAFLD): Functional analysis of lipid metabolism pathways. Clin. Sci. 2022, 136, 1347–1366. [Google Scholar] [CrossRef] [PubMed]
  59. Tarantino, G.; Colao, A.; Capone, D.; Conca, P.; Tarantino, M.; Grimaldi, E.; Chianese, D.; Finelli, C.; Contaldo, F.; Scopacasa, F.; et al. Circulating levels of cytochrome C, gamma-glutamyl transferase, triglycerides and unconjugated bilirubin in overweight/obese patients with non-alcoholic fatty liver disease. J. Biol. Regul. Homeost. Agents 2011, 25, 47–56. [Google Scholar]
  60. Kunutsor, S.K.; Frysz, M.; Verweij, N.; Kieneker, L.M.; Bakker, S.J.L.; Dullaart, R.P.F. Circulating total bilirubin and risk of non-alcoholic fatty liver disease in the PREVEND study: Observational findings and a Mendelian randomization study. Eur. J. Epidemiol. 2020, 35, 123–137. [Google Scholar] [CrossRef] [Green Version]
  61. Choi, S.H.; Yun, K.E.; Choi, H.J. Relationships between serum total bilirubin levels and metabolic syndrome in Korean adults. Nutr. Metab. Cardiovasc. Dis. 2013, 23, 31–37. [Google Scholar] [CrossRef] [PubMed]
  62. Wu, Y.; Li, M.; Xu, M.; Bi, Y.; Li, X.; Chen, Y.; Ning, G.; Wang, W. Low serum total bilirubin concentrations are associated with increased prevalence of metabolic syndrome in Chinese. J. Diabetes 2011, 3, 217–224. [Google Scholar] [CrossRef] [PubMed]
  63. Kwon, K.M.; Kam, J.H.; Kim, M.Y.; Kim, M.Y.; Chung, C.H.; Kim, J.K.; Linton, J.A.; Eom, A.; Koh, S.B.; Kang, H.T. Inverse association between total bilirubin and metabolic syndrome in rural korean women. J. Women’s Health 2011, 20, 963–969. [Google Scholar] [CrossRef] [PubMed]
  64. Guzek, M.; Jakubowski, Z.; Bandosz, P.; Wyrzykowski, B.; Smoczynski, M.; Jabloiska, A.; Zdrojewski, T. Inverse association of serum bilirubin with metabolic syndrome and insulin resistance in Polish population. Prz. Epidemiol. 2012, 66, 495–501. [Google Scholar]
  65. Ghem, C.; Sarmento-Leite, R.E.; de Quadros, A.S.; Rossetto, S.; Gottschall, C.A. Serum bilirubin concentration in patients with an established coronary artery disease. Int. Heart J. 2010, 51, 86–91. [Google Scholar] [CrossRef] [PubMed] [Green Version]
  66. Schwertner, H.A.; Jackson, W.G.; Tolan, G. Association of low serum concentration of bilirubin with increased risk of coronary artery disease. Clin. Chem. 1994, 40, 18–23. [Google Scholar] [CrossRef] [PubMed]
  67. Yang, X.F.; Chen, Y.Z.; Su, J.L.; Wang, F.Y.; Wang, L.X. Relationship between serum bilirubin and carotid atherosclerosis in hypertensive patients. Intern. Med. 2009, 48, 1595–1599. [Google Scholar] [CrossRef] [PubMed] [Green Version]
  68. Zhang, M.-M.; Gao, Y.; Zheng, Y.-Y.; Chen, Y.; Liu, F.; Ma, Y.-T.; Xie, X. Association of Fasting Serum Bilirubin Levels with Clinical Outcomes After Percutaneous Coronary Intervention: A Prospective Study. Cardiovasc. Toxicol. 2017, 17, 471–477. [Google Scholar] [CrossRef]
  69. Hinds, T.D., Jr.; Adeosun, S.O.; Alamodi, A.A.; Stec, D.E. Does bilirubin prevent hepatic steatosis through activation of the PPARalpha nuclear receptor? Med. Hypotheses 2016, 95, 54–57. [Google Scholar] [CrossRef] [Green Version]
  70. Seyed Khoei, N.; Grindel, A.; Wallner, M.; Molzer, C.; Doberer, D.; Marculescu, R.; Bulmer, A.; Wagner, K.H. Mild hyperbilirubinaemia as an endogenous mitigator of overweight and obesity: Implications for improved metabolic health. Atherosclerosis 2018, 269, 306–311. [Google Scholar] [CrossRef]
Figure 1. The relationship between urobilin and total bilirubin levels in women and men. Pearson’s coefficient comparisons in all samples from men and women to determine the slope of the line and the relationship between urobilin and bilirubin in lean participants of both sexes (A), only women (B) or only men (C). The data were plotted as dot plots, linear regression was calculated, and the slope of the line was used to determine the relationship and the robustness of the data. Light gray squares are for lean women and men combined, and dark gray circles are for obese men and women combined. Red circles are for obese women, blue circles are for obese men, and gray circles are for their lean counterparts.
Antioxidants 12 00170 g001
Figure 2. Urobilin levels and correlations with metabolic phenotypes in women and men. Comparisons of metabolic phenotypes in women and men with plasma urobilin levels for (A) BMI, (B) body fat percentage, (C) blood glucose, (D) blood insulin, and (E) HOMA IR. The data were plotted as dot plots, linear regression was calculated, and the slope of the line was used to determine the relationship and the robustness of the data. Light gray squares are for lean women and men combined, and dark gray circles are for obese men and women combined.
Antioxidants 12 00170 g002
Figure 3. Urobilin levels and correlations with metabolic phenotypes in women. Comparisons of metabolic phenotypes in women with plasma urobilin levels for (A) BMI, (B) body fat percentage, (C) blood glucose, (D) blood insulin, and (E) HOMA IR. The data were plotted as dot plots, linear regression was calculated, and the slope of the line was used to determine the relationship and the robustness of the data. Red circles are for obese women, and gray circles are for their lean counterparts.
Antioxidants 12 00170 g003
Figure 4. Urobilin levels and correlations with metabolic phenotypes in men. Comparisons of metabolic phenotypes in men with plasma urobilin levels for (A) BMI, (B) body fat percentage, (C) blood glucose, (D) blood insulin, and (E) HOMA IR. The data were plotted as dot plots, linear regression was calculated, and the slope of the line was used to determine the relationship and the robustness of the data. Blue circles are for obese men, and gray circles are for their lean counterparts.
Antioxidants 12 00170 g004
Figure 5. Bilirubin levels and correlations with metabolic phenotypes in women and men. Comparisons of metabolic phenotypes in women and men with plasma bilirubin levels for (A) BMI, (B) body fat percentage, (C) blood glucose, (D) blood insulin, and (E) HOMA IR. The data were plotted as dot plots, linear regression was calculated, and the slope of the line was used to determine the relationship and the robustness of the data. Light gray squares are for lean women and men combined, and dark gray circles are for obese men and women combined.
Antioxidants 12 00170 g005
Figure 6. Bilirubin levels and correlations with metabolic phenotypes in women. Comparisons of metabolic phenotypes in women with plasma bilirubin levels for (A) BMI, (B) body fat percentage, (C) blood glucose, (D) blood insulin, and (E) HOMA IR. The data were plotted as dot plots, linear regression was calculated, and the slope of the line was used to determine the relationship and the robustness of the data. Red circles are for obese women, and gray circles are for their lean counterparts.
Antioxidants 12 00170 g006
Figure 7. Bilirubin levels and correlations with metabolic phenotypes in men. Comparisons of metabolic phenotypes in men with plasma bilirubin levels for (A) BMI, (B) body fat percentage, (C) blood glucose, (D) blood insulin, and (E) HOMA IR. The data were plotted as dot plots, linear regression was calculated, and the slope of the line was used to determine the relationship and the robustness of the data. Blue circles are for obese men, and gray circles are for their lean counterparts.
Antioxidants 12 00170 g007
Figure 8. Urobilin and bilirubin levels in obesity. Bilirubin is conjugated in the liver and then catabolized in the intestine to form urobilin by the gut microbiome, which can be absorbed via the hepatic portal vein. The plasma levels of urobilin are positively associated with adiposity and BMI and might be a regulator of insulin resistance. Bilirubin is negatively associated with adiposity and BMI.
Antioxidants 12 00170 g008
Table 1. Phenotyping of obese and lean humans.
MeasurementLeanObesep-Value
Age31.55 ± 13.0940.91 ± 17.110.632
BMI22.47 ± 2.7335.11 ± 3.530.057
Body Weight (kg)64.60 ± 11.0399.37 ± 12.210.256
Total Fat (kg)14.73 ± 4.8045.28 ± 7.330.022 *
Body Fat %21.69 ± 5.6644.42 ± 5.160.003 *
Total Bilirubin (mg/dL)0.77 ± 0.590.52 ± 0.300.529
Urobilin (μM)9.57 ± 4.5023.38 ± 19.300.026 *
Blood Glucose87.57 ± 10.6698.06 ± 10.640.246
Blood Insulin7.21 ± 4.6618.06 ± 15.510.398
HOMA IR1.63 ± 1.254.59 ± 4.370.398
* denotes p < 0.05.
Table 2. Phenotyping of obese and lean men and women.
MeasurementLean FemaleObese Femalep-ValueLean MaleObese Malep-Value
Age29.76 ± 12.8239.31 ± 12.610.15533.14 ± 13.9143.45 ± 24.230.4180
BMI21.33 ± 2.5434.46 ± 1.723.40 × 10−8 *23.47 ± 2.6236.14 ± 5.480.0045 *
Body Weight (g)56.11 ± 7.2193.07 ± 7.851.25 × 10−7 *72.14 ± 7.85109.42 ± 11.590.0006 *
Total Fat (g)14.05 ± 4.9744.68 ± 6.295.88 × 10−8 *15.32 ± 4.8646.24 ± 9.500.0008 *
Body Fat %23.51 ± 6.5046.61 ± 2.884.38 × 10−6 *20.08 ± 4.5740.92 ± 6.350.0005 *
Total Bilirubin (mg/dL)0.74 ± 0.820.54 ± 0.330.5270.79 ± 0.300.50 ± 0.280.0954
Urobilin (μM)11.07 ± 3.7931.21 ± 20.580.028 *8.23 ± 4.8510.86 ± 7.600.5108
Blood Glucose87.38 ± 13.5398.78 ± 11.210.08987.73 ± 8.1996.93 ± 10.810.1440
Blood Insulin5.95 ± 5.1117.06 ± 9.260.013 *8.33 ± 4.2019.64 ± 23.80.3493
HOMA IR1.42 ± 1.524.26 ± 2.400.016 *1.81 ± 0.945.13 ± 6.830.3394
* denotes p < 0.05.
Disclaimer/Publisher’s Note: The statements, opinions and data contained in all publications are solely those of the individual author(s) and contributor(s) and not of MDPI and/or the editor(s). MDPI and/or the editor(s) disclaim responsibility for any injury to people or property resulting from any ideas, methods, instructions or products referred to in the content.

