Article

Flavonoid Profiles and Antioxidant Potential of Monochoria angustifolia (G. X. Wang) Boonkerd & Tungmunnithum, a New Species from the Genus Monochoria C. Presl

by
Duangjai Tungmunnithum
1,2,3,*,
Samantha Drouet
2,
Laurine Garros
2,
Jose Manuel Lorenzo
4,5 and
Christophe Hano
2,3,*
1
Department of Pharmaceutical Botany, Faculty of Pharmacy, Mahidol University, Bangkok 10400, Thailand
2
Laboratoire de Biologie des Ligneux et des Grandes Cultures, INRAE USC1328, Campus Eure et Loir, Orleans University, 28000 Chartres, France
3
Le Studium Institue for Advanced Studies, 1 Rue Dupanloup, 45000 Orléans, France
4
Centro Tecnológico de la Carne de Galicia, Adva. Galicia no. 4, Parque Tecnológico de Galicia, San Cibrao das Viñas, 32900 Ourense, Spain
5
Área de Tecnología de los Alimentos, Facultad de Ciencias de Ourense, Universidad de Vigo, 32004 Ourense, Spain
*
Authors to whom correspondence should be addressed.
Antioxidants 2022, 11(5), 952; https://doi.org/10.3390/antiox11050952
Submission received: 13 April 2022 / Revised: 4 May 2022 / Accepted: 10 May 2022 / Published: 12 May 2022
(This article belongs to the Special Issue Antioxidant Mechanisms in Plants)

Abstract

:
Plants of the genus Monochoria have long been utilized in food, cosmetics, and traditional herbal treatments. Thailand has the highest species diversity of this genus and a new member, Monochoria angustifolia (G. X. Wang) Boonkerd & Tungmunnithum has been recently described. This plant is called “Siam Violet Pearl” as a common name or “Khimuk Si Muang Haeng Siam” as its vernacular name with the same meaning in the Thai language. Despite their importance, little research on Monochoria species has been conducted. This study, thus, provides the results to fill in this gap by: (i) determining flavonoid phytochemical profiles of 25 natural populations of M. angustifolia covering the whole floristic regions in Thailand, and (ii) determining antioxidant activity using various antioxidant assays to investigate probable mechanisms. The results revealed that M. angustifolia presents a higher flavonoid content than the outgroup, M. hastata. Our results also revealed that flavonoids might be used to investigate Monochoria evolutionary connections and for botanical authentication. The various antioxidant assays revealed that M. angustifolia extracts preferentially act through a hydrogen atom transfer antioxidant mechanism. Pearson correlation analysis indicated significant correlations, emphasizing that the antioxidant capacity is most probably due to the complex action of several phytochemicals rather than that of a single molecule. Together, these results showed that this new species provide an attractive alternative starting material with phytochemical variety and antioxidant potential for the phytopharmaceutical industry.

1. Introduction

Monochoria angustifolia (G. X. Wang) Boonkerd & Tungmunnithum, is the newest member of the genus Monochoria C. Presl which belongs to the family Pontederiaceae. There are eight species of Monochoria worldwide [1,2,3], and Thailand is the richest species diversity area of the genus Monochoria. There are four species reported in Thailand such as M. elata, M. hastata, M. vaginalis and M. angustifolia [1,2,3,4]. Currently, M. angustifolia is the new species that was described by Tungmunnithum and her research teams in 2020 based on both morphological and molecular (phylogenetic analysis) evidence [1].
M. angustifolia is an aquatic plant with beautiful blooming violet-pearl perianth and it is a new species from Thailand [1]. Therefore, this plant is called “Siam Violet Pearl” as a common name or “Khimuk Si Muang Haeng Siam” as a vernacular name with the same meaning in the Thai language. The natural habitat of the M. angustifolia plant is standing bodies of water in tropical regions. This new species is an annual herb that is distributed in several floristic regions in Thailand, and has never been reported in other countries (World Checklist of Selected Plant Families [1,2,3,4,5]. It is possible that environmental factors play an important role as the limiting factor for the distribution of M. angustifolia plants similar to other endemic species that are found only in Thailand, for example Hoya siamica Craib [6]. M. angustifolia populations have a narrow range of distribution compared with the other species in the same genus, but each population consists of a large number of individual plants. This plant species is native and well distributed throughout Thailand, easy to grow and can be propagated both sexually by seeds and asexually by budding. These characteristics are particularly suitable for research and development of raw plant materials for the phytopharmaceutical and cosmetic industries. Besides, it is also helpful for local people to grow and cultivate the potential population of M. angustifolia, so as to provide quality plant materials for the industrial sector. Furthermore, the Monochoria plant group has long been used as food (vegetable and/or cooking ingredient), skin care (leaves and flowers extracts) and traditional medicine (leaves and/or the aerial part) in Thailand, Japan, India and other countries in Asia since ancient times. Local people have used its leaves for the treatment of asthma and to relieve toothache. Its roots are also used to cure stomach and liver problems [4,7].
Flavonoids and other related phenolic substances are naturally occurring chemicals in plants [8,9,10]. Their antioxidant activity has been extensively studied, and it is widely assumed that it is connected to their quantity and/or chemical structures, such as the location of hydroxyl groups. However, the majority of information on antioxidant activity is generally based on a small number of plant species or cultivars [11]. Furthermore, antioxidant activity is usually determined using a restricted number of assays. Because of the complex structures of plant-derived compounds, as well as the fact that antioxidant activity is mostly dictated by the reaction mechanism involved, this biological activity cannot be assessed by using a single assay [12,13]. Furthermore, environmental and agricultural cultivation conditions such as location, soil conditions, and/or climate have been reported to have a significant impact on the phenolic compound accumulation as well as the antioxidant potential of a plant extract [11,14,15]. Thailand is located in “Indo-Burma” a biodiversity hotspot that is recognized as the world′s eighth most bio-diverse area. The country has one of the highest levels of biodiversity per unit area in the world. Thailand, which has a variety of forest types and aquatic environments, supports up to 10,000 plant species and accounts for around 10% of all living organisms on the earth [16]. So far, no study of this new species has addressed the diversity in flavonoids, other associated phenolic compounds, or antioxidant activities (measured using different assays capable of accounting for this biological activity).
The objective of this study is to complete this knowledge, with natural M. angustifolia and the outgroup from the same genus, M. hastata populations originating from different floristic regions in Thailand, by (1) determining total phenolic content and total flavonoid content (including HPLC analysis of their flavonoid profiles), and (2) investigating the antioxidant potential using five in vitro antioxidant assays covering different antioxidant mechanisms as well as one yeast cell-based cellular antioxidant approach.

2. Materials and Methods

2.1. Chemicals and Reagents

For extraction HPLC analysis and biological assays, all solvents and reagents were analytical grade or of the greatest purity possible (Thermo Fischer Scientific, Illkirch, France). A Milli-Q water-purification system was used to purify ultrapure deionized water (Merck Millipore Fontenay sous Bois, Paris, France). Prior to use, all HPLC solutions were filtered using 0.45 m nylon syringe membranes. Flavonoid standards (apigenin-7-O-rutinoside; luteolin-7-O-glucoside; apigenin-7-O-glucoside (i.e., apigetrin); luteolin; apigenin) were provided by Extrasynthese (Genay, France). These analytical standards were provided with w/w absolute assay (with purity of at least 97%), to be used for quantitative titrations.

2.2. Plant Material

The living plant specimens were searched for and collected from natural habitats covering the entire floristic regions in Thailand such as (1) Northern (2) North-eastern (3) Eastern (4) South-western (5) Central (6) South-eastern and (7) Peninsular. The collected populations were named according to the collected provinces (Table 1). The collected specimens were identified by using the taxonomic and the species description from existing flora and previous published works [1,4,7,17,18,19], and then compared with the herbarium specimens kept in the Forest Herbarium (BKF), Kyoto University, Japan (KYO), the Prof. Kasin Suvatabandhu Herbarium, Chulalongkorn University, Bangkok, Thailand (BCU) and the Plant Varieties Protection Office, Bangkok, Thailand (BK). The herbarium abbreviations are used according to Thiers [20]. The leaves of each plant material sample were air-dried, and then prepared using the recommendations of the World Health Organization [21]. The total 25 populations of M. angustifolia (15 samples/population) collected from every floristic region throughout the country as well as the outgroup (M. hastata) shown in Table 1 were included in this study.

2.3. Extraction

The dried leaf (100 mg) material [11,22] was placed with 1 mL of 90% (v/v) aqEtOH into a 5 mL quartz tube which was capped with a vapor condenser, and extracted by ultrasound using a USC1200 TH ultrasonic bath (Prolabo, Fontenay-sous-Bois, France). The extraction conditions used were US frequency 30 kHz, a duration 45 min, and temperature 45 °C. The obtained extracts were cooled at 25 °C, centrifuged at 5000× g for 15 min (Heraeus Biofuge Stratos, Thermo Scientific, Illkirch, France), and the supernatant filtered through 0.45 m nylon syringe membrane (Merck Millipore, Saint-Quentin Fallavier, France). The previously described DAX-8 macroporous resin (Merck Millipore, Saint-Quentin Fallavier, France) purification technique was then used for flavonoid enrichment [22].

2.4. Determination of Total Phenolic Content (TPC)

Determination of TPC was done by the Folin–Ciocalteu method adapted for a microplate reader as previously reported [11] with absorbance determined at 650 nm (BioTek ELX800 Absorbance Microplate Reader, BioTek Instruments, Colmar, France). The TPC was expressed in gallic acid equivalents per 100 g dry weight (mg GAE/100 g DW) using a standard curve of gallic acid (linear range: 0–40 g/mL; R2 = 0.998) (Merck, Saint-Quentin Fallavier, France).

2.5. Determination of Total Flavonoid Content (TFC)

The TFC was determined by an aluminum trichloride (AlCl3) colorimetric technique adapted for a microplate reader (Multiskan GO, Thermo Fischer Scientific, Illkirch, France) as previously described [11], with absorbance read at 415 nm. The TFC was then expressed as mg of quercetin equivalents per 100 g dry weight (mg QE/100 g DW) using a standard curve of quercetin (Merck, Saint-Quentin Fallavier, France) (linear range: 0–40 g/mL; R2 = 0.999).

2.6. High-Performance Liquid Chromatography (HPLC) Analysis

The HPLC system used was a Varian HPLC system controlled by Galaxie software (Varian v1.9.3.2, Varian, Le Plessis-Robinson, France). The system is composed of an autosampler, Varian Prostar 230 pump and Varian Prostar 335 photodiode array detector (PDA). The separation was carried out at 40 °C with a Purospher RP-18 column (250 × 4.0 mm internal diameter; 5 µm) (Merck Chemicals, Molsheim, France) using a linear gradient of methanol (solvent A) and HPLC grade water acidified with 0.05% formic acid (solvent B) from a 5:95 (v/v) mixture of solvents A and B to a 100:0 (v/v) mixture at a flow rate of 0.8 mL/min for 60 min. Injection volume was 3 µL. The highest back pressure was 110 bar. The detection for quantification was performed at 320 nm. Quantification was accomplished using commercial authentic flavonoid standards (Extrasynthese, Genay, France).
Validation was performed as described previously by Tungmunnithum et al. [23] and according to the Association of Analytical Communities (AOAC) standards, so as to ensure the accuracy and the reproducibility of quantification [24].

2.7. In Vitro Cell Free Antioxidant Assays

The antioxidant potential of extracts was assessed by using five different in vitro cell free antioxidant assays: ABTS (2,2-azinobis(3-ethylbenzthiazoline-6-sulphonic acid), DPPH (2,2-diphenyl-1-picrylhydrazyl), ORAC (oxygen radical absorbance capacity assay), FRAP (ferric reducing antioxidant power) and CUPRAC (cupric reducing antioxidant capacity), as described previously [12,13].
FRAP assay: 10 µL of extract was added to 190 µL of FRAP reagent (10 mM TPTZ, 20 mM FeCl3.6 H2O, 300 mM acetate buffer pH 3.6, in a ratio of 1:1:10 (v/v/v)) in a microplate well, mixed and incubated for 15 min at 25 °C in the dark.
DPPH assay: 20 μL of extract was added to 180 μL of DPPH reagent (0.1 mM final concentration in MeOH) in a microplate well, mixed and incubated for 15 min at 25 °C in the dark.
CUPRAC assay: 10 μL of extract was added to 190 µL of CUPRAC solution (10 mM Cu(II), 7.5 mM neocuproine, and 1 M acetate buffer pH 7 mixed in ratio 1:1:1 (v/v/v)) in a microplate well, mixed and incubated for 15 min at 25 °C in the dark.
For ABTS assay: 10 μL of extract was added to 190 µL of ABTS solution (7 mM ABTS, 2.45 mM potassium persulphate) in a microplate well, mixed and incubated for 15 min at 25 °C in the dark.
After incubation, absorbances at 590 nm (FRAP), 450 nm (CUPRAC), 515 nm (DPPH) and 734 nm (ABTS) were determined using a microplate reader (BioTek ELX800 Absorbance Microplate Reader, BioTek Instruments, Colmar, France). The antioxidant activity was then expressed in µmoles of Trolox C equivalent antioxidant capacity (µM TEAC) with a standard curve (R2 = 0.998–0.999, 0–500 μM Trolox C) for each assay.
For ORAC (oxygen radical absorbance capacity assay), 10 µL of extract was added to 190 µL of ORAC reagent (0.96 µM fluorescein in 75 mM phosphate buffer pH 7.4), mixed, and incubated at 37 °C for at least 30 min with shaking. Then, 20 µL of 119.4 mM 2,2′-azobis-amidinopropane (ABAP, Sigma Aldrich, Saint-Quentin Fallavier, France) was added and the fluorescence intensity was measured every 5 min for 2.5 h at 37 °C using a fluorescence spectrophotometer (Bio-Rad, Marnes-la-Coquette, France) set with excitation wavelength at 485 nm and emission wavelength at 535 nm. Antioxidant capacity was represented as Trolox C equivalent antioxidant capacity in triplicate assays (TAEC).

2.8. Cellular Antioxidant Assays

The protocol described in Nazir et al. [25], employing yeast cells, was used to assess cellular antioxidant activity. The yeast DBY746 strain (MAT leu2-3,112 his31 trp1-289 a ura3-52 GAI+) was aerobically cultivated in full Yeast extract Peptone Dextrose medium (YPD) with 2% (w/v) glucose (Sigma Aldrich, Saint-Quentin Fallavier, France) in 150 rpm of the orbital shaker at 30 °C. The extract was evaporated under a nitrogen flow, and dissolved in the DMSO solution, and added to yeast cells at a final concentration of 1 mg/mL, 6 h before oxidative stress induction. For untreated control yeast cells, the same amount of DMSO was utilized. The final DMSO dose administered to the yeast cells was around 1% (v/v). The UV-C irradiation; 106.5 J/m2 UV-C at 254 nm was used to generate oxidative stress using a Vilber VL-6.C filtered lamp (Thermo Fisher Scientific, Villebon-sur-Yvette, France). Then, the yeast cells were incubated overnight at 30 °C. Dihydrorhodamine-123 (DHR-123) fluorescent dye (Sigma-Aldrich, Saint-Quentin Fallavier, France) was used to assess the amount of reactive oxygen species (ROS), as well as the reactive nitrogen species (RNS) that were generated. Approximately 108 yeast cells were then rinsed twice in phosphate buffered saline pH 7.4, before being resuspended in 0.4 M DHR-123 solution prepared in phosphate buffered saline pH 7.4 (1 X), and then incubated in the dark for 10 min at 30 °C. The intensity of fluorescence was determined using a VersaFluor fluorimeter (Biorad, Marnes-la-Coquette, France) (λem = 535 nm; λex = 505 nm) after twice washing with PBS (1 X, pH7.4).

2.9. Statistical Analysis

The statistical software packages: XLSTAT 2019 suite (Addinsoft, Paris, France) as well as PAST4.0 [26] were employed for statistical analysis. Data composed of at least 3 independent replicates were analyzed and then presented using the means and the standard deviations. The Student’s t-test statistic was calculated for comparative analysis. The significant differences at p < 0.05 and p < 0.01 as well as p < 0.001 were presented using *, **, and ***, respectively. The different letters indicate the statistical significance at p < 0.05.

3. Results and Discussion

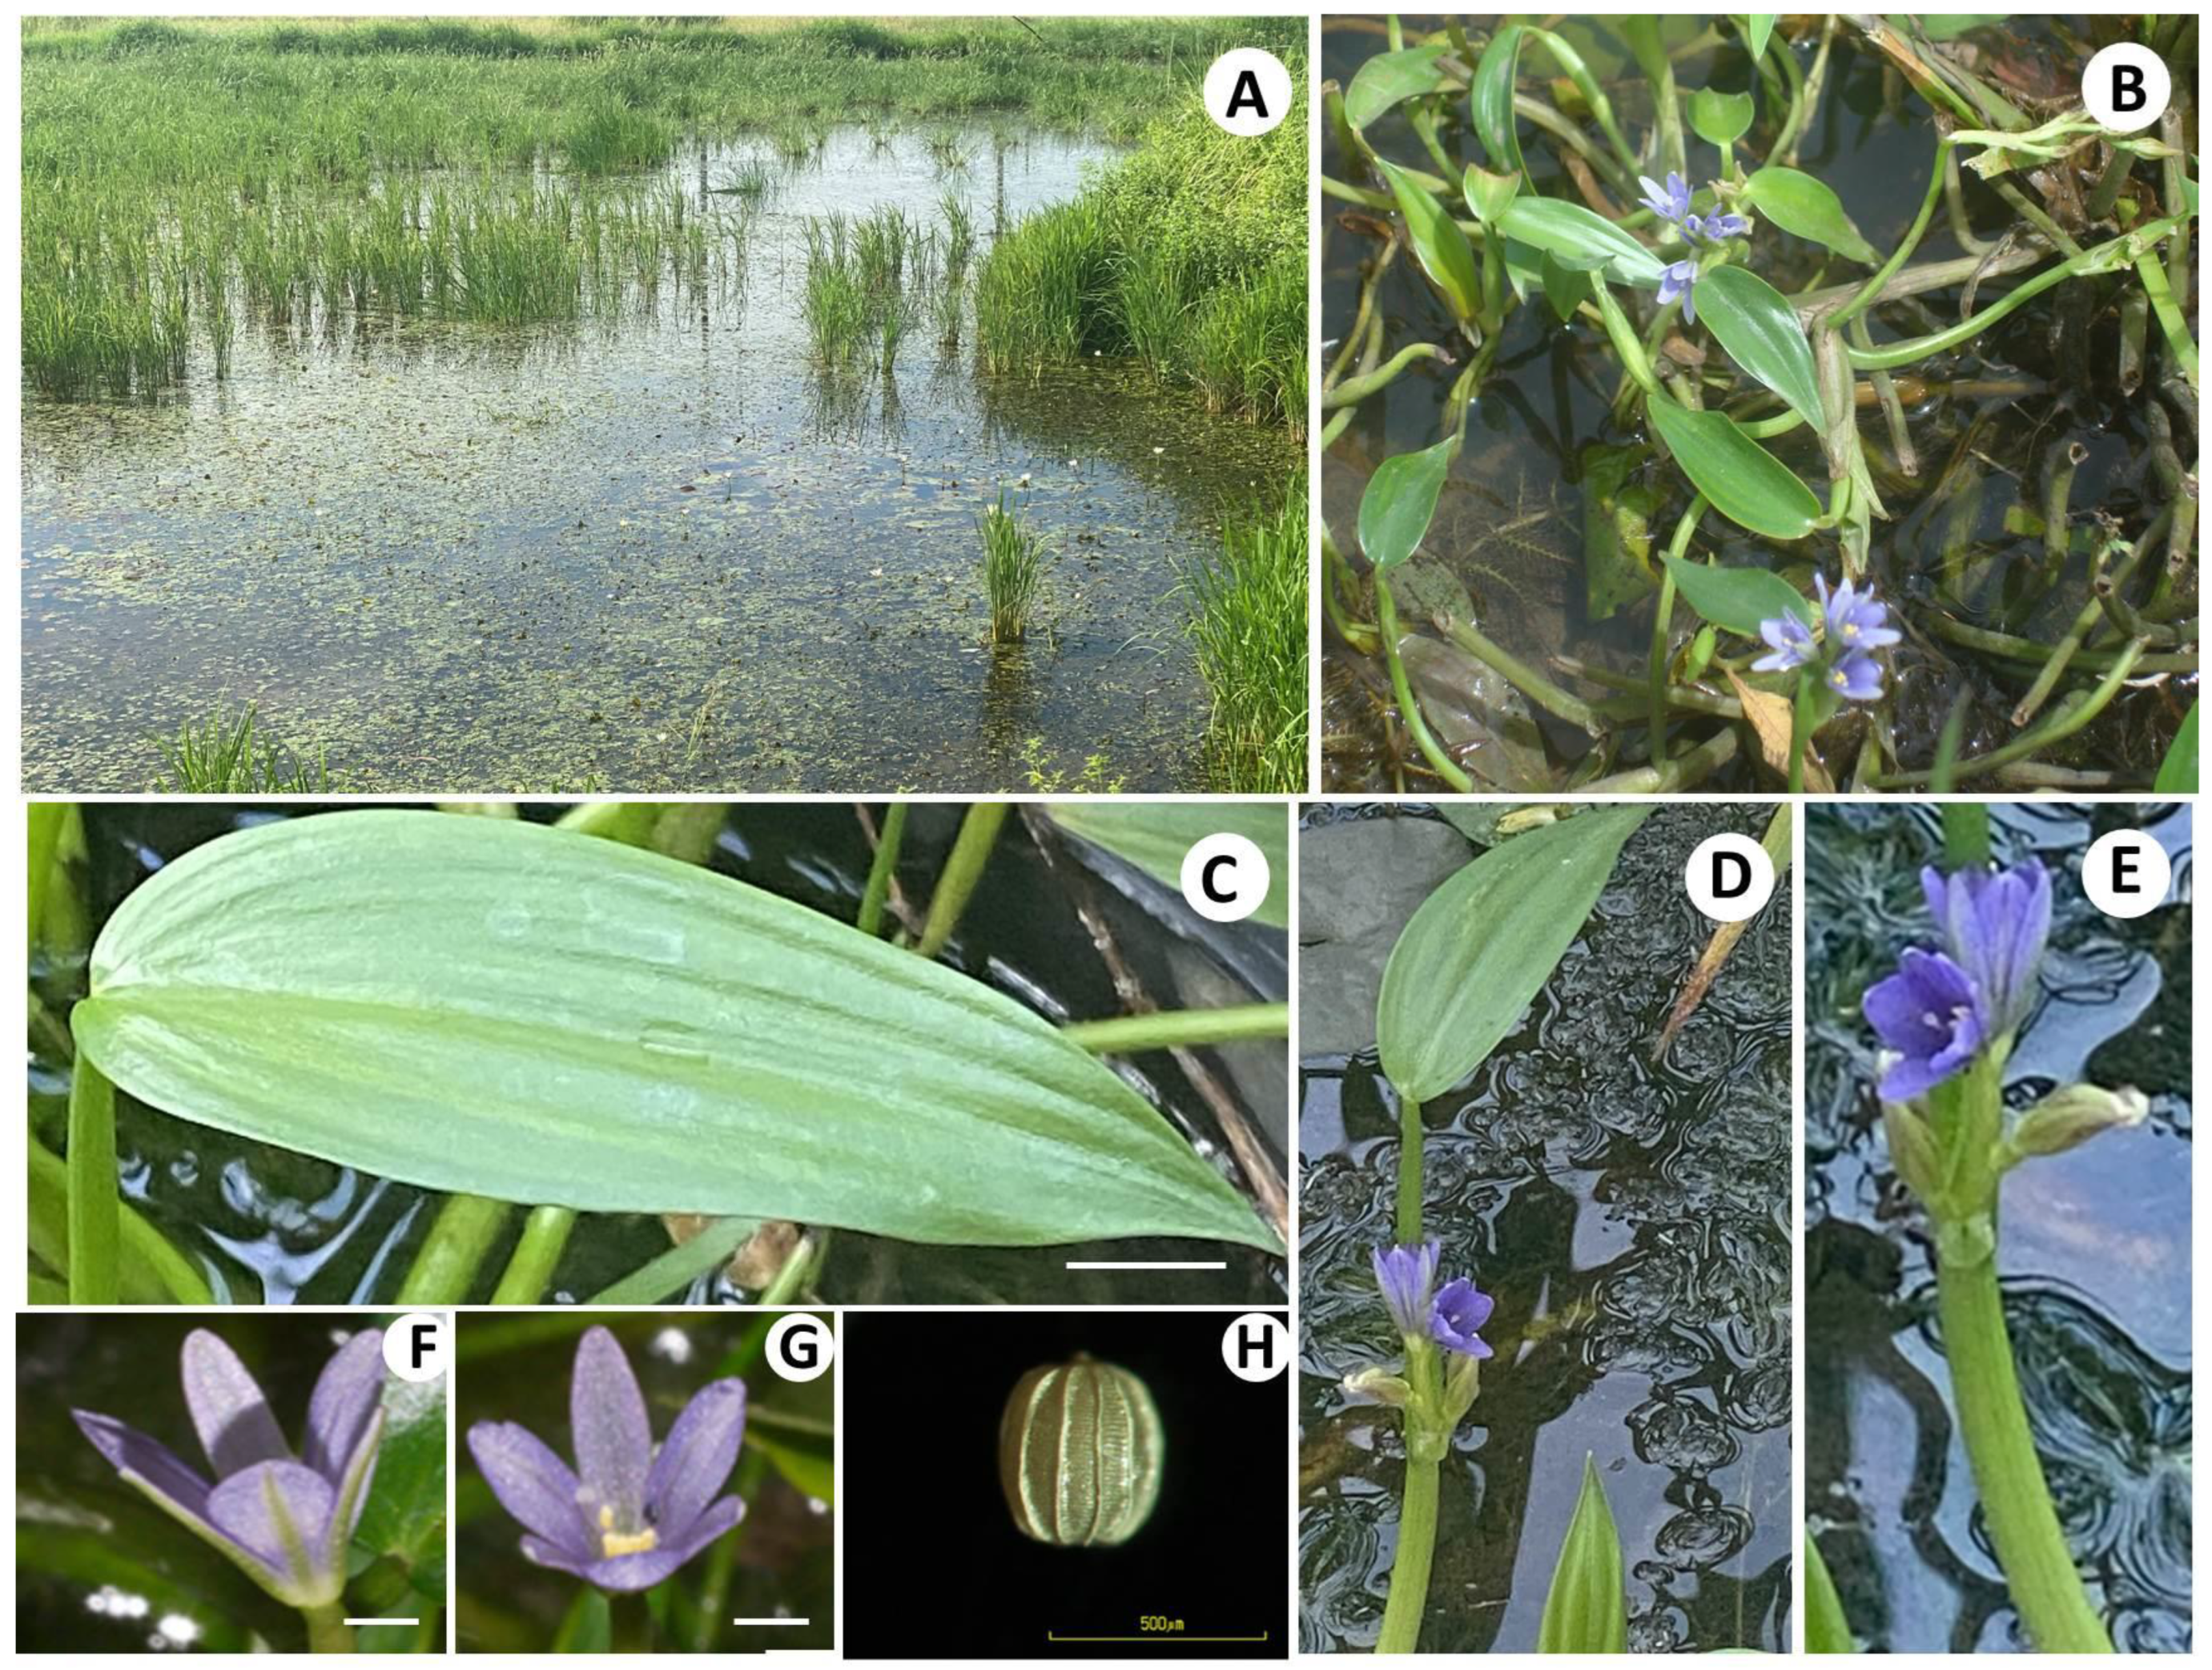
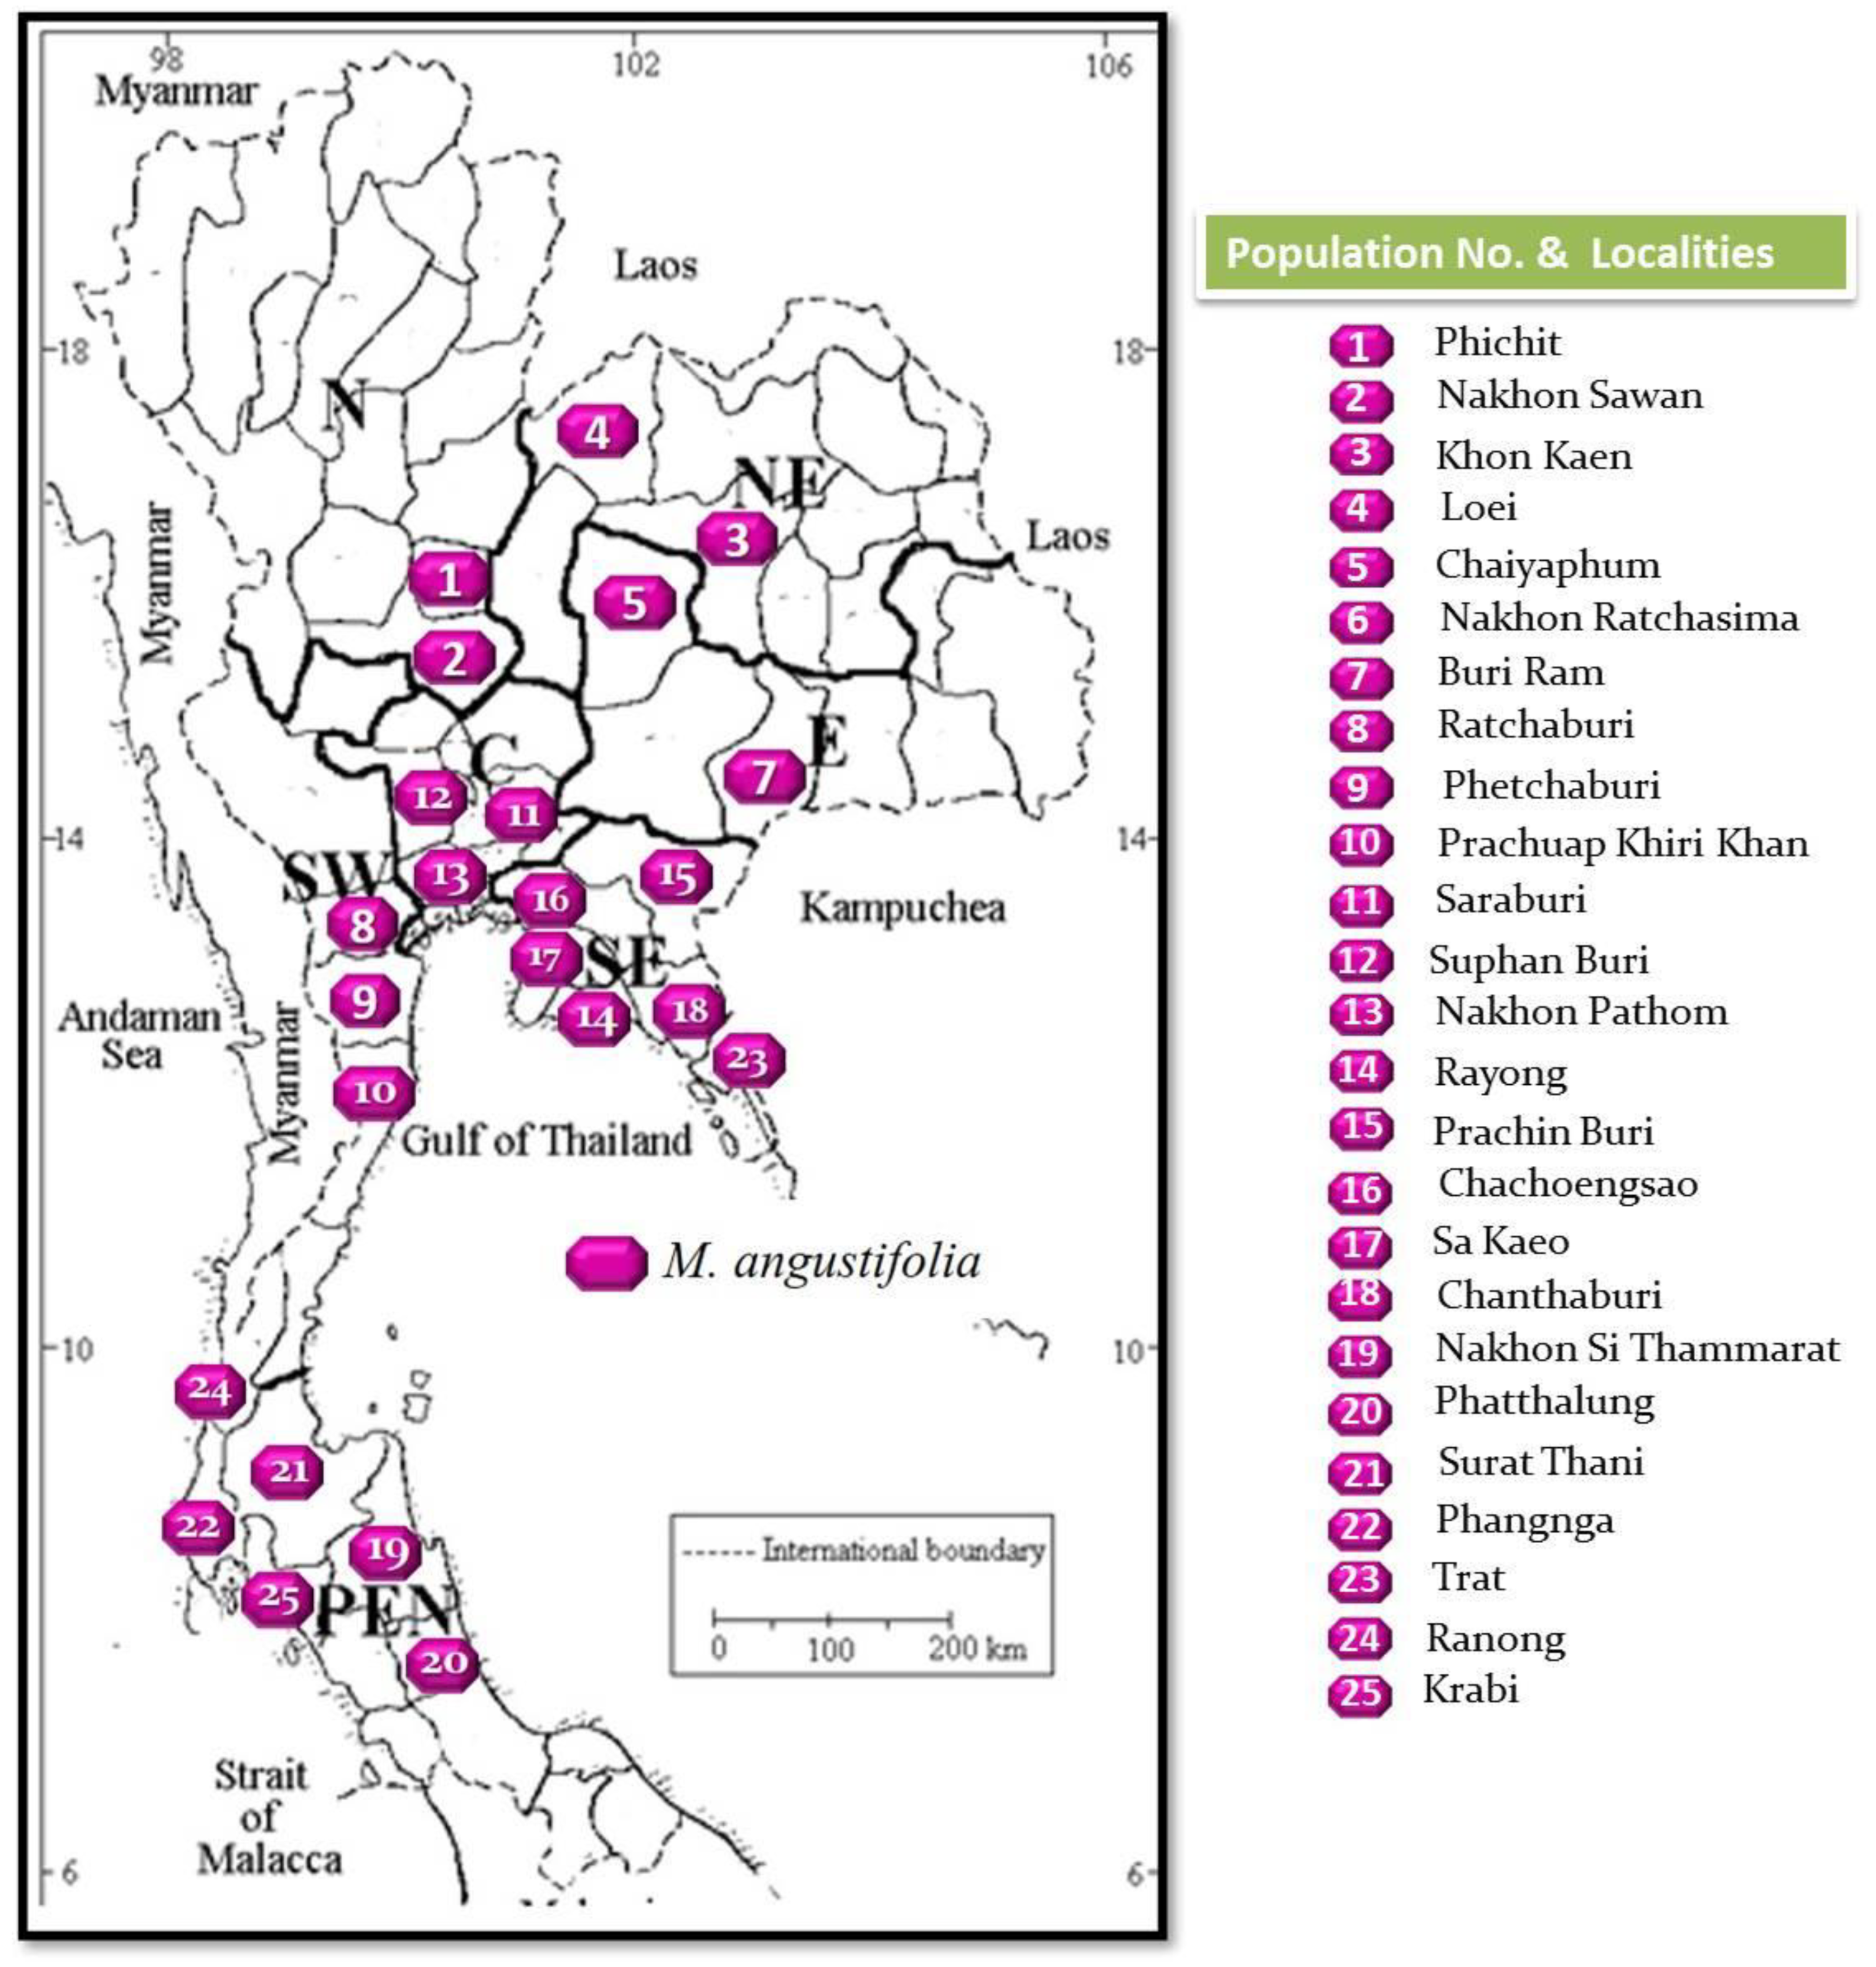
3.1. Plant Collection and Taxonomic Description

After an intense search for living specimens in natural habitats, the 25 populations of M. angustifolia from different localities covered all floristic regions in Thailand and were collected along with the outgroup (six populations of M. hastata) from the same genus Monochoria. Samples investigated in the present study are listed in Table 1.
The 25 populations of M. angustifolia collected from all the seven floristic regions of the country showed a similar trend in morphological characters (Figure 1), and the taxonomic description is provided in the paragraph below.
According to the distribution map (Table 1 and Figure 2), M. angustifolia is mainly distributed throughout the Eastern, South-Eastern, Central, South-Western, and Peninsula, as well as some parts of the Northern and North-Eastern floristic regions which is wider than previously reported [1]. During our field study, at least five targeted provinces per floristic region where M. angustifolia was previously reported, or contained possible aquatic natural habitats, were selected and searched for specimens of this new species. However, M. angustifolia living plant specimens were found in only two localities (provinces) in the Northern (Phichit and Nakhon Sawan provinces) and North-Eastern (Khon Kaen and Loei provinces) floristic regions. The most abundant M. angustifolia can be found in the South-Eastern floristic regions where six populations were found.
Taxonomic Description: Annual aquatic herb, leaf simple, stipulate, green, glabrous; petiole rounded, erect or curved, with broad leaf sheath; leaf blade lanceolate, lanceolate-linear, or ovate-lanceolate, apex abruptly acuminate, base obtuse, 1.4–2.0 cm wide, 6.0−7.4 cm long, midrib groove on the adaxial surface, leaf blade and petiole forming right angle or acute to each other; Inflorescence racemose, 2−6 flowers; rachis 5.2−5.4 cm long; peduncle 2.8−3.0 cm long; spathe green, 2.6−2.8 cm long, terminal appendage approximately 0.3 cm long; floral leaf blade lanceolate, adaxial and abaxial surfaces smooth, midrib groove, apex acute, base obtuse, 1.7−1.8 cm wide, 6.3−6.7 cm long; floral leaf petiole green, 4.1−4.5 cm long, level of inflorescence tip higher than that of floral leaf and mature leaf; pedicel glabrous, 1.3−1.4 cm long; outer perianth 3, violet-pearl, glabrous, lanceolate, middle of abaxial green, 0.3 cm wide, 0.7−0.8 cm long; inner perianth 3, violet-pearl, ovate or elliptic, glabrous, apex obtuse, middle of abaxial green, 0.3 cm wide, 0.8−0.9 cm long; stamen 6; normal stamen 5, filament white unappendage, 0.7−0.8 cm long, anther basifixed, yellow, 0.4−0.5 cm long; largest stamen 1, filament dark purple, appendage, 0.2 cm long, anther basifixed, dark purple, 0.1 cm wide, 0.4−0.5 cm long; ovary superior, style bright purple, 0.4−0.5 cm long. Fruits capsule, glabrous. Seeds barrel, 373−429 µm long, numerous, longitudinal ridges of seed distinct, 7−10 veins.
Specimens examined:M. angustifolia Populations No. 1–25
Recent distribution: Every floristic region
Ecology: Rice fields and clear aquatic habitats
Flowering Time: Early April to early August.

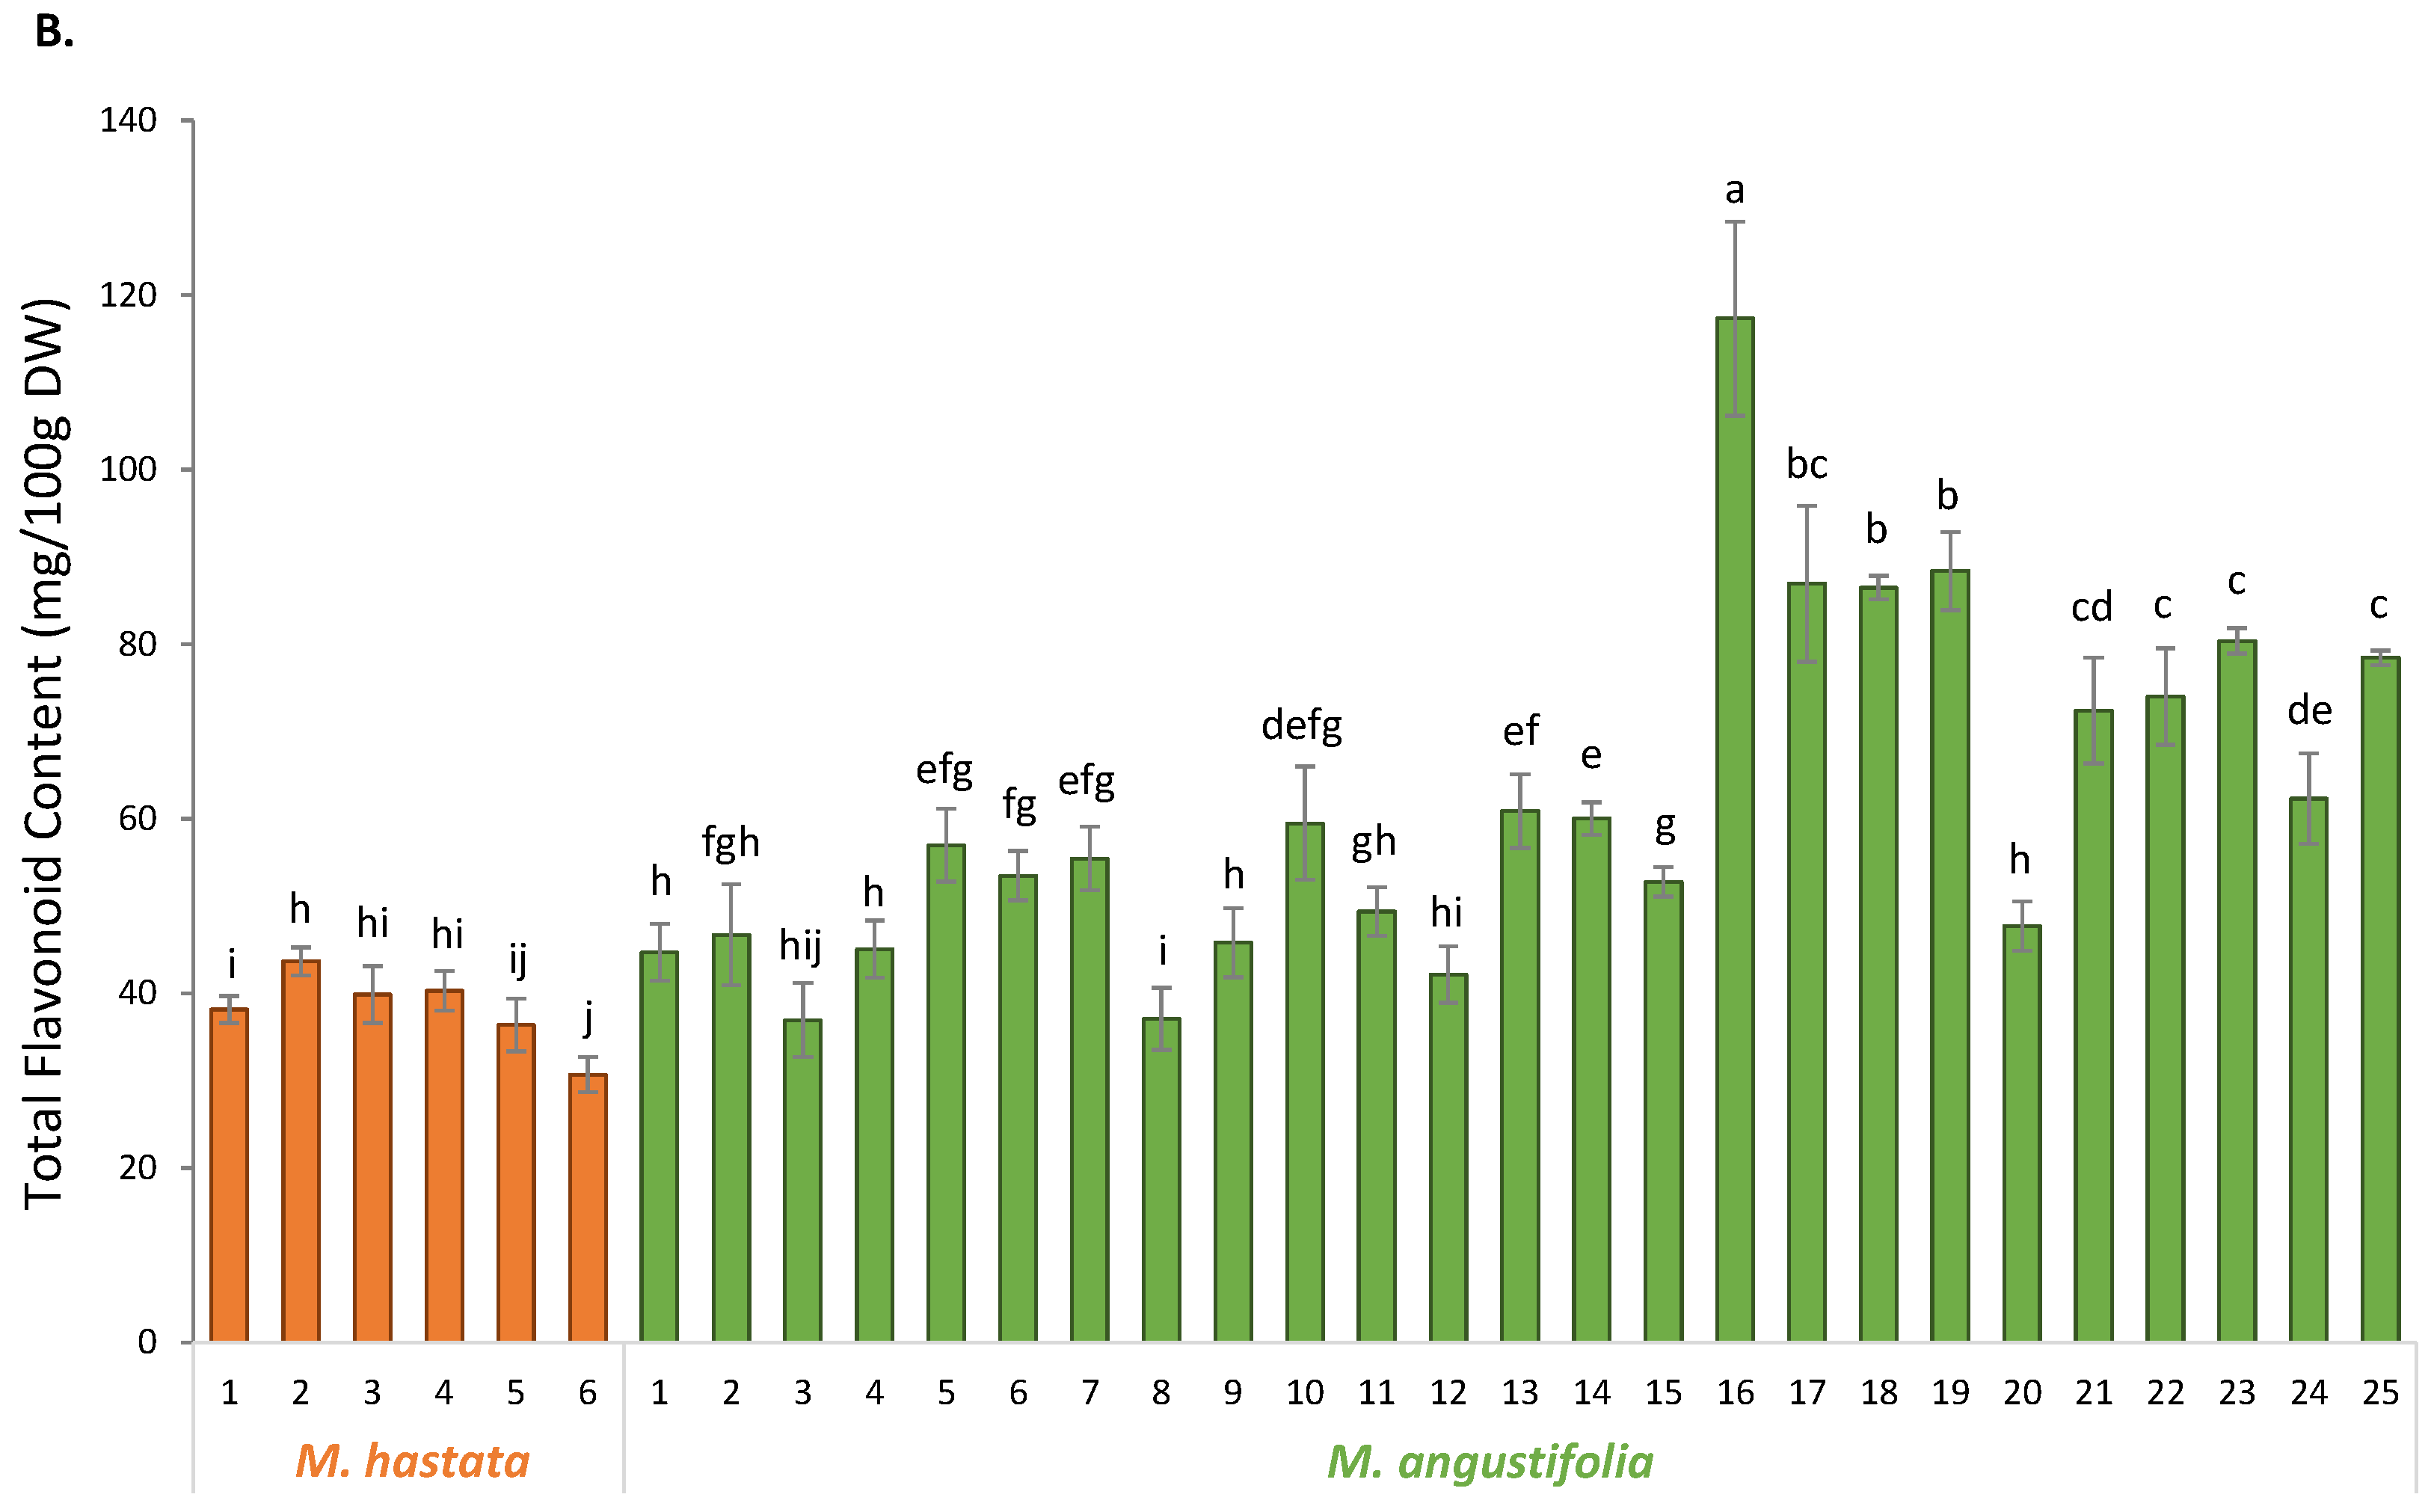
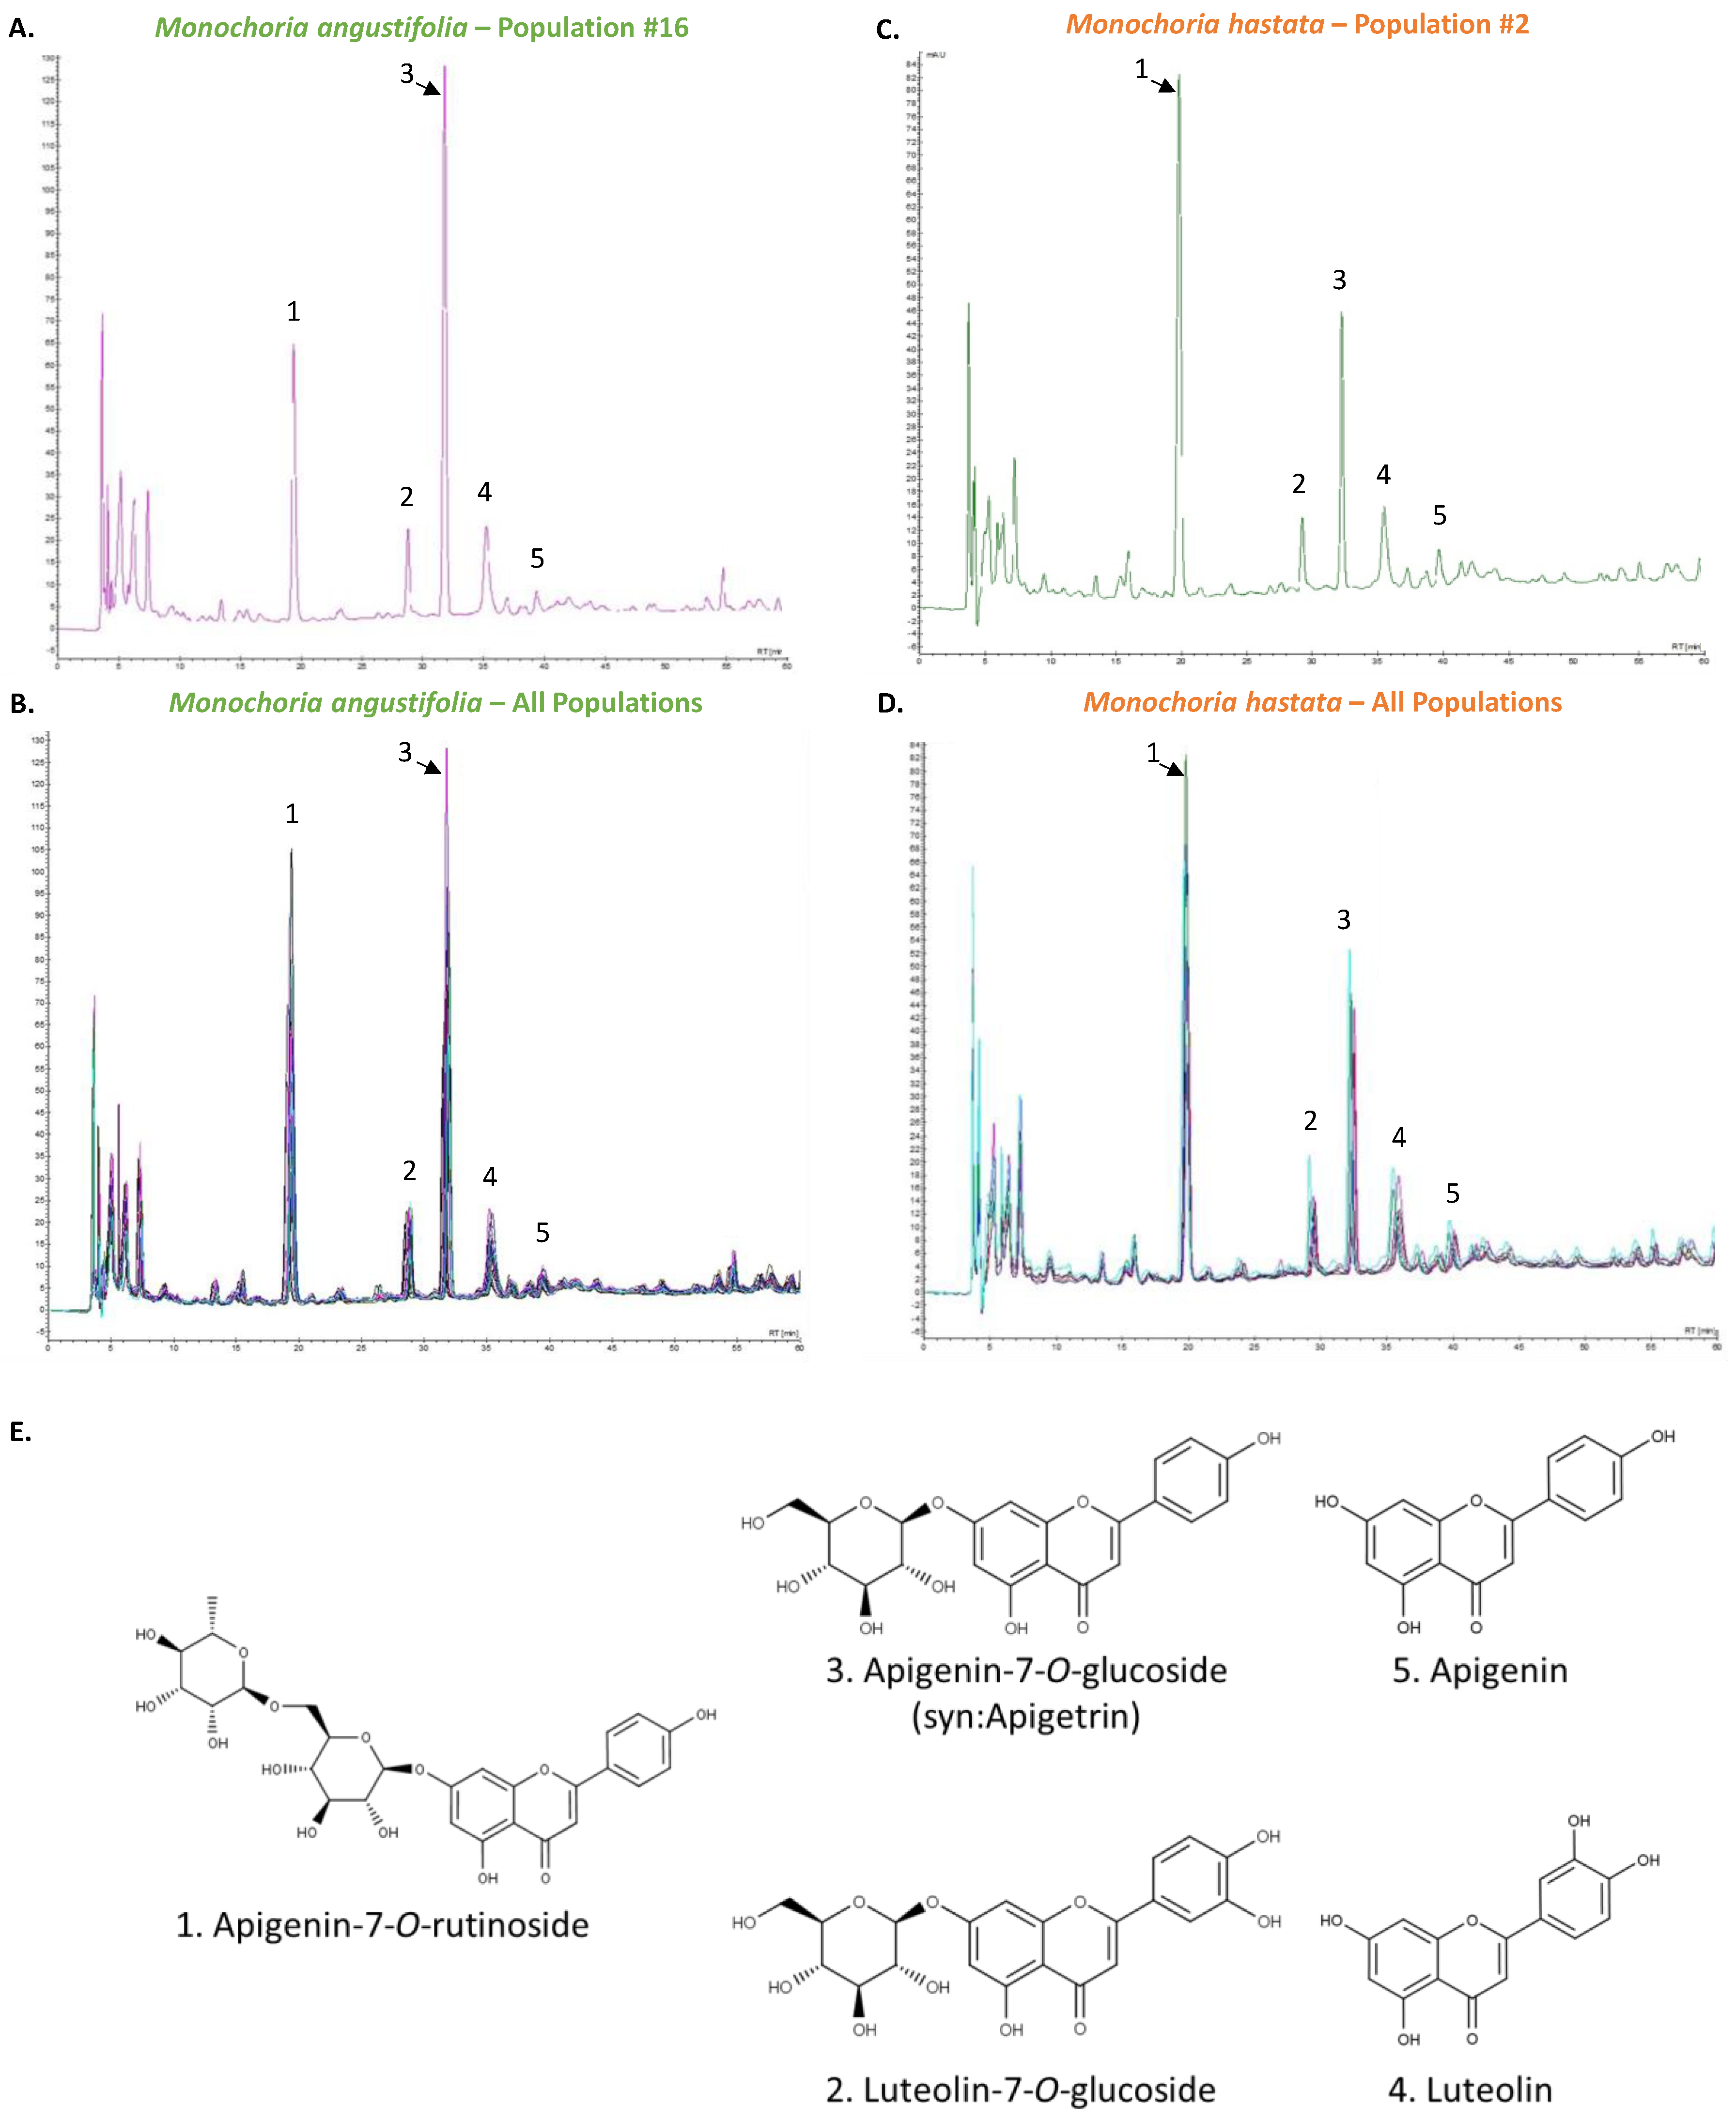
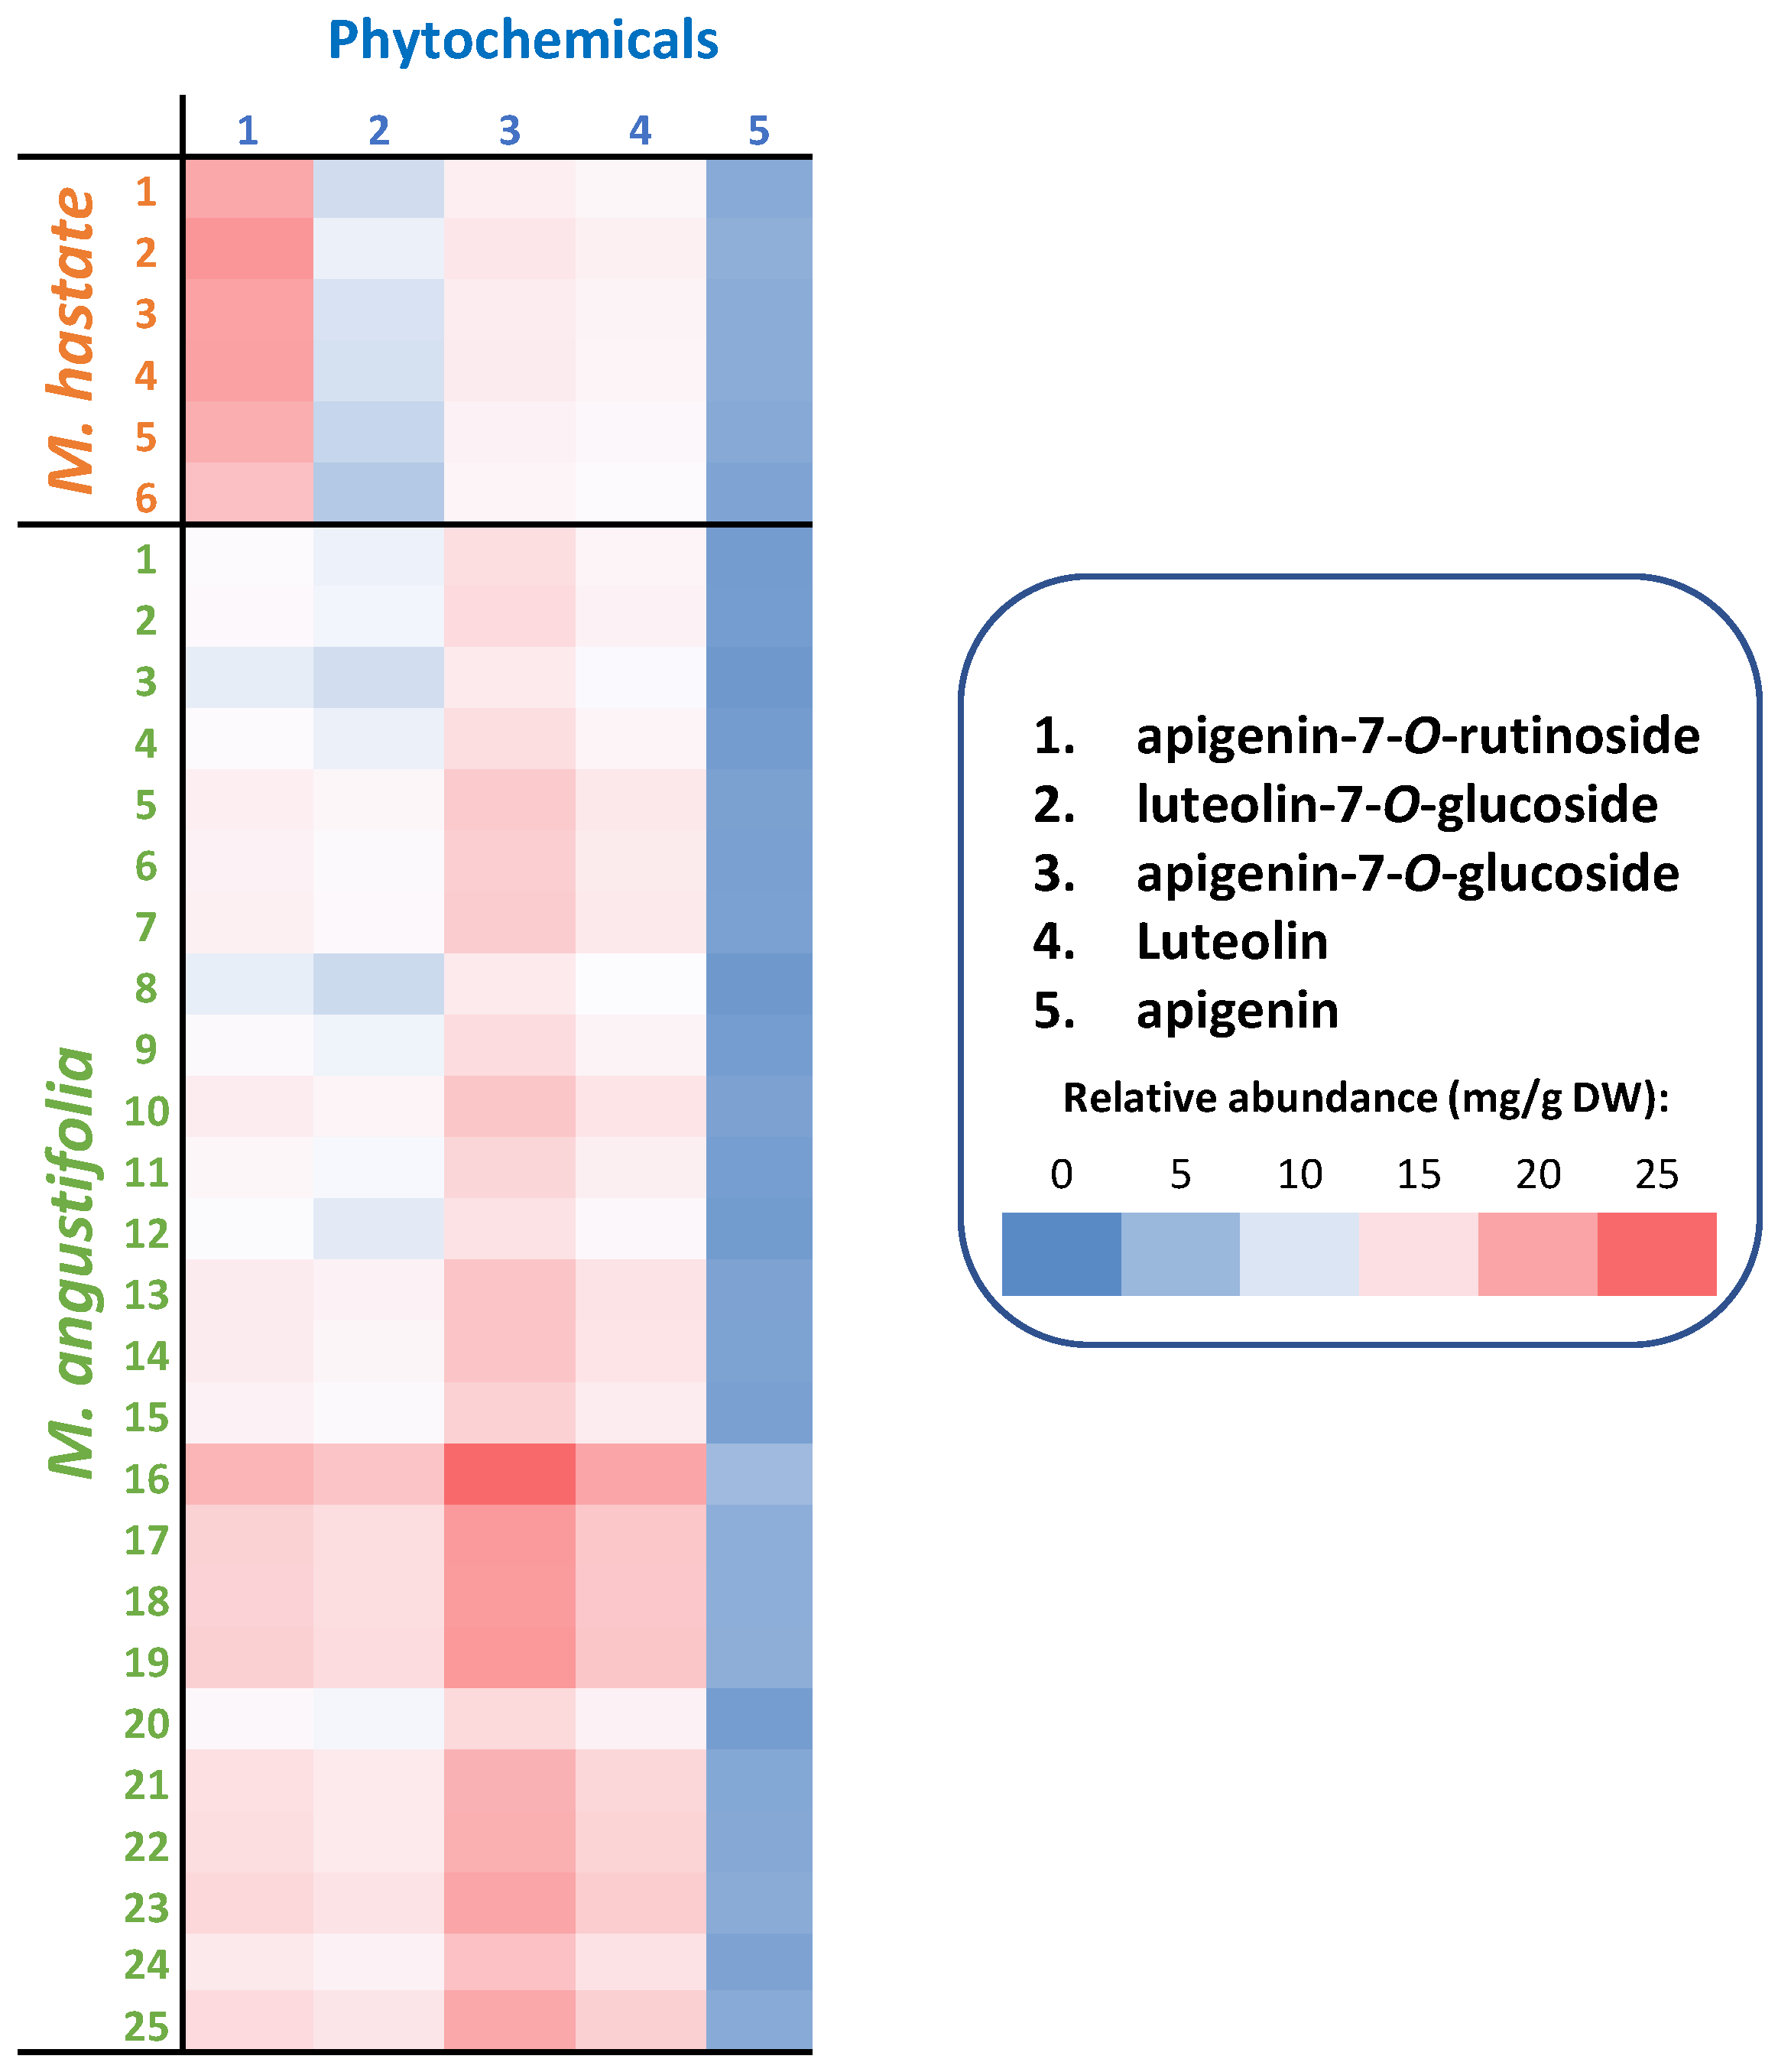
3.2. Phytochemical Characterization

First, the TPC and TFC of the extracts from the different populations of the two Monochoria species (M. angustifolia and M. hastata) are presented in Figure 3 (TPC Figure 3A and TFC Figure 3B).
The TPC ranged from 28.78 ± 3.86 (Ma#3) to 63.49 ± 0.29 (Ma#23) mg per 100 g DW gallic acid equivalent in M. angustifolia and ranged from 41.91 ± 0.72 (Mh#4) to 68.12 ± 14.15 (Mh#2) mg per 100 g DW gallic acid equivalents in M. hastata. The TFC, ranged from 36.92 ± 4.26 (Ma#3) to 117.33 ± 11.18 (Ma#16) mg/100 g DW quercetin equivalents in M. angustifolia extracts, and from 30.68 ± 1.99 (Mh#6) to 43.68 ± 1.60 (Mh#2) mg/100 g DW quercetin equivalents in M. hastata extracts. These results revealed a significant degree of variability in both TPC and TFC for M. angustifolia as compared to M. hastata, with TFC playing a critical role in the phytochemical heterogeneity observed within the M. angustifolia populations. Noticeably, some populations of M. angustifolia appeared to be significantly richer in TFC, which might be of significant relevance given the well-known antioxidative and health-promoting effects of this class of phytochemicals [9,27]. In particular, population #16–19, #21–23 and #25 of M. angustifolia appeared of special interest because of their high TFC. Interestingly, this is the first report on the phytochemical examination of this new species. The TPC and TFC of the outgroup, M. hastata extracts, have been reported, and the published ranges of variations are in line with the present results [28,29]. It should be noted, however, that the present study is the first to evaluate TPC and TFC variabilities at the population level.
Our results indicated that TFC are important contributors to the observed variations, therefore HPLC coupled to PDA analysis was carried out in order to provide a thorough understanding of qualitative and quantitative changes (Figure 4). Compounds were identified using our flavonoid database by comparison with authentic commercial standards, based on retention times and λmax values.
The HPLC-PAD analyses allowed the identification of the five main flavonoids among the distinct Monochoria populations’ extracts: apigenin (compound 5) and two of its glycoside derivatives, apigenin-7-O-rutinoside (compound 1) and apigenin-7-O-glucoside (also known as apigetrin, compound 3), as well as luteolin (compound 4) and one of its glycoside derivatives, luteolin-7-O-glucoside (compound 2).
Each of the compounds was well-separated with excellent repeatability, as can be seen in the relative standard deviations of the retention times with adequate peak symmetry and accurate resolution (Table 2). The LOD and LOQ values were determined using the response standard deviation and slope of the calibration curves and demonstrated that the proposed technique is adequately sensitive for measuring flavonoids from M. angustifolia leaf ethanolic extract (Table 2).
The method was then validated using the Association of Analytical Communities (AOAC) standards to ensure accuracy and reproducibility in quantification [24]. The validation results are summarized in Table 3, including the Horwitz ratio, accuracy, and intra- and inter-day precision. These results indicated that this analytical method is adequate to quantify the different flavonoid phytochemicals from M. angustifolia leaf extract.
The HPLC profiles (Figure 4) clearly illustrated that the accumulation profile differed qualitatively and quantitatively between the two Monochoria species. Indeed, while both species accumulated apigenin and luteolin primarily in their conjugated glycoside forms rather than their aglycone forms (compounds 4 and 5 on the HPLC chromatograms), the major conjugated form clearly differs between the two Monochoria species, with M. hastata samples accumulating apigenin-7-O-rutinoside (compound 1) as the main flavonoid, as opposed to M. angustifolia samples which accumulate apigenin-7-O-glucoside (compound 3) as the main flavonoid. Plants accumulate glycosidic forms to enhance their solubility and stability [30]. Therefore, this accumulation profile toward glycosidic forms makes sense. Interestingly, in some cases, glycosylation may improve flavonoid’s biological activities [27,30].
Absolute quantification of the five main flavonoids has been conducted (Figure 5, Table S1).
Individually, (1) apigenin-7-O-rutinoside ranged from 6.94 (Ma#3) to 22.04 (Ma#16) mg/100 g DW in M. angustifolia extracts, and from 19.78 (Mh#6) to 28.15 (Mh#2) mg/100 g DW in M. hastata extracts; (2) luteolin-7-O-glucoside ranged from 5.62 (Ma#8) to 18.91 (Ma#16) mg/100 g DW in M. angustifolia extracts, and from 3.43 (Mh#6) to 4.94 (Mh#2) mg/100 g DW in M. hastata extracts; (3) apigenin-7-O-glucoside ranged from 11.94 (Ma#3) to 36.94 (Ma#16) mg/100 g DW in M. angustifolia extracts, and from 9.63 (Mh#6) to 12.29 (Mh#2) mg/100 g DW in M. hastata extracts; (4) luteolin ranged from 7.86 (Ma#3) to 25.08 (Ma#16) mg/100 g DW in M. angustifolia extracts, and from 5.77 (Mh#6) to 7.28 (Mh#2) mg/100 g DW in M. hastata extracts; (5) apigenin ranged from 1.07 (Ma#3) to 3.41 (Ma#16) mg/100 g DW in M. angustifolia extracts, and from 1.83 (Mh#6) to 2.60 (Mh#2) mg/100 g DW in M. hastata extracts (Figure 5, Table S1). This is the first work on the HPLC analysis of the flavonoid content of M. angustifolia and, to the best of our knowledge, of M. hastata as well. However, glycoside derivatives of both apigenin and luteolin have been identified in a variety of species from the Pontederiaceae family [31,32,33], adding validity to our results. Future studies will be performed to identify other minor flavonoids using high resolution mass spectrometry. These results confirmed the different accumulation strategies observed with the TPC and TFC analyses for the two species, as well as at the population level in the case of M. angustifolia. The present results also revealed the special interest for possible applications of the new species (i.e., M. angustifolia), over M. hastata due to its higher flavonoid content. Many Monochoria species are invasive and considered weeds [34], however, this can be seen as a benefit in terms of obtaining a large and valuable biomass.
The observed variations may be the result of distinct genetic backgrounds, but they may also be the result of the effect of various ecological conditions. Environmental variables, for example climatic and geographic factors including growth conditions, in addition to genetic background, were demonstrated to be major influences on accumulation of phenolic compounds [14,15]. Hierarchical clustering analysis (HCA) was therefore used to discover probable groups among the heterogeneous samples from the various populations, in order to examine the structure of the populations (Figure 6).
Based on the phytochemical profiles, the HCA indicated that the clustering occurred predominantly at the genetic level, with a clear distinction between the two Monochoria species. In good agreement, flavonoids have been successfully employed to analyze evolutionary connections of various angiosperm families, and also for botanical authentication [35,36,37,38]. However, there is no discernible pattern to illustrate the importance of the environmental factors. Given the wide geographic distribution of different M. angustifolia populations through the diverse floristic regions of Thailand. We cannot rule out the possibility that environmental variables may explain at least some of the observed heterogeneity, but it appears that genetics is a major driver of the phytochemical diversity. Overall, the present results give the most comprehensive picture to date of the phytochemical, flavonoid-specific, broad variability found at different population levels of the two Monochoria species, including the newly described M. angustifolia. Flavonoids, through their antioxidant action, have been demonstrated to have a wide range of health-promoting properties [9]. As a result, we next investigated the impact of this wide flavonoid variability on the antioxidant activity of these extracts.

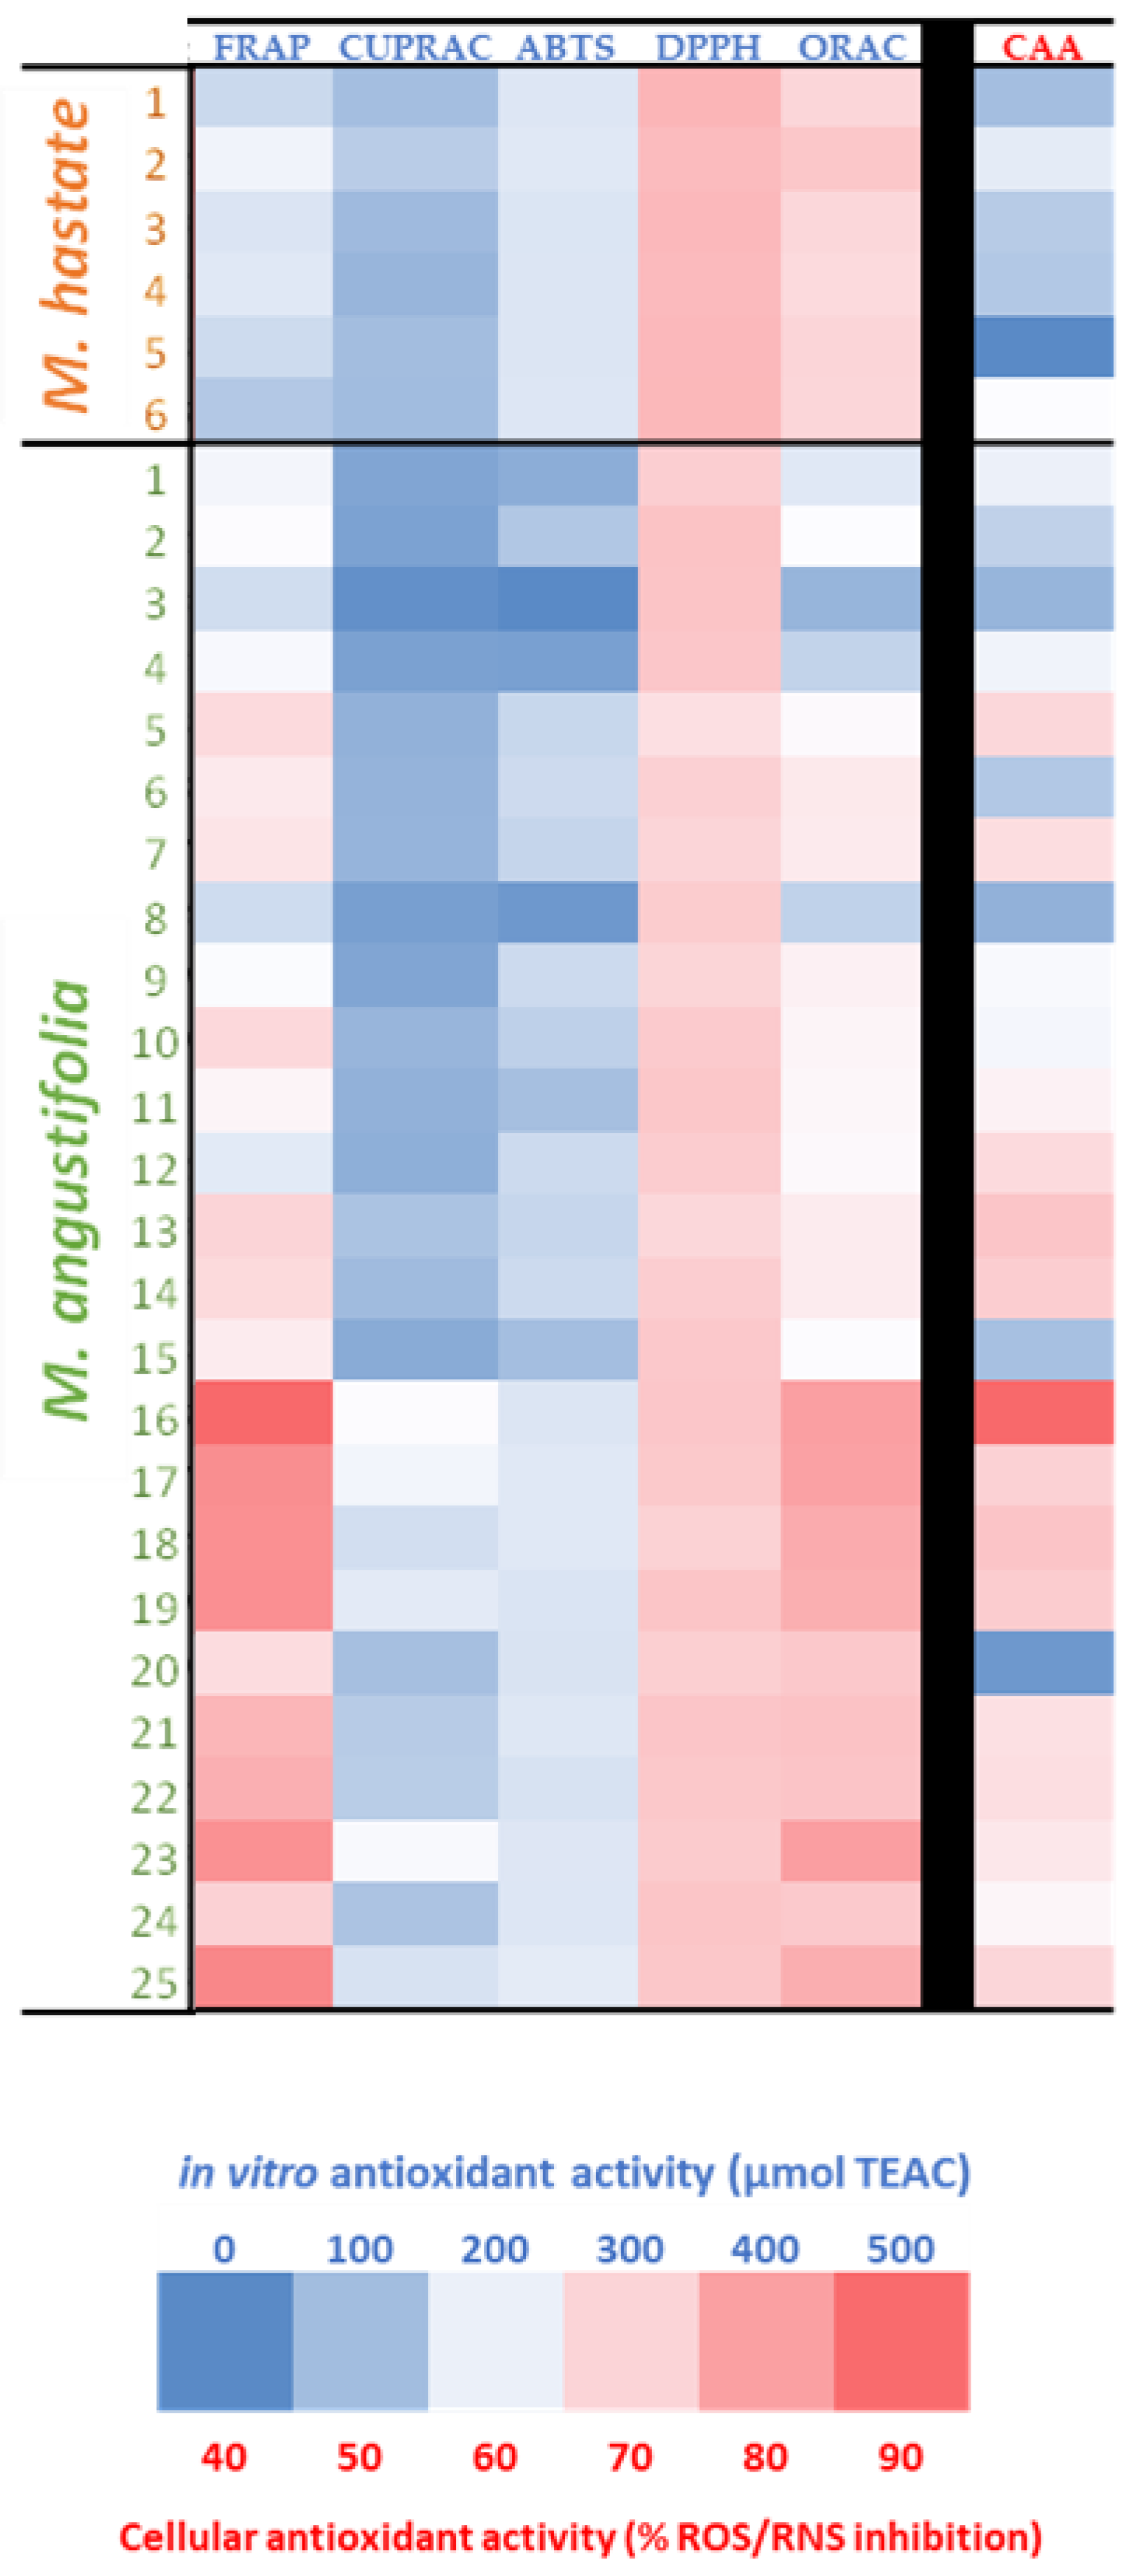
3.3. Antioxidant Activity

The antioxidant effect of the leaf extracts from various M. angustifolia and M. hastata populations were assessed for their antioxidant capacity using in vitro assays involving the two main antioxidant mechanisms such as the hydrogen atom transfer (HAT) mechanism assessed using ORAC assay and the single electron transfer (SET) mechanism assessed using CUPRAX and FRAP assays, whereas ABTS and DPPH assays allowed for both antioxidant mechanisms to be assessed [38,39,40]. The results expressed in µmol of Trolox-C equivalent antioxidant capacity (µmol TEAC) are summarized in Figure 7 and Table S2.
The antioxidant capacity differed substantially for the two species extracts. M. hastata showed high ORAC, DPPH and ABTS radical scavenging activities, suggesting the preponderance of a HAT antioxidant mechanism for these extracts. When compared to M. hastata extracts, M. angustifolia had a significantly higher FRAP antioxidant activity, in addition to a high DPPH radical scavenging activity, thus implying a greater contribution of the ET-based antioxidant mechanism. Furthermore, the HAT-based antioxidant capacity of M. angustifolia extracts is comparable to that of M. hastata extracts. As a result, by involving the two types of antioxidant mechanisms, M. angustifolia extracts appeared more attractive in terms of antioxidant capacity than M. hastata extracts.
The higher flavonoid contents of M. angustifolia extracts could be related to the largest contribution of the HAT mechanism. When it comes to quenching free radicals, flavonoids preferentially function through HAT-based reactions rather than ET-based reactions [25,41,42]. Other chemicals, notably phenolics, may contribute to this antioxidant effect in synergy via an ET-based mechanism [25,42]. Indeed, flavonoids are known to favor the HAT-based antioxidant mechanism over the ET-based antioxidant mechanism [25,41,42]. Here, other compounds, particularly phenolics, may also contribute in synergy with flavonoids via an ET-based mechanism [25,42]. For instance, Bai et al. [29] have reported the DPPH radical scavenging capacity of stigmasterol extracted from M. hastata.
The high antioxidant capacity of both Monochoria extracts was further confirmed in in vivo using the yeast model CAA assay, as the capacity to produce ROS and RNS in yeast cells subjected to UV-induced oxidative stress. A greater cellular antioxidant capacity was confirmed for M. angustifolia extracts as compared to M. hastata extracts.

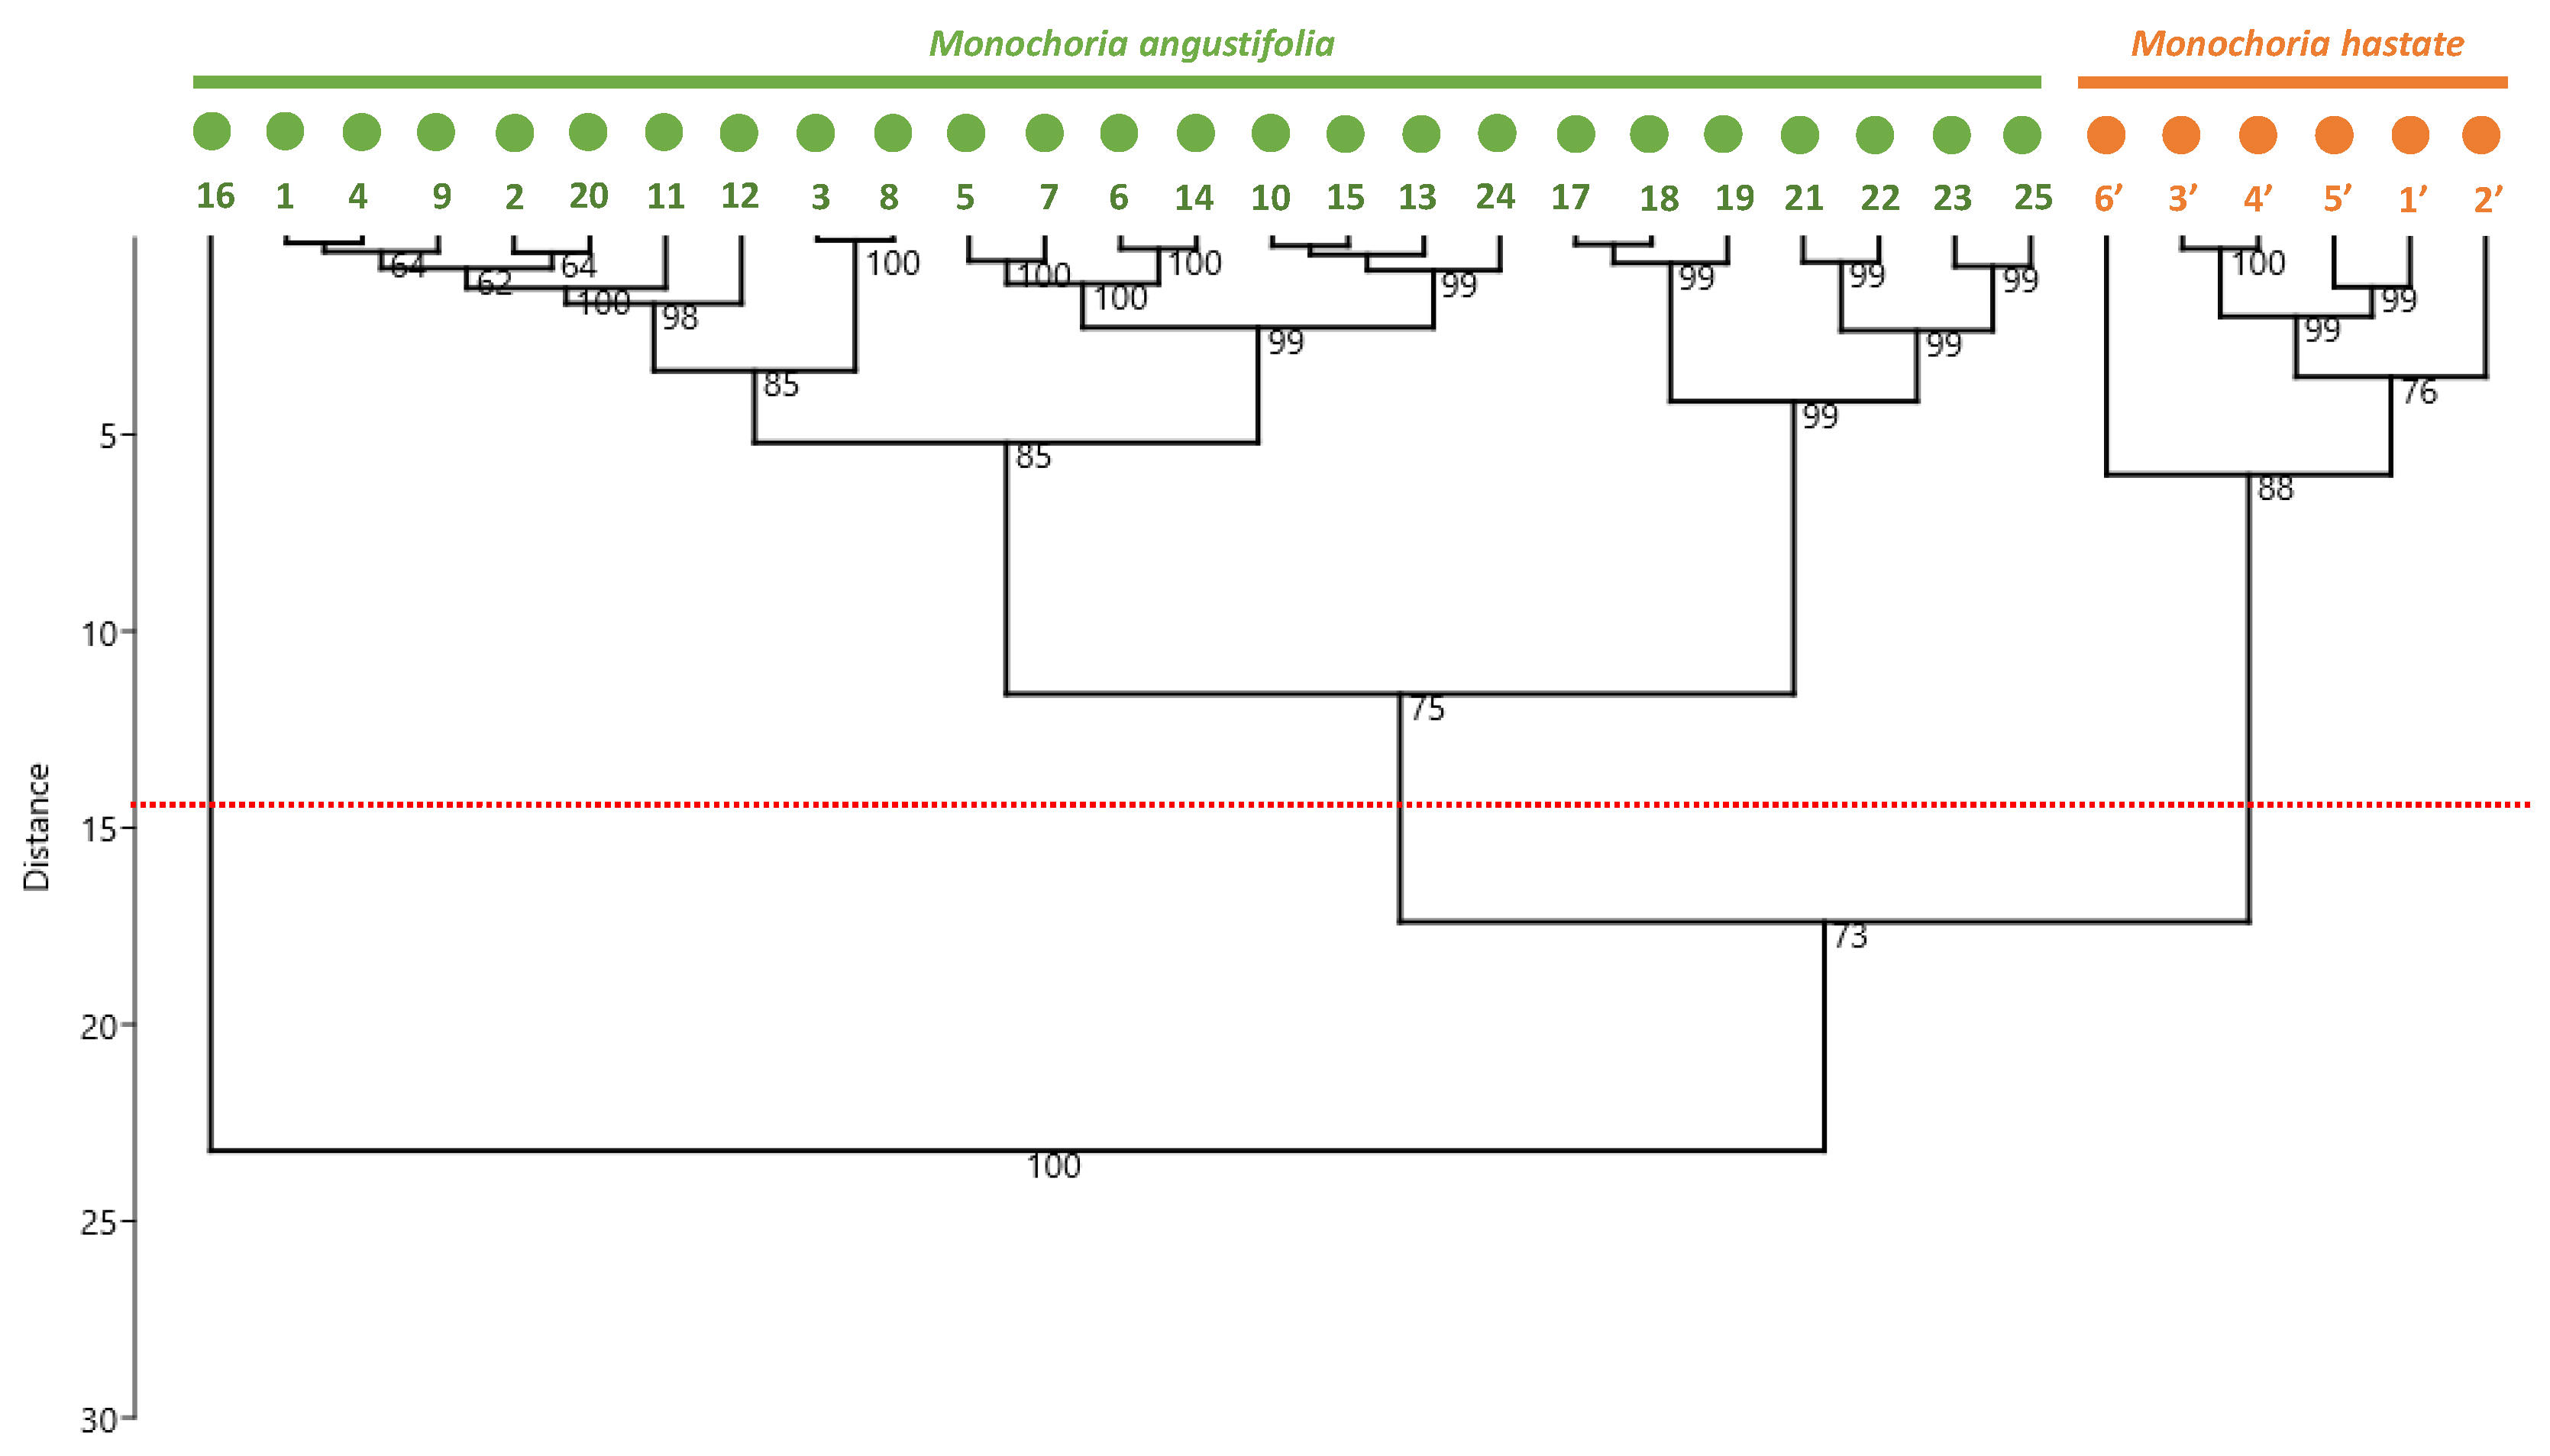
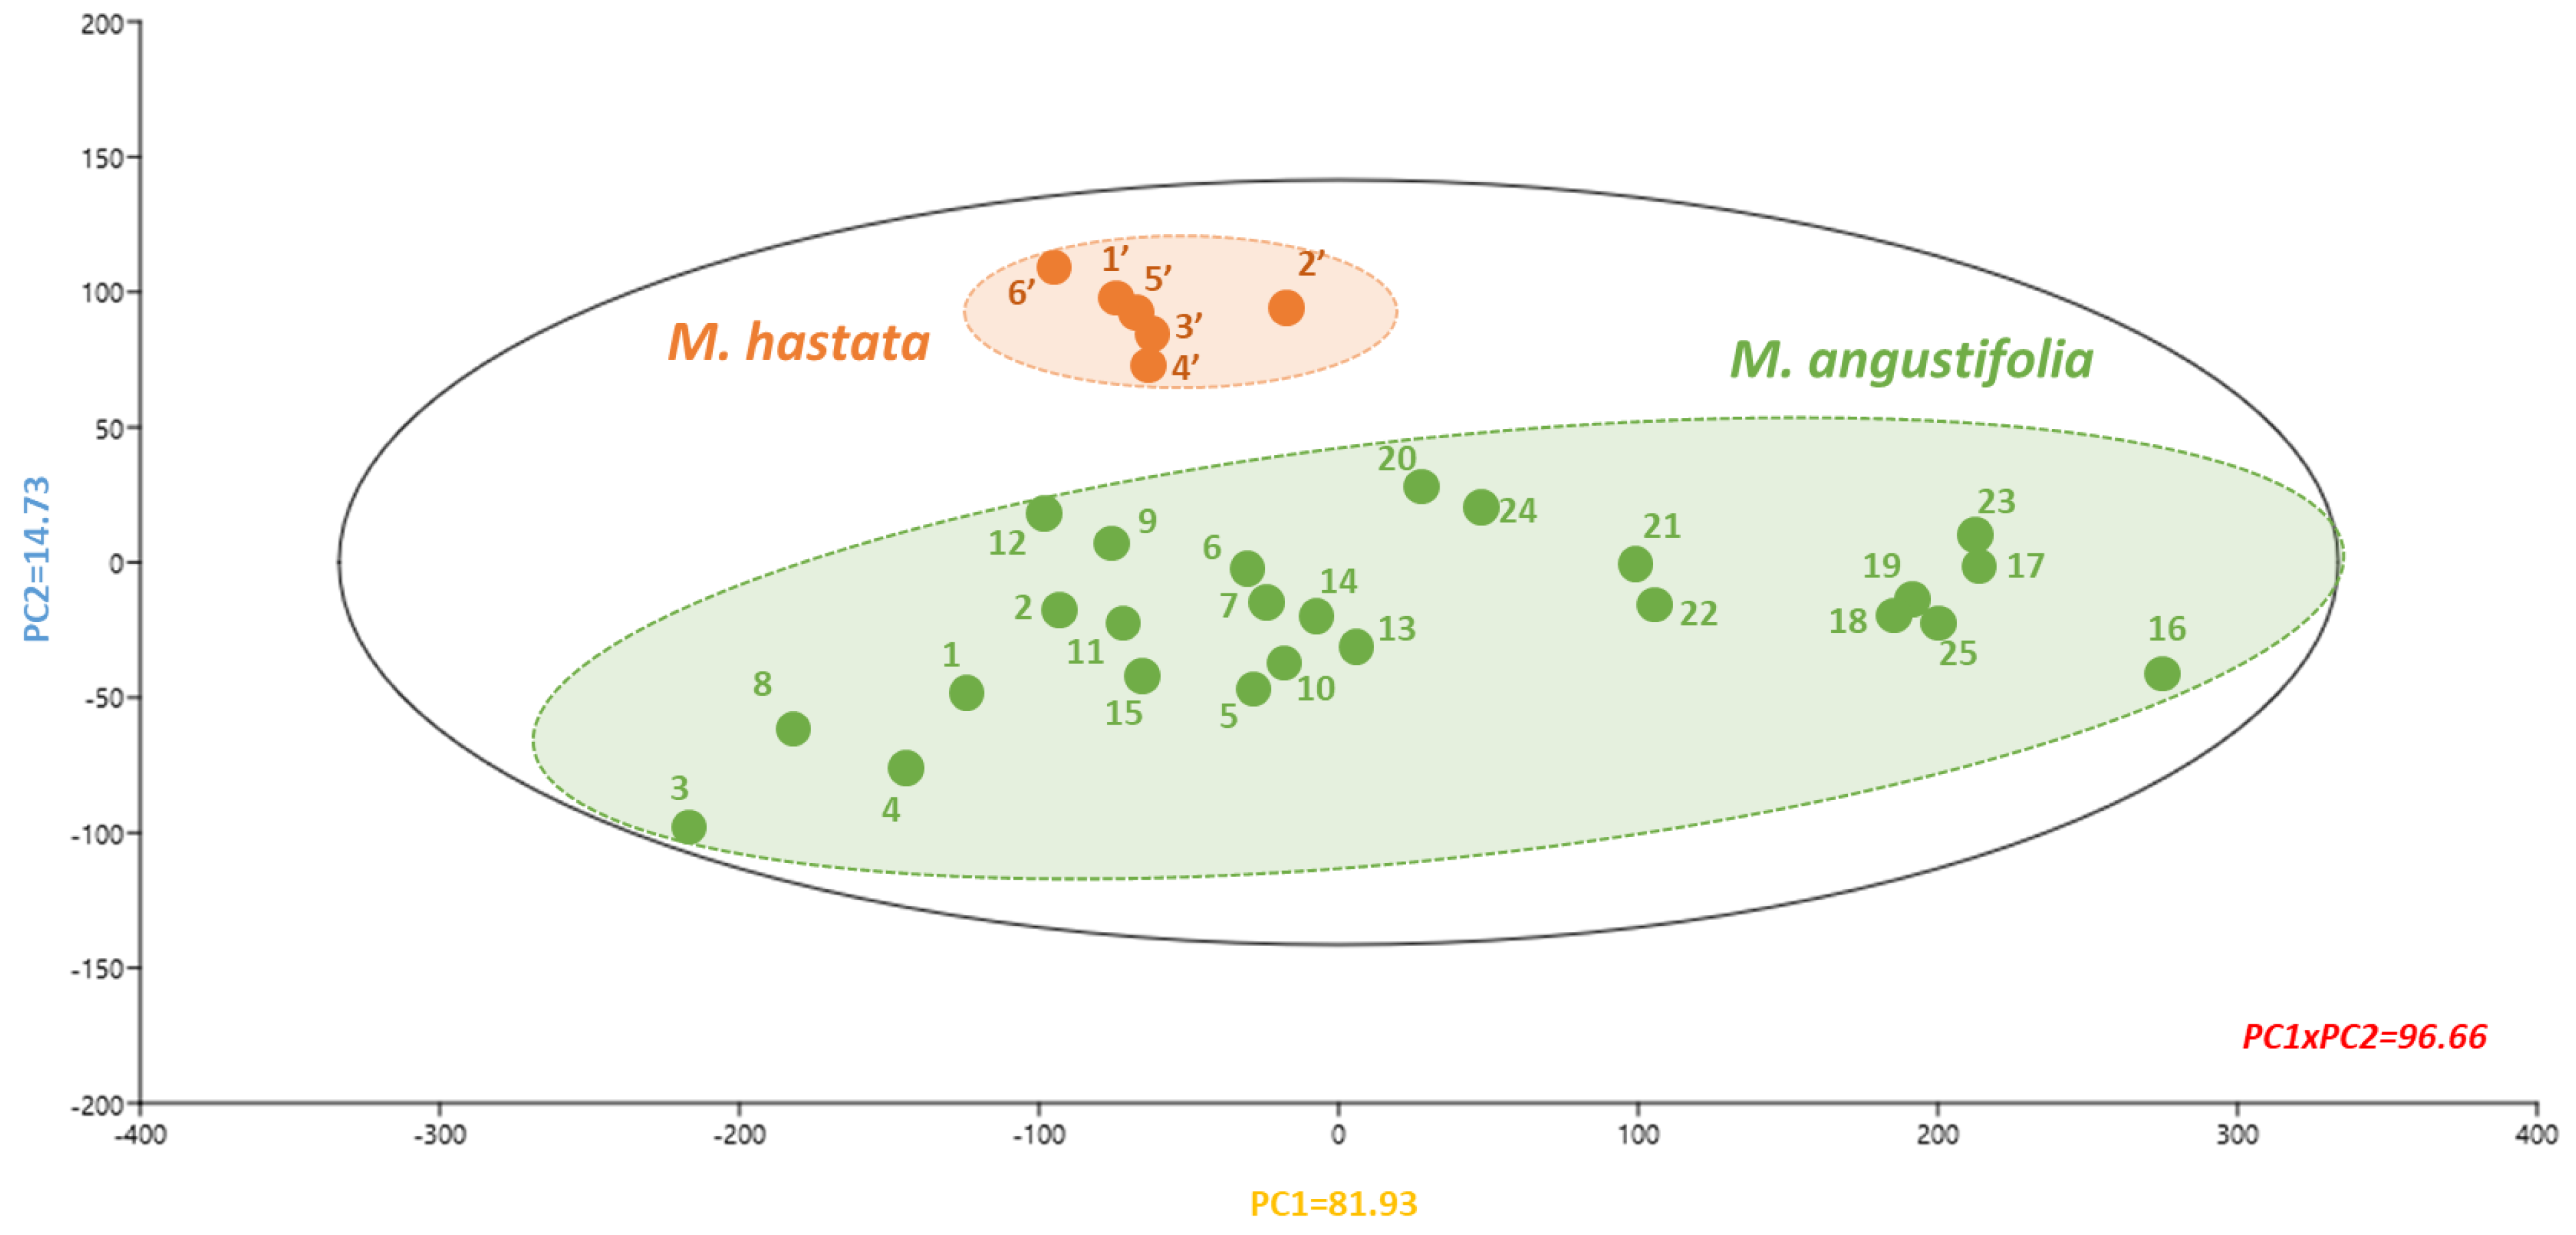
3.4. Correlation Analysis

The PCA or principal component analysis was used to identify relevant connections between the different natural populations based on their phytochemical composition and antioxidant activity (Figure 8).
Biplot representation accounted for 96.66% of the initial variability (Figure 8). The TFC and ET-based antioxidant FRAP and CUPRAC assays were the primary contributors to discriminate the component one axis, accounting for 81.93% of the initial variability (Figure S1). In contrast, the second axis accounted for just 14.73% of the initial variability with TPC and the mixed ET/HAT- and HAT-based antioxidant ABTS and ORAC assays (Figure S1). As a result of this PCA, two distinct clusters were discriminated from each other based on phytochemical composition as well as antioxidant capacity. Excitingly, these clusters separated M. hastata extracts from M. angustifolia extracts. The M. hastata extracts were grouped, whereas M. angustifolia extracts appeared substantially more diverse.
Pearson correlation coefficients (PCC) were used to evaluate the linkage between phytochemicals and antioxidant capacity (Figure 9, Table S3).
The strength of various correlations between the phytochemicals (TPC, TFC and each flavonoid), and the various antioxidant assays was measured. The most remarkable were the highly significantly correlations between the various flavonoids and the ET-based antioxidant assays (FRAP and CUPRAC) and the cellular antioxidant assay, on the one hand, and the TPC and the HAT-based antioxidant assay, on the other. The correlations are consistent with the antioxidant mechanisms reported for these phytochemicals [25,42]. These correlations also highlighted that antioxidant capacity of the extract is typically the consequence of complex phytochemical combinations instead of the action of a single compound [43]. This study proved the great potential of M. angustifolia extracts as an alternative starting material for a variety of applications focused on their antioxidant flavonoids, as previously discussed in other plant species [9,10,13,27,37].

4. Conclusions

This current research on 25 populations of M. angustifolia collected from natural habitats in Thailand, exhibited high heterogeneity of phenolics/polyphenols accumulation. Likewise, this present study indicated that flavonoids are major phytochemicals of this plant, as well as demonstrating that M. angustifolia plant material is richer in flavonoids compared to the outgroup species from the same genus, M. hastata. The results showed that flavonoids might be employed to examine Monochoria’s evolutionary connections as well as for botanical authentication. Furthermore, the use of various in vitro antioxidant assays as well as a cellular antioxidant assay revealed that the antioxidant effect of M. angustifolia extracts is primarily facilitated by hydrogen atom transfer mechanisms, and antioxidant potential of the obtained extracts originated from complex phytochemical compounds. This study provides a new frontier of knowledge on the phytochemical diversity and antioxidant potential of M. angustifolia natural populations from all floristic regions in Thailand, harboring the highest species diversity in the Monochoria genus. This will certainly be an aid to phytopharmaceutical industries as this raw plant material has the potential to develop new bioactive products for the phytopharmaceutical sectors.

Supplementary Materials

The following supporting information can be downloaded at: https://www.mdpi.com/article/10.3390/antiox11050952/s1, Table S1. HPLC quantification (expressed in mg/100 g DW) of the main flavonoids in different populations of two Monochoria species (six populations of M. hastata and 25 populations of M. angustifolia) covering the entire floristic regions of Thailand; Table S2. In vitro cell-free antioxidant (FRAP, CUPRAC, ABTS, DPPH and ORAC) and cellular antioxidant (CAA) assays of extracts from 25 different populations of M. angustifolia and six different populations of M. hastata. Table S3. Pearson correlation coefficient linking phytochemicals and antioxidant activity of ethanolic extracts of different populations of two Monochoria species (six populations of M. hastata and 25 populations of M. angustifolia) covering the entire floristic regions of Thailand; Figure S1. Loading scores of the component 1 and component 2 of the PCA (presented in Figure 5) linking the phytochemical profile and antioxidant capacity of the extracts of M. hastata and M. angustifolia populations originating from various floristic regions of Thailand. 1. apigenin-7-O-rutinoside; 2. luteolin-7-O-glucoside; 3. apigenin-7-O-glucoside (also known as apigetrin); 4. Luteolin; 5. Apigenin; TPC: total phenolic content; TFC: total flavonoid content; ABTS: 2,2-azinobis (3-ethylbenzthiazoline-6-sulphonic acid); DPPH: 2,2-diphenyl-1-picrylhydrazyl; FRAP: ferric reducing antioxidant power; CUPRAC: cupric reducing antioxidant capacity; ORAC: oxygen radical absorbance capacity; CAA: cellular antioxidant assay.

Author Contributions

Conceptualization, D.T. and C.H.; methodology, D.T., S.D., L.G. and C.H.; software, S.D.; validation, D.T., J.M.L. and C.H.; formal analysis, D.T., J.M.L. and C.H.; investigation, D.T., S.D., L.G. and C.H.; results, D.T. and C.H.; data curation, D.T. and C.H.; writing—original draft preparation, D.T. and C.H.; writing—review and editing, D.T., S.D., L.G., J.M.L. and C.H.; visualization, D.T., S.D., J.M.L. and C.H.; supervision, D.T. and C.H.; project administration, D.T. and C.H.; funding acquisition, D.T. and C.H. All authors have read and agreed to the published version of the manuscript.

Funding

This research was funded by the Agricultural Research Development Agency (Public Organization). This research project is supported by Mahidol University (Basic Research Fund: fiscal year 2022). This research was supported by Cosmetosciences, a global training and research program dedicated to the cosmetic industry. Located in the heart of the Cosmetic Valley, this program led by University of Orléans is funded by the Région Centre-Val de Loire.

Institutional Review Board Statement

Not applicable.

Informed Consent Statement

Not applicable.

Data Availability Statement

All the data supporting the findings of this study are included in this article and supplementary material.

Acknowledgments

D.T. is thankful to the Agricultural Research Development Agency (Public Organization) and Mahidol University. This research project is funded by the Agricultural Research Development Agency (Public Organization). This research project is supported by Mahidol University (Basic Research Fund: fiscal year 2022). D.T. also would like to thank all the herbaria and curators for the opportunity to study the related herbarium specimens. C.H. and D.T. acknowledges Le Studium Institute for Advance Study for its support. S.D. acknowledges the research fellowship of Loire Valley Region.

Conflicts of Interest

The authors declare no conflict of interest.

References

  1. Tungmunnithum, D.; Tanaka, N.; Boonkerd, B. Monochoria angustifolia (G. X. Wang) Boonkerd & Tungmunnithum, the new species of the genus Monochoria from Thailand. Songklanakarin J. Sci. Technol. 2020, 42, 747–752. [Google Scholar]
  2. Tungmunnithum, D.; Boonkerd, T.; Zungsontiporn, S.; Tanaka, N. Morphological variations among populations of Monochoria vaginalis s.l. (Pontederiaceae) in Thailand. Phytotaxa 2016, 268, 57–68. [Google Scholar] [CrossRef]
  3. Tungmunnithum, D.; Boonkerd, T.; Zungsontiporn, S.; Tanaka, N. Phenetic study of the genus Monochoria in Thailand. Songklanakarin J. Sci. Technol. 2017, 39, 49–57. [Google Scholar]
  4. Chayamarit, K. Pontederiaceae. In Flora of Thailand; Santisuk, T., Larsen, K., Eds.; Parchachon: Bangkok, Thailand, 2005; pp. 51–57. [Google Scholar]
  5. World Checklist of Selected Plant Families. Available online: http://wcsp.science.kew.org/home.do (accessed on 2 January 2022).
  6. Tungmunnithum, D.; Kidyoo, M.; Khunwasi, C. Variations of the Hoya siamica Craib (Asclepiadaceae) in Thailand. Trop. Nat. Hist. 2011, 11, 29–37. [Google Scholar]
  7. Guofang, W.; Horn, C.N. Pontederiaceae. In Flora of China; Wu, Z.Y., Raven, P.H., Eds.; Science Press: Beijing, China; Missouri Botanical Garden: St. Louis, MO, USA, 2000; pp. 40–42. [Google Scholar]
  8. Tungmunnithum, D.; Drouet, S.; Lorenzo, J.M.; Hano, C. Green extraction of antioxidant flavonoids from pigeon pea (Cajanus cajan (L.) millsp.) seeds using ultrasound-assisted methodology. Molecules 2021, 26, 7557. [Google Scholar] [CrossRef] [PubMed]
  9. Hano, C.; Tungmunnithum, D. Plant polyphenols, more than just simple natural antioxidants: Oxidative stress, aging and age-related diseases. Medicines 2020, 7, 26. [Google Scholar] [CrossRef]
  10. Tungmunnithum, D.; Thongboonyou, A.; Pholboon, A.; Yangsabai, A. Flavonoids and other phenolic compounds from medicinal plants for pharmaceutical and medical aspects: An overview. Medicines 2018, 5, 93. [Google Scholar] [CrossRef]
  11. Tungmunnithum, D.; Drouet, S.; Lorenzo, J.M.; Hano, C. Characterization of bioactive phenolics and antioxidant capacity of edible bean extracts of 50 fabaceae populations grown in Thailand. Foods 2021, 10, 3118. [Google Scholar] [CrossRef]
  12. Tungmunnithum, D.; Elamrani, A.; Abid, M.; Drouet, S.; Kiani, R.; Garros, L.; Kabra, A.; Addi, M.; Hano, C. A quick, green and simple ultrasound-assisted extraction for the valorization of antioxidant phenolic acids from Moroccan almond cold-pressed oil residues. Appl. Sci. 2020, 10, 3313. [Google Scholar] [CrossRef]
  13. Drouet, S.; Leclerc, E.A.; Garros, L.; Tungmunnithum, D.; Kabra, A.; Abbasi, B.H.; Lainé, É.; Hano, C. A green ultrasound-assisted extraction optimization of the natural antioxidant and anti-aging flavonolignans from milk thistle Silybum marianum (L.) gaertn. fruits for cosmetic applications. Antioxidants 2019, 8, 304. [Google Scholar] [CrossRef] [Green Version]
  14. Drouet, S.; Abbasi, B.H.; Falguières, A.; Ahmad, W.; Sumaira; Ferroud, C.; Doussot, J.; Vanier, J.R.; Lainé, E.; Hano, C. Single laboratory validation of a quantitative core shell-based LC separation for the evaluation of silymarin variability and associated antioxidant activity of pakistani ecotypes of milk thistle (Silybum marianum, L.). Molecules 2018, 23, 904. [Google Scholar] [CrossRef] [Green Version]
  15. Garros, L.; Drouet, S.; Corbin, C.; Decourtil, C.; Fidel, T.; de Lacour, J.L.; Leclerc, E.A.; Renouard, S.; Tungmunnithum, D.; Doussot, J.; et al. Insight into the influence of cultivar type, cultivation year, and site on the lignans and related phenolic profiles, and the health-promoting antioxidant potential of flax (Linum usitatissimum L.) seeds. Molecules 2018, 23, 2636. [Google Scholar] [CrossRef] [PubMed] [Green Version]
  16. Singh, M.; Griaud, C.; Collins, C.M. An evaluation of the effectiveness of protected areas in Thailand. Ecol. Indic. 2021, 125, 107536. [Google Scholar] [CrossRef]
  17. Backer, C.A. Pontederiaceae. In Flora Malesiana; Steenis, C.G.G.J., Ed.; Kluwer Academic: Dordrecht, The Netherlands, 1951; pp. 255–259. [Google Scholar]
  18. Ridley, H.N. Monochoria. In The Flora of the Malay Peninsula; Ridley, H.N., Ed.; L. Reeve: London, UK, 1924; pp. 295–319. [Google Scholar]
  19. Yang, Y.P. Pontederiaceae. In Flora of Taiwan; Liu, T.S., Huang, T.C., Koyama, T., Devol, C.E., Eds.; Epoch Publ. Co. Ltd.: Taipei, Taiwan, 1976; pp. 138–140. [Google Scholar]
  20. Thiers, B.; Thiers, B.H.; Cokic, B.B.B. Index Herbariorum: A Global Directory of Public Herbaria and Associated Staff; New York Botanical Garden’s Virtual Herbarium: New York, NY, USA, 2009. [Google Scholar]
  21. World Health Organization. Quality Control Methods for Medicinal Plant Materials; World Health Organization: Geneva, Switzerland, 1998; ISBN 9241545100. [Google Scholar]
  22. Tungmunnithum, D.; Drouet, S.; Kabra, A.; Hano, C. Enrichment in antioxidant flavonoids of stamen extracts from Nymphaea lotus L. using ultrasonic-assisted extraction and macroporous resin adsorption. Antioxidants 2020, 9, 576. [Google Scholar] [CrossRef]
  23. Tungmunnithum, D.; Drouet, S.; Hano, C. Validation of a high-performance liquid chromatography with photodiode array detection method for the separation and quantification of antioxidant and skin anti-aging flavonoids from Nelumbo nucifera Gaertn. stamen extract. Molecules 2022, 27, 1102. [Google Scholar] [CrossRef]
  24. Horwitz, W. AOAC Guidelines for Single Laboratory Validation of Chemical Methods for Dietary Supplements and Botanicals; AOAC Int: Gaithersburg, MD, USA, 2002; p. 1219. [Google Scholar]
  25. Nazir, M.; Tungmunnithum, D.; Bose, S.; Drouet, S.; Garros, L.; Giglioli-Guivarc’h, N.; Abbasi, B.H.; Hano, C. Differential production of phenylpropanoid metabolites in callus cultures of Ocimum basilicum L. with distinct in vitro antioxidant activities and in vivo protective effects against UV stress. J. Agric. Food Chem. 2019, 67, 1847–1859. [Google Scholar] [CrossRef]
  26. Hammer, Ø.; Harper, D.A.; Ryan, P.D. PAST: Paleontological statistics software package for education and data analysis. Palaeontol. Electron. 2001, 4, 9. [Google Scholar]
  27. Tungmunnithum, D.; Pinthong, D.; Hano, C. Flavonoids from Nelumbo nucifera Gaertn., a medicinal plant: Uses in traditional medicine, phytochemistry and pharmacological activities. Medicines 2018, 5, 127. [Google Scholar] [CrossRef] [Green Version]
  28. Yang, R.-Y.; Lin, S.; Kuo, G. Content and distribution of flavonoids among 91 edible plant species. Asia Pac. J. Clin. Nutr. 2008, 17, 275–279. [Google Scholar]
  29. Bai, N.K.; Ilango, K. High performance thin layer chromatography-automated multiple development bioautography of phytoconstituents and quantification of stigmasterol in Monochoria vaginalis and Monochoria hastata with antioxidant potential. Pharmacogn. Mag. 2018, 14, 45. [Google Scholar] [CrossRef]
  30. Ferreyra, M.L.F.; Serra, P.; Casati, P. Recent advances on the roles of flavonoids as plant protective molecules after UV and high light exposure. Physiol. Plant. 2021, 173, 736–749. [Google Scholar] [CrossRef] [PubMed]
  31. Rosatti, T.J. The genera of Pontederiaceae in the southeastern United States. J. Arnold Arbor. 1987, 68, 35–71. [Google Scholar] [CrossRef]
  32. Sen, P.; Sahu, P.K.; Haldar, R.; Sahu, K.; Prasad, P.; Roy, A. Apigenin naturally occurring flavonoids: Occurrence and bioactivity. Pharm. Biosci. J. 2016, 4, 56–68. [Google Scholar] [CrossRef]
  33. Toki, K.; Saito, N.; Iimura, K.; Suzuki, T.; Honda, T. (Delphinidin 3-gentiobiosyl) (apigenin 7-glucosyl) malonate from the flowers of Eichhornia crassipes. Phytochemistry 1994, 36, 1181–1183. [Google Scholar] [CrossRef]
  34. Rao, A.N.; Brainard, D.C.; Kumar, V.; Ladha, J.K.; Johnson, D.E. Preventive weed management in direct-seeded rice: Targeting the weed seedbank. Adv. Agron. 2017, 144, 45–142. [Google Scholar]
  35. Tungmunnithum, D.; Renouard, S.; Drouet, S.; Blondeau, J.-P.; Hano, C. A critical cross-species comparison of pollen from Nelumbo nucifera Gaertn. vs. Nymphaea lotus L. for authentication of Thai medicinal herbal tea. Plants 2020, 9, 921. [Google Scholar] [CrossRef]
  36. Stuessy, T.F.; Crawford, D.J. Flavonoids and phylogenetic reconstruction. Plant Syst. Evol. 1983, 143, 83–107. [Google Scholar] [CrossRef]
  37. Drouet, S.; Garros, L.; Hano, C.; Tungmunnithum, D.; Renouard, S.; Hagège, D.; Maunit, B.; Lainé, E. A critical view of different botanical, molecular, and chemical techniques used in authentication of plant materials for cosmetic applications. Cosmetics 2018, 5, 30. [Google Scholar] [CrossRef] [Green Version]
  38. Escriche, I.; Kadar, M.; Juan-Borrás, M.; Doménech, E. Using flavonoids, phenolic compounds and headspace volatile profile for botanical authentication of lemon and orange honeys. Food Res. Int. 2011, 44, 1504–1513. [Google Scholar] [CrossRef]
  39. Abbasi, B.H.; Siddiquah, A.; Tungmunnithum, D.; Bose, S.; Younas, M.; Garros, L.; Drouet, S.; Giglioli-Guivarc’H, N.; Hano, C. Isodon rugosus (Wall. ex Benth.) Codd in vitro cultures: Establishment, phytochemical characterization and in vitro antioxidant and anti-aging activities. Int. J. Mol. Sci. 2019, 20, 452. [Google Scholar] [CrossRef] [Green Version]
  40. Apak, R.; Özyürek, M.; Güçlü, K.; Çapanoğlu, E. Antioxidant activity/capacity measurement. 2. Hydrogen atom transfer (HAT)-based, mixed-mode (electron transfer (ET)/HAT), and lipid peroxidation assays. J. Agric. Food Chem. 2016, 64, 1028–1045. [Google Scholar] [CrossRef] [PubMed]
  41. Vo, Q.V.; Nam, P.-C.; Thong, N.M.; Trung, N.T.; Phan, C.-T.D.; Mechler, A. Antioxidant motifs in flavonoids: O–H versus C–H bond dissociation. ACS Omega 2019, 4, 8935–8942. [Google Scholar] [CrossRef] [PubMed] [Green Version]
  42. Rice-Evans, C.A.; Miller, N.J.; Paganga, G.; Catherine, A.R.-E.; Nicholas, J.M.; George, P. Structure-antioxidant activity relationships of flavonoids and phenolic acids. Free Radic. Biol. Med. 1996, 20, 933–956. [Google Scholar] [CrossRef]
  43. Prior, R.L.; Wu, X.; Schaich, K. Standardized methods for the determination of antioxidant capacity and phenolics in foods and dietary supplements. J. Agric. Food Chem. 2005, 53, 4290–4302. [Google Scholar] [CrossRef]
Figure 1. M. angustifolia (A): Natural Habitat, (B): The whole plant with inflorescence, (C): Leaf, Bar scale = 0.5 cm; (D,E): Inflorescence, (F): Flower (side view) Bar scale = 0.3 cm; (G): Flower (top view) Bar scale = 0.3 cm; (H): Seed, Bar scale = 500 µm. All photos were taken in Thailand by D.T.
Antioxidants 11 00952 g001
Figure 2. Distribution map of M. angustifolia populations throughout the floristic regions in Thailand. Numbers 1–25 indicate the number of populations.
Antioxidants 11 00952 g002
Figure 3. Total phenolic content (A) and total flavonoid contents (B) in different populations of two Monochoria species including the 6 populations of M. hastata and 25 populations of M. angustifolia) covering the entire floristic regions from Thailand. Different letters indicate significant differences at p < 0.05.
Antioxidants 11 00952 g003aAntioxidants 11 00952 g003b
Figure 4. The HPLC chromatograms detected at 320 nm of (A) M. angustifolia population #16; (B) superimposed view of the M. angustifolia 25 populations; (C) M. hastata population #2; (D) superimposed view of the M. hastata 6 populations; (E) Structure of the main identified flavonoids: 1. apigenin-7-O-rutinoside; 2. luteolin-7-O-glucoside; 3. apigenin-7-O-glucoside (also known as apigetrin); 4. luteolin; 5. apigenin.
Antioxidants 11 00952 g004
Figure 5. Absolute quantification of the main flavonoids in different populations of two Monochoria species (6 populations of M. hastata and 25 populations of M. angustifolia) covering the entire floristic regions from Thailand. 1. apigenin-7-O-rutinoside; 2. luteolin-7-O-glucoside; 3. apigenin-7-O-glucoside (also known as apigetrin); 4. luteolin; 5. apigenin. Means and standard deviations are provided in Table S1.
Antioxidants 11 00952 g005
Figure 6. Hierarchical clustering analysis (HCA) of 25 different populations of M. angustifolia and 6 different populations of M. hastata on the basis of their phytochemical profiles. The percentages of replicate trees which associated samples cluster together in after bootstrap analysis (percentage of 5000 replicates) are shown next to the branches.
Antioxidants 11 00952 g006
Figure 7. In vitro cell-free antioxidant (FRAP, CUPRAC, ABTS, DPPH and ORAC) and cellular antioxidant assay of extracts (CAA) from 25 different populations of M. angustifolia and 6 different populations of M. hastata. TEAC: TroloxC equivalent antioxidant capacity; ABTS: 2,2-azinobis (3-ethylbenzthiazoline-6-sulphonic acid); DPPH: 2,2-diphenyl-1-picrylhydrazyl; FRAP: ferric reducing antioxidant power; CUPRAC: cupric reducing antioxidant capacity; ORAC: oxygen radical absorbance capacity; CAA: cellular antioxidant assay. Means and standard deviations are provided in Table S2.
Antioxidants 11 00952 g007
Figure 8. Principal component analysis linking the phytochemical profile as well as antioxidant capacity of extracts from different populations of the two Monochoria species. Variability of component 1 = 81.93% and component 2 = 14.73%. Each number represents the populations from M. angustifolia (in green) and M. hastata (in orange). The corresponding loading score plots for components 1 and 2 are presented in Figure S1.
Antioxidants 11 00952 g008
Figure 9. Pearson coefficient correlation (correlogram analysis) between the phytochemical profiles and antioxidant activity of extracts. Api-7-O-Rut: apigenin-7-O-rutinoside; Lut-7-O-Glc: luteolin-7-O-glucoside; Api-7-O-Glc: apigenin-7-O-glucoside (also known as apigetrin); Lut: luteolin; Api: apigenin; TPC: total phenolic content; TFC: total flavonoid content; ABTS: 2,2-azinobis (3-ethylbenzthiazoline-6-sulphonic acid); DPPH: 2,2-diphenyl-1-picrylhydrazyl; FRAP: ferric reducing antioxidant power; CUPRAC: cupric reducing antioxidant capacity; ORAC: oxygen radical absorbance capacity; CAA: cellular antioxidant assay. *** significant p < 0.001; ** significant p < 0.01; * significant p < 0.05; PCC values are indicated in Table S3.
Antioxidants 11 00952 g009
Table 1. The collected 25 populations of the new species, M. angustifolia and outgroup (M. hastata).
Population No.Population Names
(The Collected Localities)
Floristic RegionsScientific Name
1Phichit Northern (N)M. angustifolia
2Nakhon SawanNorthern (N)M. angustifolia
3Khon Kaen North-Eastern (NE)M. angustifolia
4LoeiNorth-Eastern (NE)M. angustifolia
5Chaiyaphum Eastern (E)M. angustifolia
6Nakhon Ratchasima Eastern (E)M. angustifolia
7Buri RamEastern (E)M. angustifolia
8Ratchaburi South-Western (SW)M. angustifolia
9Phetchaburi South-Western (SW)M. angustifolia
10Prachuap Khiri KhanSouth-Western (SW)M. angustifolia
11Saraburi Central (C)M. angustifolia
12Suphan BuriCentral (C)M. angustifolia
13Nakhon PathomCentral (C)M. angustifolia
14RayongSouth- Eastern (SE)M. angustifolia
15Prachin Buri South- Eastern (SE)M. angustifolia
16Chachoengsao South- Eastern (SE)M. angustifolia
17Sa KaeoSouth- Eastern (SE)M. angustifolia
18ChanthaburiSouth- Eastern (SE)M. angustifolia
19Nakhon Si Thammarat Peninsular (PEN)M. angustifolia
20Phatthalung Peninsular (PEN)M. angustifolia
21Surat Thani Peninsular (PEN)M. angustifolia
22PhangngaPeninsular (PEN)M. angustifolia
23TratSouth- Eastern (SE)M. angustifolia
24Ranong Peninsular (PEN)M. angustifolia
25KrabiPeninsular (PEN)M. angustifolia
Outgroup 1Nakhon SawanNorthern (N)M. hastata
Outgroup 2LoeiNorth-Eastern (NE)M. hastata
Outgroup 3Nakhon Ratchasima Eastern (E)M. hastata
Outgroup 4Suphan BuriCentral (C)M. hastata
Outgroup 5ChachoengsaoSouth- Eastern (SE)M. hastata
Outgroup 6Ratchaburi South-Western (SW)M. hastata
Note: The population names come from the collected province/locality.
Table 2. Calibration function parameters for major flavonoids from M. angustifolia leaf extract using UV detection.
FlavonoidRetention Time (tR)Calibration CurveLOD
(µg/mL)
LOQ
(µg/mL)
MinRSD (%)RsSym FactSlopeInterceptR2
Api-7-Rut19.900.763.331.072291.9569.60.99960.080.25
Lut-7-Glc29.190.203.631.012553.3157.10.99940.020.06
Api-7-Glc32.580.513.041.112468.8642.50.99990.090.26
Lut36.280.411.871.033670.2285.10.99970.030.08
Api40.560.241.670.983742.3250.50.99920.020.07
Api: apigenin; Lut: luteolin; Api-7-Rut: apigenin-7-O-rutinoside; Lut-7-Glc: luteolin-7-O-glucoside; Api-7-Glc: apigenin-7-O-glucoside; RSD: relative standard deviation; Rs: resolution value; Sym Fact: symmetry factor; R2: correlation coefficient; LOD: limit of detection; LOQ: limit of quantification.
Table 3. Quantification and validation parameters for the simultaneous analysis of the main flavonoids from M. angustifolia leaf ethanolic extract.
FlavonoidConcentrationRSD
(%)
HortRatAccuracyIntra-Day
Precision
Inter-Day
Precision
(mg/g DW)Recovery (%)RSD%RSD%RSD
Api-7-Rut22.04 ± 0.020.090.03100.321.3499.153.8899.850.67
Lut-7-Glc18.91 ± 0.130.670.2299.900.4699.373.3595.723.67
Api-7-Glc36.84 ± 0.491.330.3999.800.5398.803.3197.914.81
Lut25.09 ± 0.150.580.18100.110.4199.641.4398.774.97
Api3.41 ± 0.205.932.4798.403.1097.994.3196.984.37
Api: apigenin; Lut: luteolin; Api-7-Rut: apigenin-7-O-rutinoside; Lut-7-Glc: luteolin-7-O-glucoside; Api-7-Glc: apigenin-7-O-glucoside; RSD: relative standard deviation; HortRat: Horwitz ratio. Concentration values of M. angustifolia population #16.
Publisher’s Note: MDPI stays neutral with regard to jurisdictional claims in published maps and institutional affiliations.

