Article

Controlled Atmosphere Improves the Quality, Antioxidant Activity and Phenolic Content of Yellow Peach during the Shelf Life

1
Longping Branch, College of Biology, Hunan University, Changsha 410125, China
2
Agricultural Product Processing Institute, Hunan Academy of Agricultural Sciences, Changsha 410125, China
3
Hunan Provincial Key Laboratory of Fruits and Vegetables Storage, Processing and Quality Safety, Changsha 410125, China
4
Hunan Province International Joint Laboratory on Fruits and Vegetables Processing, Quality and Safety, Changsha 410125, China
*
Author to whom correspondence should be addressed.
Antioxidants 2022, 11(11), 2278; https://doi.org/10.3390/antiox11112278
Submission received: 17 October 2022 / Revised: 10 November 2022 / Accepted: 16 November 2022 / Published: 17 November 2022

Abstract

:
Controlled atmosphere (CA) has been demonstrated to maintain the shelf-life quality of fruits, but its effect on the antioxidant activities and phenolic content of yellow peach is not comprehensive. This study analyzed the role of CA on the quality of shelf period, phenolic content and antioxidant activity of “Jinxiu” yellow peach. Yellow peach was left under specific aeration conditions (3.5–4% CO2, 2–3% O2, 92–95.5% N2, 1 ± 0.5 °C) and the control (1 ± 0.5 °C) for 21 d, to observe changes in physiological parameters of the fruit during 10 d of the shelf life (25 ± 1 °C). The result showed that CA reduced the weight loss rate (WLR), decay rate (DR), and browning index (BI) of yellow peaches. Furthermore, the CA held a high level of total flavonoid content (TFC), total phenol content (TPC) and phenolic content in the fruit. Antioxidant analysis showed that polyphenol oxidase (PPO) enzyme activity was lower and free radical scavenging capacity (DPPH, ABTS, and FRAP) and antioxidant enzyme activities (POD and PAL) were higher in the CA group. Combining the results of significance analysis, correlation analysis, principal component analysis (PCA) and hierarchical cluster analysis (HCA) clearly identified the differences between the CA group and the control group. The results showed that the CA could maintain higher phenolic content and reduce the oxidation of yellow peach fruit and enhance fruit quality by affecting the antioxidant activities of yellow peach.

1. Introduction

Peach (Prunus persica Batsch.) is a drupe-like fruit that grows mainly in temperate and subtropical regions [1]. China is one of the major peach producers in the world. There are three types of peaches: red, white, and yellow peach [2]. Among them, yellow peaches have received more attention from consumers because of their unique organoleptic properties and high nutritional value [3]. However, the high metabolism and high decay rate limit the market circulation of yellow peach. Cold storage is the most frequent method to delay the deterioration of peach fruit, while long-term cold storage (below 8 °C) leads to chilling injuries (CI) such as internal browning, flesh leatheriness, and loss of sensory-related compounds [4,5]. Therefore, it is imperative to choose a suitable postharvest preservation method to maintain the quality of yellow peaches and inhibit the occurrence of CI.
Controlled atmosphere (CA) [6,7] has shown the potential to reduce the cold sensitivity of most tropical fruits [8,9,10] and extend the shelf life of many horticultural crops [11,12]. Jeremy et al. reported that CA conditions of 2% O2, 2% CO2, and 5 °C maintained fruit appearance and retarded mid-fruit decay in avocados [13]. Similarly, E Paulsen et al. showed that modified atmosphere packaging (MAP) storage extended the shelf life and improved the sensory quality of cherry tomatoes [14]. These beneficial effects obtained by CA were achieved by reducing oxygen levels and inhibiting metabolism [15]. SE Youssef et al. showed that CA with 2% O2 and 15% CO2 controlled reduced the incidence and severity of peach decay [16]. However, the mechanisms driving the extension of the shelf life of peaches and improving the shelf-life quality have not been clearly elucidated [17].
Phenols are important secondary metabolites of peach fruit that play a role in reactive oxygen species detoxification, disease response, and defense effects [18]. The antioxidant and ROS scavenging abilities of bioactive substances confer disease resistance to peach fruit [19]. However, these compounds are gradually lost during postharvest storage by oxygen and polyphenol oxidase. CA significantly reduced the loss of phenolic compounds and antioxidant capacity in lychee [20], apple [21], and goji berry [22]. However, few studies have been conducted on the effect of CA-treated peach fruit on phenolic substances during the shelf life.
This study investigated the bioactive substance content, antioxidant capacity, and some important quality indicators such as weight loss rate (WLR), decay rate (DR), browning index (BI), firmness and color difference of CA-treated yellow peach on 0, 2, 4, 6, 8, and 10 d of the shelf life. Finally, this work used significance analysis, correlation analysis, principal component analysis (PCA), and hierarchical cluster analysis (HCA) to fully understand the changes in bioactive substances, antioxidant capacity, and postharvest quality of yellow peach during the shelf life and their interrelationships.

2. Materials and Methods

2.1. Plant Material and Controlled Atmosphere (CA) Treatment

Yellow peach (“Jinxiu”) was purchased from a fruit store in Changsha, Hunan Province, in August 2021 and immediately transferred to the cold storage of the Hunan Academy of Agricultural Sciences. Fruits with defects such as mechanical damage, black spots, pests, and diseases were excluded, and 300 selected yellow peach fruits were divided into two groups and placed in air and 3.5–4% CO2, 2–3% O2, and 92–95.5% N2 atmospheres, respectively. Samples were placed at 1 ± 0.5 °C for 21 d and then transferred to a shelf environment (25 ± 1 °C), where WLR, DR, BI, firmness, and color difference were investigated every other day during the shelf life. The fruits were also rapidly frozen with liquid nitrogen and stored at 80 °C for the rest of the index analysis. In the experiment, three replicates were analyzed.

2.2. Assay of Weight Loss Rate (WLR)

WLR of the fruit is measured by the following equation
Weight   loss   rate   % = IFW FFW FFW × 100
The initial fruit weight is represented by IFW, and the final fruit weight is represented by FFW. WLR was assessed using a total of 10 fruits per replicate.

2.3. Assay of Browning Index (BI)

Based on the brown area on the surface of the fruit, the fruit was tested for four levels of decay, namely [23], Class 0, browning area = 0%; Class 1, 1% < browning area ≤ 25%; Class 2, 26% < browning area ≤ 50%; Class 3, 51% < browning area ≤ 75%; Class 4, 76% < browning area ≤ 1. The BI is obtained as follows:
Browning   index   % = Σ Browning   grade   × number   of   fruit 4 × total   number   of   fruit   in   treatment  

2.4. Assay of Firmness

Six neatly shaped (spherical) yellow peaches of uniform size (250 ± 15 g) from both the control and the CA group were used for the determination of firmness. The sample firmness was obtained by the CT3 food texture analyzer with a 5 mm diameter cylindrical probe at a rate of 1 mm·s−1. All experiments were performed with 1 cm from the equatorial line of each sample, the maximum force during penetration is read and the unit was expressed as grams (g).

2.5. Assay of the Decay Rate (DR)

Fruits were assessed for visible decay and the number of fruits with a decayed surface area exceeding 1 cm2 was recorded as the number of bad samples. The DR is measured by equal percentage.
  The   decay   rate   % = Number   of   bad   fruits Total   number   of   fruits  

2.6. Assay of Color

The color attributes were tested at three points of the equatorial position by the colorimeter and were expressed as brightness L *, a *, and b *. The measurement is repeated three times for each color parameter and results were expressed as mean value.
The total chromatic difference (∆E) is calculated using Formula (4). Based on the different degrees of yellow peach color, the ∆E is divided into three levels [24], 0.0 < ∆E ≤ 2.0 corresponds to Class 0, representing color difference is almost invisible to human vision; 2.0 < ∆E ≤ 3.5 corresponds to Class 1, which means that most people cannot identify color difference and professionally trained people can identify it; 3.5 < ∆E corresponds to Class 2, representing color difference can be distinguished. The ∆E is obtained as follows:
  The E = L 1 * L 0 * 2 + a 1 * a 0 * 2 + b 1 * b 0 * 2
In the formula, where L0*, a0*, and b0* are the color coordinates of the reference sample (the yellow peach before treatment), and L1*, a1*, and b1* are the color coordinates of the yellow peach during the shelf life.

2.7. Assay of DPPH, ABTS and FRAP Scavenging Activity

The DPPH (2,2-diphenyl-1-picrylhydrazyl) was recorded by spectrophotometer based on previous method [25]. Yellow peach samples (5.0 g) were ground with 25 mL 80% (v·v−1) ethanol and centrifuged for 30 min (4 °C, 16,000 rpm), then the upper clear liquid was extracted for analysis. The mixture was treated in the dark at 26 °C for 35 min and the photometric value at 517 nm was recorded, The DPPH was measured by the equation.
DPPH   radical   scavenging   activity   % = A 0 A 1 A 0 × 100
The ABTS (2,2′-azino-bis(3-ethylbenzthiazoline-6-sulphoic acid)) test was performed with reference to the method of VEGARA S et al. [26]. The working fluid was provided by pouring 2.45 mmol L−1 potassium persulfate and 7 mmol L−1 stock solution containing 20 mmol·L−1 acetate buffer (pH 4.5) in equal quantity and incubated at 37 °C for 18 h. The 3.6 mL of ABTS working solution and 0.4 mL of sample extraction solution or standard was mixed in an assay tube and reacted for 30 min protected from light and measured at 510 nm. The ABTS radical scavenging rate was obtained as the formula:
ABTS   radical   scavenging   activity   % = A 0 A 1 A 0 × 100
The FRAP (ferric ion reducing antioxidant power) assay was measured according to the method established in the literature [27]. The TPTZ working solution was obtained by adding 25 mL acetate buffer (pH 3.6), 2.5 mL 10 mmol·L−1 TPTZ solution, and 2.5 mL 20 mmol·L−1 FeCl3. An amount of 100 μL supernatant was added to 4 mL of the TPTZ working solution, The mixed fluid was maintained at 37 °C for 10 min and the optical density value at 593 (OD593) was determined.
FRAP   radical   scavenging   activity   % = A 0 A 1 A 0 × 100
In Equations (5)–(7), where A0 is the absorbance value of the fruit sample, and A1 is the absorbance value of the blank fruit.

2.8. Assay of Phenylalanine-Catalase Activity (PAL)

The PAL activity was analyzed through the approach by MAROGA et al. [28]. The enzyme reaction system consisted of 0.1 mL of enzyme substance, 16 mmol·L−1 phenylalanine, 3.6 mmol L−1 NaCl, 50 mmol·L−1 Tris-HCI (pH 8.8), and 980 μL of 6 mol·L−1 hydrochloric acid. The 6 mmol L−1 hydrochloric acid was used as a control tube. Each gram of sample tissue in each milliliter of the reaction system causes a change in the photometric value at 290 nm of 0.1 per minute as one unit of enzyme activity.

2.9. Assay of Polyphenol Oxidase Activity (PPO)

The PPO activity was measured with the method of Shi et al. [29]. The enzyme was extracted from 4% polyvinylpyrrolidone (PVPP) and acetate-sodium acetate buffer (pH 5.9). The enzyme reaction system contained enzyme extract, 0.05 mmol·L−1 (pH 5.9) phosphate buffer, and 0.1 mol·L−1 catechol solution. Boiled sample and 20% trichloroacetic acid were used as controls. The difference of 0.01 per minute between the OD525 values of the two tubes was considered as one unit of enzyme activity.

2.10. Assay of Peroxidase Activity (POD)

The activity of POD was measured as used by Li et al. [30]. The enzyme reaction system consisted of 20 mmol·L−1 KH2PO4, 100 mmol·L−1 phosphate buffer solution (pH 6.0), guaiacol, and 19 μL 30% hydrogen peroxide, and then the absorbance value of the reaction mixture was measured at 470 nm, and the amount of enzyme required to cause a 0.01 change in the 0D470 value in one minute was defined as one unit of POD activity.

2.11. Assay of Total Flavonoid Content (TFC)

The TFC estimates refer to the method used by XIE Y et al. [31]. The samples were extracted with 80% ethanol. The OD510 was measured, and the results were expressed as mg Rutin equivalent per gram of fresh weight.

2.12. Assay of Total Phenolic Content (TPC)

The assay of TPC was carried out using the method of RADUNIC M et al. [32]. Total phenolic was extracted using 80% ethanol solution, the OD765 was measured after 60 min of reaction at room temperature. The TPC was expressed as gallic acid equivalents (mg·g−1 FW) per gram of fresh fruit weight.

2.13. Assay of Phenolic Acids Content

The determination of phenolic acids was performed with some modifications based on Tounsi et al. [33]. Phenolic acids in the samples were extracted with 1% ethanolic acid solution and filtered through a microporous membrane (0.22 μm). The characterization and quantification of phenolic acids were performed on a Shimadzu HPLC system (LC-10AT) using a C18 column (4.6 mm × 250 mm, 5 µm) at a rate of 1.0 mL min−1, and the column temperature was set at 40 °C. The mobile phases A and B were chromatographic grade acetonitrile and chromatographic grade 4% acetic acid. Sample (10 μL) was eluted in a gradient for 39 min, 0–28 min, 0–10% A; 28–29 min, 10–45% A; 29–39 min, 45–90% A. The detection wavelength of PDA was set at 280 nm and 520 nm. The concentration of phenolic acids was expressed in µg·g−1.

2.14. Statistical Analysis

All data reflected as mean ± standard error (SE) of three bio-repeats. The data obtained from the experiment were parsed by PCA and HCA. ANOVA was performed using Statistical Product Service Solutions (SPSS) (version 26) from IBM (Chicago), p-value not greater than 0.05 were regarded as a significant difference.

3. Results

3.1. Color

Color is one of the important indicators to characterize the change in the freshness of fresh fruits. The sensory quality attributes of yellow peach continued to decrease during the shelf life. The changing trend of color parameters of CA and the control group was similar, mainly showing a decrease in L* values (Figure 1A) and a continuous increase in a* values (Figure 1B), b* values (Figure 1C), and ∆E (Figure 1D). The L* values of the CA group increased by 9.5% (p < 0.05) compared with that of the control at 10 d, and a* and b* of the treatment group increased by 150% and 17.68% (p < 0.05), respectively, compared to that of the control at 4 d, and the ∆E of the treatment group decreased by 26.45% (p < 0.05) compared with that of the control group at 10 d which indicated that CA significantly delayed the color change in yellow peach.

3.2. Browning Index (BI)

The BI gradually increased with the extension of the shelf life of yellow peach (Figure 2A). The BI of the treatment fruit varied slightly from 0 d to 2 d, and then rapidly rise from 2 d to 4 d. The BI of the control and the treatment were 12.5% and 5.21%, respectively, at 6 d (p < 0.05). The BI of the CA treatment was 62.5% less than that of the control at 10 d. The results showed that CA significantly delayed fruit browning during the shelf life.

3.3. Firmness

Firmness is one of the representative indicators reflecting the quality of the fruit [34]. The firmness of the control and the CA treatment was significantly lower than the initial value of 59.24% (p < 0.05) and 18.77% (p < 0.05) at 4 d, respectively (Figure 2B). The firmness of the CA treatment was 69% higher than that of the control at 10 d of shelf life. It indicated that the treatment group significantly reduced the decrease in the firmness of yellow peach.

3.4. The Decay Rate (DR)

The DR of fruit in the treatment group was significantly lower than that of the control (p < 0.05) (Figure 2C). The DR of the control and the CA treatment was 22.92% and 6.25% (p < 0.05), respectively, at 6 d, and the CA treatment decreased by 72.73% compared to that of the control (p < 0.05) at 6 d. The difference between the two groups was greatest at 10 d, with a 60% decrease in the DR in the CA treatment compared to that of the control.

3.5. The Weight Loss Rate (WLR)

The WLR of both groups increased rapidly during the shelf life (Figure 2D). The WLR of the control and the CA treatment was 1.04% and 0.63%, respectively, at 2 d, and the two groups were statistically significant (p < 0.05). The WLR of the CA treatment showed a 41.94% reduction compared to that of the control at 10 d (p < 0.05).

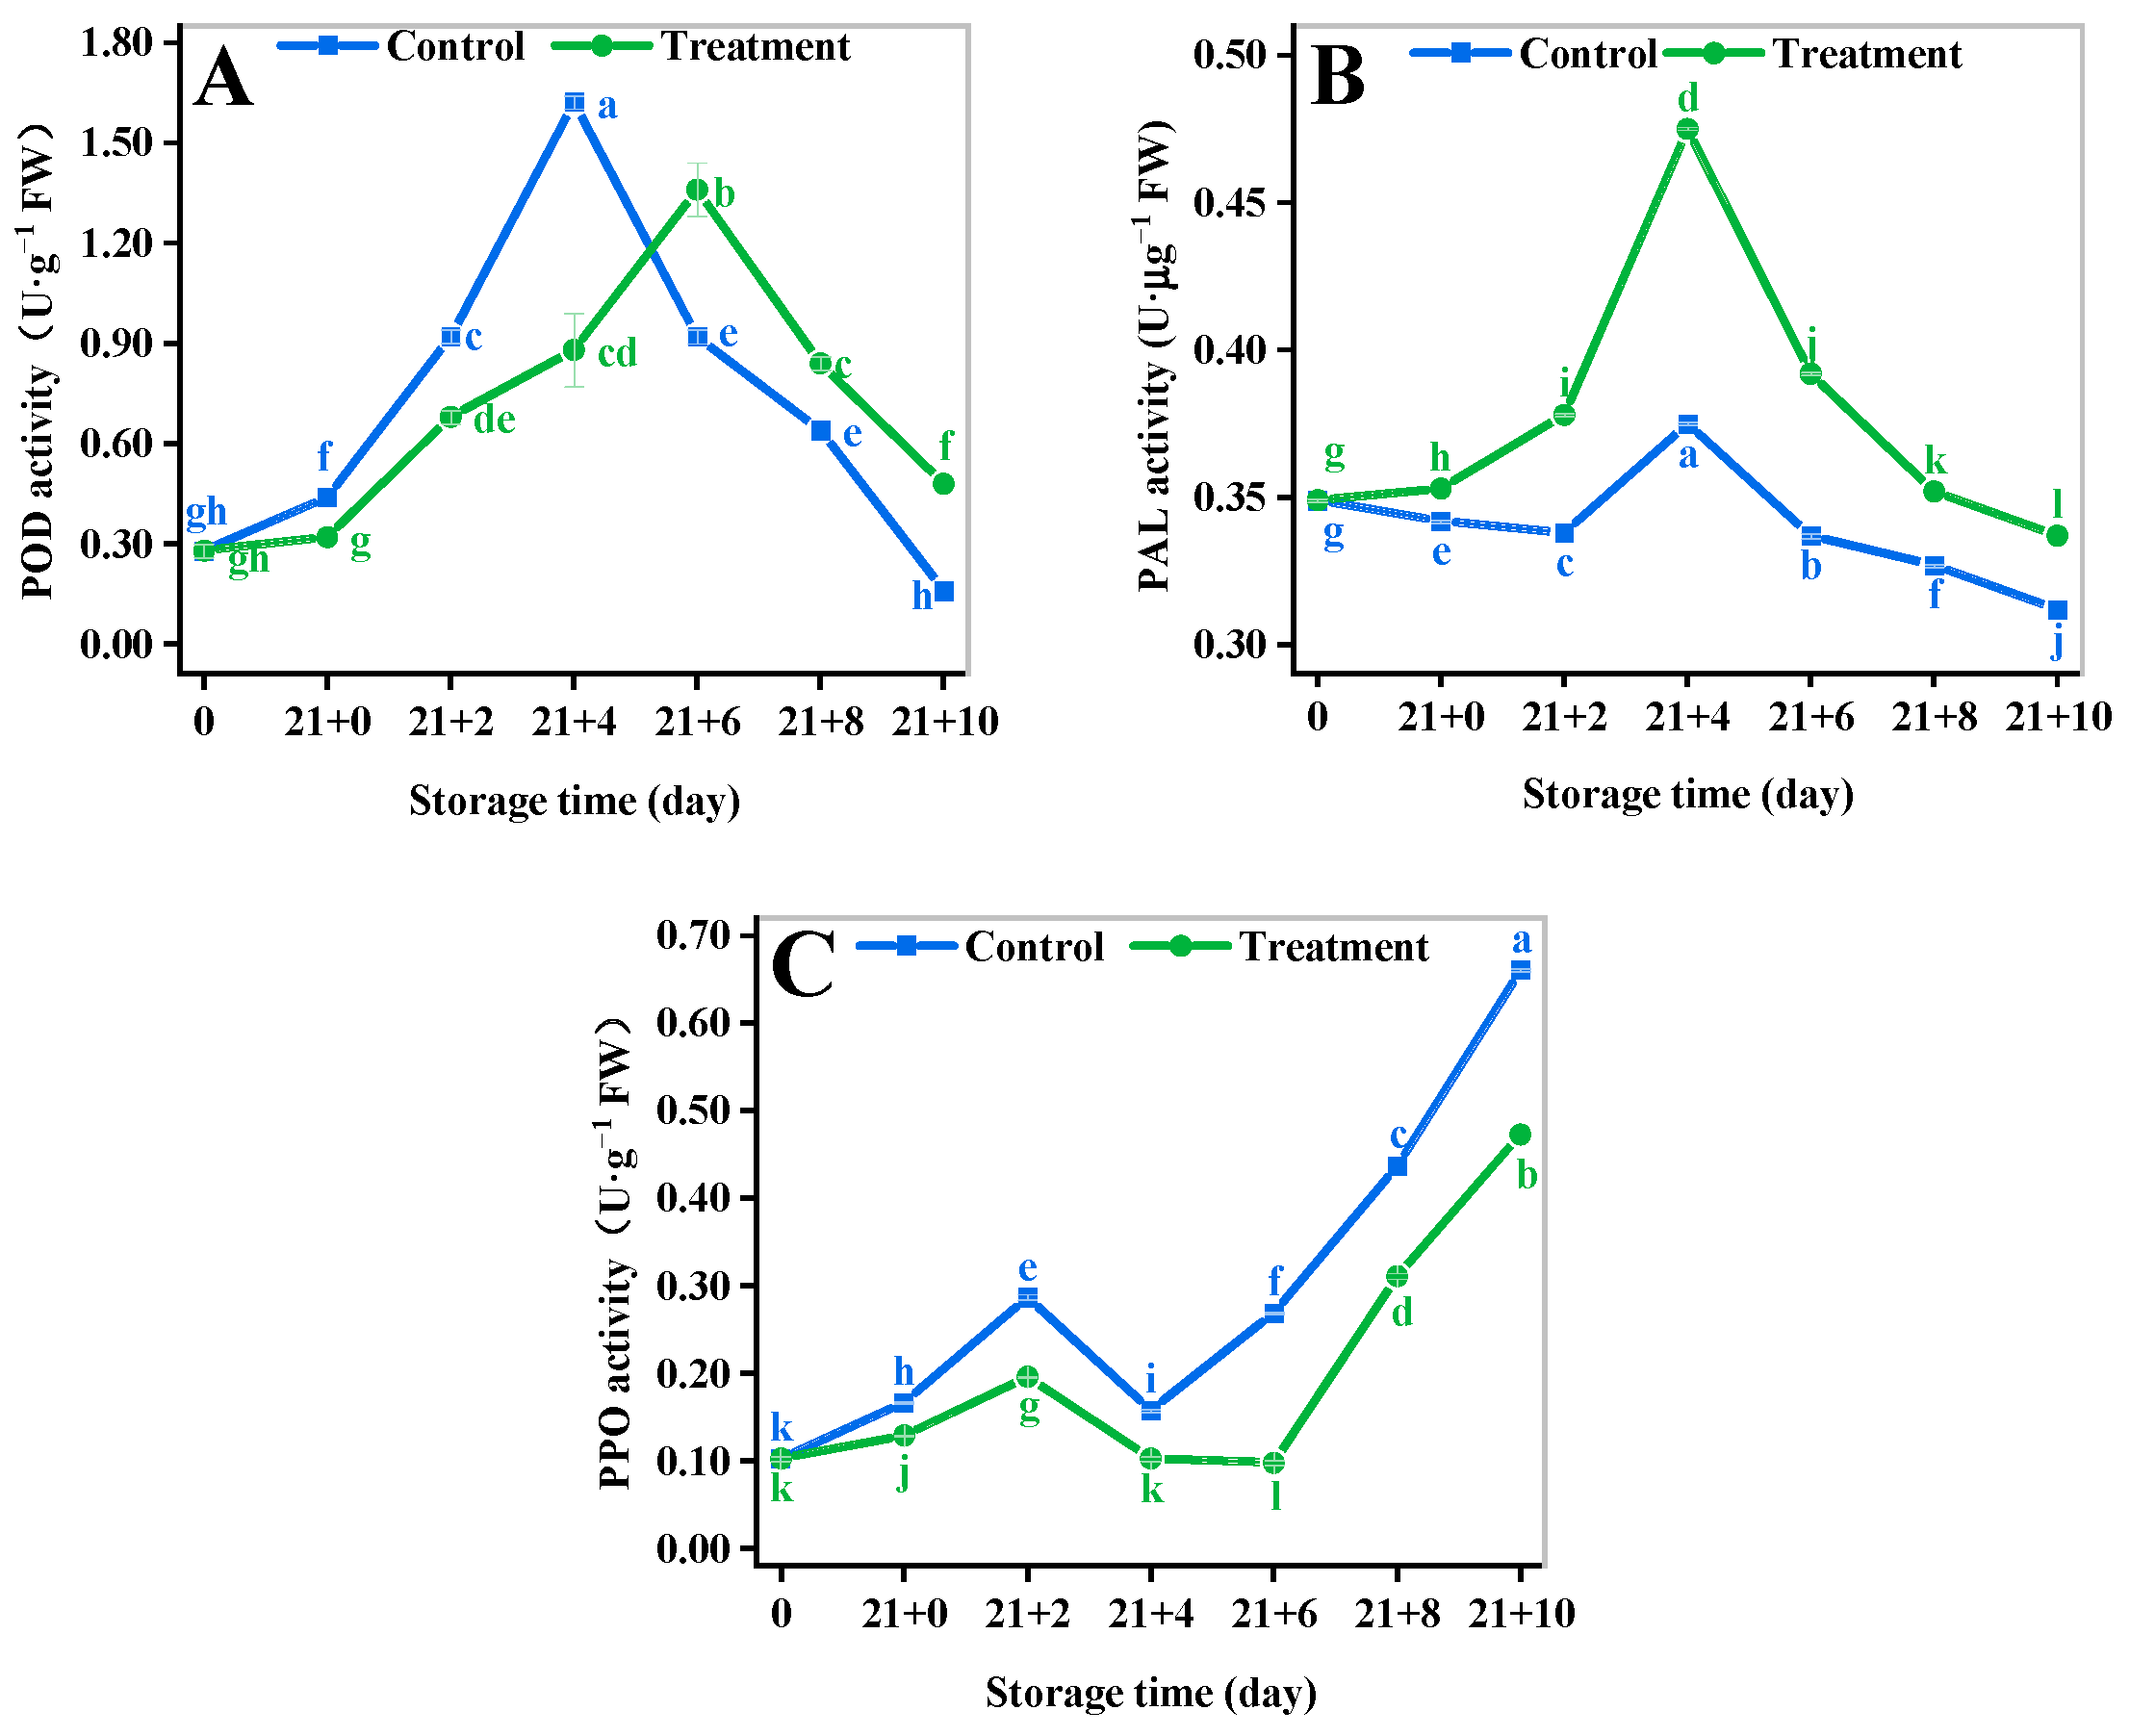
3.6. Browning-Related Enzymes

The POD activity of the fruit showed an increasing and then decreasing trend (Figure 3A). The POD activity of the CA treatment and the control reached a peak at 4 d and 6 d, respectively. The POD activity of the CA treatment increased by 200% to that of the control at 10 d. It indicated that the treatment group maintained a stronger level of POD activity during the shelf life.
The PAL activity in both two groups showed a slight increase at the beginning and peaked at 4 d (Figure 3B). The PAL activity of CA treatment increased by 26.5% compared to that of the control at 4 d (p < 0.05). The PAL activity of CA treatment increased by 8.01% than that of the control at 10 d (p < 0.05). The PAL activity of the treatment group was higher than that of the control group throughout the shelf-life period.
The trends of PPO activity in the two groups during the shelf life were the same and the PPO activity of the CA treatment was always statistically significantly lower than that of the control (Figure 3C). The minimum value of PPO in the CA treatment was reduced by 35.09% compared to that of the control (p < 0.05). The PPO of CA treatment was reduced by 28.28% compared to that of the control at 10 d of the shelf life (p < 0.05). It indicated that CA plays an important role in reducing the incidence of browning by inhibiting PPO activity.

3.7. Total Phenolic Content (TPC)

Phenol is a key indicator of fruits and vegetables, and it provides high antioxidant potential [35]. The TPC of the control and the CA treatment reached the peak at 4 d and 6 d, respectively, and the TPC of the control decreased faster than that of the CA-treated in the late shelf life (Figure 4A). The TPC of the CA treatment was 11.58% higher than that of the control at 10 d, and the difference was statistically significant (p < 0.05).

3.8. Total Flavonoid Content (TFC)

The trend of the TFC change is similar to that of the TPC, which presented a fluctuation of increasing and then decreasing (Figure 4B). The TFC in CA treatment first increased and reached the maximum level at 6 d, when the TFC of the treatment group was significantly higher than that of the control, and then began to decline, and the TFC in the CA treatment was 8.98% higher than that of the control at 10 d. The results showed that the CA could significantly inhibit the decrease in the TFC.

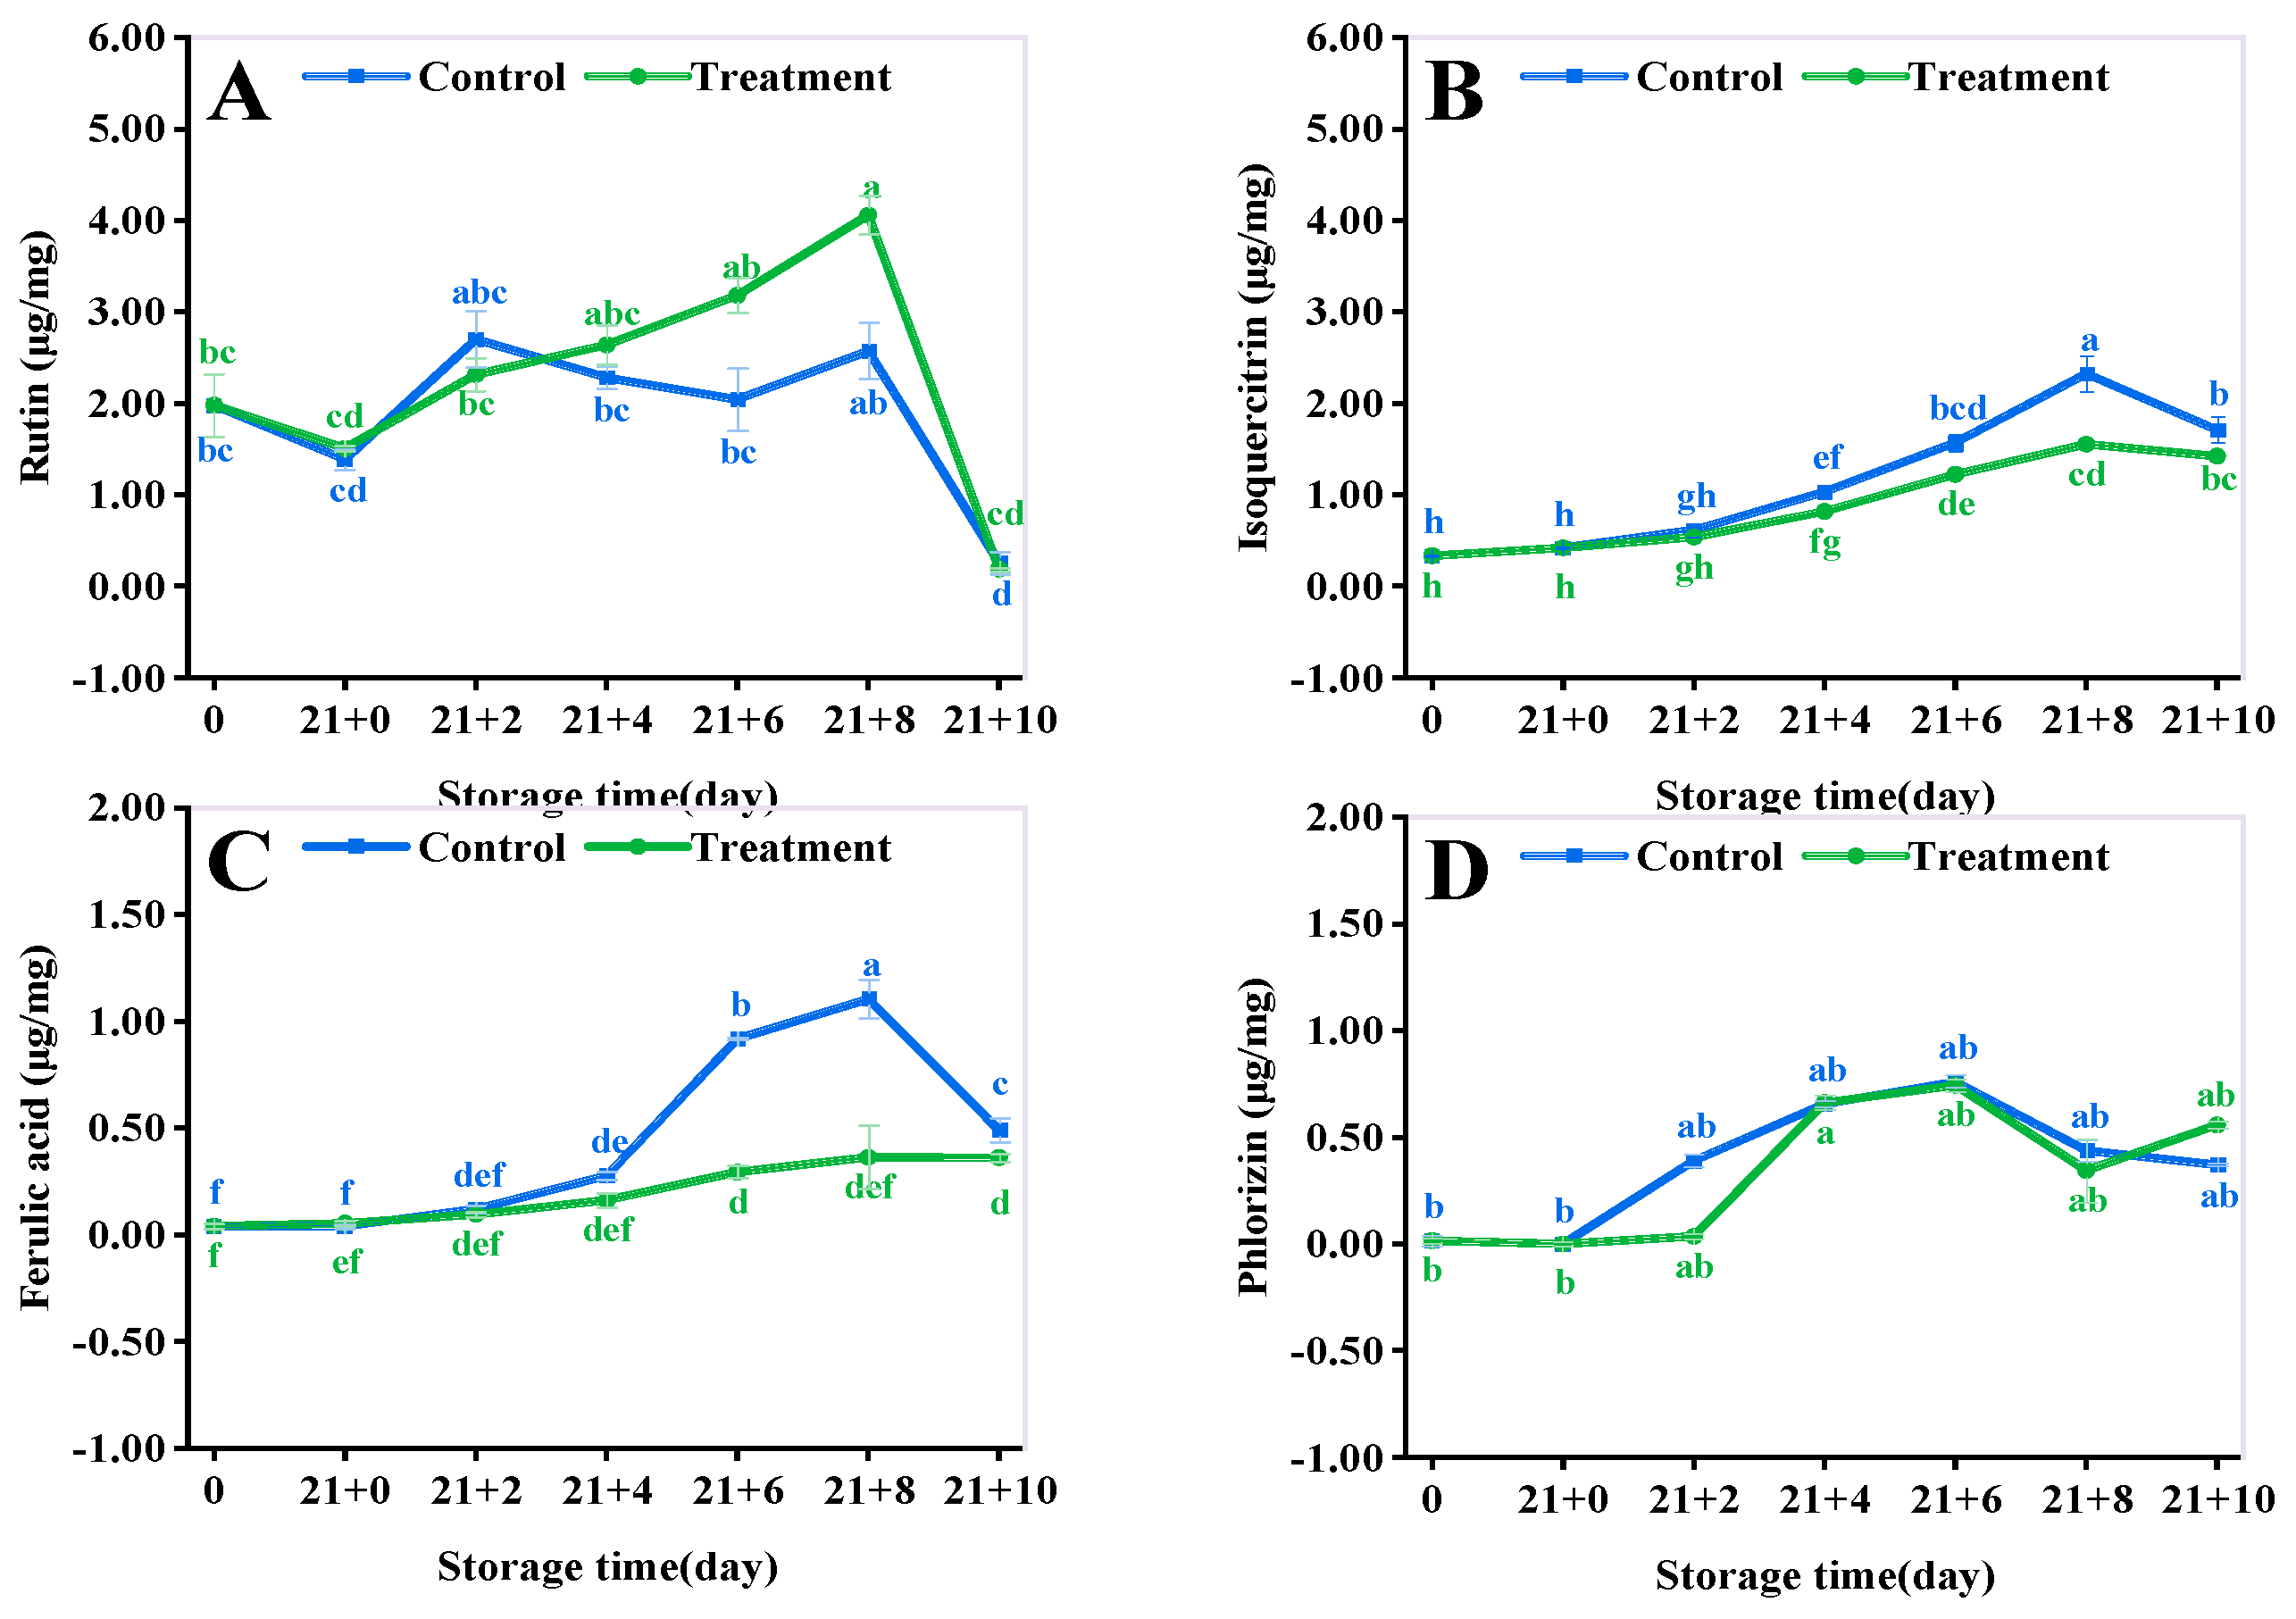
3.9. Phenolic Acid Content

The changes in eight phenolic acids including catechin (Figure 5A), neochlorogenic acid (Figure 5B), chlorogenic acid (Figure 5C), vanillic acid (Figure 5D), rutin (Figure 6A), isoquercitrin (Figure 6B), ferulic acid (Figure 6C) and phlorizin (Figure 6D) in yellow peaches were analyzed during the shelf life. The total phenolic acids were significantly increased in the treated group compared to those of the control group (p < 0.05). The phenolic acids in yellow peach were mainly neochlorogenic acid, catechin, and chlorogenic acid, which accounted for about 84.48% of the total phenolic acids. The content of catechin, neochlorogenic acid, and chlorogenic acid increased by 71.95%, 110.59%, and 71.95% compared with that of the CA treatment at 10 d (p < 0.05). While vanillic acid, rutin, and isoquercitrin of the control group were less abundant and did not change significantly compared with those of the CA treatment (p > 0.05). In addition, the content of ferulic acid in the CA treatment was lower than that in the control. The content of root bark glycosides was higher than that in the control in the early stage, while it was not much different from that in the middle and late stages. The results showed that the phenolic acid content in the CA treatment was consistently higher than that in the control during the shelf life.

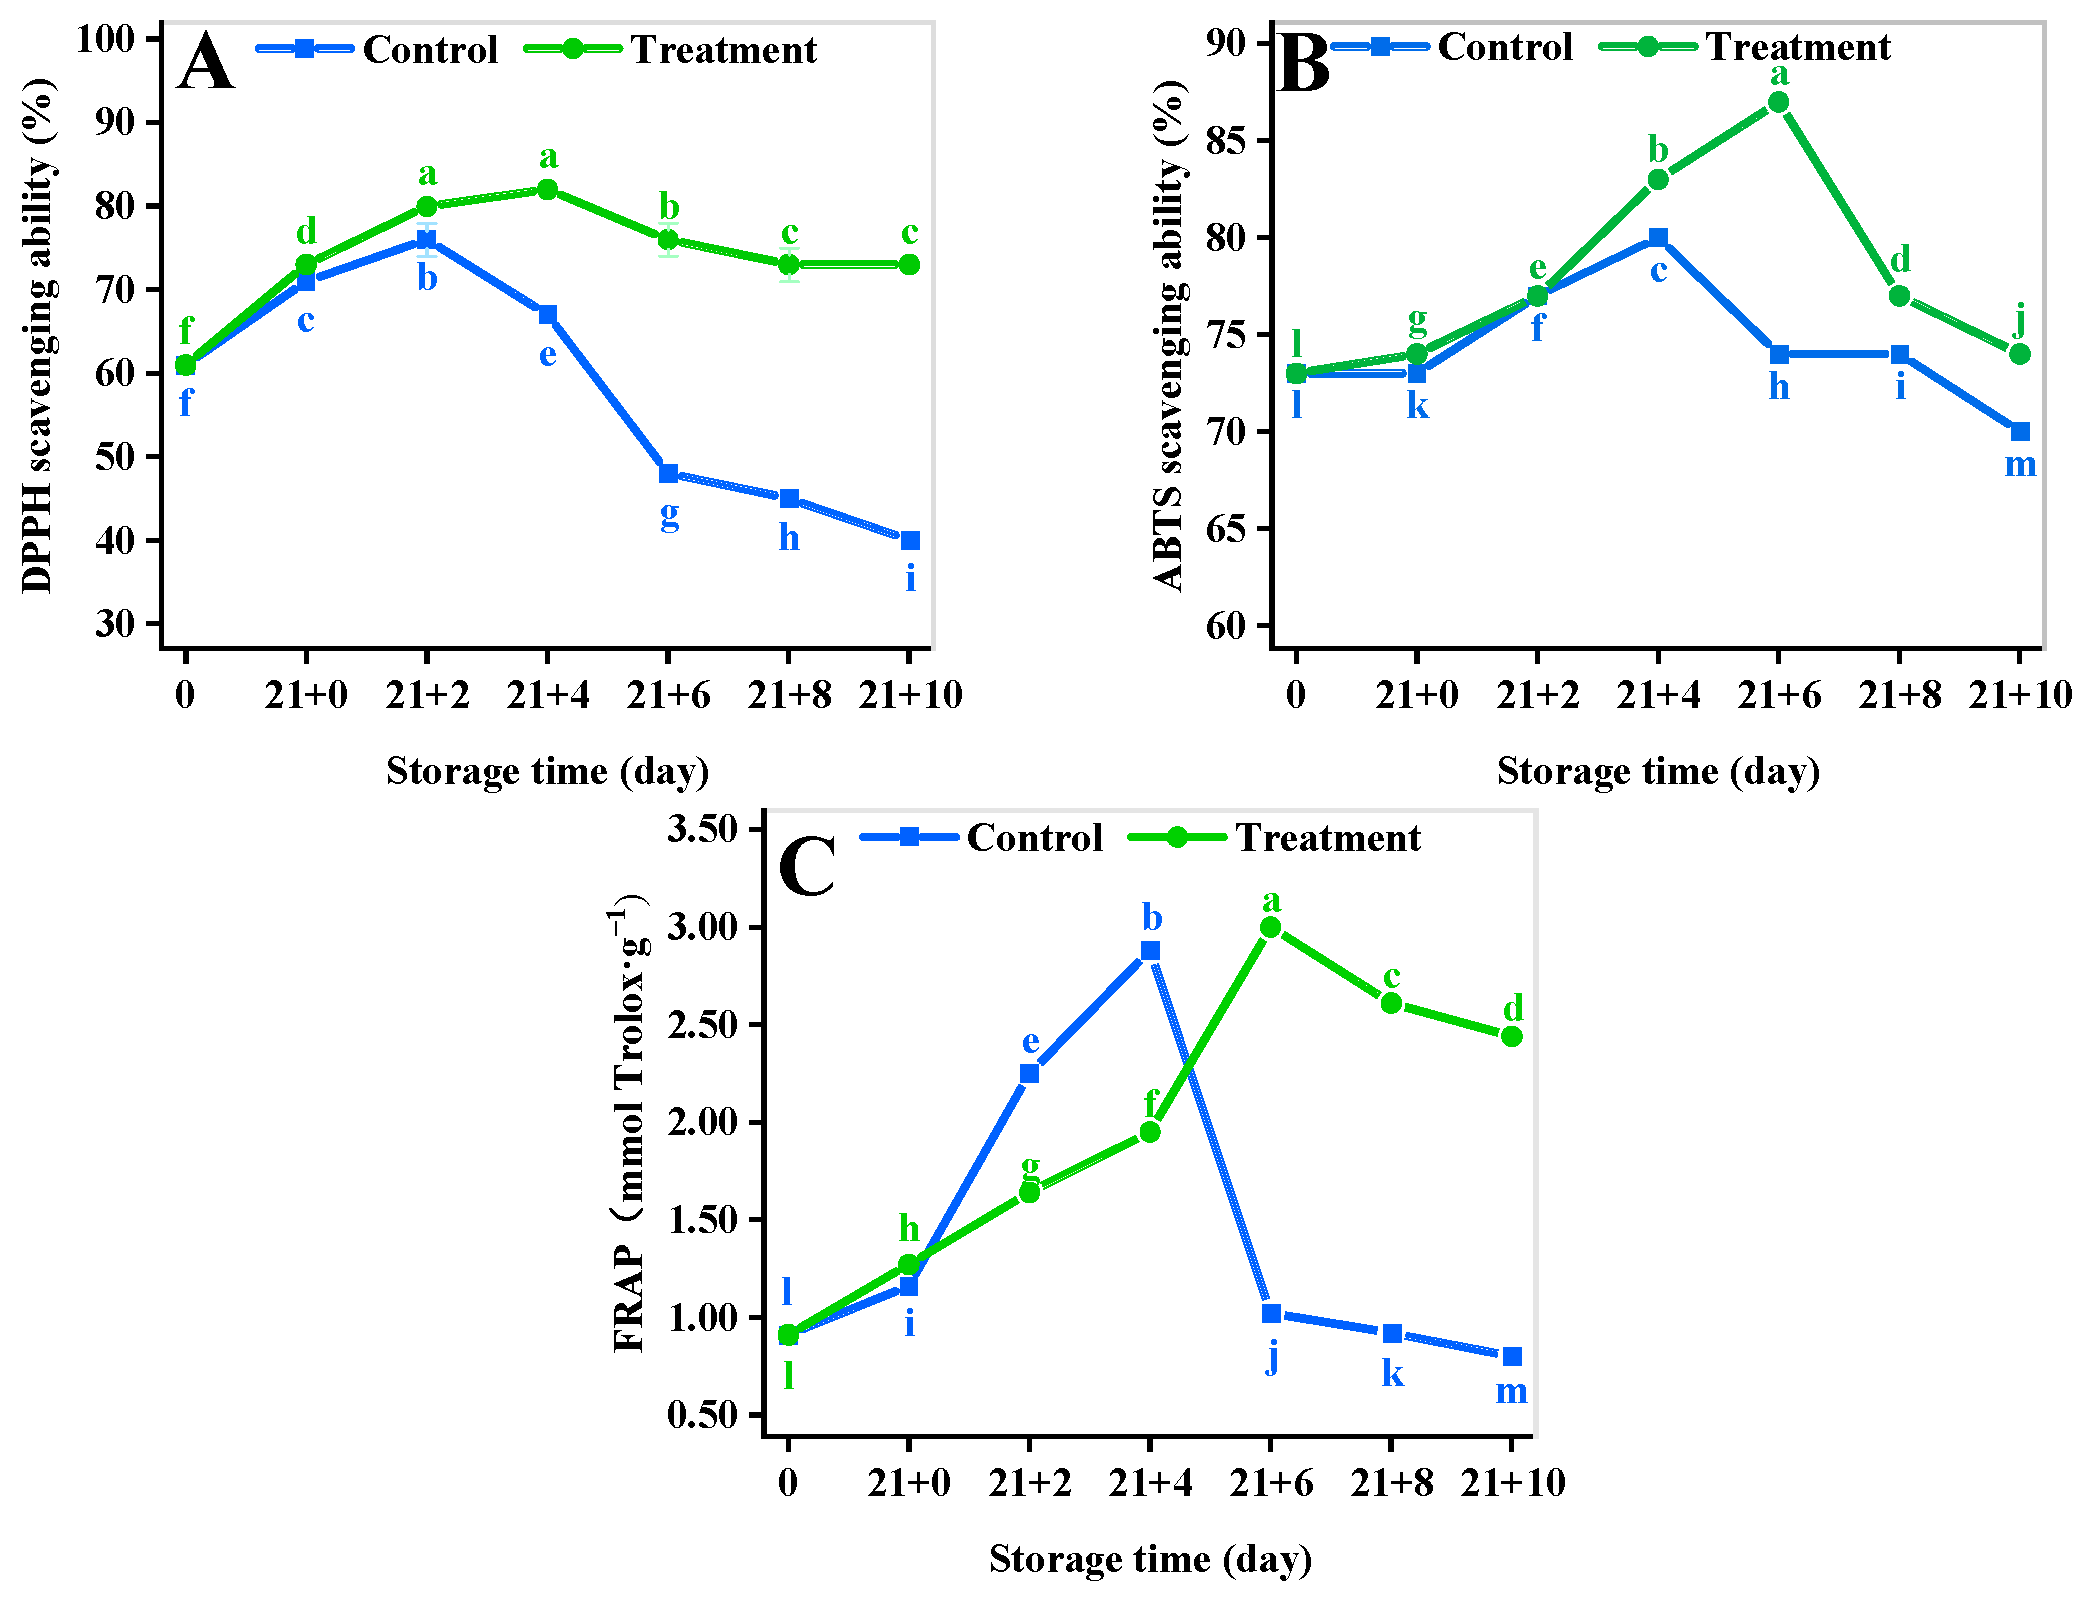
3.10. Antioxidant Activity Assay

The DPPH, ABTS, and FRAP radical scavenging rate of fruits and vegetables is mainly used for antioxidant evaluation [36] and reflects the trend of their resistance to adversity stress. As shown in Figure 7A, the DPPH free radical scavenging rate of the treatment group was always significantly higher than that of the control (p < 0.05). The DPPH radical scavenging rate of the CA treatment increased by 80.86% compared with that of the control (p < 0.05) at 10 d of the shelf life.
The ABTS showed an increasing trend during the shelf life (Figure 7B), with the control reaching a maximum value of 80.12% at 4 d, which significantly decreased to 70.34% at 10 d (p < 0.05). The CA treatment delayed the peak by 86.79% until 6 d. The ABTS decreased to 73.54% at 10 d of the shelf life, which was 4.55% greater than that of the control (p < 0.05).
The FRAP radical scavenging capacity of both groups showed a rise followed by a decline (Figure 7C). The FRAP maximum of the CA treatment increased by 15.38% compared to that of the control at 4 d. The FRAP value in the CA treatment increased by 203.82% compared to that of the control at 10 d of the shelf life (p < 0.05).

3.11. Correlation Analysis

The Pearson correlation method [37] was used to investigate the relationship between the quality indicators of yellow peach treated with CA during the shelf life (Figure 8). The WLR showed a significant positive correlation with PPO enzyme (r2 = 0.874) and BI (r2 = 0.700) and a highly significant negative correlation with fruit firmness (r2 = −0.931). This suggested that PPO enzymes were influenced by water loss rate (WLR) in fruit [38]. It is supported that water stress caused by water loss led to disruption of cell membrane structure [39]; damage to cell membrane structure is the direct cause of fruit browning [40]. The negative correlation between fruit weight loss and PAL and POD enzymes was not significant, indicating that PAL and POD enzymes are influential factors rather than determinants of fruit browning [41]. The WLR was positively correlated with a * (r2 = 0.886) and b * (r2 = 0.948) and significantly negatively correlated with L *(r2 = −0.976). This supported our previous discussion that increased WLR accelerated the flesh browning and eventually led to the darkening of fruit brightness and the increase in DR [42].
In addition, the DR was negatively correlated with the content of asam vanilat (r2 = 0.551), isoquercitrin (r2 = 0.752), and asam ferulat (r2 = 0.642), indicating that fruit decay was accompanied by the loss of phenolic substances [43]. Total phenol was significantly and positively correlated with ABTS (r2 = 0.580) and FRAP (r2 = 0.739) and total flavonoid with ABTS (r2 = 0.706) and FRAP (r2 = 0.599), but all were insignificantly and positively correlated with DPPH, indicating not only the weak DPPH radical scavenging ability of total phenol and total flavonoid [44], but conferring the fruit stronger ABTS and FRAP value. It also supported our previous discussion that the phenolic content was closely related to the antioxidant capacity of fruits [45].

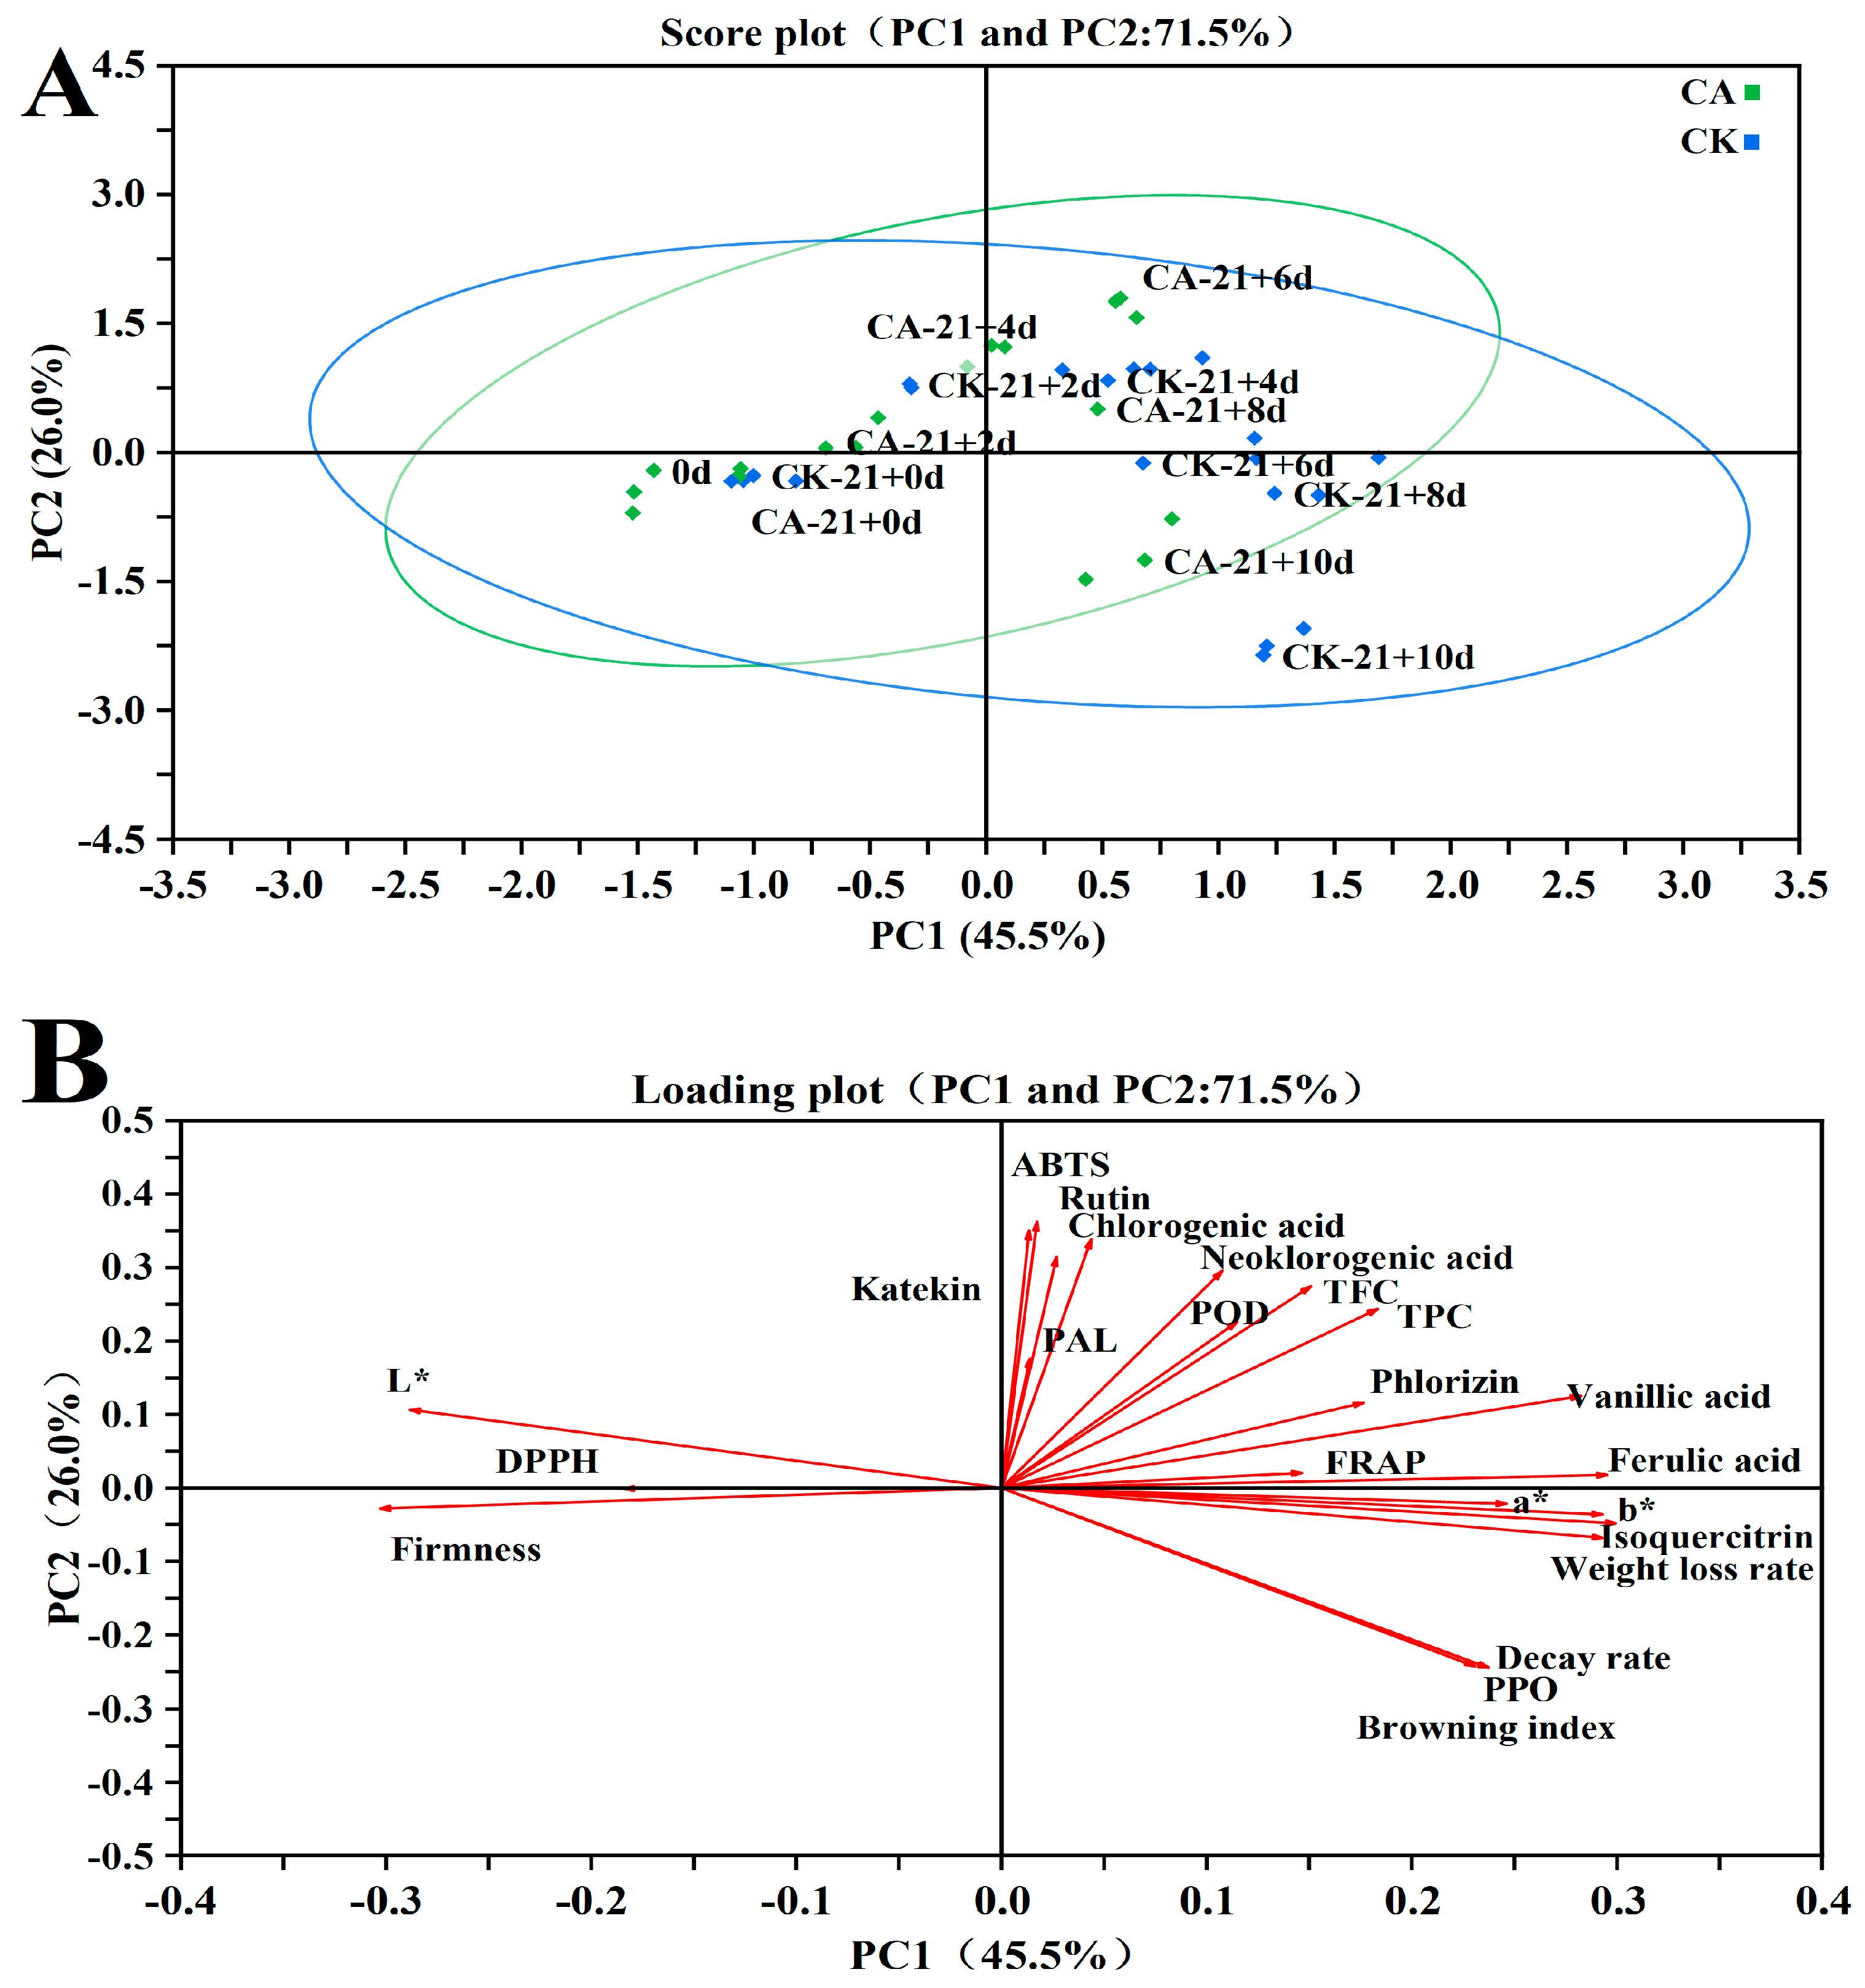
3.12. Principal Component Analysis (PCA)

In order to better compare the parameters for assessing the differences and quality of the shelf life before and after CA, PCA was performed using 23 factors, and the cumulative variance contribution of the first two principal components reached 71.5% (PC1: 45.5% and PC2: 26.0%) (Figure 9A). The following information could be derived from the distribution of 95% confidence ellipses in coordinates for both samples (Figure 9B): (i) the sample points were more clustered within the CA treatment compared to the control, indicating that the CA treatment maintained better quality during the shelf life. (ii) The sample points were independently clustered and had a certain distance between parallel, indicating that the control and the CA treatment could be distinguished from each other at the same time point. Based on the principle of using the eigenvalue >1.0000 as the principal component factor, we can further observe that a total of five principal components were obtained after the dimension reduction of 23 quality indicators by principal component analysis, and the eigenvalues are 10.3074, 5.7969, 2.5247, 1.3025, and 1.0089, respectively. The cumulative variance contribution rate was 91.04%; it indicates that these five principal components cover 91.04% of the total amount of raw data information. As a result, the five main components can be used as comprehensive variables to evaluate the influence of CA on the quality of yellow peach during their shelf life. Combined with the loading plot (Figure 9B), WLR, a* and b* are the main influencing factors of PC1, ABTS, katekin, rutin, asam klorogenat, asam neoklorogenik are the main influencing factors of PC2, the former mainly reflects the maturity of the fruit, while the latter is clearance capacity of free radicals and phenolic acids that mainly reflect the antioxidant capacity of the fruit. The first two principal components cover the physiological and biochemical indicators of the yellow peach samples, so the principal component evaluation of the experiment is scientific and reliable. Furthermore, the variance contribution of PC1 was higher than that of PC2 (45.5% PC1 and 26.0% PC2), so the first principal component characterizing the maturity of fruit during shelf-life quality was more important than the second principal component characterizing fruit antioxidant capacity.

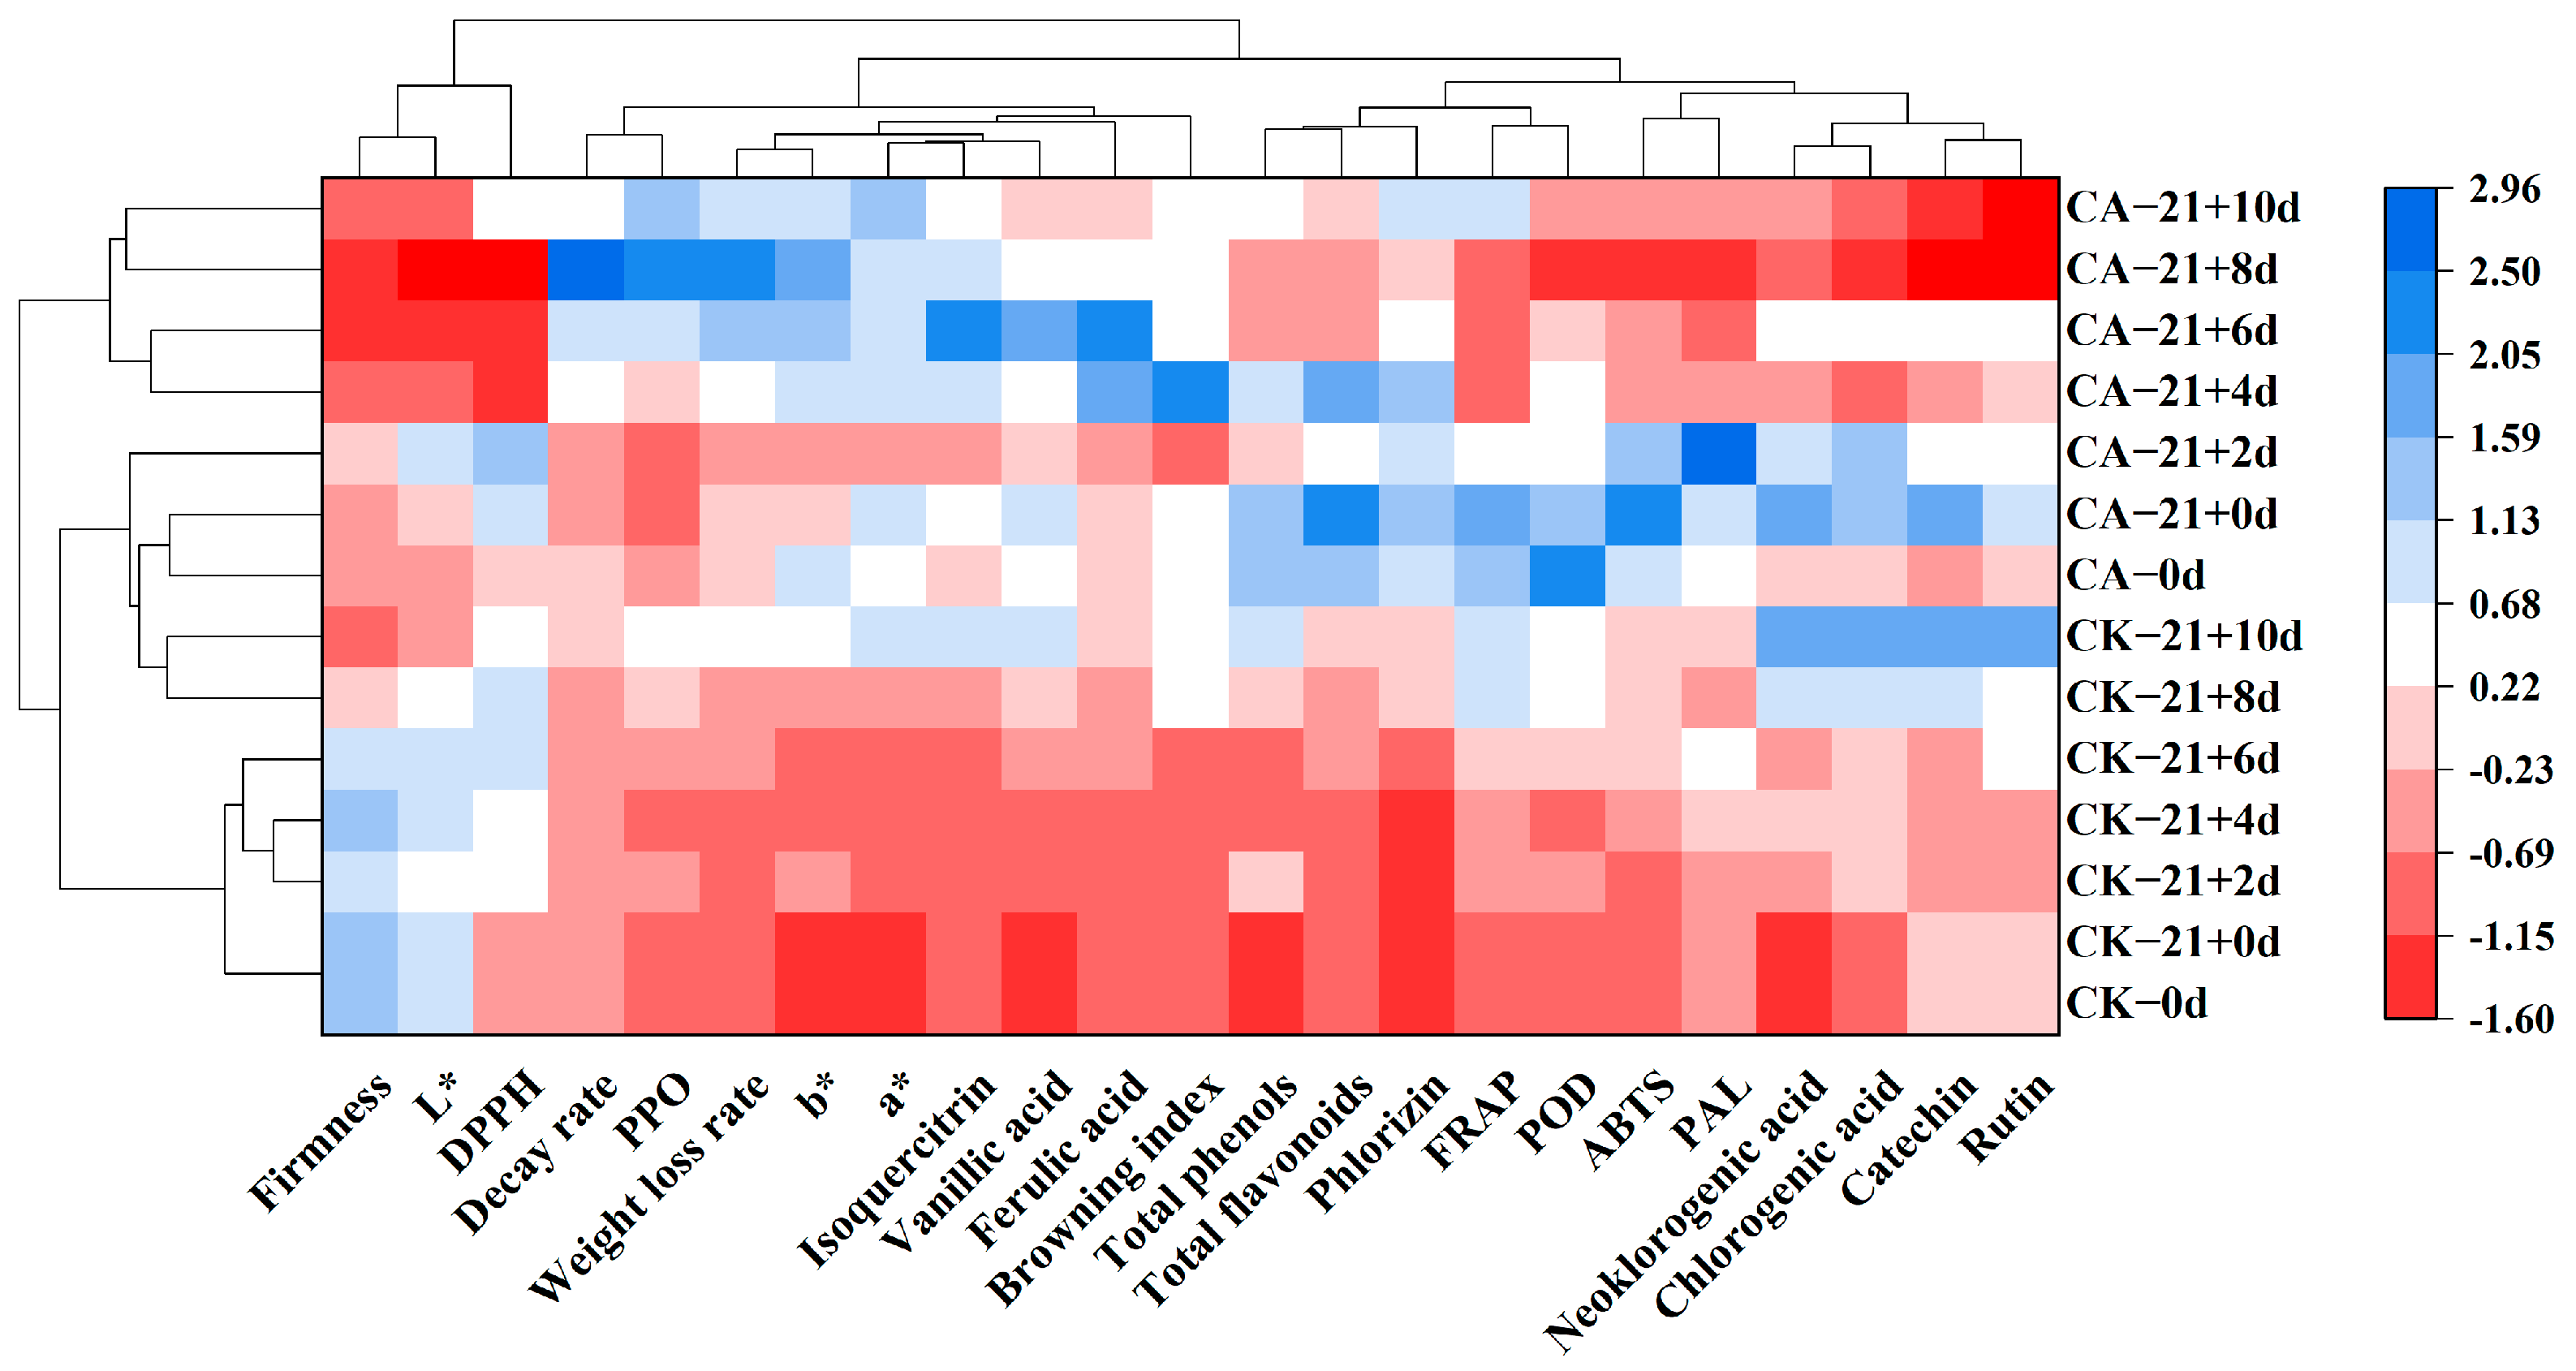
3.13. Hierarchical Clustering Analysis (HCA)

The samples and 23 quality indexes were grouped using HCA in order to visualize the degree of good and bad quality of yellow peach during the shelf life and the trend of the change. From Figure 10, samples 0 d, CK−21 + 0 d, CA−21 + 0 d, and CK−21 + 2 d were clustered into group 1, samples CK−21 + 2 d, CK−21 + 4 d, CA−21 + 6 d and CA−21 + 8 d were clustered into group 2, and CK−21 + 6 d, CK−21 + 8 d, CK−21 + 10 d and CA−21 + 10 d were clustered into group 3. The distribution of color bands showed that there was a significant difference in the quality of the samples before and after CA in the middle and late shelf life, and the quality of the two groups showed the same trend with the extension of the shelf life. For the quality indicators, fruit firmness, L*, and DPPH were clustered into group 1, and the remaining 20 indicators related to fruit nutritional quality and antioxidants were clustered into group 2, which were basically consistent with the PCA results.

4. Discussion

Commercial procedures regulate peach storage technology protocols by improving postharvest storage techniques for yellow peach. In addition, there is currently a growing interest in replacing traditional handling methods with simple, green, and efficient methods [46]. CA is a storage method to preserve freshness by regulating the air component in the environment [47]. It can keep fruits and vegetables in a semi-dormant state, which helps to slow down the aging and deterioration process and achieve the purpose of preserving freshness and corrosion [48]. Previous results in fruits such as mangoes [49] and pears [50] showed that CA delayed the loss of fruit during the shelf life and attributed this to the positive effect of CA on fruit stabilization and maintenance of cellular integrity [51]. Similar results were found in our study, where CA significantly reduced the rate of decay of yellow peach during the shelf life.
Color is a visual indicator of fruit ripeness and reflects the shelf-life quality of fresh fruit [52]. During this experiment, it was observed that CA treatment significantly inhibited the glossy darkening and yellowing of yellow peach fruit, mainly reflected in the ∆E of the control group were higher compared to that of the control group during the shelf life, because the CA treatment reduced the oxygen concentration in the storage environment, which inhibited the color change in the yellow peach. This result is also supported by other studies, for example, James et al. found that CA increased the L* value of pears [53]. Nakano K et al. reported that low O2 in retarding color development was more effective [54]. This is due to the fact that high CO2 inhibited the amount of carotenoid synthesis during fruit ripening [55]. Overall, CA helps to retain the L* values of yellow peach and improves the sudden increase in a*, and b* values during the shelf life.
Water is an indispensable substrate for organisms to carry out metabolic activities [56] and maintain the freshness of fruits and vegetables after harvest [57]. LI et al. reported that fruit softening is closely related to cellular water loss and CA prevented the softening by inhibiting fruit respiration in apples and pears [58,59,60]. Our results also confirmed that short-term CA treatments are effective in reducing the WLR [61] and firmness [62] of fresh yellow peach during the shelf life.
The enzymatic antioxidant system is the main way to control oxidative senescence in fruit. PPO, POD, and PAL are key enzymes that regulated the oxidative browning of fruit [63]. In the present study, CA was able to maintain low PPO activity and high PAL and POD activity in yellow peach for a longer period of time, effectively maintaining the dynamic balance of the reactive oxygen species [64]. On the other hand, the levels of DPPH, ABTS, and FRAP of yellow peach were increased by CA treatment, which further indicated that CA helped to alleviate oxidative browning of yellow peach. Therefore, CA can improve the internal defense capacity and antioxidant level [65] of yellow peach tissue by regulating oxidative browning [66].
In addition, the antioxidant capacity is also related to the accumulation of phenolic compounds, which can evaluate the maturity and determine the antioxidant capacity of fresh fruits and vegetables [67,68]. The main phenolic acids of yellow peach are neochlorogenic acid, catechins, and chlorogenic acid, which bear the non-enzymatic antioxidant activity fraction of the fruit as endogenous antioxidants [67,69], and those are responsible for tolerance to biotic and abiotic stresses [70]. In the present study, the content of TFC and TPC of yellow peach decreased continuously during the shelf life, which was mainly influenced by the oxidation of polyphenols through polyphenol oxidase during fruit ripening [71]. Higher levels of TFC and TPC were maintained in yellow peach by CA at the end of the shelf life, indicating that CA significantly increased the content of TFC and TPC and delayed their loss, thus reducing the damage to the fruit by free radicals. These results are in agreement with previous reports on strawberries [72] and apples [21] as a result of the activation of PAL by CA. These results suggested that CA inhibited the oxidative decomposition of phenolic compounds, which provided yellow peach with an adequate carbon source [73] to induce defense mechanisms, and improved the quality characteristics [74]. In this sense, the previously discussed effect of CA in reducing the incidence of decay during the shelf life of yellow peach can also be interpreted as a response to the effect of CA in enhancing the capacity of antioxidant enzymes, strengthening the cell wall, and promoting the expression of plant defense genes [75].

5. Conclusions

This study highlights the important role of CA on the quality of yellow peach during their shelf life, and CA helps to slow down the ripening and senescence processes. The evidence presented here shows that CA can retain higher color values (L*, a*, b*, and ∆E), firmness, and inhibit the increase in WLR, DR, and BI. In addition, CA provides yellow peach with a higher clearance capacity of free radicals (DPPH, ABTS, and FRAP), and contributes to the accumulation of contents of bioactive components (TPC, TFC, neochlorogenic acid, catechin, and chlorogenic acid). Combined correlation analysis, PCA, and HCA results suggest that CA significantly improved the shelf-life quality of yellow peach, promoted its accumulation of bioactive components, improved its antioxidant capacity, and extended the shelf life. In conclusion, compared with a single low-temperature treatment, low temperature combined with CA treatment can alleviate fruit browning, improve nutrient content and antioxidant capacity, and is conducive to maintaining the shelf-life quality of yellow peach.

Author Contributions

Conceptualization, X.Z.; methodology, X.D. and Y.H.; software, X.D.; writing—review and editing, X.D. and X.Z.; visualization, X.D., C.Y. and Y.H.; supervision, X.C., G.L., Y.S. and X.Z.; project administration and funding acquisition, X.C., G.L., Y.S. and X.Z. All authors contributed to the article and approved the submitted version. All authors have read and agreed to the published version of the manuscript.

Funding

This work was supported by the Hunan provincial Key Research and Development Program (grant 2020NK2048) provided by Hunan Provincial Science and Technology Department and the Agricultural Science and Technology Innovation Fund project of Hunan Province, China (grant 2021CX80, 2022CX43, and 2022CX133) provided by Hunan Academy of Agricultural Sciences.

Institutional Review Board Statement

Not applicable.

Informed Consent Statement

Not applicable.

Data Availability Statement

Data are contained within the article.

Conflicts of Interest

The authors declare no conflict of interest.

References

  1. Wang, L.; Chen, S.; Shao, J.; Zhang, C.; Mei, L.; Wang, K.; Jin, P.; Zheng, Y. Hydrogen sulfide alleviates chilling injury in peach fruit by maintaining cell structure integrity via regulating endogenous H2S, antioxidant and cell wall metabolisms. Food Chem. 2022, 391, 133283. [Google Scholar] [CrossRef] [PubMed]
  2. Byrne, D.; Vizzotto, M.; Cisneros-Zevallos, L.; Ramming, D.; Okie, W. Antioxidant Content of Peach and Plum Genotypes. Hortscience 2004, 39, 2327–9834. [Google Scholar] [CrossRef]
  3. Fan, X.; Argenta, L.; Mattheis, J.P. Interactive Effects of 1-MCP and Temperature on ‘Elberta’ Peach Quality. Hortscience 2002, 37, 134–138. [Google Scholar] [CrossRef] [Green Version]
  4. Wang, Y.; Gao, L.; Wang, Q.; Zuo, J. Low temperature conditioning combined with methyl jasmonate can reduce chilling injury in bell pepper. Sci. Hortic. 2019, 243, 434–439. [Google Scholar] [CrossRef]
  5. Besada, C.; Novillo, P.; Navarro, P.; Salvador, A. Effect of a low oxygen atmosphere combined with 1-MCP pretreatment on preserving the quality of ‘Rojo Brillante’ and ‘Triumph’ persimmon during cold storage. Sci. Hortic. 2014, 179, 51–58. [Google Scholar] [CrossRef]
  6. Huyskens-Keil, S.; Prono-Widayat, H.; Lüdders, P.; Schreiner, M. Postharvest quality of pepino (Solanum muricatum Ait.) fruit in controlled atmosphere storage. J. Food Eng. 2006, 77, 628–634. [Google Scholar] [CrossRef]
  7. Park, M.H.; Sangwanangkul, P.; Choi, J.W. Reduced chilling injury and delayed fruit ripening in tomatoes with modified atmosphere and humidity packaging. Sci. Hortic. 2018, 231, 66–72. [Google Scholar] [CrossRef]
  8. Ferreiro, C.B.; Martínez, M.L.; Borrás, P.N.; Hernando, M.H.; Salvador, A. Short-term high CO2 treatment alleviates chilling injury of persimmon cv. Fuyu by preserving the parenchyma structure. Food Control. 2015, 51, 163–170. [Google Scholar]
  9. Giraldo, E.; Díaz, A.; Corral, J.M.; García, A. Applicability of 2-DE to assess differences in the protein profile between cold storage and not cold storage in nectarine fruits. J. Proteom. 2012, 75, 5774–5782. [Google Scholar] [CrossRef]
  10. Moradinezhad, F.; Khayyat, M.; Saeb, H. Combination effects of postharvest treatments and modified atmosphere packaging on shelf life and quality of Iranian pomegranate fruit cv. Sheshi-kab. Int. J. Postharvest Biol. Technol. Innov. 2013, 3, 244–256. [Google Scholar] [CrossRef]
  11. Dziedzic, E.; Baszczyk, J.; Bieniasz, M.; Dziadek, K.; Kope, A. Effect of modified (MAP) and controlled atmosphere (CA) storage on the quality and bioactive compounds of blue honeysuckle fruits (Lonicera caerulea L.). Sci. Hortic. 2020, 265, 109226. [Google Scholar] [CrossRef]
  12. Wang, Y.; Sugar, D. Internal browning disorder and fruit quality in modified atmosphere packaged ‘Bartlett’ pears during storage and transit. Postharvest Biol. Technol. 2013, 83, 72–82. [Google Scholar] [CrossRef]
  13. Burdon, J.; Billing, D.; Pidakala, P. Avoiding Chilling Damage in ‘Hass’ Avocado Fruit by Controlled Atmosphere Storage at Higher Temperature. Hortscience 2017, 52, 2327–9834. [Google Scholar] [CrossRef] [Green Version]
  14. Paulsen, E.; Barrios, S.; Lema, P. Ready-to-eat cherry tomatoes: Passive modified atmosphere packaging conditions for shelf life extension. Food Packag. Shelf. 2019, 22, 100407. [Google Scholar] [CrossRef]
  15. Fernández-León, M.; Fernández-León, A.; Lozano, M.; Ayuso, M.C.; González-Gómez, D. Different postharvest strategies to preserve broccoli quality during storage and shelf life: Controlled atmosphere and 1-MCP. Food Chem. 2013, 138, 564–573. [Google Scholar] [CrossRef] [PubMed]
  16. Youssef, S.E.; Mitcham, E.J. 272 Control of Brown Rot of Peaches and Apricots with Hot Water and Controlled-Atmosphere Storage. Hortscience 1994, 29, 2327–9834. [Google Scholar] [CrossRef] [Green Version]
  17. Anastasia, K.; Fabrizio, C.; Claudiu, S. Phenols and Polyphenols as Carbonic Anhydrase Inhibitors. Molecules 2016, 21, 121649. [Google Scholar]
  18. Zhang, X.; Zhou, Y.; Li, J.; Gu, X.; Zhao, L.; Li, B.; Wang, K.; Yang, Q.; Zhang, H. Pichia caribbica improves disease resistance of cherry tomatoes by regulating ROS metabolism. Biol. Control. 2022, 169, 104870. [Google Scholar] [CrossRef]
  19. Mokrani, A.; Krisa, S.; Cluzet, S.; Da Costa, G.; Temsamani, H.; Renouf, E.; Mérillon, J.; Madani, K.; Mesnil, M.; Monvoisin, A.; et al. Phenolic contents and bioactive potential of peach fruit extracts. Food Chem. 2016, 202, 212–220. [Google Scholar] [CrossRef]
  20. Ali, S.; Khan, A.S.; Malik, A.U.; Shahid, M. Effect of controlled atmosphere storage on pericarp browning, bioactive compounds and antioxidant enzymes of litchi fruits. Food Chem. 2016, 206, 18–29. [Google Scholar] [CrossRef]
  21. Brackmann, A.; Bortoluzzi, G. Influence of temperature, CA conditions and relative humidity on physiological disorders of ‘fuji’ apples. Acta Hortic. 1998, 464, 369–373. [Google Scholar] [CrossRef]
  22. Selcuk, N.; Erkan, M. The effects of modified and palliflex controlled atmosphere storage on postharvest quality and composition of ‘Istanbul’ medlar fruit. Postharvest Biol. Technol. 2015, 99, 9–19. [Google Scholar] [CrossRef]
  23. Li, L. Elevated CO2 Enhanced the Antioxidant Activity and Downregulated Cell Wall Metabolism of Wolfberry (Lycium barbarum L.). Antioxidants 2022, 11, 11010016. [Google Scholar]
  24. Foucher, L.; Barroca, M.J.; Dulyanska, Y.; Correia, P.M.R.; Guiné, R.P.F. Development of Innovative Candied Chestnuts from Three Chestnut Cultivars Grown in Portugal. Foods 2022, 11, 11070917. [Google Scholar] [CrossRef]
  25. Gull, A.; Bhat, N.; Wani, S.M.; Masoodi, F.A.; Ganai, S.A. Shelf life extension of apricot fruit by application of nanochitosan emulsion coatings containing pomegranate peel extract. Food Chem. 2021, 349, 129149. [Google Scholar] [CrossRef]
  26. Vegara, S.; Marti, N.; Lorente, J.; Coll, L.; Streitenberger, S.; Valero, M.; Saura, D. Chemical guide parameters for Punica granatum cv. ‘Mollar’ fruit juices processed at industrial scale. Food Chem. 2014, 147, 203–208. [Google Scholar] [CrossRef]
  27. Kubola, J.; Siriamornpun, S. Phenolic contents and antioxidant activities of bitter gourd (Momordica charantia L.) leaf, stem and fruit fraction extracts in vitro. Food Chem. 2008, 110, 881–890. [Google Scholar] [CrossRef]
  28. Maroga, G.M.; Soundy, P.; Sivakumar, D. Different Postharvest Responses of Fresh-Cut Sweet Peppers Related to Quality and Antioxidant and Phenylalanine Ammonia Lyase Activities during Exposure to Light-Emitting Diode Treatments. Foods 2019, 8, 8090359. [Google Scholar] [CrossRef] [Green Version]
  29. Shi, Z.; Zhang, J.; Chen, S.; Li, Y.; Lei, X.; Qiao, H.; Zhu, Q.; Hu, B.; Zhou, Q.; Jiao, J. Conversion of Fibroblasts to Parvalbumin Neurons by One Transcription Factor, Ascl1, and the Chemical Compound Forskolin. J. Biol. Chem. 2016, 291, 13560–13570. [Google Scholar] [CrossRef] [Green Version]
  30. Kou, L.; Yang, T.; Luo, Y.; Liu, X.; Huang, L.; Coding, E. Pre-harvest calcium application increases biomass and delays senescence of broccoli microgreens. Postharvest Biol. Technol. 2014, 87, 70–78. [Google Scholar] [CrossRef]
  31. Xie, Y.; Zheng, Y.; Da, I.X.; Wang, Q.; Cao, J.; Xiao, J. Seasonal dynamics of total flavonoid contents and antioxidant activity of Dryopteris erythrosora. Food Chem. 2015, 186, 113–118. [Google Scholar] [CrossRef] [PubMed]
  32. Radunic, M.; Spika, M.J.; Ban, S.G.; Gadze, J.; Diaz-Perez, J.C.; Dan, M.L. Physical and chemical properties of pomegranate fruit accessions from Croatia. Food Chem. 2015, 177, 53–60. [Google Scholar] [CrossRef]
  33. Tounsi, M.S.; Wannes, W.A.; Ouerghemmi, I.; Jegham, S.; Njima, Y.B.; Hamdaoui, G.; Zemni, H.; Marzouk, B. Juice components and antioxidant capacity of four Tunisian Citrus varieties. J. Sci. Food Agric. 2011, 91, 142–151. [Google Scholar] [CrossRef] [PubMed]
  34. Jiang, T. Effect of alginate coating on physicochemical and sensory qualities of button mushrooms (Agaricus bisporus) under a high oxygen modified atmosphere. Postharvest Biol. Technol. 2013, 76, 91–97. [Google Scholar] [CrossRef]
  35. Grace, M.H.; Xiong, J.; Esposito, D.; Ehlenfeldt, M. LMA Simultaneous LC-MS quantification of anthocyanins and non-anthocyanin phenolics from blueberries with widely divergent profiles and biological activities. Food Chem. 2019, 3, S0046. [Google Scholar]
  36. Yuan, Y.; Xu, X.; Jing, C.; Zou, P.; Zhang, C.; Li, Y. Microwave assisted hydrothermal extraction of polysaccharides from Ulva prolifera: Functional properties and bioactivities. Carbohydr. Polym. 2018, 181, 902–910. [Google Scholar] [CrossRef] [PubMed]
  37. Yang, X.; Lin, S.; Jia, Y.; Rehman, F.; Wang, Y. Anthocyanin and spermidine derivative hexoses coordinately increase in the ripening fruit of Lycium ruthenicum. Food Chem. 2019, 311, 125874. [Google Scholar] [CrossRef]
  38. Tareen, M.J.; Singh, Z.; Khan, A.S.; Abbasi, N.A.; Naveed, M. Combined Applications of Aminoethoxyvinylglycine with Salicylic Acid or Nitric Oxide Reduce Oxidative Stress in Peach During Ripening and Cold Storage. J. Plant Growth Regul. 2017, 36, 83–994. [Google Scholar] [CrossRef]
  39. Smirnoff, N. The role of active oxygen in the response of plants to water deficit and desiccation. New Phytol. 2010, 125, 27–58. [Google Scholar] [CrossRef]
  40. Sun, J.; Lin, H.; Zhang, S.; Lin, Y.; Wang, H.; Lin, M.; Hung, Y.C.; Chen, Y. The roles of ROS production-scavenging system in Lasiodiplodia theobromae (Pat.) Griff. & Maubl.-induced pericarp browning and disease development of harvested longan fruit. Food Chem. 2018, 247, 16–22. [Google Scholar]
  41. Bolanos, E.N.A.; Velazquez, R.C.; Cardenaz, A.V.; Santamaria, I.R.; Vera, N.G.; Fuentes, A.D.H.; Silva, E.M. Effect of Stroage Temperatur and Time on Quality in Minimally Processed Litchi Fruit (Litchi Chinensis Sonn.). J. Food Qual. 2010, 33, 299–311. [Google Scholar] [CrossRef]
  42. Palmaorozco, G.; Sampedro, J.G.; Ortizmoreno, A.; Najera, H. Inactivation of Polyphenol Oxidase in Mamey Fruit. J. Food Sci. 2012, 77, 359–365. [Google Scholar] [CrossRef] [PubMed]
  43. Cole, M.; Wood, R. Pectic Enzymes and Phenolic Substances in Apples Rotted by Fungi. Ann. Bot. 1961, 25, 435–452. [Google Scholar] [CrossRef]
  44. Babbar, N.; Oberoi, H.S.; Uppal, D.S.; Patil, R.T. Total phenolic content and antioxidant capacity of extracts obtained from six important fruit residues. Food Res. Int. 2011, 44, 391–396. [Google Scholar] [CrossRef]
  45. Alothman, M.; Bhat, R.; Karim, A.A. Antioxidant capacity and phenolic content of selected tropical fruits from Malaysia, extracted with different solvents. Food Chem. 2009, 115, 785–788. [Google Scholar] [CrossRef]
  46. Silva, R. Enzyme technology in food preservation: A promising and sustainable strategy for biocontrol of post-harvest fungal pathogens. Food Chem. 2018, 277, 531–532. [Google Scholar] [CrossRef]
  47. Li, D.; Zhang, X.; Qu, H.; Li, L.; Mao, B.; Xu, Y.; Lin, X.; Luo, Z. Delaying the biosynthesis of aromatic secondary metabolites in postharvest strawberry fruit exposed to elevated CO2 atmosphere-ScienceDirect. Food Chem. 2020, 306, 125611. [Google Scholar] [CrossRef]
  48. Shellie, K.C. Ultra-low oxygen refrigerated storage of ‘rio red’ grapefruit: Fungistatic activity and fruit quality. Postharvest Biol. Technol. 2002, 25, 73–85. [Google Scholar] [CrossRef]
  49. Kim, Y.; Brecht, J.K.; Talcott, S.T. Antioxidant phytochemical and fruit quality changes in mango (Mangifera indica L.) following hot water immersion and controlled atmosphere storage. Food Chem. 2007, 105, 1327–1334. [Google Scholar] [CrossRef]
  50. Dlmanal, T. Controlled atmosphere and shelf life performance of a new late-maturing Japanese pear, Pyrus pyrifolia (Burm. F.) Nakai, cultivar ‘Atago’. Not. Bot. Horti Agrobot. Cluj Napoca 2020, 48, 177–188. [Google Scholar]
  51. Gonzalez, M.E.; Barrett, D.M. Thermal, High Pressure, and Electric Field Processing Effects on Plant Cell Membrane Integrity and Relevance to Fruit and Vegetable Quality. J. Food Sci. 2010, 75, 121–130. [Google Scholar] [CrossRef] [PubMed] [Green Version]
  52. Nagpala, E.; Noferini, M.; Farneti, B.; Piccinini, L.; Costa, G. Cherry-Meter: An innovative non-destructive (vis/NIR) device for cherry fruit ripening and quality assessment. Acta Hortic. 2017, 1161, 491–496. [Google Scholar] [CrossRef]
  53. Mattheis, J.P. Controlled Atmosphere pO2 Alters Ripening Dynamics of 1-MCP treated ‘d’Anjou’ Pear (Pyrus communis L.) Fruit. Hortscience 2017, 52, 2327–9834. [Google Scholar] [CrossRef]
  54. Nakano, K.; Maezawa, S. Combined effect of heat treatment and modified atmosphere packaging on the color development of cherry tomato. Postharvest Biol. Technol. 2004, 34, 113–116. [Google Scholar]
  55. Lv, P.; Na, L.; Liu, H.; Gu, H.; Zhao, W.E. Changes in carotenoid profiles and in the expression pattern of the genes in carotenoid metabolisms during fruit development and ripening in four watermelon cultivars. Food Chem. 2015, 174, 52–59. [Google Scholar] [CrossRef]
  56. Lufu, R.; Ambaw, A.; Opara, U.L. Water loss of fresh fruit: Influencing pre-harvest, harvest and postharvest factors. Sci. Hortic. 2020, 272, 109519. [Google Scholar] [CrossRef]
  57. Jiang, X.; Lin, H.; Shi, J.; Neethirajan, S.; Lin, Y.; Chen, Y.; Wang, H.; Lin, Y. Effects of a novel chitosan formulation treatment on quality attributes and storage behavior of harvested litchi fruit. Food Chem. 2018, 252, 134–141. [Google Scholar] [CrossRef]
  58. Li, S.; Jiang, H.; Wang, Y.; Liang, L.; Bi, Y. Effect of benzothiadiazole treatment on improving the mitochondrial energy metabolism involved in induced resistance of apple fruit during postharvest storage. Food Chem. 2019, 302, 125288. [Google Scholar] [CrossRef]
  59. Ma, Q. Moderation of respiratory cascades and energy metabolism of fresh-cut pear fruit in response to high CO2 controlled atmosphere. Postharvest Biol. Technol. 2021, 172, 111379. [Google Scholar]
  60. Saquet, A.A.; Streif, J. Respiration rate and ethylene metabolism of ‘Jonagold’ apple and ‘Conference’ pear under regular air and controlled atmosphere. Bragantla 2017, 76, 335–344. [Google Scholar] [CrossRef] [Green Version]
  61. Nguyen, T.A.; Verboven, P.; Schenk, A.; Nicola, B.M. Prediction of water loss from pears (Pyrus communis cv. Conference) during controlled atmosphere storage as affected by relative humidity. J. Food Eng. 2007, 83, 149–155. [Google Scholar] [CrossRef]
  62. Mcdonald, B.; Harman, J.E. Controlled-atmosphere storage of kiwifruit. I. Effect on fruit firmness and storage life. Sci. Hortic. 1982, 17, 113–123. [Google Scholar] [CrossRef]
  63. Luo, Z.; Xiang, W.; Yan, X.; Chen, C. Alleviation of chilling injury and browning of postharvest bamboo shoot by salicylic acid treatment. Food Chem. 2012, 131, 456–461. [Google Scholar] [CrossRef]
  64. Luna, M.C.; Tudela, J.A.; Tomás-Barberán, F.; Gil, M.I. Modified atmosphere (MA) prevents browning of fresh-cut romaine lettuce through multi-target effects related to phenolic metabolism. Postharvest Biol. Technol. 2016, 119, 84–93. [Google Scholar] [CrossRef]
  65. Zhao, H.; Liu, B.; Zhang, W.; Cao, J.; Jiang, W. Enhancement of quality and antioxidant metabolism of sweet cherry fruit by near-freezing temperature storage. Postharvest Biol. Technol. 2019, 147, 113–122. [Google Scholar] [CrossRef]
  66. Kaewsuksaeng, S.; Uthairatanakij, A.; Kanlayanarat, S. High O2 effects on peel browning and phenolics changes in longan (Dimocarpus longan Lour.) fruit. Acta Hortic. 2010, 857, 389–394. [Google Scholar] [CrossRef]
  67. Guo, C.; Bi, J.; Li, X.; Jian, L.; Hu, J. Investigation on the phenolic composition, related oxidation and antioxidant activity of thinned peach dried by different methods. LWT Food Sci. Tech. Braz. 2021, 147, 111573. [Google Scholar] [CrossRef]
  68. Ma, Y.; Ban, Q.; Shi, J.; Dong, T.; Jiang, C.Z.; Wang, Q. 1-Methylcyclopropene (1-MCP), storage time, and shelf life and temperature affect phenolic compounds and antioxidant activity of ‘Jonagold’ apple. Postharvest Biol. Technol. 2019, 150, 71–79. [Google Scholar] [CrossRef]
  69. Senter, S.D.; Callahan, A. Variability in the Quantities of Condensed Tannins and Other Major Phenols in Peach Fruit During Maturation. J. Food Sci. 2010, 55, 1585–1587. [Google Scholar] [CrossRef]
  70. Singh, B.K.; Sharma, S.R.; Singh, B. Antioxidant enzymes in cabbage: Variability and inheritance of superoxide dismutase, peroxidase and catalase. Sci. Hortic. 2010, 124, 9–13. [Google Scholar] [CrossRef]
  71. Yu, C.; Jian, S.; Xu, X.; Bao, Y.; Jiang, Y. Variations in contents of (−) -epicatechin and activities of phenylalanine ammonialyase and polyphenol oxidase of longan fruit during development. Sci. Hortic. 2010, 125, 230–232. [Google Scholar] [CrossRef]
  72. Wang, S.Y.; Bunce, J.A.; Maas, J.L. Elevated carbon dioxide increases contents of antioxidant compounds in field-grown strawberries. J. Agric. Food Chem. 2003, 51, 4315–4320. [Google Scholar] [CrossRef] [PubMed]
  73. Tan, F.Q.; Zhang, M.; Xie, K.D.; Fan, Y.J.; Song, X.; Wang, R.; Wu, X.M.; Zhang, H.Y.; Guo, W. Polyploidy remodels fruit metabolism by modifying carbon source utilization and metabolic flux in Ponkan mandarin (Citrus reticulata Blanco). Plant Sci. 2019, 289, 110276. [Google Scholar] [CrossRef] [PubMed]
  74. Du, M.; Liu, Z.; Zhang, X.; Li, H.; Wang, L. Effect of pulsed controlled atmosphere with CO2 on the quality of watercored apple during storage. Sci. Hortic. 2020, 278, 109854. [Google Scholar] [CrossRef]
  75. Buccheri, M.; Picchi, V.; Grassi, M.; Bianchi, G.; Scalzo, R.L. Dynamic changes of antioxidants and fermentative metabolites in apple peel in relation to storage, controlled atmosphere, and initial low oxygen stress. Sci. Hortic. 2021, 288, 110312. [Google Scholar] [CrossRef]
Figure 1. Effect of different storage methods on the L* (A), a* (B), b* (C), and ∆E* (D) of yellow peaches. Vertical bars represent standard deviations. Different letters represent statistical differences (p < 0.05).
Antioxidants 11 02278 g001
Figure 2. Effect of different storage methods on browning index (A), firmness (B), decay rate (C), and weight loss rate (D) of yellow peaches. Vertical bars represent standard deviations. Different letters represent statistical differences (p < 0.05).
Antioxidants 11 02278 g002
Figure 3. Effect of different storage methods on POD (A), PAL (B), and PPO (C) enzyme activities of yellow peach. Vertical bars represent standard deviations. Different letters represent statistical differences (p < 0.05).
Antioxidants 11 02278 g003
Figure 4. Effect of different storage methods on TPC (A) and TFC (B) of yellow peach. Vertical bars represent standard deviations. Different letters represent statistical differences (p < 0.05).
Antioxidants 11 02278 g004
Figure 5. Different storage methods on yellow peach catechin (A), neochlorogenic acid (B), chlorogenic acid (C), and vanillic acid (D). Vertical bars represent standard deviations. Different letters represent statistical differences (p < 0.05).
Antioxidants 11 02278 g005
Figure 6. Different storage methods on yellow peach rutin (A), isoquercitrin (B), ferulic acid (C), and phlorizin (D). Vertical bars represent standard deviations. Different letters represent statistical differences (p < 0.05).
Antioxidants 11 02278 g006
Figure 7. Effect of different storage methods on DPPH (A), ABTS (B), and FRAP (C) of yellow peach. Vertical bars represent standard deviations. Different letters represent statistical differences (p < 0.05).
Antioxidants 11 02278 g007
Figure 8. Heat map of correlation analysis of yellow peach index parameters for different treatments, with three replicates for each treatment.
Antioxidants 11 02278 g008
Figure 9. Principal component analysis score plot (A) and loading plot (B) of yellow peach index parameters for different treatments with three replicates for each treatment.
Antioxidants 11 02278 g009
Figure 10. Heat map of hierarchical cluster analysis of yellow peach index parameters for different treatments, with three replicates for each treatment.
Antioxidants 11 02278 g010
Publisher’s Note: MDPI stays neutral with regard to jurisdictional claims in published maps and institutional affiliations.

