Article

Comparative Chemical Analysis of Eight Punica granatum L. Peel Cultivars and Their Antioxidant and Anti-Inflammatory Activities

by
Valentina Parisi
1,2,†,
Valentina Santoro
1,†,
Giuliana Donadio
1,
Maria Laura Bellone
1,2,
Gianfranco Diretto
3,
Carla Sandri
3,
Francesca Mensitieri
4,
Nunziatina De Tommasi
1,*,
Fabrizio Dal Piaz
4 and
Alessandra Braca
5
1
Department of Pharmacy, University of Salerno, 84084 Fisciano, SA, Italy
2
PhD Program in Drug Discovery and Development, Department of Pharmacy, Università degli Studi di Salerno, Via Giovanni Paolo II 132, 84084 Fisciano, SA, Italy
3
Casaccia Research Centre, Biotechnology Laboratory, Italian National Agency for New Technologies, Energy and Sustainable Development (ENEA), 00123 Rome, Italy
4
Dipartimento di Medicina, Chirurgia e Odontoiatria “Scuola Medica Salernitana”, Università degli Studi di Salerno, via Giovanni Paolo II 132, 84084 Fisciano, SA, Italy
5
Department of Pharmacy, University of Pisa, 56126 Pisa, Italy
*
Author to whom correspondence should be addressed.
These authors contributed equally to this work.
Antioxidants 2022, 11(11), 2262; https://doi.org/10.3390/antiox11112262
Submission received: 28 September 2022 / Revised: 7 November 2022 / Accepted: 11 November 2022 / Published: 16 November 2022
(This article belongs to the Topic Redox Metabolism)

Abstract

:
A comparative quali-quantitative study of the peel extracts of eight Punica granatum cultivars obtained from underexploited areas of South Italy was carried out in order to valorize them as health-promoting by-products. The results showed that all of the samples possessed 45 ellagitannins, consisting mainly of polyhydroxyphenoyls; 10 flavonoids, belonging to flavonol, flavone, and catechin classes; and 2 anthocyanins. The most representative compounds underwent quantification through a LC-MS/MS multiple reaction monitoring (MRM)-based method; their qualitative profile was almost superimposable, while variability in the quantitative phenolic content was observed. The antioxidant activity was investigated using cell-free and cell-based assays. The in vitro anti-inflammatory potential was also studied by monitoring three typical markers of inflammation (IL-1β, IL-6, and TNF-α). Moderate differences in both activities were observed between the cultivars. Results showed that all of the investigated peels have a potential use as healthy bioactive phytocomplexes due to the interesting antioxidant and anti-inflammatory activities; in particular from the bioinformatic approaches a series of compounds, including galloyl-, pedunculagin- and ellagic acid-based, were found to be highly correlated with bioactivity of the extracts. Finally, the bioactivities showed by a Campanian local cultivar, ‘Granato di Aiello del Sabato’, could promote its cultivation by local farmers and germplasm conservation.

1. Introduction

Punica granatum L. (Lythraceae), commonly known as pomegranate, is a small tree native to Iran, China, and India and is widely cultivated in the Mediterranean region, North and South Africa, Asia, and Central and South America due to its commercial attractiveness as a fresh fruit or as juice. It’s a temperate climate species capable of easily spreading in arid and semi-arid areas and is tolerant to salinity and water deficiency and agronomic factors that usually reduce the growth of other crops. The pomegranates’ successful adaptation to Mediterranean weather conditions has led to their diffusion in this area and the propagation of new varieties. Since ancient times, the usage of pomegranate has been reported in many prehistoric human cultures [1], while recently it has been described as a “super food” and classified among the top ten fruits with high nutraceutical value. The juice, mostly marketed instead of fresh fruit to avoid the unpleasant removal of the seeds, is a rich source of polyphenols such as anthocyanins (glycosides of cyanidin, delphinidin, and pelargonidin), flavonoids (proanthocyanidins and flavanols), and tannins (ellagitannins and gallotannins) [2] as well as volatile substances with an intense aroma [3]. The phenolic content of pomegranate juice varies among the different cultivars, varieties, and genotypes (actually more than 500), climates, agronomical conditions, harvest and post-harvest times, juice obtaining method, and its processing, leading to different health-promoting products widely used not only as food but also in nutraceutical and cosmetic preparations [4].
The by-product of P. granatum is estimated to be composed of 80% peels and 20% seeds; therefore, in this context, the impact of this bio-waste is mainly addressed to discharge, representing a significant issue for the agro-food industry and requiring strategic action for the agricultural production and processing industry. Recently, the increasing attention to avoid environmental pollution, as well as to the rationalization of the agro-industrial cycle has stimulated the search for a possible exploitation of fruit residue, from a circular bioeconomy perspective. Pomegranate peels have been widely used for the treatment of different pathologies such as inflammation, ulcers, infections, and brain ischemia, while the seeds can be used to produce a high-quality oil [5,6]. Recently, our group reported an herbal mixture made from propolis, pomegranate peels, and grape pomace as an active anti-inflammatory agent in an in vivo rheumatoid arthritis, model highlighting its possible use as a new natural product-based formulation against this disease [7].
In several areas of South Italy, there is a long-held tradition concerning the cultivation, in parks and public or private gardens, of pomegranates used as ornamental plant, and for juice and eating. Recently, due to the discovery of the healthy and nutritional promoting properties of the fruit, its cultivation has been increased, yielding a high quantity of bio-waste. Although the pomegranate cultivation in the internal areas of South Italy could produce notable economic and commercial income with interesting development opportunities, no studies have been reported until now on the pomegranate cultivars collected from these Italian areas. Therefore, to valorize them as by-products, pomegranate peels from eight cultivars of South Italy were selected and subjected to a quali-quantitative comparisons for their secondary metabolite contents. Among the investigated cultivars, ‘Granato di Aiello del Sabato’, a local accession of Campanian internal areas with a good yield from an agronomic point of view as it adapts perfectly to this area environment, was selected with the aim to promote its cultivation by local farmers also through the valorization of its main by-products. Furthermore, considering the high interest in pomegranate by-product biological activity, extracts from the peels were evaluated for their radical scavenger activity by DPPH and ABTS+-based and in-cell antioxidant activity assays. Subsequently, the in vitro anti-inflammatory potential was also investigated by monitoring their effect on the secretion of three typical markers of inflammation (IL-1β, IL-6, and TNF-α) in human macrophages. Finally, several bioinformatic analyses were carried out to achieve a deeper understanding of the chemical profiles characterizing the different cultivars as well as to identify potential biochemical markers associated with the bioactivities. Specifically, to the best of our knowledge, this is the first study on the chemical and bioactive profile of the ‘Granato di Aiello del Sabato’ cultivar.

2. Materials and Methods

2.1. Samples

The fourteen pomegranate fruit peels, M1-M14, were obtained in autumn 2020 from eight cultivars and different collection sites as reported in Table 1. The whole fruits were separated into arils and peels, and the peels were stored at −22 °C until the extraction procedure.

2.2. Reagents

Ultra-pure acetonitrile, water, methanol, and formic acid for LC-MS analysis were purchased from Romil Ltd. Pure Chemistry (Cambridge, UK). Solvents for extraction were purchased from Sigma Chemicals Company (Milan, Italy). For quali-quantitative analysis, the following standards were used: punicalin and punicalagin from PhytoLab GmbH & Co. KG (Vestenbergsgreuth, Germany), ellagic acid, gallic acid, apigenin 7-O-glucoside, and cyanidin 3-O glucoside were obtained from Sigma Chemicals Company (Milan, Italy). THP-1 (human leukemia monocytic) and HaCat (human epidermal keratinocytes) cell lines were purchased from American Type Cell Culture (ATCC) (Rockville, MD, USA). DMEM (Dulbecco’s Modified Eagle Medium) and RPMI 1640 (Roswell Park Memorial Institute Medium), Fetal Bovine Serum (FBS) were purchased from GIBCO (Life Technologies, Grand Island, NY, USA). Phorbol-12-myristate-13-acetate (PMA), MTT [3-(4,5-dimethylthiazol-2-yl)-2,5-diphenyl tetrazolium bromide] were purchased from Sigma Aldrich (St. Louis, MO, USA). OxiSelect™ Cellular Antioxidant Activity Assay Kit was purchased from CellBiolLabs (San Diego, United States). Human IL-1β, IL-6, TNF-α, and ELISA Kits were purchased from Diaclone (Besançon Cedex, France).

2.3. Peels Extraction

5 g of each P. granatum dried peel cultivar were extracted with EtOH-H2O 7:3. The extraction was performed using a 320 W Ultrasonic bath (Branson 2510E-MTH, Bransonic®, Milan, Italy) for 15 min. The amount of solvent used was 1:10 (w/v). The extracts, after filtration, were dried under vacuum, frozen, and lyophilized to remove the exceeded water and stored at 4 °C for further analysis.

2.4. Qualitative Profiling of Pomegranate Peels Hydroalcoholic Extracts

All fourteen hydroalcoholic extracts were dissolved in H2O-MeOH at a ratio of 4:1 to obtain a final concentration of 5 mg/mL and subjected to HR-ESI-LC-MS/MS analysis. A Luna® C18 150 × 2 mm, 3 µm (100 Å) column (Phenomenex®, Castel Maggiore, Bologna, Italy) was employed using H2O acidified by 0.1% formic acid v/v (solvent A) and CH3CN (solvent B) with the following linear gradient as the elution method: solvent B from 5 to 50% over 50 min to 50 to 100% in 10 min. The flow rate was set to 0.2 mL/min and the column oven was set to 40 °C. Q Exactive™ Hybrid Quadrupole-Orbitrap™ Mass Spectrometer (Thermo Fischer Scientific Inc., Darmstadt, Germany) was operated in the negative ion mode coupled with the Thermo Scientific UltiMate 3000 UHPLC system. The identification of specialized metabolites was based on accurate MS values and an MS/MS spectra, aided by the injection of standard compounds and comparison with data from previous literature [8].

2.5. Quantitative Analysis

The quantitative determination of gallic acid, cyanidin 3-O-glucoside, delphynidin 3-O-glucoside, ellagic acid, punicalin, and punicalagin was carried out by ABSCIEX API 6500 QTRAP® Mass Spectrometer coupled with a Nexera X2 UPLC Shimadzu system in both the positive and negative ion modes. A Luna® Omega 100 × 1.6 mm, 3 µm (100 Å) column (Phenomenex®, Castel Maggiore, Bologna, Italy) was employed using H2O acidified by 0.1% formic acid v/v (solvent A) and CH3CN (solvent B). Two different gradient methods were set up for anthocyanins and for the other compounds. The first method provides a linear gradient from over 12 min followed by a faster gradient until reaching 100% of B in 3 min. The second gradient started from 5% of B and reached 30% in 18 min, this was followed by a faster gradient until 100% of B was reached. In both methods, the flow rate was set to 0.25 mL/min and the column oven was set to 30 °C. Analyses were performed in positive and negative ion modes and, for each analyte, the mass parameter was optimized using a standard molecule. The calibration curves for each compound were obtained at a concentration range from 10 ng/mL to 5 μg/mL. The linearity of the instrumental response in the analyzed concentration range was confirmed for each compound, as inferred by the following fitting curve parameters: gallic acid, y = 1.5 × 10³ x + 1.9 × 10⁵, R2 = 0.9922; cyanidin 3-O-glucoside,y = 3.8 × 10⁴ x – 3.0 × 10⁶, R2 = 0.9966; delphynidin 3-O-glucoside y = 5.0 × 10³ x + 9.7 × 10⁴, R2 0.9986; ellagic acid y = 1.5 × 10⁴ x + 1.0 × 10⁶, R2 0.9984; punicalin, y = 1.3 × 10³ x −3.6 × 10⁴, R2 = 0.9992, and punicalagin y = 3.9 × 10³ x − 7.6 × 10⁵, R2 = 0.9968. For all of the compounds the lowest concentration of each calibration curve was clearly higher than respective LOQ, as the signal-to-noise ratios observed at those points were between 8 to 12.

2.6. DPPH Assay

The DPPH (2,2′-diphenyl-1-picrylhydrazyl radical) assay is a spectrophotometric technique where the radical cation reacts with hydrogen donors [9]. The violet color that shows the DPPH in the solution at 515 nm is decolorized by the presence of antioxidants. A stock solution of 10 mM DPPH was freshly prepared in methanol and diluted until an absorbance of 1 OD at 515 nm was reached. Samples were assayed in the presence of a 0.15 mM final concentration of DPPH in 100% methanol. Extracts were diluted between 500 and 2000-fold; the reaction was allowed to proceed for a maximum of 30 min in the dark at room temperature, and then the decrease in absorbance at 515 nm was measured. Different Trolox µM concentrations (0–100 µM-X-axis) were incubated in the presence of the DPPH radical, and its absorbance was measured at 515 nm (Y-axis). A calibration curve was constructed with Trolox concentrations and Abs at 515 nm. All solutions were used on the day of preparation, and all determinations were carried out in triplicate. Millimolar concentrations of Trolox equivalents (TE) of dry extract were quantified using the linear regression equation as follows: extract TE µM = [(Abs 515 nm–1.1057)/(−0.006)]. Then, the appropriate dilution factor was applied to calculate the millimolar TE of the extract at 10 mg/mL.

2.7. ABTS Assay

The ABTS radical cation decolorization assay is based on the reduction of ABTS+• radicals by the antioxidants included in an extract [10]. For the study, the ABTS+• solution was diluted in PBS (Phosphate Buffer Saline) to an absorbance of 0.7 (±0.02) at 734 nm. After the addition of 100 μL of extract solutions to 100 μL of ABTS+• solution, the absorbance reading was taken at 30 °C for 10 min after initial mixing. All solutions were used on the day of preparation, and all determinations were carried out in triplicate. Samples were compared to known concentrations of Trolox standards, a water-soluble analog of tocopherol (Vitamin E), which is a very strong antioxidant and commonly used to measure antioxidant capacity. Different Trolox µM concentrations (0–50 µM-X-axis) were incubated in the presence of the ABTS radical, and its absorbance was measured at 734 nm (Y-axis). Micromolar concentrations of Trolox equivalents (TE) of dry extract were quantified using the linear regression equation as follows: extract TE µM = [(Abs 734 nm–0.8594)/(−0.0156)]. Then, the appropriate dilution factor was applied to calculate the millimolar TE of the extract at 10 mg/mL.

2.8. Cell Viability Assay

A cell viability assay was performed on THP-1 (human acute monocytic leukaemia cell line) and HaCat (human epidermal keratinocytes). THP-1 were plated in 96-well plates at a cell density of 1 × 10⁵ cells/well and differentiated in the THP-1 macrophage attached cell line by treating with 100 nM of phorbol-12-myristate-13-acetate (PMA) for 24 h. THP-1 cell differentiation was enhanced by removing the PMA-containing media and adding fresh media for 24 h. Then, they were incubated for 24 h in the presence of the extracts at concentrations in the range 25–100 μg/mL. HaCat were plated in 96-well plates at a cell density of 1 × 10⁴ cells/well. Then, the cells were incubated for 48 h in the presence of extracts at concentrations of 100 μg/mL. For both cell lines, the number of viable cells was quantified by the MTT [3-(4,5-dimethylthiazol-2-yl)-2,5-diphenyl tetrazolium bromide] assay. Absorption at 550 nm for each well was assessed using Multiskan GO (Thermo Scientific). Experiments were performed in technical triplicates.

2.9. Antioxidant Activity in M0 Macrophages

Using the OxiSelect™ Cellular Antioxidant Activity Assay Kit, the cells were differentiated, as reported above. Then, they were treated with a DCFH-DA probe solution in association with a quercetin standard (0.125–2 mM) or an extract sample (50 µg/mL) and incubated for 1 h. After washing with DPBS 1X buffer, the free radical initiator solution was incubated and immediately the plates were read on a fluorescence microplate reader using an excitation wavelength of 480 nm and an emission wavelength of 530 nm. The reading was performed in the time interval 0–60 min with a reading every 5 min. The analysis was firstly performed evaluating the AUC value (area under the curve) for each sample and then the CAA value (cellular antioxidant activity) was calculated as follows: [CAA Units = 100 − (AUCAntioxidant/AUCControl) × 100] [11].

2.10. Cytokine Production and Enzyme-Linked Immunosorbent Assay (ELISA)

The THP-1 were differentiated in the THP-1 macrophage attached cell line by treating with 100 nM of PMA for 24 h. THP-1 cell differentiation was enhanced by removing the PMA-containing media and adding fresh media for 24 h. The cells were incubated with extracts (100 µg/mL) with and without LPS (0.1 µg/mL) for 24 h. The conditioned medium was collected and analyzed by an Enzyme-Linked Immunosorbent Assay (ELISA). The assays were performed according to manufacturer instructions to quantify the release of inflammatory cytokines (IL-1β, IL-6, and TNF-α). The values were normalized to the LPS sample and reported as percentages. Experiments were performed in technical triplicates.

2.11. Bioinformatics Analyses

Statistical analyses of chemical and bioactivity data have been carried out as previously reported [12], using an ANOVA coupled to a pairwise Tukey’s t-test performed by the PAST software. Heatmaps and hierarchical clustering (HCL) were performed using the Morpheus as reported before, whereas correlation analyses were done as previously described [13], but only considering negative significant (p ≤ 0.05) correlations between bioactivities and chemical compounds.

3. Results

3.1. LC-MS/MS-Based Quali-Quantitative Analysis

Eight cultivars of P. granatum from different collection areas (Table 1) were obtained from Campanian plant breeders and companies, including those widely cultivated to produce pomegranate juice such as ‘Dente di Cavallo‘ and ‘Wonderful‘. All pomegranate accessions come from the same 2020 collection year, and the fruits were harvested at complete maturation. Their peels were subjected to hydroalcoholic ultrasound-assisted extraction. LC-MS/MS analysis (Figure 1 and Figure S1) of the resulting extracts revealed that all fourteen samples displayed almost superimposable profiles with only small differences.
In particular, according to MS data, retention time, and comparison with available pure standards, 45 ellagitannins, consisting of many polyhydroxyphenoyl groups (such as hexahydroxyphenoyl-HHDP) also characterized by the presence of a C–C linkage between galloyl units and 10 flavonoids, belonging to flavonol, flavone, and catechin classes, were tentatively identified (Table 2, Figures S2 and S3). Moreover, among anthocyanins, cyanidin 3-O-glucoside was detected in all the samples, whereas delphinidin 3-O-glucoside was found only in M13 (Table 3, Figure S4). These results were in agreement with previous reports of the specialized metabolite composition in pomegranate peels [14,15,16,17,18,19].
The most representative compounds underwent quantification through a LC-MS/MS multiple reaction monitoring (MRM)-based method. Although the qualitative profile of the different accessions was almost superimposable, there was variability in their phenolic content. The results obtained (Table 3) showed that punicalagin was the most abundant compound in all samples, with sample M7 being the richest. Ellagic acid and punicalin were the second and the third most represented compounds in all extracts, respectively, while gallic acid was present in lower amounts. The M13 extract showed a quantitative profile quite different from the others; in fact, it was richer in anthocyanins, according to the different peel color, but showed a lower quantity of the tannin compounds. This evidence suggested a slightly different secondary metabolism for the ‘Parfianka’ species compared to the others. To the best of our knowledge, this is the first time the peel composition of the M5 cultivar, ‘Granato Aiello del Sabato’, was investigated, being one of the highest phenolic compounds among the analyzed species.

3.2. Antioxidant Activity

The pomegranate peel extracts were analyzed for their antioxidant activity using DPPH and ABTS+-based assays. Using this approach, the antioxidant capacity of each extract was estimated in terms of Trolox equivalent antioxidant capacity (TEAC) and reported as the average of those resulting from at least three independent experiments (Table 4, Figure S5A) [21,22,23,24]. Different antioxidant activities were observed among pomegranate cultivars. Significant differences in the results of the DPPH assay were registered, with the activity values ranging from 40.1, obtained for M13 ‘Parfianka’, to 72.8 and 70.0, measured for M3 ‘Wonderful’ Sicignano degli Alburni and M14 ‘Wonderful’ Grottaminarda, respectively. Interestingly, also ABTS activity data showed that M14 ‘Wonderful’, Grottaminarda accession and M3 ‘Wonderful’ Sicignano degli Alburni accession displayed the highest value.
A further evaluation of the antioxidant activity was carried out through an in-cell assay performed on the human acute monocytic leukemia cell line THP-1-derived M0 macrophages. Preliminarily, the cytotoxic activity of the pomegranate peel extracts towards these cells was evaluated by an MTT assay. The cells were incubated with the extracts for 48 h at a concentration of 100 μg/mL and no cytotoxicity was observed. Once the cytotoxic effect was verified, the antioxidant activity of pomegranate peel extract was evaluated using OxiSelect™ Cellular Antioxidant Activity Assay Kit (Figure 2). Compared to quercetin, used as a positive control, most of the tested extracts also showed an interesting antioxidant effect in cells. However, the extracts M9, M10, M11, M12, and, most importantly, M13, were clearly and significantly less effective than the others.

3.3. Anti-Inflammatory Activity

Subsequently, the anti-inflammatory activity of pomegranate peel extract was evaluated. Since pro- and anti-inflammatory cytokines play a key role in the pathogenesis and evolution of the inflammatory state of rheumatoid arthritis, three typical markers of rheumatoid arthritis were monitored: IL-1β, IL-6, and TNF-α (Figure 3 and Figure S5B). Although their appearance is temporally different, especially in the early course of pathology, they are considered key driving molecules [25]. The extracts were tested on THP-1-derived macrophage cells co-stimulated with LPS. All pomegranate peel extracts revealed potential anti-inflammatory activity, as demonstrated by the observation that all the treatments significantly reduced the secretion of IL-1β and, to a lesser extent, that of IL-6. Instead, TNF-α was only slightly modulated by the peel extract treatment (Figure 3). In particular, M1 and M7 samples were able to inhibit the IL-1β secretion by about 80%, while M5 and M8 inhibited it by about 75%, compared to LPS (Figure 3A). The lowest activity was displayed by M4 and M11 samples (about 55% of reduction). Regarding the IL-6 secretion inhibition, the M14 sample was the most active (55% reduction), while M1, M5, M6, M8, M9, and M11 showed a reduction of about 40% (Figure 3B). Based on these results, IL-6 and IL-1β seem to be the pro-inflammatory cytokines most specifically modulated. In particular, IL-1β appears as the most suitable biomarker to evaluate the potential anti-inflammatory activity of pomegranate peel extract, thus confirming what has already been shown regarding the anti-inflammatory activity of this fruit on human chondrocytes [26,27].

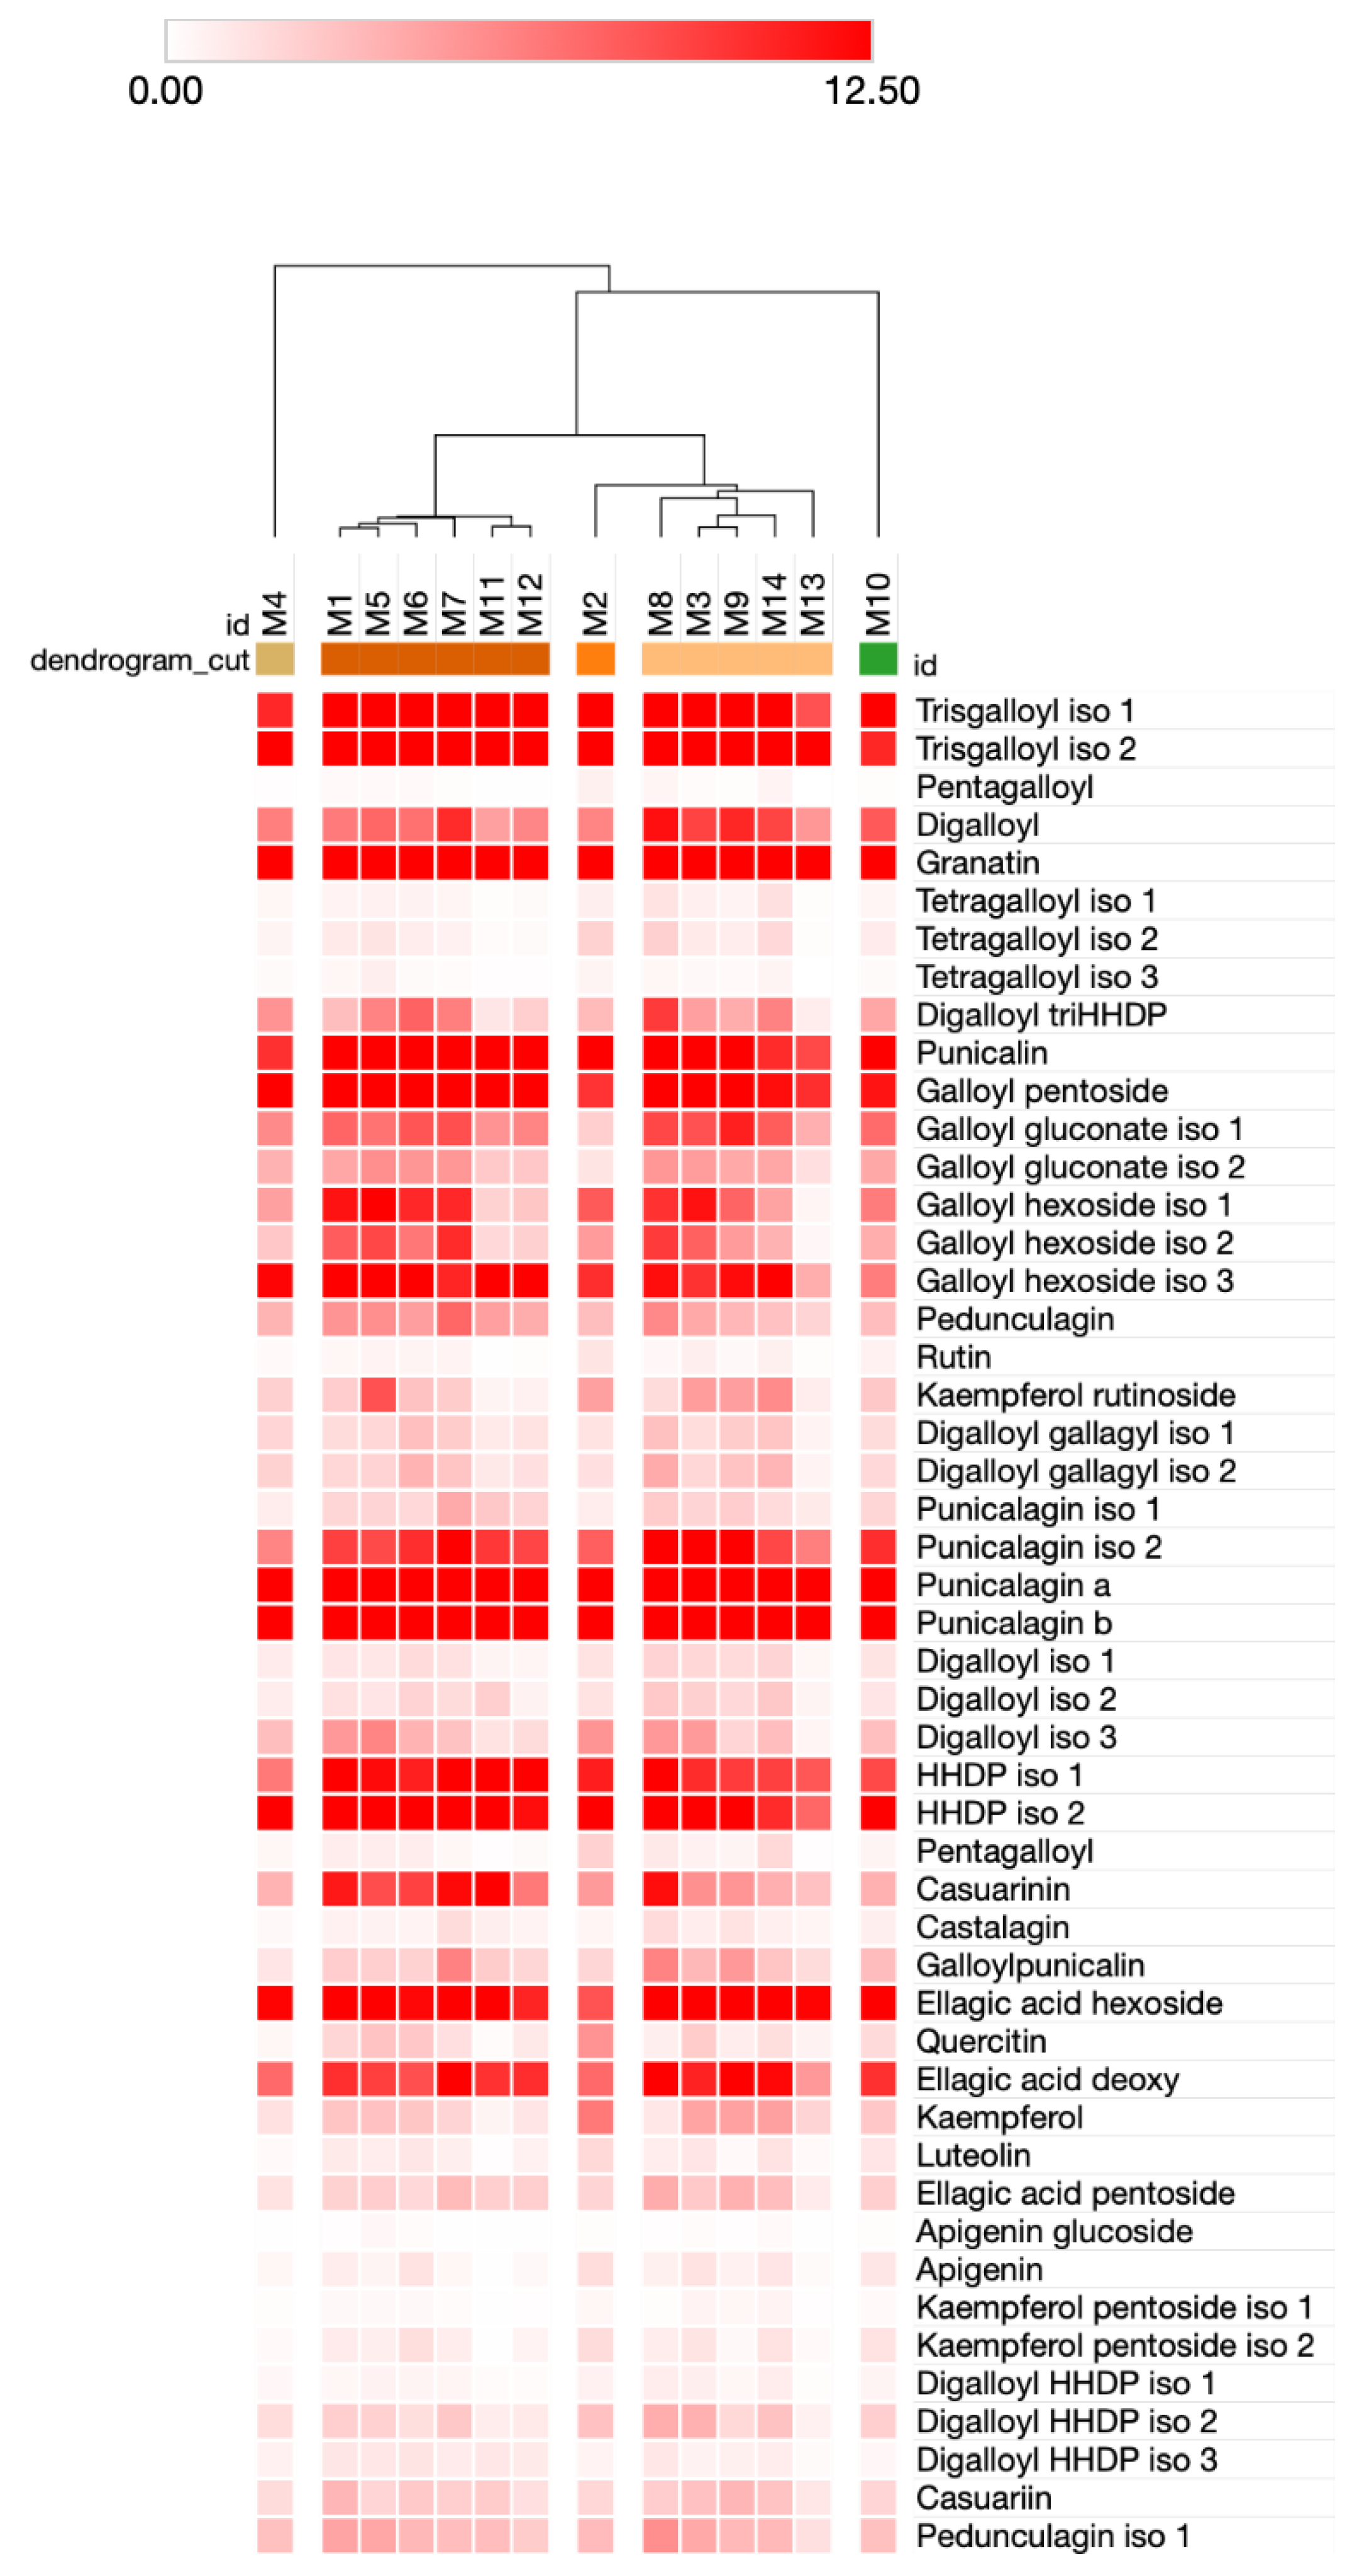
3.4. Bioinformatics Analyses

In order to achieve a more detailed understanding of the chemical and bioactivity data under study, a series of bioinformatics approaches were carried out. First of all, multivariate analyses (principal component analyses, PCAs) were performed, either at variety or metabolite levels (Figure 4 and Figure S4), while the latter was not able to clearly discriminate the different varieties (which clustered all together, Figure S6). In agreement with what reported in Section 3.1, the former (variety) highlighted a group of compounds responsible for the total variance of the dataset. More specifically, punicalagin a and b, granatin, and to a lesser extent, trisgalloyl iso 2 and galloyl-pentoside resulted in the most variable metabolites among the pomegranate genotypes (Figure 4). Notably, components 1 and 2 explained more than 90% of the total variance. We also measured PCA loadings and scores (Tables S1 and S2A,B, Figures S7 and S8), which evidenced, except for M4, positive contributions to components 1 and 2 (PC1, PC2) and a positive and negative influence of M10 on, respectively, PC1 and PC2 (Table S1A,B, Figure S7). PCA and loading scores also confirmed the role of two of the aforementioned metabolites (punicalagin a and b) as the metabolites driving the variance of the whole chemical dataset under study.
Subsequently, a hierarchical clustering (HCL) analysis was exploited as an alternative strategy to evaluate the differences among the pomegranate cultivars under study at global chemical profiling levels (Figure 5). Notably, HCL was able to clearly separate the different genotypes by highlighting the presence of five clusters. More specifically, a distinct attitude of M14 and to a lesser extent, M10, as the varieties with the more marked profiling was found, which placed farthest compared to the others at the left and right sides of the HCL, respectively. On the contrary, all remaining cultivars were distributed into two well recognizable groups, one composed of M1, M5, M6, M7, M11, and M12, and the other including M2, M8, M3, M9, M14, and M13 (Figure 5). It was interesting to notice that genotypes belonging to the same variety mostly grouped together: for instance, the four ‘Dente di Cavallo’ samples (M1, M6, M7, and M11) were all found in the first group, whereas the two additional cultivars were placed in the second group together with the two ‘Wonderful’ cultivars (M3, M14). Thus, HCL resulted a powerful and effective method to infer the chemical differences among the pomegranate cultivars under study, and proved the existence, at least for ‘Dente di Cavallo’, of either genotype- (M1, M6, M7, M11) and genotype x environment-based (M3, M14) effects (Figure 5).
A detected bioactivity can be associated with the presence of a few or a group of molecules in a specific peel extract [28]. In order to elucidate whether specific compounds could be responsible for the antioxidant and anti-inflammatory activity of pomegranate peel extracts and which compounds they were, we performed a correlation analysis, calculating the Pearson correlation coefficients (ρs) between each metabolite and the analyzed bioactivities (Table 5 and Table S3A,B). More specifically, to highlight relationships of interest, only negative significant correlations were considered (corresponding to opposite tendency between metabolite and bioactivity data). Overall, it was not possible to find a large number of significant correlations, thus suggesting the absence, at least on a mathematical basis, of a phytocomplex-derived effect. However, this analysis allowed identifying compounds displaying significant ρs towards the antioxidant and anti-inflammatory activities, notable examples include granatin, trisgalloyl iso 2, and ellagic acid, displaying significant negative correlations towards all antioxidant activities (Table 5A and Table S3A). Similarly, although at a higher extent, a group of compounds showed significant negative correlations towards anti-inflammatory activities, including galloyl hexoside iso 2, pedunculagin, and punicalagin iso 2, being negatively correlated with IL-1β and TNF-α; and punicalagin iso 2, ellagic acid deoxy, and ellagic acid pentoside, displaying significant negative correlations towards IL-1β IL-6, and TNF-α (Table 5B and Table S3B).

4. Discussion

The recovery of agricultural and industrial waste is now recognized as an essential process due to its great economic importance and the reduction of the environmental impact of production processes. The opportunity to transform materials whose disposal involves costs and risks for the environment and population into a source of raw materials could be crucial in those regions, such as the internal areas of South Italy, which are still underdeveloped economically. From this point of view, the possible recovery of pomegranate production chain waste seems to have all the optimal characteristics to be carried out in a productive and advantageous way. Indeed, the main pomegranate by-product is the pericarp of the fruit, and several studies have suggested these peels as a source of bioactive phytocomplexes [29] and proposed their use for several applications [30,31]. However, in order to achieve real feasibility of a waste recovery process aimed at obtaining extracts rich in bioactive molecules, it is advisable that the recovery cost be compatible with the extraction process yield and the quality of the obtained products. Since multiple factors (for example, genetic, geographic, and climatic) have critical effects on the production of secondary metabolites [32,33], it is important to evaluate their effect on the characteristics and quality of by-products. Many studies support the antioxidant and anti-inflammatory effects of the phytochemicals from different P. granatum cultivated varieties [34,35]. In this report, the results of a study aimed at evaluating the possibility of using pomegranate peels from South Italy’s internal areas as a source of extracts with antioxidant and anti-inflammatory activities were pointed out. The rich phenolic compound composition obtained didn’t show a great deal of variability among different pomegranate accessions (Table 1), suggesting that environmental conditions, such as climate or soil composition (clayey or sandy), slightly affect their secondary metabolism. In fact, the comparison of the phenolic compound composition within the different cultivars and accessions of pomegranate and the literature data could be a tricky process due to various factors such as cultivar type, weather conditions, soil composition, and ripeness [33]. Our analyses have confirmed that pomegranate peels contain secondary metabolites of great interest for health and chemoprevention, nutritional, or cosmetic use, such as ellagitannins, flavonoids, and anthocyanins [36]. As expected, the presence of these molecules provided the extracts with a significant antioxidant capacity, appreciable both through in vitro assays and studies on human cells.
The inflammation provokes a condition of oxidative stress that reduces the antioxidant capacity of cells, causing cellular damage. This process is mediated by a variety of factors that contribute to both the release of cytokines and the expression of pro-inflammatory mediators, contributing to the exacerbation of the pro-inflammatory process [7]. Thus, the anti-inflammatory activity of the peel extracts was investigated in cells. Firstly, all the extracts were assayed by the MTT test on THP-1 and HaCat cell lines to verify they did not affect cell viability. Among the factors involved in the inflammation process cytokines play a pivotal role; thus, the secretion of three typical markers, IL-1β, IL-6, and TNF-α, in cells treated with pomegranate peel extracts were investigated. The high modulation of IL-1β, exerted by the majority of the extracts is of high interest due to the critical role of this cytokine in the pathogenic mechanism. However, the modulation of IL-6 is also critical, especially in the systemic manifestations in the acute phase of the inflammatory process [27]. Therefore, the observed ability of pomegranate peel extract to inhibit IL-1β and IL-6 secretion supports their possible use to address inflammation at different stages. On the other hand, the obtained results corroborate the idea that these cytokines could be considered as putative targets for an early intervention on inflammatory pathologies, such as rheumatoid arthritis [7]. A comparison between the peels did not allow us to highlight substantial differences with regards the composition of secondary metabolites of the respective extracts and, consequently, no statistically significant differences in biological activity were observed between the various samples. In fact, different approaches to statistical and multivariate analysis of the various experimental data collected, failed to identify a clear tendency between pomegranate varieties and bioactivities. However, using correlation analyses of chemical composition and bioactivity data, it was possible to highlight, for some metabolites, a potential positive contribution to the detected activities, either at antioxidant or anti-inflammatory levels. This evidence confirms once again the importance of using suitable bioinformatics tools to study complex systems such as phytocomplexes, whose characteristics cannot be considered as the mere average of the properties of the individual components [37].

5. Conclusions

Eight cultivars of pomegranate peel, collected from different South Italian accessions in the same harvesting year, were chemically compared. The composition of their bioactive specialized metabolites was investigated, with a focus on ellagitannins and flavonoids, including anthocyanins. The main components were also quantified. Qualitative profiles obtained for both ellagitannins and flavonoids were almost superimposable; on the other hand, the quantitative analysis showed some variability. Antioxidant data were generally good for the majority of the accessions. Results of anti-inflammatory activity confirmed that pomegranate by-product extracts could be particularly interesting for the prevention of inflammation since they strongly inhibited IL-1β, while reducing IL-6 secretion. Overall, these data suggested a potential synergic antioxidant and anti-inflammatory effect of the pomegranate peel extracts. PCA analysis highlighted punicalagin a and b, granatin, trisgalloyl iso 2, and galloyl pentoside as the metabolites mainly responsible for the total variance, whereas HCL evidenced the presence of two distinct groups, with M4 and M10 varieties showing a divergent attitude. Finally, a series of compounds, including galloyl- and ellagic acid-based were found to be highly correlated with antioxidant and anti-inflammatory activities. These results open the possibility for the introduction of pomegranate peels into the South Italian by-circular economy in order to reduce their quantity and environmental impact while increasing the cultivation in these unexploited areas. Particularly, the M5 accession, ‘Granato di Aiello del Sabato’, investigated here for the first time, having one of the highest phenolic content and one of the highest ability in reducing IL-1β and IL-6 secretion from macrophages, could be the autochthonous internal areas of Campania region cultivar most suitable for an extensive exploitation. This investigation could ensure the transmission to the farmers and the sustainability and conservation of this genetic material, making it a peculiarity for local companies and obtaining its germplasm protection and constant propagation.

Supplementary Materials

The following supporting information can be downloaded at: https://www.mdpi.com/article/10.3390/antiox11112262/s1, Figure S1: UHPLC-HR-ESI-MS profiles of the M5 sample in the negative ion mode; Figure S2: Heatmap visualization of 45 phenolic compounds detected and quantified in the peel samples; Figure S3. MRM chromatogram acquired in the negative ion mode of standards (A) and P. granatum peel extract (B). Figure S4. MRM chromatogram acquired in the positive ion mode of standards (A) and P. granatum peel extract (B). Figure S5: Heatmap visualization of antioxidant (A) and anti-inflammatory (B) activities of peel samples; Figure S6: Principal component analysis (PCA) according the genotypes of the peel samples. Figure S7. PCA loadings plots of components 1 and 2 (PC1 and PC2), respectively, of chemical data performed on the 14 peel samples. Figure S8. Loadings of PCA from Figures S4. Table S1. Loading (A) and Score (B) plots of chemical data of pomegranate varieties under study from Figure 4. Table S2. Loading (A) and Score (B) plots of chemical data of pomegranate varieties under study from Figure S4. Table S3. List of Pearson correlation coefficients (rs) between each metabolite under study and all the analyzed bioactivities related to antioxidant (ABTS, TEAC, and DPPH) and anti-inflammatory (IL-β, IL-6, and TNF- α) activities.

Author Contributions

Conceptualization, A.B., F.D.P. and N.D.T.; methodology, V.S.; software, C.S. and G.D. (Gianfranco Diretto); validation, G.D. (Giuliana Donadio), V.P. and V.S.; formal analysis, M.L.B.; investigation, F.M. and V.P.; resources, N.D.T.; data curation, V.S.; writing—original draft preparation, C.S. and G.D. (Giuliana Donadio), and V.S.; writing—review and editing, A.B. and N.D.T.; supervision, F.D.P. and G.D. (Gianfranco Diretto); project administration, A.B.; funding acquisition, N.D.T. All authors have read and agreed to the published version of the manuscript.

Funding

This research was funded by the Wilhelm Doerenkamp-Foundation, Chur CH, Natvantage grant 2020 (CES20DETO) and by “I-PRO-MED-Approcci innovativi per bevande e alimenti funzionali con matrici vegetali mediterranee” CUP B12C21000640005; finanziamento Asse I, Azione 1.1.3, PON Imprese e competitività 2014-2020.

Institutional Review Board Statement

Not applicable.

Informed Consent Statement

Not applicable.

Data Availability Statement

Data are contained within the article and supplementary material.

Acknowledgments

The authors wish to thank all companies that provided the pomegranate fruits.

Conflicts of Interest

The authors declare no conflict of interest.

References

  1. Ge, S.; Duo, L.; Wang, J.; Gegen, Z.; Yang, J.; Li, Z.; Tu, Y. A unique understanding of traditional medicine of pomegranate, Punica granatum L. and its current research status. J. Ethnopharmacol. 2021, 271, 113877. [Google Scholar] [CrossRef] [PubMed]
  2. Mphahlele, R.R.; Fawole, O.A.; Stander, M.A.; Opara, U.L. Preharvest and postharvest factors influencing bioactive compounds in pomegranate (Punica granatum L.)—A review. Sci. Hortic. 2014, 178, 114–123. [Google Scholar] [CrossRef]
  3. Caleb, O.J.; Fawole, O.A.; Mphahlele, R.R.; Opara, U.L. Impact of preharvest and postharvest factors on changes in volatile compounds of pomegranate fruit and minimally processed arils—Review. Sci. Hortic. 2015, 188, 106–114. [Google Scholar] [CrossRef]
  4. Calani, L.; Beghè, D.; Mena, P.; Del Rio, D.; Bruni, R.; Fabbri, A.; Dall’Asta, C.; Galaverna, G. Ultra-HPLC-MS(n) (Poly)phenolic profiling and chemometric analysis of juices from ancient Punica granatum L. cultivars: A nontargeted approach. J. Agric. Food Chem. 2013, 61, 5600–5609. [Google Scholar] [CrossRef]
  5. El-Shamy, S.; Farag, M.A. Novel trends in extraction and optimization methods of bioactives recovery from pomegranate fruit biowastes: Valorization purposes for industrial applications. Food Chem. 2021, 365, 130465. [Google Scholar] [CrossRef]
  6. Fahmy, H.A.; Farag, M.A. Ongoing and potential novel trends of pomegranate fruit peel; a comprehensive review of its health benefits and future perspectives as nutraceutical. J. Food Biochem. 2022, 46, e14024. [Google Scholar] [CrossRef]
  7. Parisi, V.; Vassallo, A.; Pisano, C.; Signorino, G.; Cardile, F.; Sorrentino, M.; Colelli, F.; Fucci, A.; D’Andrea, E.G.; De Tommasi, N.; et al. A herbal mixture from propolis, pomegranate, and grape pomace endowed with anti-inflammatory activity in an in vivo rheumatoid arthritis model. Molecules 2020, 25, 2255. [Google Scholar] [CrossRef]
  8. De Leo, M.; Iannuzzi, A.M.; Germanò, M.P.; D’Angelo, V.; Camangi, F.; Sevi, F.; Diretto, G.; De Tommasi, N.; Braca, A. Comparative chemical analysis of six ancient italian sweet cherry (Prunus avium L.) varieties showing antiangiogenic activity. Food Chem. 2021, 360, 129999. [Google Scholar] [CrossRef]
  9. Kedare, S.B.; Singh, R.P. Genesis and development of DPPH method of antioxidant assay. J. Food Sci. Technol. 2011, 48, 412–422. [Google Scholar] [CrossRef] [Green Version]
  10. Re, R.; Pellegrini, N.; Proteggente, A.; Pannala, A.; Yang, M.; Rice-Evans, C. Antioxidant activity applying an improved ABTS radical cation decolorization assay. Free Radic. Biol. Med. 1999, 26, 1231–1237. [Google Scholar] [CrossRef]
  11. Wolfe, K.L.; Liu, R.H. Cellular Antioxidant Activity (CAA) assay for assessing antioxidants, foods, and dietary supplements. J. Agric. Food Chem. 2007, 55, 8896–8907. [Google Scholar] [CrossRef] [PubMed]
  12. Ahrazem, O.; Diretto, G.; Rambla, J.; Rubio-Moraga, A.; Lobato-Gómez, M.; Frusciante, S.; Argandoña, X.; Presa, S.; Granell, A.; Gómez-Gómez, L. Engineering high levels of saffron apocarotenoids in tomato. Hortic. Res. 2022, 9, uhac074. [Google Scholar] [CrossRef] [PubMed]
  13. Aversano, R.; Contaldi, F.; Adelfi, M.G.; D’Amelia, V.; Diretto, G.; De Tommasi, N.; Vaccaro, C.; Vassallo, A.; Carputo, D. Comparative metabolite and genome analysis of tuber-bearing potato species. Phytochemistry 2017, 137, 42–51. [Google Scholar] [CrossRef] [PubMed]
  14. Boulekbache-Makhlouf, L.; Meudec, E.; Chibane, M.; Mazauric, J.-P.; Slimani, S.; Henry, M.; Cheynier, V.; Madani, K. Analysis by high-performance liquid chromatography diode array detection mass spectrometry of phenolic compounds in fruit of Eucalyptus globulus cultivated in Algeria. J. Agric. Food Chem. 2010, 58, 12615–12624. [Google Scholar] [CrossRef]
  15. Brighenti, V.; Groothuis, S.F.; Prencipe, F.P.; Amir, R.; Benvenuti, S.; Pellati, F. Metabolite fingerprinting of Punica granatum L. (pomegranate) polyphenols by means of high-performance liquid chromatography with diode array and electrospray ionization-mass spectrometry detection. J. Chromatogr. A 2017, 1480, 20–31. [Google Scholar] [CrossRef]
  16. Mena, P.; Calani, L.; Dall’Asta, C.; Galaverna, G.; García-Viguera, C.; Bruni, R.; Crozier, A.; Del Rio, D. Rapid and comprehensive evaluation of (poly) phenolic compounds in pomegranate (Punica granatum L.) juice by UHPLC-MSn. Molecules 2012, 17, 14821–14840. [Google Scholar] [CrossRef] [Green Version]
  17. Russo, V.; Continella, A.; Drago, C.; Gentile, A.; La Malfa, S.; Leotta, C.G.; Pulvirenti, L.; Ruberto, G.; Pitari, G.M.; Siracusa, L. Secondary metabolic profiles and anticancer actions from fruit extracts of immature pomegranates. PLoS ONE 2021, 16, e0255831. [Google Scholar] [CrossRef]
  18. Singh, A.; Bajpai, V.; Kumar, S.; Sharma, K.R.; Kumar, B. Profiling of gallic and ellagic acid derivatives in different plant parts of Terminalia arjuna by HPLC-ESI-QTOF-MS/MS. Nat. Prod. Commun. 2016, 11, 1934578X1601100227. [Google Scholar] [CrossRef] [Green Version]
  19. Wu, S.; Tian, L. Diverse phytochemicals and bioactivities in the ancient fruit and modern functional food pomegranate (Punica granatum). Molecules 2017, 22, 1606. [Google Scholar] [CrossRef] [Green Version]
  20. Sumner, L.W.; Amberg, A.; Barrett, D.; Beale, M.H.; Beger, R.; Daykin, C.A.; Fan, T.W.-M.; Fiehn, O.; Goodacre, R.; Griffin, J.L.; et al. Proposed minimum reporting standards for chemical analysis: Chemical Analysis Working Group (CAWG) Metabolomics Standards Initiative (MSI). Metabolomics 2007, 3, 211–221. [Google Scholar] [CrossRef]
  21. Nariya, P.B.; Bhalodia, N.R.; Shukla, V.J.; Acharya, R.; Nariya, M.B. In vitro evaluation of antioxidant activity of Cordia dichotoma (Forst f.) bark. Ayu 2013, 34, 124–128. [Google Scholar] [CrossRef] [PubMed] [Green Version]
  22. Jiménez, I.; Sánchez-Moreno, C.; Saura-Calixto, F. Evaluation of free radical scavenging of dietary carotenoids by the stable radical 2,2-diphenyl-1-picrylhydrazyl. J. Sci. Food Agric. 2000, 80, 1686–1690. [Google Scholar] [CrossRef]
  23. Huang, D.; Ou, B.; Prior, R.L. The chemistry behind antioxidant capacity assay. J. Agric. Food Chem. 2005, 53, 1841–1856. [Google Scholar] [CrossRef] [PubMed]
  24. Zhong, Y.; Shahidi, F. Methods for the assessment of antioxidant activity in foods. In Handbook of Antioxidants for Food Preservation, 1st ed.; Shadidi, F., Ed.; Elsevier: Amsterdam, The Netherlands, 2015; pp. 287–333. [Google Scholar] [CrossRef]
  25. Ferraccioli, G.; Bracci-Laudiero, L.; Alivernini, S.; Gremese, E.; Tolusso, B.; De Benedetti, F. Interleukin-1β and interleukin-6 in arthritis animal models: Roles in the early phase of transition from acute to chronic inflammation and relevance for human rheumatoid arthritis. Mol. Med. 2010, 16, 552–557. [Google Scholar] [CrossRef]
  26. Ahmed, S.; Wang, N.; Hafeez, B.B.; Cheruvu, V.K.; Haqqi, T.M. Punica granatum L. extract inhibits IL-1β–induced expression of matrix metalloproteinases by inhibiting the activation of MAP kinases and NF-κB in human chondrocytes in vitro. J. Nutr. 2005, 135, 2096–2102. [Google Scholar] [CrossRef] [Green Version]
  27. Jarlborg, M.; Gabay, C. Systemic effects of IL-6 blockade in rheumatoid arthritis beyond the joints. Cytokine 2022, 149, 155742. [Google Scholar] [CrossRef]
  28. Buriani, A.; Fortinguerra, S.; Sorrenti, V.; Caudullo, G.; Carrara, M. Essential oil phytocomplex activity, a review with a focus on multivariate analysis for a network pharmacology-informed phytogenomic approach. Molecules 2020, 25, 1833. [Google Scholar] [CrossRef] [Green Version]
  29. Campos, L.; Seixas, L.; Henriques, M.H.F.; Peres, A.M.; Veloso, A.C. Pomegranate peels and seeds as a source of phenolic compounds: Effect of cultivar, by-Product, and extraction solvent. Int. J. Food Sci. 2022, 18, 9189575. [Google Scholar] [CrossRef]
  30. Aslam, M.N.; Lansky, E.P.; Varani, J. Pomegranate as a cosmeceutical source: Pomegranate fractions promote proliferation and procollagen synthesis and inhibit matrix metalloproteinase-1 production in human skin cells. J. Ethnopharmacol. 2006, 103, 311–318. [Google Scholar] [CrossRef]
  31. Xiang, Q.; Li, M.; Wen, J.; Ren, F.; Yang, Z.; Jiang, X.; Chen, Y. The bioactivity and applications of pomegranate peel extract: A review. J. Food Biochem. 2022, 46, e14105. [Google Scholar] [CrossRef]
  32. Yang, L.; Wen, K.S.; Ruan, X.; Zhao, Y.X.; Wei, F.; Wang, Q. Response of plant secondary metabolites to environmental factors. Molecules 2018, 23, 762. [Google Scholar] [CrossRef] [PubMed] [Green Version]
  33. Cano-Lamadrid, M.; Galindo, A.; Collado-González, G.; Rodríguez, P.; Cruz, Z.; Legua, P.; Burló, F.; Morales, D.; Carbonell-Barrachina, A.A.; Hernández, F. Influence of deficit irrigation and crop load on the yield and fruit quality in Wonderful and Mollar de Elche pomegranates. J. Sci. Food Agric. 2018, 98, 3098–3108. [Google Scholar] [CrossRef] [PubMed]
  34. Cano-Lamadrid, M.; Viuda-Martos, M.; García-Garví, J.; Clementevillalba, J.; Carbonell-Barrachina, A.A.; Sendra, E. Polyphenolic profile and antimicrobial potential of peel extracts obtained from organic pomegranate (Punica granatum L.) variety “mollar de elche”. Acta Hortic. Regiotect. 2020, 1, 1–4. [Google Scholar] [CrossRef]
  35. Cano-Lamadrid, M.; Marhuenda-Egea, F.C.; Hernández, F.; Rosas-Burgos, E.C.; Burgos-Hernández, A.; Carbonell-Barrachina, A.A. Biological activity of conventional and organic pomegranate juices: Antioxidant and antimutagenic potential. Plant Foods Hum. Nutr. 2016, 71, 375–380. [Google Scholar] [CrossRef]
  36. Balli, D.; Cecchi, L.; Khatib, M.; Bellumori, M.; Cairone, F.; Carradori, S.; Zengin, G.; Cesa, S.; Innocenti, M.; Mulinacci, N. Characterization of arils juice and peel decoction of fifteen varieties of Punica granatum L.: A focus on anthocyanins, ellagitannins and polysaccharides. Antioxidants 2020, 9, 238. [Google Scholar] [CrossRef] [Green Version]
  37. Amara, A.; Frainay, C.; Jourdan, F.; Naake, T.; Neumann, S.; Novoa-Del-Toro, E.M.; Salek, R.M.; Salzer, L.; Scharfenberg, S.; Witting, M. Networks and graphs discovery in metabolomics data analysis and interpretation. Front. Mol. Biosci. 2022, 9, 841373. [Google Scholar] [CrossRef]
Figure 1. UHPLC-HR-ESI-MS profiles of the fourteen peel samples M1–M14 (M1 the first up, M-14 the last down) in the negative ion mode.
Antioxidants 11 02262 g001
Figure 2. Cellular antioxidant activity as CAA values of all pomegranate peels (n = 2). Different letters within each column indicate statistically significant differences at p < 0.05 in an ANOVA + Tukey’s pairwise t-test analysis.
Antioxidants 11 02262 g002
Figure 3. Percentage of secretion of IL-1β (A), IL-6 (B), and TNF-α (C) from LPS-stimulated THP-1-derived macrophage cells after 24 h of treatment with M1-M14 extracts. Different letters within each column indicate statistically significant differences at p ≤ 0.05 in an ANOVA + Tukey’s pairwise t-test analysis.
Antioxidants 11 02262 g003
Figure 4. Principal component analysis (PCA) of the metabolites of M1-M14 peel samples. Component 1 and 2 explained, respectively, 77.8% and 14.4% of the total variance.
Antioxidants 11 02262 g004
Figure 5. Hierarchical clustering (HCL) analysis of chemical data from peel pomegranate samples. HCL was calculated on columns by applying the One Minus Pearson correlation with the average linkage algorithm and evidencing the presence of specific clusters. Increasing intensity of the red color is directly proportional to compound intensity. The data represent, for each, LC-MS signal intensities and are expressed as average values/100,000,000.
Antioxidants 11 02262 g005
Table 1. Cultivars and collection area of the fourteen Punica granatum samples.
Sample Collection AreaCultivarsCompany
M1Benevento, Campania regionDente di cavalloCaruso
M2Palomonte, Campania regionDente di cavalloRosso Granato
M3Sicignano degli Alburni, Campania regionWonderfulRosso Granato
M4Palomonte, Campania regionWonderful OneRosso Granato
M5Aiello del Sabato, Campania regionGranato di Aiello del SabatoGiovomel
M6Pietrelcina, Campania regionDente di cavalloSalgliocca
M7Acri, Calabria regionDente di cavalloCofone
M8Tursi, Basilicata regionDente di cavalloFrancolino
M9Forchia, Campania regionHicazErarslanFarm
M10Caserta, Campania regionWonderful precoceLuce
M11Altavilla silentina, Campania regionDente di cavalloDe Matteis
M12Altavilla silentina, Campania regionMollar de ElcheDe Matteis
M13Telese, Campania regionParfiankaTroiano
M14Grottaminarda, Campania regionWonderfulBruno
Table 2. UHPLC-HR-ESI-MS/MS data of compounds detected in pomegranate peels M1-M14.
tR (min)[M-H]2−/[M-H]MS2CompoundMSI Status a
12.1481.0632300.9991, 275.0185HHDP b-hexoside 12
22.8481.0632300.9991, 275.0185HHDP-hexoside 22
33.0331.0680271.0449, 211.0239, 169.0143Galloyl-hexoside 12
43.5331.0680271.0449, 211.0239, 169.0143Galloyl-hexoside 22
53.9649.0705300.9991, 497.0575Galloyl-HHDP-gluconate2
64.0633.0752481.0630, 300.9991, 249.0407, 275.0185HHDP-galloyl-hexoside2
74.2169.0138125.0249Gallic acid1
84.3331.0680271.0449, 211.0239, 169.0143Galloyl-hexoside 32
94.4483.0798331.0671, 313.0566, 169.0143Digalloyl-hexoside2
104.6–4.8781.0555721.0330, 600.9907, 475.0361 Punicalin1
114.9483.0798331.0671, 313.0566, 169.0143Digalloyl-hexoside isomer2
125.7633.0752481.0630, 300.9991, 249.0407, 275.0185HHDP-galloyl-hexoside isomer2
136.0391.0321/783.0712765.0588, 721.0330, 481.0630, 300.9991Casuariin2
146.1541.0272/1083.0630807.0330, 721.0330, 600.9907, 510.0260, 275.0185Punicalagin isomer 12
156.5649.0705300.9991, 497.0575Galloyl-HHDP-gluconate2
166.8541.0272/1083.0630807.0330, 721.0330, 600.9907, 510.0260, 275.0185Punicalagin isomer 22
177.1483.0798331.0671, 313.0566, 169.0143Digalloyl-hexoside isomer2
187.2466.0299/933.0679915.0552, 781.0550, 721.0330, 600.9907, 300.9991Castalagin2
197.8391.0321/783.0712631.0589, 481.0630, 300.9991Pedunculagin2
207.9707.0647/1415.1368783.0690, 613.0480, 633.0739, 300.9991Di (HHDPgalloyl-hexoside)-pentoside2
218.3305.0675125.0249, 137.0250Gallocatechin2
228.4466.0299/933.0679781.0550, 631.0589, 450.9945, 425.0153, 300.9991, 275.01852-O-Galloylpunicalin2
2312.9541.0272/1083.0630781.0550, 600.9907, 300.9991, 275.0185Punicalagin A1
2414.3391.0318/783.0708631.0589, 481.0630, 300.9991Pedunculagin isomer2
2514.5951.0767907.0867, 783.0690, 605.0800, 481.0630, 300.9991Trisgalloyl HHDP-hexoside2
2615.3632.0670/1265.1423783.0690, 481.0630Pedunculagin-I-der2
2716.2392.0392/785.0859300.9991, 275.0185, 249.0407, 169.0143Digallolyl HHDP-hexoside2
2816.3541.0272/1083.0630781.0550, 600.9907, 300.9991, 275.0185Punicalagin B1
2917.4799.0657781.0550, 479.0476, 300.9991Granatin A2
3018.2467.0374/935.0822917.0711, 783.0690, 633.0739, 571.0740Galloyl-bis-HHDP-hexoside (casuarinin)2
3118.3400.0371/801.0814649.0681, 499.0724, 347.0623, 300.9991Punigluconin2
3218.4783.0718/1567.1511765.0588, 300.9991Digalloyl triHHDP-dihexoside2
3319.2392.0392/785.0859300.9991, 275.0185, 249.0407, 169.0143Digallolyl-HHDP-hexoside2
3419.2542.0355/1085.0795783.0690, 765.0588, 300.9991Digalloyl-gallagyl-hexoside 2
3519.6542.0355/1085.0795783.0690 765.0588, 300.9991Digalloyl-gallagyl-hexoside isomer2
3619.8633.0752481.0630, 300.9991, 249.0407, 275.0185HHDP galloyl-hexoside isomer2
3720.6463.0530300.9991Ellagic acid hexoside2
3822.7951.0767933.0668, 765.0588, 613.0480, 445.0425, 300.9991Trisgalloyl HHDP-hexoside2
3923.6787.1035635.0883, 617.0779, 465.0671, 447.0562Tetragalloyl-hexoside isomer 12
4023.7392.0392/785.0859300.9991, 275.0185, 249.0407, 169.0143Digallolyl HHDP hexoside2
4123.8433.0428299.9917, 300.9991Ellagic acid-pentoside2
4224.0447.0580300.9991, 300.9991Ellagic acid-deoxyhexoside2
4324.2787.1035635.0883, 617.0779, 465.0671, 447.0562Tetragalloyl-hexoside isomer 22
4424.6787.1035635.0883, 617.0779, 465.0671, 447.0562Tetragalloyl-hexoside isomer 32
4524.7609.1458301.0356Rutin1
4624.8300.9995257.0094, 229.0146, 185.0249Ellagic acid1
4725.5463.0902301.0356Quercetin-hexoside2
4826.3939.1158787.1030, 635.0883Pentagalloyl-hexoside 2
4926.8593.1534447.0948, 285.0400Kaempferol-rutinoside2
5027.8447.0948285.0400Kaempferol-hexoside2
5128.4431.0999269.0447Apigenin 7-O-glucoside1
5228.7431.0999269.0447Apigenin-hexoside2
5329.1417.0843285.0400Kaempferol-pentoside2
5429.8447.0948285.0400Luteolin 7-O-glucoside1
5529.9417.0843285.0400Kaempferol pentoside isomer2
a MSI level of identification according to Sumner et al., 2007 [20]. b HHDP, hexahydroxydiphenoyl.
Table 3. Amounts of selected compounds detected in pomegranate peels M1–M14.
Cyanidin 3-O-glucosideDelphinidin 3-O-glucosideEllagic AcidGallic AcidPunicalaginPunicalin
M10.15 ± 0.02nd13.20 ± 1.89 a0.55 ± 0.10 a87.86 ± 20.16 a4.22 ± 0.11 a
M20.13 ± 0.01nd7.07 ± 2.29 bc0.71 ± 0.01 ac72.91 ± 18.59 a3.43 ± 0.41 a
M30.35 ± 0.01nd8.19 ± 1.68 acd0.75 ± 0.02 ad93.86 ± 22.66 a3.85 ± 0.29 a
M40.34 ± 0.01nd5.65 ± 1.39 bde0.65 ± 0.02 a58.16 ± 9.72 a2.27 ± 0.22 a
M50.17 ± 0.01nd11.55 ± 0.69 af0.77 ± 0.04 a107.28 ± 3.86 ac3.70 ± 0.11 a
M60.14 ± 0.01nd13.80 ± 2.51 a1.52 ± 0.06 b85.16 ± 11.90 a6.73 ± 0.46 ab
M70.14 ± 0.01nd14.67 ± 0.92 a0.68 ± 0.01 ah142.38 ± 4.16 bd6.58 ± 0.74 ab
M80.12 ± 0.01nd12.66 ± 1.76 a0.96 ± 0.01 bcdh112.79 ± 5.01 acd4.22 ± 0.45 a
M90.47 ± 0.05nd7.15 ± 0.56 bdfg0.47 ± 0.01 afi85.04 ± 6.85 a4.04 ± 0.66 a
M100.44 ± 0.03nd4.60 ± 0.30 bdh0.36 ± 0.01 afi89.79 ± 1.57 a3.02 ± 0.21 a
M110.13 ± 0.01nd11.96 ± 0.68 acg0.20 ± 0.03 bdgij83.35 ± 6.90 a3.43 ± 0.61 a
M120.11 ± 0.01nd8.64 ± 0.54 aceghi0.41 ± 0.01 af80.65 ± 2.42 a3.30 ± 0.27 a
M131.99 ± 0.050.52 ± 0.084.62 ± 0.1 bdi0.33 ± 0.01 ae52.38 ± 5.99 a2.36 ± 0.23 a
M140.61 ± 0.07nd5.87 ± 0.40 bdi0.56 ± 0.01 ac59.32 ± 5.37 a2.50 ± 0.27 a
Data are expressed as mg of compounds in g of dried hydroalcoholic extract ± standard deviation. Different letters within each column indicate statistically significant differences at p ≤ 0.05 in an ANOVA + Tukey’s pairwise t-test analysis.
Table 4. Antioxidant activities of pomegranate peels M1-M14. Different letters within each column indicate statistically significant differences at p ≤ 0.05 in an ANOVA and Tukey’s pairwise t-test analysis.
SampleDPPH TEAC mMABTS TEAC mM
M145.8 ± 4.1 a7.4 ± 0.2 a
M253.3 ± 5.3 ac8.4 ± 0.1 b
M372.8 ± 6.1 b10.3 ± 0.1 bc
M449.7 ± 6.1 ad10.2 ± 0.1 bc
M567.4 ± 4.5 a7.6 ± 0.2 a
M645.3 ± 3.6 a8.5 ± 0.1 b
M763.1 ± 3.9 bc10.2 ± 0.1 bc
M859.6 ± 5.5 bcd8.4 ± 0.1 b
M960.6 ± 5.4 bcd9.4 ± 0.2 bcd
M1059.2 ± 5.1 bcde10.2 ± 0.1 bc
M1148.3 ± 2.3 ae9.3 ± 0.2 bcd
M1247.3 ± 6.8 a8.2 ± 0.2 b
M1340.1 ± 5.9 a9.4 ± 0.1 bcd
M1470.0 ± 9.1 b13.3 ± 0.2 bcde
Values are expressed as means ± standard deviation (n = 3). TEAC (Trolox equivalent antioxidant capacity) is expressed as mM Trolox equivalent. DPPH: 2,2-diphenyl-1-picrylhydrazyl. ABTS: 2,20-azino-bis (3-ethylbenzothiazoline-6-sulphonic acid). Different letters within each column indicate statistically significant differences at p ≤ 0.05 in an ANOVA + Tukey’s pairwise t-test analysis.
Table 5. Pearson correlation coefficients (ρs) between metabolites and (A) antioxidants and (B) anti-inflammatory activities of pomegranate peel extracts. Only negative statistically significant correlations (p ≤ 0.260; *: p ≤ 0.05; **: 0.01 ≤ p ≤ 0.05; ***: p ≤ 0.001) were reported. Blue color intensity is directly proportional to Pearson coefficient significance.
(A)
ABTS TEACDPPH Assay
ρ
Granatin−0.485 ***−0.557 ***
Trisgalloyl iso 2−0.469 ***−0.491 ***
HHDP iso 2−0.464 ***0.180
Casuarinin−0.441 **−0.137
Digalloyl HHDP iso 3−0.364 **−0.160
Galloyl-hexoside iso 1−0.351 **0.260
Ellagic acid−0.319 *−0.436 **
Pedunculagin−0.313 *0.103
Galloyl-hexoside iso 3−0.312 *−0.084
HHDP iso 1−0.303 *−0.035
Digalloyl iso 3−0.288 *0.243
Pedunculagin iso 2−0.269 *0.373
Galloyl-hexoside iso 3−0.260−0.141
(B)
IL-1βIL-6TNF-α
ρ
Galloyl-hexoside iso 2−0.900 ***0.022−0.374 **
Pedunculagin−0.728 ***−0.057−.591 ***
HHDP iso 2−0.677 ***0.083−0.323 *
Pedunculagin iso 2−0.673 ***0.042−0.310 *
Punicalagin iso 2−0.600 ***−0.060−0.634 ***
Pedunculagin iso 1−0.588 ***−0.096−0.295 *
Trisgalloyl iso 1−0.582 ***−0.085−0.460 ***
Galloyl-gluconate iso 2−0.555 ***−0.222−0.359 **
Galloylpunicalin−0.544 ***−0.092−0.576 ***
Digalloyl−0.520 ***−0.112−0.436 **
Digalloyl HHDP iso 2−0.518 ***0.131−0.273 *
Castalagin−0.515 ***−0.127−0.615 ***
Casuarinin−0.499 ***−0.248−0.454 ***
Punicalagin iso 1−0.489 ***−0.241−0.703 ***
Galloyl-gluconate iso 1−0.446 **−0.296 *−0.382 **
Ellagic acid deoxy−0.438 **−0.361 **−0.545 ***
Ellagic acid pentoside−0.429 **−0.356 **−0.504 ***
Digalloyl gallagyl iso 1−0.416 **−0.381 **−0.109
Digalloyl gallagyl iso 2−0.410 **−0.402 **−0.108
Digalloyl HHDP iso 3−0.403 **−0.500 ***−0.221
Casuariin−0.395 **−0.298 *−0.133
Galloyl-hexoside iso 3−0.268 *−0.470 ***−0.038
Ellagic acid hexoside−0.217−0.329 *−0.485 ***
Digalloyl iso 2−0.127−0.376 **−0.376 **
Publisher’s Note: MDPI stays neutral with regard to jurisdictional claims in published maps and institutional affiliations.

