Article

Characterization of Anthocyanins and Their Antioxidant Activities in Indian Rose Varieties (Rosa × hybrida) Using HPLC

1
ICAR-Indian Agricultural Research Institute, New Delhi 110012, India
2
Division of Agrotechnology, CSIR-Institute of Himalayan Bioresource Technology, Palampur 176061, Himachal Pradesh, India
3
ICAR-Directorate of Floricultural Research, Pune 411005, Maharashtra, India
4
ICAR-National Bureau of Agriculturally Important Microorganisms, Kushmaur, Maunath Bhanjan 275101, Uttar Pradesh, India
5
ICAR-Indian Grassland and Fodder Research Institute, Himachal Pasturelands, Palampur 176061, Himachal Pradesh, India
6
Department of Microbiology, Lovely Professional University, Phagwara 144411, Punjab, India
7
Department of Food Technology and Nutrition, Lovely Professional University, Phagwara 144411, Punjab, India
8
Department of Food Engineering, University of Agricultural Sciences and Veterinary Medicine of Cluj Napoca, Calea Mănăstur 3–5, 400372 Cluj-Napoca, Romania
9
Department of Chemical Engineering, Faculty of Chemistry and Chemical Engineering, Babeş-Bolyai University, 11 Arany Janos Street, 400028 Cluj-Napoca, Romania
10
Interdisciplinary Research Institute on Bio-Nano-Sciences, Babeş-Bolyai University, 42 Treboniu Laurian Street, 400271 Cluj-Napoca, Romania
*
Authors to whom correspondence should be addressed.
Antioxidants 2022, 11(10), 2032; https://doi.org/10.3390/antiox11102032
Submission received: 23 August 2022 / Revised: 10 October 2022 / Accepted: 10 October 2022 / Published: 14 October 2022

Abstract

:
The present study was designed to explore the anthocyanin profile and antioxidant activities in Indian rose varieties (Rosa × hybrida). Among fifty varieties, Ashwini recorded the highest total phenolic content (427.59 ± 3.47 mg GAE/100 g) along with the highest FRAP (397.15 ± 0.82 µmol trolox/g) and DPPH free radical scavenging activity (93.47 ± 0.19%) on a fresh weight basis. A significant positive correlation was observed between total anthocyanin content, total phenolic content, and antioxidant activities. Four distinct clusters were formed according to total anthocyanins, total phenols, and antioxidant activities; white- and yellow-colored varieties were most distant from red ones. Principal component analysis revealed that variable total anthocyanin content contributed to the maximum variation among the fifty rose varieties studied. Highly anthocyanin-rich rose varieties were characterized by high-performance liquid chromatography coupled with a photodiode array detector (HPLC-PAD), which identified two major components of anthocyanins, i.e., cyanidin 3,5-di-O-glucoside and pelargonidin 3,5-di-O-glucoside. Cyanidin 3,5-di-O-glucoside was the predominant anthocyanin in red- and pink-colored varieties, whereas pelargonidin 3,5-di-O-glucoside was the major one in the orange variety. The maximum cyanidin 3,5-di-O-glucoside content was recorded in variety Ashwini (497.79 mg/100 g), whereas the maximum pelargonidin 3,5-di-O-glucoside content was recorded in Suryakiran (185.43 mg/100 g). It is suggested that the rose varieties with high anthocyanin content and antioxidant activity can be exploited as a potential source of nutraceuticals in the food industry.

1. Introduction

Rose (Rosa × hybrida) is one of the most stunning flowers of the Rosaceae family, comprising more than 200 species, which are widely distributed throughout the Northern Hemisphere [1,2]. It has a wide variety of color spectra, ranging from delicate whites, yellows, and pinks to strong purple, orange, and red tones, primarily due to the presence of anthocyanin pigments [3,4]. The flower is also well known for its palatable nature and has been devoured for a long time in teas, cakes, and flavor extracts, as well as being a traditional remedy to treat blood circulation conditions and control cancer growth [5,6,7]. Anthocyanins, a significant constituent of the characteristic food colorants belonging to the flavonoid family, are a group of water-soluble pigments that are structurally composed of an aglycone anthocyanidin and sugar moieties. They are responsible for the attractive colors of different fruits, blossoms, and vegetables; moreover, their explicit tone depends upon co-pigments, metal ions, and pH [8,9]. To date, more than 635 anthocyanins have been distinguished, including six common aglycones (cyanidin, peonidin, pelargonidin, malvidin, delphinidin, and petunidin). Anthocyanins do not only provide nature with striking colors; they also have various health-beneficial effects. Previous reports have shown that anthocyanins have high radical scavenging potential and play a vital role in the prevention of cardiovascular diseases, obesity, cancer, diabetes, and other health problems [10]. The phenolic hydroxyl groups in the molecule are responsible for the high antioxidant activity of anthocyanins. The phenolic hydroxyl group can effectively preclude peroxidation by providing a hydrogen atom that can remove free radicals and therefore break down the oxidation chain reaction. Anthocyanins are safe and nontoxic pigments [11]. Various studies have indicated that anthocyanins from rose petals exhibit potent anti-inflammatory, antioxidant, anticancer, antimicrobial, and antiallergic properties that can be utilized in functional foods and cosmetics [6,12,13,14,15,16]. Research on anthocyanins has attracted the utmost attention in recent years, particularly their isolation and purification in some fruits and vegetable crops. In contrast, there have been few studies on flower crops that are well known for the presence of a diverse range of pigments with myriad colors [17]. The potential of anthocyanin pigments from Indian rose varieties, however, is not completely understood. In particular, to the best of our knowledge, former studies have not extensively investigated the anthocyanin profiles and antioxidant activities in Indian rose varieties. Hence, this study was undertaken to profile the anthocyanins and antioxidant activities in rose varieties. The main aim of this study was to search for effective Indian rose varieties having not only high anthocyanin content but also various biological properties. In this paper, we report for the first time the anthocyanin compositions from the petals of Indian edible roses using high-performance liquid chromatography coupled with a photodiode array detector (HPLC-PAD). We also determined individual content in the anthocyanin extracts, as well as antioxidant activity.

2. Materials and Methods
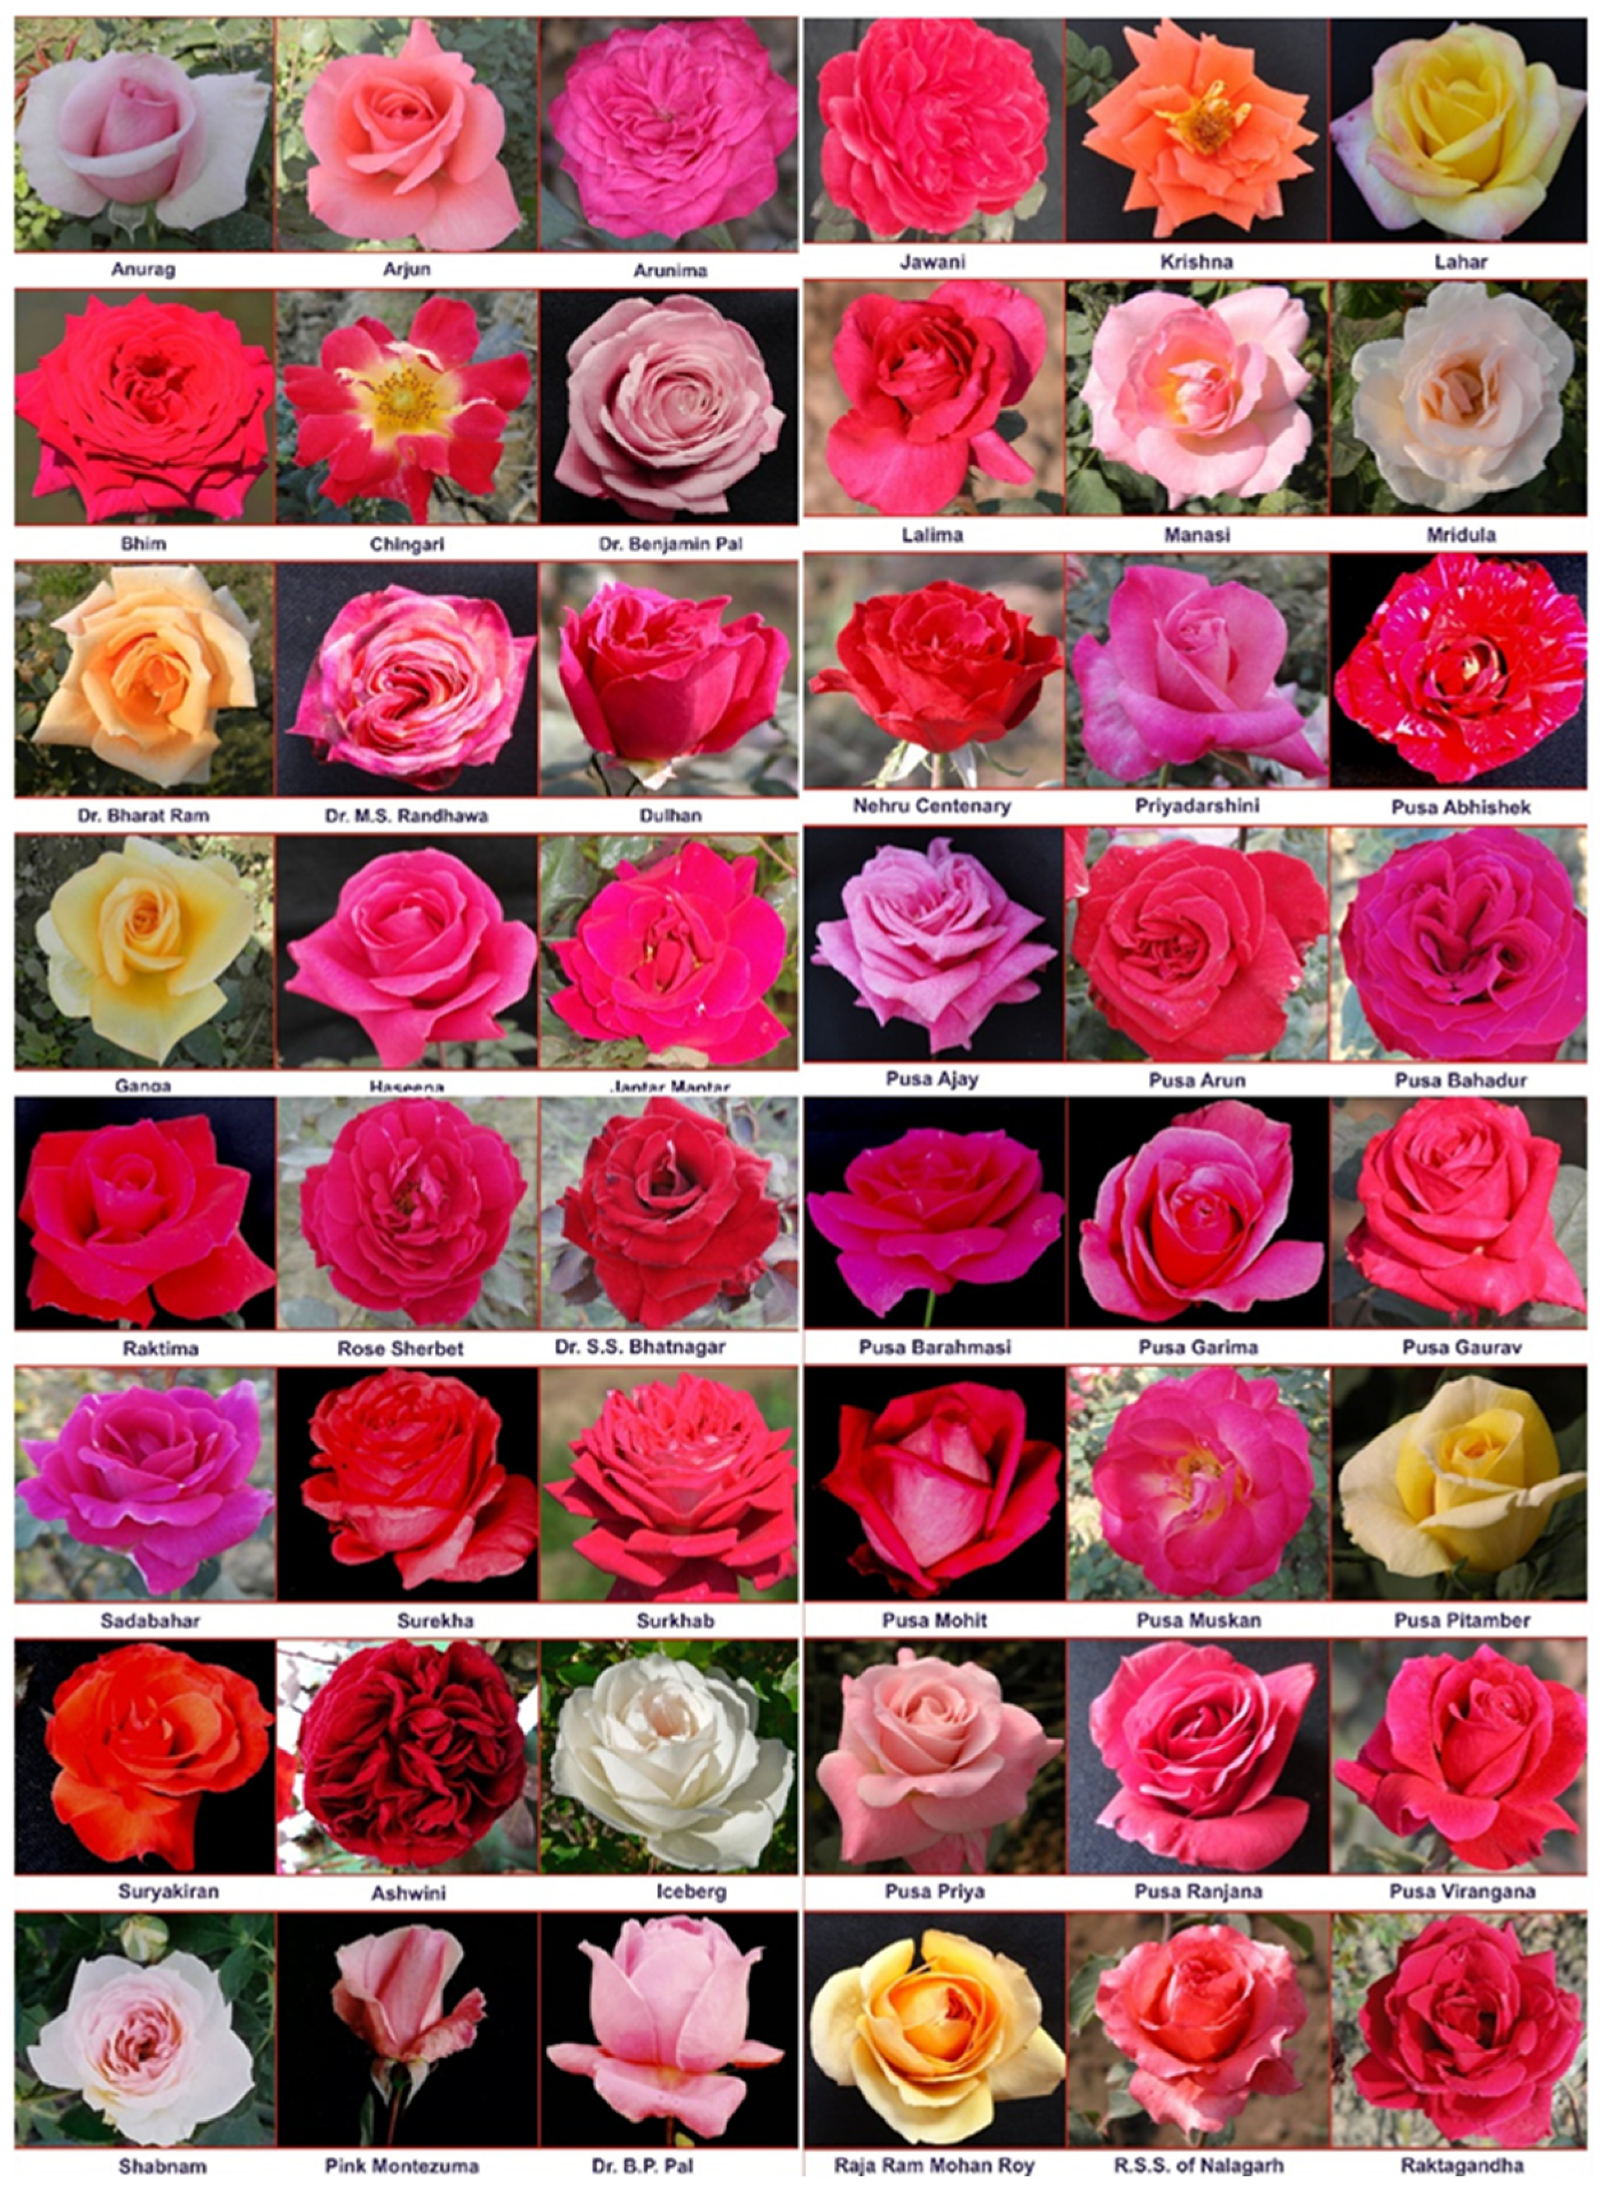
2.1. Plant Material

Fresh rose petals of fifty rose varieties were collected in the morning from 8:00 to 9:00 a.m. from the Research Farm of the Division of Floriculture and Landscaping, ICAR Indian Agricultural Research Institute, New Delhi, during December 2015-16. It is located at latitude 28°38′23″ N, longitude 77°09′27″ E, and altitude 228.61m. Soils are sandy loams with a pH of 7.5-7.9. Forty-nine Indian varieties, namely Pusa Arun, Raktima, Nehru Centenary, Pusa Bahadur, Lalima, Bhim, Ashwini, Dr. S.S. Bhatnagar, Jantar Mantar, Jawani, Raktagandha, Pusa Mohit, Pusa Ajay, Pusa Muskan, Pusa Barahmasi, Pusa Virangana, Pusa Priya, Dr. Bharat Ram, Dr. M. S. Randhawa, Priyadarshini, Dulhan, Dr. B.P. Pal, Anurag, Arjun, Haseena, Raja Surendra Singh of Nalagarh, Sadabahar, Nurjehan, Pink Montezuma, Surekha, Dr. Benjamin Pal, Pusa Ranjana, Arunima, Manasi, Rose Sherbet, Pusa Garima, Pusa Gaurav, Suryakiran, Kiran, Shola, Pusa Pitamber, Lahar, Ganga, Raja Ram Mohan Roy, Pusa Abhishek, Mridula, Chingari, Shabnam, Surkhab, and one exotic variety, viz., Iceberg, were included in the present study (Figure 1 and Table 1). All these varieties were well distinguished from each other on the basis of the Distinctness, Uniformity, and Stability (DUS) testing provided by the Protection of Plant Varieties and Farmers’ Rights Authority (PPV&FRA) India.

2.2. Chemicals

Anthocyanin standards (cyanidin 3,5-di-O-glucoside and pelargonidin 3,5-di-O-glucoside), DPPH (2,2-Diphenyl-1-picrylhydrazyl), and TPTZ (2,4,6-Tris(2-pyridyl)-s-triazine) were obtained from Sigma-Aldrich, St. Louis, Missouri, USA. Methanol and acetonitrile for high-performance liquid chromatography coupled with photodiode array detector (HPLC- PAD) were of chromatographic grade, and all the other reagents were of analytical grade.

2.3. Histological Studies of Anthocyanin Pigments in Rose

Fifty varieties of rose were screened for total anthocyanin content in two different seasons [4]. Thirteen varieties with high anthocyanin content from red, pink, and orange color groups (Ashwini, Dr. S.S. Bhatnagar, Rose Sherbet, Bhim, Pusa Ajay, Nehru Centenary, Suryakiran, Pusa Arun, Raktima, Raktagandha, Pusa Virangana, Pusa Bahadur, and Surkhab) were analyzed histologically for the distribution of anthocyanin pigments. Cross-sections of rose petals of different varieties were examined using a Carl Zeiss Discovery v8 Stereo microscope (Carl Zeiss Microimaging GmbH, Berlin, Germany) and images were captured with a Carl Zeiss Axiovision digital camera (software version: Axiovision 4.8.2).

2.4. Determination of Total Phenolic Content (TPC)

Total phenolic content was assessed according to the procedure given by Singleton and Rossi [18], with slight modifications. A 0.5 g fresh flower sample was extracted with 20 mL 80% methanol. An aliquot (1 mL) of the extract was taken in a test tube and 2.9 mL of Folin and Ciocalteau’s Phenol Reagent (1N) was added, followed by the addition of 0.5 mL of distilled water, and all the tubes were shaken well. Then, 2 mL of sodium carbonate (20%) solution was added to all the tubes and incubated at room temperature for 30 min in the dark. The color developed was read in a spectrophotometer at 750 nm wavelength. The total phenolic content was expressed as mg of gallic acid equivalent (GAE) per gram.

2.5. Determination of Antioxidant Activities

2.5.1. Sample Extraction

Each 0.5 g fresh flower sample was extracted with 20 mL of 80% ethanol. The extract was centrifuged at 10,000 rpm at 4 °C for 20 min. The supernatant was taken for determination of total antioxidant activity by FRAP (Ferric Reducing Antioxidant Potential) and DPPH (2, 2-Diphenyl-1-picrylhydrazyl).

2.5.2. Ferric Reducing Antioxidant Potential (FRAP)

The antioxidant activity of rose petals was estimated using the FRAP (Ferric Reducing Antioxidant Potential) method as described by Benzie and Strain [19]. FRAP reagent was prepared by mixing 300 mM acetate buffer pH 3.6, 10 mL TPTZ in 40 mM HCl, TPTZ (2, 4, 6-tripyridyl-s- triazine), and 20 mM ferric chloride (FeCl3.6H2O) in the ratio of 10:1:1, which was freshly prepared on the same day. The ethanolic extract (0.1 mL) of the flower sample was taken in a test tube and 3 mL of working FRAP reagent was added. Then, the tubes were kept for incubation at room temperature for 4-5 min. The blue color thus developed was read in a spectrophotometer at 593 nm, using the FRAP reagent as a blank, and expressed as μmol of Trolox equivalents per gram of sample. The standard curve was prepared using FeSO4 as standard. Different concentrations of FeSO4 were prepared and optical density was read at 593 nm. Based on the standard curve, concentrations of samples were calculated.

2.5.3. DPPH Free Radical Scavenging Activity

This method is based on the reduction of DPPH, a stable free radical. The antioxidant activity of rose petal extracts was estimated using the DPPH assay described by Braca et al. [20]. Ethanolic extract (0.1 mL) of the sample was added to 3.9 mL of 0.0025 M DPPH (2, 2-Diphenyl-1-picrylhydrazyl) in methanol (70%). The mixture was shaken and kept for 30 min in the dark at room temperature. Absorbance was recorded at 517 nm in a spectrophotometer. The percentage inhibition of activity was calculated by the following formula:
Percent inhibition (%) = [(Ao − Ae)/Ao] × 100
(Ao = absorbance without extract; Ae = absorbance with extract).

2.6. HPLC Analysis of Anthocyanin Composition of Rose

Fifty varieties of rose were screened for total anthocyanin content in two different seasons by Kumari et al. [4]. Varieties with high anthocyanin content from red, pink, and orange color groups (Ashwini, Pusa Arun, Nehru Centenary, Dr. S.S. Bhatnagar, Raktima, Raktagandha, Pusa Bahadur, Bhim, Suryakiran, Pusa Virangana, Rose Sherbet, Surkhab, and Pusa Ajay) were systematically characterized by high-performance liquid chromatography (HPLC) coupled with a photodiode array detector for their anthocyanin composition. In the morning, flowers of the above-mentioned varieties were plucked and the petals were carefully removed (2 g) and taken into an amber flask, and extracted with 500 mL of acidified methanol (0.1% HCl). The content was sonicated in the dark for 30 min on an ultrasonicator (Misonix, NY, USA) and the extract was concentrated under a vacuum (35 ± 1 °C) in a rotary evaporator (Heidolph, Germany) for the complete removal of methanol. HPLC-grade methanol was added to the dried sample. Prior to HPLC analysis, supernatant was filtered through a 0.45 µm syringe filter (Whatman Inc.; Maidstone, UK). The anthocyanin content was quantified based on the modified procedure described by Zheng et al. [21]. The peak area of the anthocyanin was integrated from the HPLC chromatogram at 520 nm using the Agilent ChemStation software and plotted against concentration. The stock solutions were made with 1% TFA (v/v) in methanol to give a 1 µg/mL concentration. The calibration curve was obtained for cyanidin-3,5 di-O-glucoside and pelargonidin 3,5 di-O-glucoside at 5 different concentrations (50, 100, 150, 200, and 250 ppm), and each sample’s absorbance was measured at 520 nm so as to obtain the following linear equations, Y = 1E-05X-1.667 (r2 = 0.9967) and Y = 2E-05X-2.061 (r2 = 0.997), respectively (Figure 2 and Figure 3). The anthocyanin content was finally calculated according to the standard curve and expressed as mg/100 g on a fresh weight basis. The purity of anthocyanin powder concentrate was checked with the HPLC instrument using a mobile phase comprising a gradient mixer of solvent A: water (0.1% TFA) and solvent B: water: ACN: TFA (53:46:1 v/v) at a flow rate of 0.6 mL min-1. The gradient mobile phase was A: 80% for 0 min, 40% in the next 26 min, 80% for 14 min, and the total run time was 40 min. The chromatogram was acquired at 520 nm after injection of 20 µL. Standard cyanidin-3,5 di-O-glucoside and pelargonidin-3,5 di-O-glucoside were also run according to the above-mentioned flow rate. Visible spectra were also recorded for each peak found in the HPLC analysis. Peak identification was done according to retention time, elution order, and spectra obtained as compared with standards under the same conditions. The concentration of identified anthocyanins was calculated based on cyanidin-3,5 di-O-glucoside and pelargonidin-3,5 di-O-glucoside equivalent, whereas unknown anthocyanins were quantified as cyanidin 3-O-glucoside.

2.7. Statistical Analysis

All assays were performed in triplicate. All the data were subjected to Turkey’s honestly significant difference (HSD) test for the comparison of means, and significance for the test was assumed if p ≤ 0.05. The analyses were carried out through the statistical software SPSS 20.0 (SPSS Inc.; Chicago, IL, USA). Correlation analyses were performed to estimate the relationship between anthocyanin content, antioxidant activities, and phenolic content. Cluster analysis was performed using SAS v9.4 [22]. A principal component analysis (PCA) biplot was constructed using R software.

3. Results and Discussion

3.1. Histological Studies of Anthocyanin Pigments in Rose

Histological studies were conducted in varieties Ashwini, Dr. S.S. Bhatnagar, Rose Sherbet, Bhim, Pusa Ajay, Nehru Centenary, Suryakiran, Pusa Arun, Raktima, Raktagandha, Pusa Virangana, Pusa Bahadur, and Surkhab to document the location and distribution of anthocyanin pigments in different cell layers of rose petals (Figure 4). There was variability in the distribution of anthocyanin in the epidermal cell layers of all the studied varieties. It was observed that anthocyanin pigments were distributed in both adaxial and abaxial epidermal cells in all varieties except Pusa Ajay. In addition to adaxial and abaxial epidermal cells, varieties such as Ashwini, Dr. S.S. Bhatnagar, and Pusa Arun also produced pigments in subepidermal cells and mesophyll cells. This may be the reason that these varieties were found superior in terms of their total anthocyanin content. Pusa Ajay is a light pink-colored rose variety wherein only the abaxial epidermal layer reported the presence of anthocyanin pigments. In the variety Pusa Virangana, the maximum distribution of anthocyanin pigments was found in the adaxial epidermis as compared to the abaxial epidermis. The relative location of anthocyanin pigments may be as important as the relative concentration in determining the flower color. The result of our study is supported by [23] Mudalige et al. [23]. They investigated the pigment distribution in Dendrobium orchids and reported that the color intensity of orchids is determined by the spatial distribution of pigments in different layers of epidermal cells.

3.2. Total Phenolic Content

Among 50 rose varieties included in the study, the total phenolic content varied from 5.21 ± 0.39 mg GAE/100 g fresh weight to 427.59 ± 3.47 mg GAE/100 g fresh weight of petals (Table 2). The findings showed that the varieties of light colors exhibited less phenolic content, while the varieties with bright red colors exhibited greater phenolic content in the petals. Previous studies by Zheng et al. [24] also reported that the total phenolic content was found to be the maximum in red- and pink-colored rose species, except for white rose. Qin and Xiaojun [11] reported a total phenolic content of 2087.43 ± 17.37 mg gallic acid equivalents (GAE) per 100 g fresh weight (FW) in rose petals, and another study by Roman et al. [25] also reported that the total phenolic content in Rosa canina varied from 326 mg/100 g frozen pulp to 575 mg/100 g frozen pulp.

3.3. Antioxidant Activity

The study revealed a significant difference in the antioxidant activities of the diverse genotypes (Table 2). FRAP values among rose varieties ranged from 8.92 ± 0.36 µmol Trolox/g fresh weight (Iceberg) to 397.15 ± 0.82 µmol rolox/g (Ashwini) on a fresh weight basis. The DPPH value among rose varieties ranged from 4.45 ± 0.30% (Iceberg) to 93.47 ± 0.19% (Ashwini). It is evident from the study that high antioxidant activity was observed in dark red varieties, followed by deep pink, orange, pink, yellow, and white. Our results are in close conformity with the findings of Sadighara et al. [26] in Althaea officinalis. They reported that reddish-pink flowers of Althaea officinalis have higher antioxidant activity than pink and white flowers. The variety Ashwini was found best for anthocyanin content as well as antioxidant activities, which showed that the flower color plays a role not only in the content of anthocyanins but also in antioxidant power. Specifically, a red color is generally associated with high values of antioxidant activity and a white color with the lowest ones. The possible reason for this variation in the antioxidant content of rose varieties may be due to the genotypic effect. Suzan and Sezai [27] concluded that antioxidant activity was influenced by genotype in Rosa taxa. Sayed et al. [28] investigated the antiradical activity of flowers of fresh Taif rose by the DPPH method and reported high antiradical activity with SC50 = 49.44 µg/mL. Qin and Xiaojun [11] also investigated the antioxidant activities of the rose by DPPH assay and found that the DPPH radical scavenging activity value was 2089 mg GAE/100 g fresh weight. Our results are also in line with the findings of Zeng et al. [29]. They evaluated extracts from 19 Chinese edible flowers for antioxidant effects. The results showed that the extracts of Paeonia suffruticosa, Paeonia lactiflora, and Rosa rugosa possessed stronger DPPH radical scavenging activity (94.221 ± 0.102; 93.739 ± 0.424, and 94.244 ± 0.163%, respectively).

3.4. Correlation between Total Anthocyanin Content, Total Phenolic Content, and Antioxidant Activities

A strong, statistically significant, positive correlation was observed between the total anthocyanin content, total phenolic content, and antioxidant activity of rose petals (Table 3). The strong correlation between these parameters indicates that varieties with high anthocyanin and phenolic content constitute a good index for antioxidant activities. Our result is in agreement with Nowak and Gawlik-Dziki [30]. They reported a strong, positive correlation coefficient (r = 0.8485) between the DPPH radical scavenging activity and phenolic content of rose. Özgen et al. [31] reported that the total anthocyanin content of Sambucus canadensis is correlated to antioxidant capacity values (r = 0.70-0.85). Similarly, Căta et al. [32] also observed in berries that antioxidant activity is directly proportional to anthocyanin content.

3.5. Cluster Analysis

Based on Ward’s minimum variance cluster analysis, the fifty rose genotypes were grouped into four clusters based on total anthocyanin content, antioxidant activities, and total phenolic content (Figure 5). Cluster I comprised five dark-red-colored rose varieties, i.e., Pusa Arun, Raktima, Nehru Centenary, Bhim, and Dr. S. S. Bhatnagar. Cluster II comprised 21 rose varieties, i.e., Pusa Bahadur, Lalima, Jantar Mantar, Jawani, Raktagandha, Pusa Mohit, Pusa Barahmasi, Pusa Virangana, Dulhan, Dr. B.P. Pal, Arjun, Haseena, R. S. S. of Nalagarh, Pusa Ranjana, Rose Sherbet, Pusa Garima, Pusa Gaurav, Suryakiran, Shola, Surkhab, Pusa Abhishek. In cluster III, only a single dark-red-colored variety, Ashwini, was placed more divergently. This variety was found superior in terms of total anthocyanin content, with high antioxidant activities. Cluster IV formed the largest cluster, which comprised twenty-three light pink, white, and yellow-colored rose varieties, namely Pusa Ajay, Pusa Muskan, Pusa Priya, Dr. Bharat Ram, Dr. M.S. Randhawa, Priyadarshini, Anurag, Sadabahar, Nurjehan, Pink Montezuma, Surekha, Dr. Benjamin Pal, Arunima, Manasi, Krishna, Pusa Pitamber, Lahar, Ganga, Raja Ram Mohan Roy, Iceberg, Mridula, Shabnam, and Chingari. Rose varieties with high anthocyanin content, antioxidant activities, and total phenolic content were placed in a separate cluster. From the dendrogram, it was also evident that dark-colored varieties were clustered together. Schmitzer et al. [33] also performed cluster analysis of forty-eight cultivars of rose based on total anthocyanins and quercetins and reported that white cultivars, identical to pink and light red cultivars, were the most distant from red cultivars. Singh et al. [34] indicated that crossing between genotypes that are profoundly genetically distinct provides better results as such crosses increase the possibility of obtaining desirable transgressive segregants. The most divergent genotype in the present study is Ashwini, based on cluster distance, and can therefore be selected as a parent for crossing to further enhance the anthocyanin content.

3.6. Principal Component Analysis

In this study, a PCA biplot was constructed to determine the contribution and correlation of variables. Total anthocyanin content contributed to the maximum variation among the fifty genotypes studied (Figure 6). Further, it is evident from the biplot that total phenolic content had a strong correlation with antioxidant activity (FRAP). Meanwhile, variety Ashwini was situated in the upper-right quadrant, with the longest distance from the origin, showing that Ashwini had higher total anthocyanin content, total phenolic content, and antioxidant activity (FRAP and DPPH).

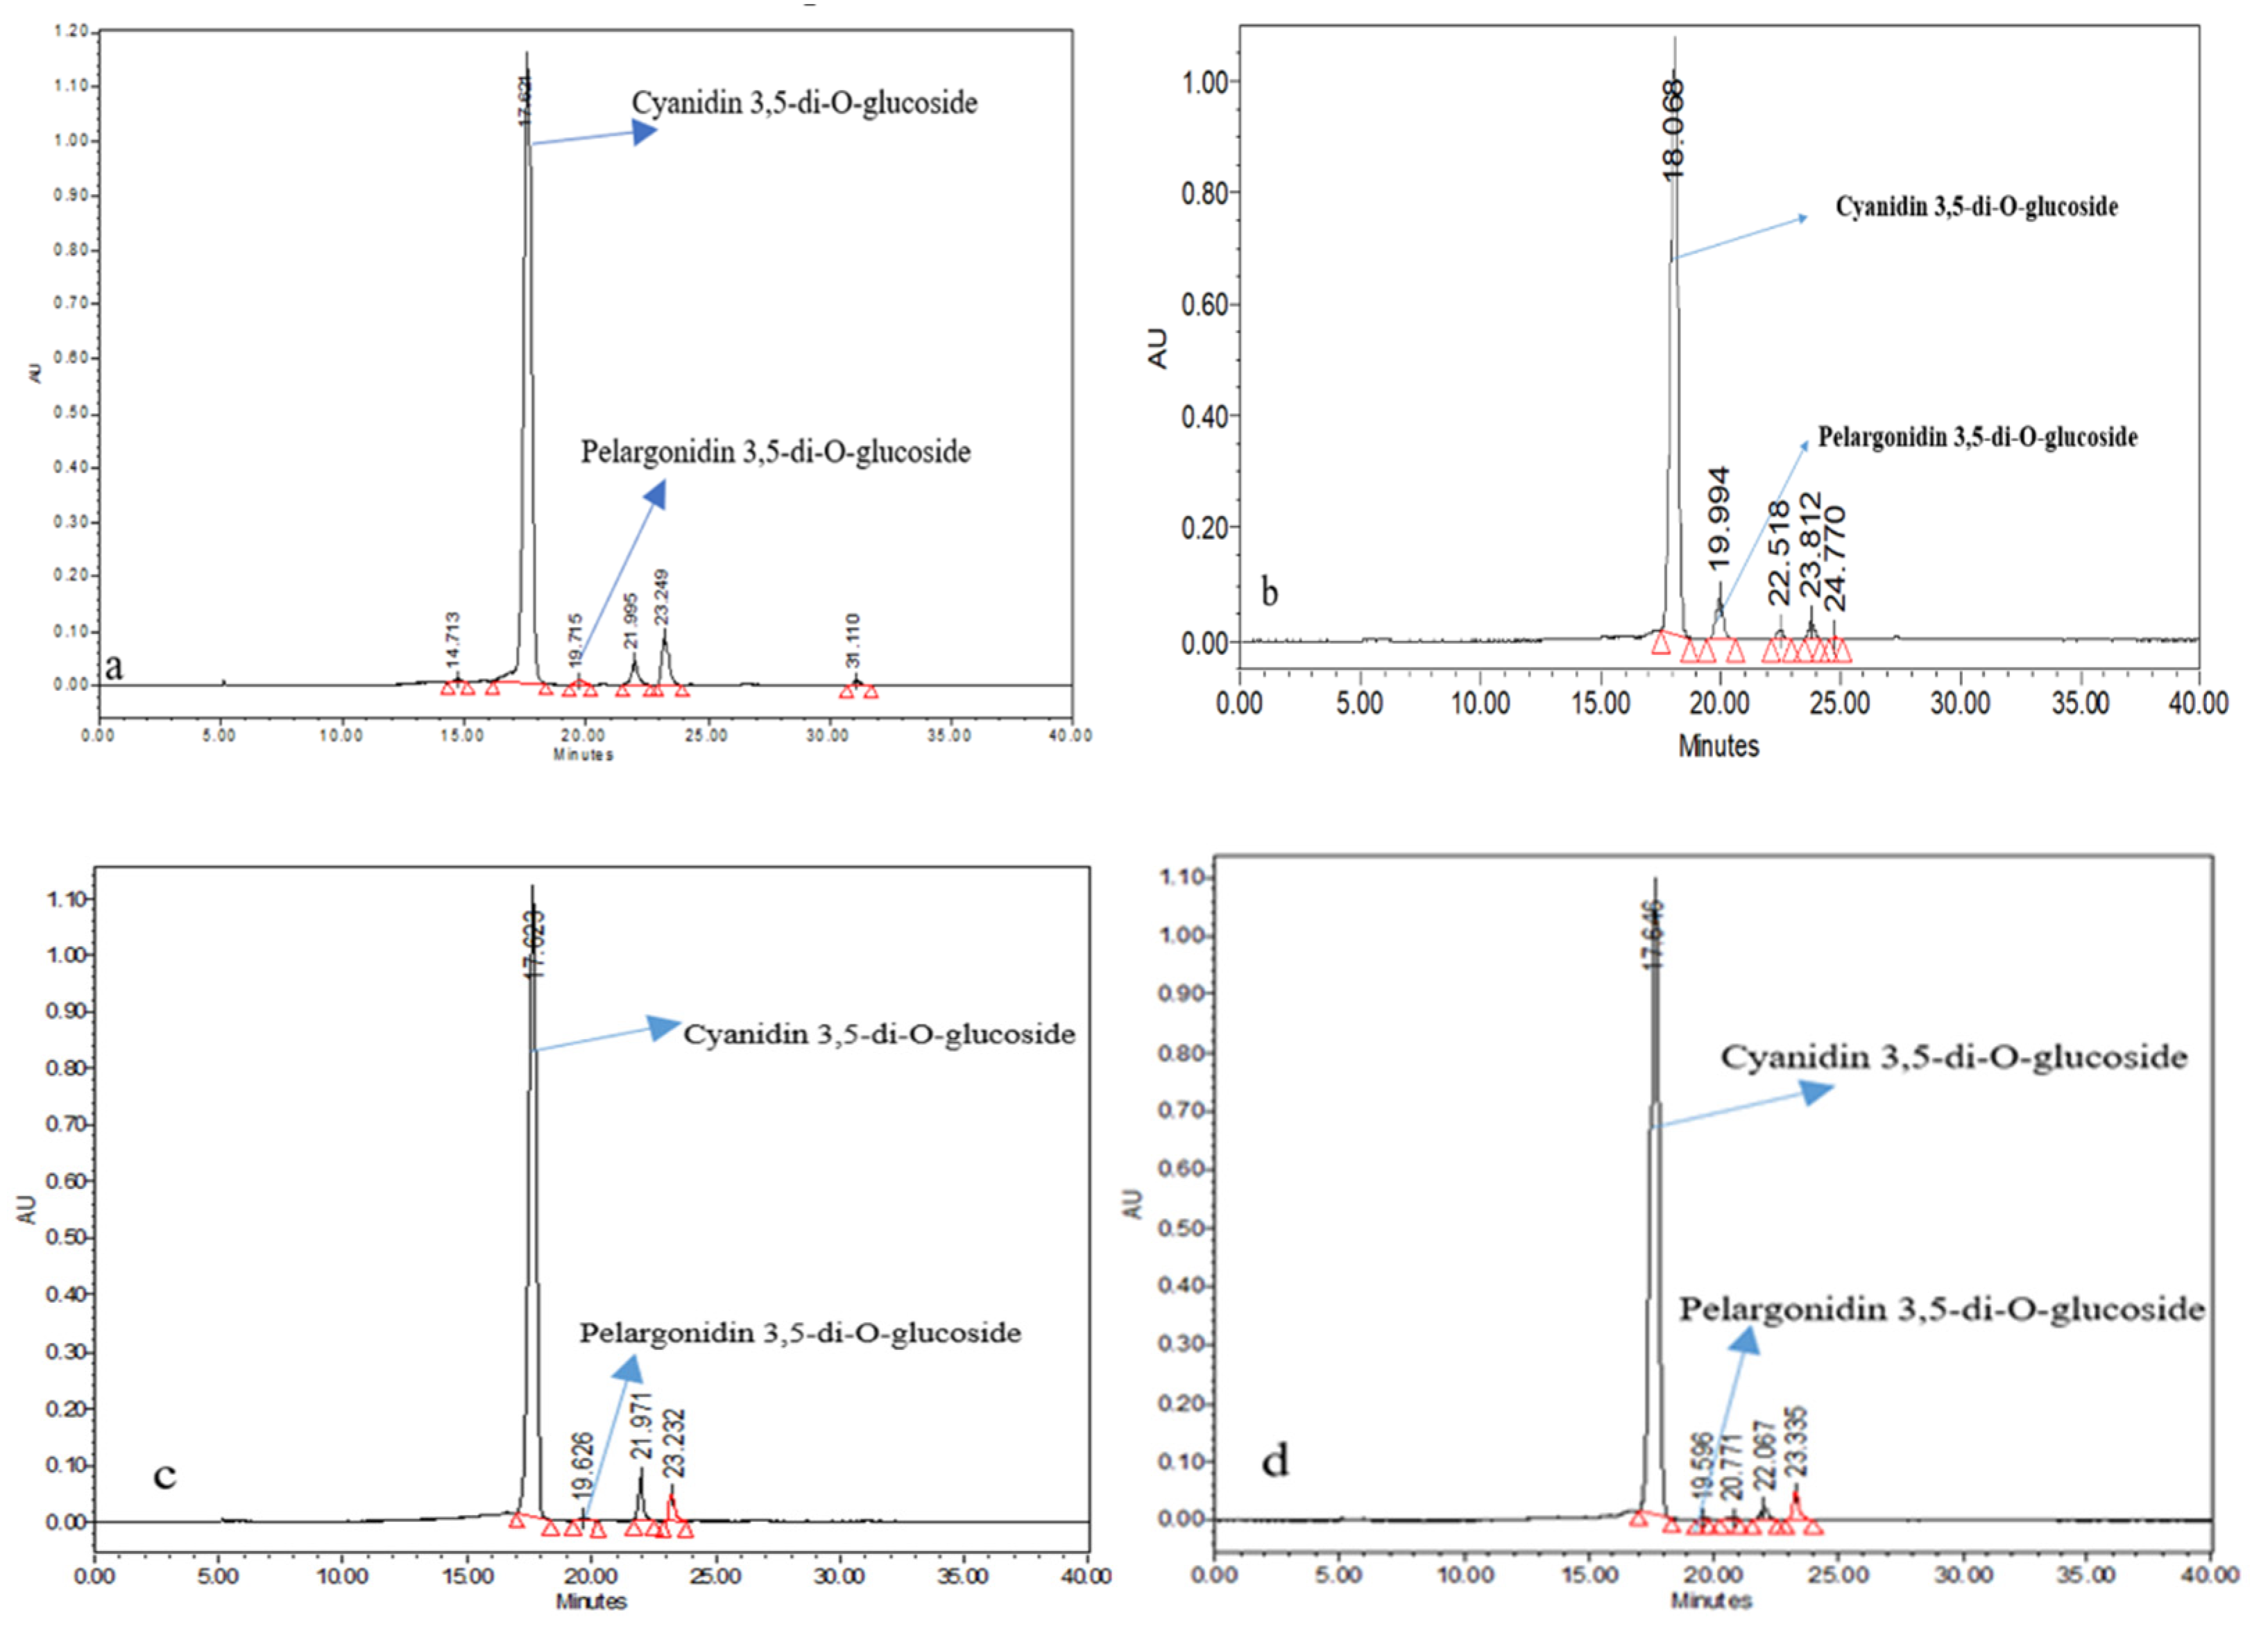
3.7. Anthocyanin Identification and Characterization

Several peaks were detected in all varieties, corresponding to different types of anthocyanin fractions. Among all the rose varieties, cyanidin 3,5-di-O-glucoside and pelargonidin 3,5-di-O-glucoside were the major anthocyanins identified according to retention time, elution order, and spectra obtained by comparison with external standards and published data (Figure 7). In the HPLC analysis, the individual content of different anthocyanin fractions corresponding to different peaks was estimated. Five types of anthocyanins were detected in the variety of Ashwini. Peak 1 and peak 2 had retention times (RT) of 17.621 and 19.715 min, respectively, which was in line with the standards of cyanidin 3,5-di-O-glucoside and pelargonidin 3,5-di-O-glucoside. In the chromatogram of Ashwini, peak 1 corresponded to cyanidin 3,5-di-O-glucoside (497.79 mg/100 g), and peak 2 corresponded to pelargonidin 3,5-di-O-glucoside (7.60 mg/100 g); peak 3, 4, and 5 corresponded to unknown anthocyanins, which were expressed as C3G equivalents (17.24, 32.42, and 3.76 mg/100 g, respectively). Cyanidin 3,5-di-O-glucoside was the predominant constituent, which accounted for 89.38% of the total anthocyanins according to the analysis results of high-performance liquid chromatography with photodiode array detection (Table 3 and Figure 7a). In the chromatogram of Pusa Arun, peak 1 represented cyanidin 3,5-di-O-glucoside (448.54 mg/100 g, RT 18.068 min), peak 2 represented pelargonidin 3,5-di-O-glucoside (61.75 mg/100 g, RT 19.994 min), and peak 3, 4, and 5 corresponded to unknown anthocyanins, which were expressed as C3G equivalents (5.88, 10.71, and 1.02 mg/100 g, respectively). Cyanidin 3,5-di-O-glucoside was the principal anthocyanin in the variety Pusa Arun, representing 90.24% of the total peak area (Table 3 and Figure 7b). Four types of anthocyanins were observed in the variety Nehru Centenary (Figure 7c). In the chromatogram of Nehru Centenary, peak 1 corresponded to cyanidin 3,5-di-O-glucoside (452.12 mg/100 g), which accounted for 91.42 % of the total peak area; peak 2 corresponded to pelargonidin 3,5-di-O-glucoside (5.43 mg/100 g), and peak 3 and 4 corresponded to unknown anthocyanins, which were expressed as C3G equivalents (23.10 and 15.74 mg/100 g, respectively). From the chromatogram of the variety Raktagandha (Table 3 and Figure 7d), five anthocyanins were revealed, with peak 1 representing 94.65% of the total peak area. Peak 1 represented cyanidin 3,5-di-O-glucoside (457.66 mg/100 g), which was the predominant anthocyanin in the variety Raktagandha. Peak 2 corresponded to pelargonidin 3,5-di-O-glucoside (1.31 mg/100 g), and peaks 3, 4, and 5 corresponded to unknown anthocyanins, which were expressed as C3G equivalents (1.31, 7.48, and 16.42 mg/100 g, respectively). Four types of anthocyanins were observed in the variety Raktima (Figure 7e). The maximum peak area was found under peak 2 (89.20 %), which represented cyanidin 3,5-di-O-glucoside (338.91 mg/100 g, RT 17.639 min); peak 3 corresponded to pelargonidin 3,5-di-O-glucoside (10.66 mg/100 g, RT 19.628 min); peak 3 and 4 corresponded to unknown anthocyanins, which were expressed as C3G equivalents (17.33 and 13.77 mg/100 g, respectively). From the chromatogram of variety Suryakiran, six anthocyanins were revealed, with peak 2 representing 60.83% of the total peak area. Peak 1 represented cyanidin 3,5-di-O-glucoside (29.28 mg/100 g, RT17.649). Peak 2 corresponded to pelargonidin 3,5-di-O-glucoside (185.43 mg/100 g, RT 19.585 min), which was the prime anthocyanin in variety Suryakiran (Figure 7f). The chromatogram of Pusa Bahadur revealed four types of anthocyanin (Figure 7g). Peak 1 corresponded to cyanidin 3,5-di-O-glucoside (137.59 mg/100 g), which represented 95.62% of the total peak area. Peak 2 represented pelargonidin 3,5-di-O-glucoside (0.39 mg/100 g). Four types of anthocyanins were observed in the variety of Bhim (Figure 7h). In the chromatogram of Bhim, peak 1 corresponded to cyanidin 3,5-di-O-glucoside (175.80 mg/100 g, RT 17.623 min), which occupied 96.72% of the total peak area. Peak 2 corresponded to pelargonidin 3, 5-di-O-glucoside (2.31 mg/100 g, RT 19.625 min), and peaks 3 and 4 corresponded to unknown anthocyanins, which were expressed as C3G equivalents (1.50 and 3.32 mg/100 g, respectively). From the chromatogram of variety Dr. S.S. Bhatnagar (Figure 7i), four anthocyanins were revealed, with peak 1 representing 90.78% of the total peak area, which corresponded to cyanidin 3,5-di-O-glucoside (362.40 mg/100 g), and peak 2 corresponded to pelargonidin 3,5-di-O-glucoside (1.98 mg/100 g). The chromatogram of the variety of Rose Sherbet revealed five types of anthocyanins (Figure 7j). Peak 1 corresponded to cyanidin 3,5-di-O-glucoside (206.57 mg/100 g), which was the chief anthocyanin in Rose Sherbet, with 86.35% of the total peak area. As shown in Figure 7k, four anthocyanins were revealed in the variety of Pusa Virangana, with peak 1 representing cyanidin 3,5-di-O-glucoside (301.66 mg/100 g). Four types of anthocyanins were observed in the variety Surkhab, among which cyanidin 3,5-di-O-glucoside (173.60 mg/100 g), which occupied 93.63% of the total peak area, was the predominant one (Figure 7l). In variety Pusa Ajay, peak 1 corresponded to cyanidin 3,5-di-O-glucoside (190.05 mg/100 g), which represented 94.08% of the total peak area (Figure 7m). Statistically significant differences were observed for cyanidin 3,5-di-O-glucoside and pelargonidin 3,5-di-O-glucoside content among all varieties (Table 3). The maximum cyanidin 3,5-di-O-glucoside content was recorded in Ashwini (497.79 mg/100 g), followed by the variety Raktagandha (457.66 mg/100 g). The cyanidin 3,5-di-O-glucoside content of Nehru Centenary (452.12 mg/100 g) and Pusa Arun (448.54 mg/100 g) was statistically similar. The lowest cyanidin 3,5-di-O-glucoside content was recorded in the variety Suryakiran (29.28 mg/100 g). Pelargonidin 3,5-di-O-glucoside content also showed significant variation among all varieties. The maximum pelargonidin 3,5-di-O-glucoside content was recorded in variety Suryakiran (185.43 mg/100 g), followed by Pusa Arun (61.75 mg/100 g). According to Eugster et al. [35] the anthocyanin types of rose petals depend upon the plant variety, being mostly cyanidin 3,5-di-O-glucoside, pelargonidin 3,5-di-O-glucoside, and peonidin 3,5-di-O-glucoside. In our study, cyanidin 3,5-di-O-glucoside content was the maximum in red- and pink-colored varieties, whereas Suryakiran is an orange color variety and recorded the highest pelargonidin 3,5-di-O-glucoside content. Our results are well supported by the findings of Ludmila et al. [36]. They evaluated red-, pink-, and orange-colored varieties of rose and reported the cyanidin 3,5-di-O-glucoside and pelargonidin 3,5-di-O-glucoside content. They concluded that pink- and red-colored varieties had more cyanidin 3,5-di-O-glucoside content, whereas the orange-colored varieties were rich in pelargonidin 3,5-di-O-glucoside.
Factors including genetics, environmental stresses, variety, and agronomic conditions can influence the types and content of anthocyanin pigment [37,38]. Our findings suggest that cyanidin 3,5-di-O-glucoside and pelargonidin 3,5-di-O-glucoside were the most predominant anthocyanins found in Indian roses using reversed-phase C18 column chromatography. These results are similar to the findings of Lee et al. [12] and Wan et al. [39], who characterized anthocyanins from the rose as cyanidin 3,5-di-O-glucoside and pelargonidin 3,5-di-O-glucoside. The most predominant anthocyanin was cyanidin 3,5-di-O-glucoside in all the varieties (Figure 7). These results are in accordance with a previous study reporting that cyanidin 3,5-di-O-glucoside was identified as the main component in rose varieties [40]. The findings of Qin and Xiaojun [11] are also in line with our results as they detected three types of anthocyanins in rose petals, and, based on the results of high-performance liquid chromatography with photodiode array detection, cyanidin 3,5-di-O-glucoside was the prime constituent and represented 94.9 percent of the total anthocyanins. Biolley et al. [41] found cyanidin 3,5-diglucoside and pelargonidin 3,5-diglucoside in 100 cyanic cultivars of Rosa x hybrida using the HPLC technique.

4. Conclusions

A significant positive correlation was observed between total anthocyanin content, total phenolic content, and antioxidant activities. Principal component analysis revealed that variable total anthocyanin content contributed to the maximum variation among the fifty rose varieties. A significant difference was observed in the anthocyanin profile among the rose varieties. This research presented a systematic report on the anthocyanin composition in the petals of 13 distinct color varieties. Two anthocyanins were identified in the Indian varieties of rose with the help of standards. Cyanidin 3,5-di-O-glucoside was the predominant anthocyanin in red- and pink-colored varieties, whereas pelargonidin 3,5-di-O-glucoside was predominant in orange-colored varieties. Anthocyanin content can be increased through a breeding program based on crosses between the most divergent genotypes. This study provides a basis for rose breeding to achieve a specific flower color. Further, the rose varieties with high anthocyanin content may be utilized as sources of anthocyanins, which have immense applications in the nutraceutical and food industries as food colorants, antioxidants, and anticancer, antimicrobial, and antiallergic agents, promoting health and wellbeing.

Author Contributions

Conceptualization, P.K.; investigation and methodology, P.K., D.V.S.R., K.V.P. and S.S.; writing—original draft preparation, P.K. and M.F.; review and editing, S.P. (Sapna Panwar), S.P. (Surinder Paul), N.B., A.B., S.F. and P.C.; supervision, D.V.S.R., K.V.P. and S.S. All authors have read and agreed to the published version of the manuscript.

Funding

This research received no external funding.

Institutional Review Board Statement

Not applicable.

Informed Consent Statement

Not applicable.

Data Availability Statement

The data is contained within the article.

Acknowledgments

The authors are thankful to ICAR—the Indian Agricultural Research Institute, New Delhi—for providing the research facilities to conduct this experiment. The first author is grateful to UGC, New Delhi for awarding a fellowship during their Ph.D. program.

Conflicts of Interest

The authors declare no conflict of interest.

References

  1. Raymond, O.; Gouzy, J.; Just, J.; Badouin, H.; Verdenaud, M.; Lemainque, A.; Vergne, P.; Moja, S.; Choisne, N.; Pont, C.; et al. The Rosa genome provides new insights into the domestication of modern roses. Nat. Genet. 2018, 50, 772–777. [Google Scholar] [CrossRef] [PubMed]
  2. Szołtysik, M.; Kucharska, A.Z.; Sokół-Łętowska, A.; Dąbrowska, A.; Bobak, Ł.; Chrzanowska, J. The effect of Rosa spinosissima fruits extract on lactic acid bacteria growth and other yoghurt parameters. Foods 2020, 9, 1167. [Google Scholar] [CrossRef]
  3. Lu, J.; Zhang, Q.; Lang, L.; Jiang, C.; Wang, X.; Sun, H. Integrated metabolome and transcriptome analysis of the anthocyanin biosynthetic pathway in relation to color mutation in miniature roses. BMC Plant Biol. 2021, 21, 1–13. [Google Scholar] [CrossRef] [PubMed]
  4. Kumari, P.; Raju, D.V.S.; Prasad, K.V.; Singh, K.P.; Saha, S.; Arora, A.; Hossain, F. Quantification and correlation of anthocyanin pigments and their antioxidant activities in rose (Rosa × hybrida) varieties. Indian J. Agric. Sci. 2017, 87, 1340–1346. [Google Scholar]
  5. Shafei, M.N.; Rakhshandah, H.; Boskabady, M.H. Antitussive effect of Rosa damascena in guinea pigs. Iran. J. Pharm. Sci. 2010, 2, 231–234. [Google Scholar]
  6. Rezaie-Tavirani, M.; Fayazfar, S.; Heydari-Keshel, S.; Rezaee, M.B.; Zamanian-Azodi, M.; Rezaei-Tavirani, M.; Khodarahmi, R. Effect of essential oil of Rosa damascena on human colon cancer cell line SW742. Gastroenterol. Hepatol. Bed. Bench. 2013, 6, 25. [Google Scholar] [PubMed]
  7. Kumari, P.; Raju, D.V.S.; Singh, K.P.; Prasad, K.V.; Panwar, S. Characterization of phenolic compounds in petal extracts of rose. Indian J. Hortic. 2018, 75, 349–351. [Google Scholar] [CrossRef]
  8. Enaru, B.; Drețcanu, G.; Pop, T.D.; Stǎnilǎ, A.; Diaconeasa, Z. Anthocyanins: Factors affecting their stability and degradation. Antioxidants. 2021, 10, 1967. [Google Scholar] [CrossRef] [PubMed]
  9. Cai, D.; Li, X.; Chen, J.; Jiang, X.; Ma, X.; Sun, J.; Tian, L.; Vidyarthi, S.K.; Xu, J.; Pan, Z.; et al. A comprehensive review on innovative and advanced stabilization approaches of anthocyanin by modifying structure and controlling environmental factors. Food Chem. 2022, 366, 130611. [Google Scholar] [CrossRef]
  10. Li, D.; Wang, P.; Luo, Y.; Zhao, M.; Chen, F. Health benefits of anthocyanins and molecular mechanisms: Update from recent decade. Crit. Rev. Food Sci. Nutr. 2017, 57, 1729–1741. [Google Scholar] [CrossRef] [PubMed]
  11. Qin, G.; Xiaojun, M. Composition and antioxidant activity of anthocyanins isolated from Yunnan edible rose (An ning). Food Sci. Hum. Well. 2013, 2, 68–74. [Google Scholar] [CrossRef] [Green Version]
  12. Lee, J.H.; Lee, H.J.; Choung, M.G. Anthocyanin compositions and biological activities from the red petals of Korean edible rose (Rosa hybrida cv. Noblered). Food Chem. 2011, 129, 272–278. [Google Scholar] [CrossRef] [PubMed]
  13. Yang, H.; Shin, Y. Antioxidant compounds and activities of edible roses (Rosa hybrida spp.) from different cultivars grown in Korea. Appl. Biol. Chem. 2017, 60, 129–136. [Google Scholar] [CrossRef]
  14. Lee, M.H.; Nam, T.G.; Lee, I.; Shin, E.J.; Han, A.R.; Lee, P.; Lee, S.Y.; Lim, T.G. Skin anti-inflammatory activity of rose petal extract (Rosa gallica) through reduction of MAPK signaling pathway. Food Sci. Nutr. 2018, 6, 2560–2567. [Google Scholar] [CrossRef] [Green Version]
  15. Ren, G.; Xue, P.; Sun, X.; Zhao, G. Determination of the volatile and polyphenol constituents and the antimicrobial, antioxidant, and tyrosinase inhibitory activities of the bioactive compounds from the by-product of Rosa rugosa Thunb. var. plena Regal tea. BMC Complement. Altern. Med. 2018, 18, 307. [Google Scholar] [CrossRef] [Green Version]
  16. Saati, E.A.; Pusparini, A.D.; Wachid, M.; Winarsih, S. The anthocyanin pigment extract from red rose as antibacterial agent. Malays. J. Fund. Appl. Sci. 2018, 184–187. [Google Scholar] [CrossRef] [Green Version]
  17. Kumari, P.; Panwar, S.; Namita, T.; Kaushai, S.; Ullas, P.S. Pigment profiling of flower crops: A review. Ecol. Environ. Conserv. 2017, 23, 1000–1008. [Google Scholar]
  18. Singleton, V.L.; Rossi, J.A. Colorimetry of total phenolics with phosphomolybdic-phosphotungstic acid reagents. Am. J. Enol. Vitic. 1965, 16, 144–158. [Google Scholar]
  19. Benzie, I.F.; Strain, J.J. The ferric reducing ability of plasma (FRAP) as a measure of “antioxidant power”: The FRAP assay. Anal. Biochem. 1994, 239, 70–76. [Google Scholar] [CrossRef] [PubMed] [Green Version]
  20. Braca, A.; De Tommasi, N.; Di Bari, L.; Pizza, C.; Politi, M.; Morelli, I. Antioxidant principles from Bauhinia terapotensis. J. Nat. Prod. 2011, 64, 892–895. [Google Scholar] [CrossRef] [PubMed]
  21. Zheng, J.; Ding, C.; Wang, L.; Li, G.; Shi, J.; Li, H.; Wang, H.; Suo, Y. Anthocyanins composition and antioxidant activity of wild Lycium ruthenicum Murr. from Qinghai-Tibet Plateau. Food Chem. 2011, 126, 859–865. [Google Scholar] [CrossRef]
  22. SAS Institute Inc. SAS® University Edition. Quick Start Guide for Students with Visual Impairments; SAS Institute Inc.: Cary, NC, USA, 2018. [Google Scholar]
  23. Mudalige, R.G.; Kuehnle, A.R.; Amore, T.D. Pigment distribution and epidermal cell shape in Dendrobium species and hybrids. Hort. Sci. 2003, 38, 573–577. [Google Scholar] [CrossRef] [Green Version]
  24. Zheng, J.; Yu, X.; Maninder, M.; Xu, B. Total phenolics and antioxidants profiles of commonly consumed edible flowers in China. Int. J. Food Prop. 2018, 21, 1524–1540. [Google Scholar] [CrossRef] [Green Version]
  25. Roman, I.; Stănilă, A.; Stănilă, S. Bioactive compounds and antioxidant activity of Rosa canina L. biotypes from spontaneous flora of Transylvania. Chem. Cent. J. 2013, 7, 73. [Google Scholar] [CrossRef]
  26. Sadighara, P.; Gharibi, S.; Jafari, A.M.; Khaniki, G.J.; Salari, S. The antioxidant and flavonoids contents of Althaea officinalis L. flowers based on their color. Avicenna. J. Phytomed. 2012, 2, 113–117. [Google Scholar]
  27. Suzan, O.Y.; Sezai, E. Antibacterial and antioxidant activity of fruits of some rose species from Turkey. Rom. Biotechnol. Lett. 2011, 16, 6407–6411. [Google Scholar]
  28. Sayed, E.S.; Hamed, A.; Bazaid, S.A.; Shohayeb, M.M. Total phenolics and antioxidant activity of defatted fresh taif rose, Saudi Arabia. Br. J. Pharm. Res. 2012, 2, 129–140. [Google Scholar]
  29. Zeng, Y.; Deng, M.; Lv, Z.; Peng, Y. Evaluation of antioxidant activities of extracts from 19 Chinese edible flowers. SpringerPlus 2014, 3, 315. [Google Scholar] [CrossRef] [Green Version]
  30. Nowak, R.; Gawlik-Dziki, U. Polyphenols of Rosa L. leaves extracts and their radical scavenging activity. Z. Naturforsch. C. 2007, 62, 32–38. [Google Scholar] [CrossRef] [Green Version]
  31. Özgen, M.; Scheerens, J.C.; Reese, R.N.; Miller, R.A. Total phenolic, anthocyanin contents and antioxidant capacity of selected elderberry (Sambucus canadensis L.) accessions. Pharmacogn. Mag. 2010, 6, 198. [Google Scholar] [CrossRef] [Green Version]
  32. Căta, A.; Ştefănuţ, M.N.; Tănasie, C.; Pop, R. Comparative analysis of bilberries alcoholic extracts regarding to anthocyanins content, total phenolics and antioxidant activity. Ovidius. Univ. Ann. Chem. 2010, 21, 15–19. [Google Scholar]
  33. Schmitzer, V.; Veberic, R.; Osterc, G.; Stampar, F. Color and phenolic content changes during flower development in groundcover rose. J. Am. Soc. Hortic. Sci. 2010, 135, 195–202. [Google Scholar] [CrossRef] [Green Version]
  34. Singh, M.; Singh, L.; Srivastava, S.B.L. Combining ability analysis in Indian mustard (Brassica juncea L. Czern & Coss). J. Oilseeds Res. 2016, 1, 23–27. [Google Scholar]
  35. Eugster, C.H.; Märki-Fischer, E. The chemistry of rose pigments. Angew. Chem. Int. Ed. 1991, 30, 654–672. [Google Scholar] [CrossRef]
  36. Ludmila, D.; Victor, D.; Valery, T.; Natalya, M. Rose flower petals: Rich source of anthocyanins. Res. J. Pharm. Biol. Chem. Sci. 2015, 6, 944–950. [Google Scholar]
  37. Jing, P.U.; Noriega, V.; Schwartz, S.J.; Giusti, M.M. Effects of growing conditions on purple corncob (Zea mays L.) anthocyanins. J. Agric. Food Chem. 2007, 55, 8625–8629. [Google Scholar] [CrossRef] [PubMed]
  38. da Silva, F.L.; Escribano-Bailón, M.T.; Alonso, J.J.P.; Rivas-Gonzalo, J.C.; Santos-Buelga, C. Anthocyanin pigments in strawberry. LWT-Food Sci. Technol. 2007, 40, 374–382. [Google Scholar] [CrossRef]
  39. Wan, H.; Yu, C.; Han, Y.; Guo, X.; Luo, L.; Pan, H.; Zheng, T.; Wang, J.; Cheng, T.; Zhang, Q. Determination of flavonoids and carotenoids and their contributions to various colors of rose cultivars (Rosa spp.). Front. Plant Sci. 2019, 10, 123. [Google Scholar] [CrossRef] [Green Version]
  40. Raymond, O.; Biolley, J.P.; Jay, M. Fingerprinting the selection process of ancient roses by means of floral phenolic metabolism. Biochem. Syst. Ecol. 1995, 23, 555–565. [Google Scholar] [CrossRef]
  41. Biolley, J.P.; Jay, M.; Viricel, M.R. Flavonoid diversity and metabolism in 100 Rosa x hybrida cultivars. Phytochem. 1994, 35, 413–419. [Google Scholar] [CrossRef]
Figure 1. Variability in the flower color of rose varieties used in the present study.
Antioxidants 11 02032 g001
Figure 2. Calibration curve for standard cyanidin 3,5-di-O-glucoside.
Antioxidants 11 02032 g002
Figure 3. Calibration curve for standard pelargonidin 3,5-di-O-glucoside.
Antioxidants 11 02032 g003
Figure 4. Histological examination of rose petals for anthocyanin distribution.
Antioxidants 11 02032 g004
Figure 5. Cluster analysis of different rose varieties. 1: Pusa Arun, 2: Raktima, 3: Nehru Centenary, 4: Pusa Bahadur, 5: Lalima, 6: Bhim, 7: Ashwini, 8: Dr. S.S. Bhatnagar, 9: Jantar Mantar, 10: Jawani, 11: Raktagandha, 12: Pusa Mohit, 13: Pusa Ajay, 14: Pusa Muskan, 15: Pusa Barahmasi, 16: Pusa Virangana, 17: Pusa Priya, 18: Dr. Bharat Ram, 19: Dr. M.S. Randhawa, 20: Priyadarshini, 21: Dulhan, 22: Dr. B.P. Pal, 23: Anurag, 24: Arjun, 25: Haseena, 26: R.S.S. of Nalagarh, 27: Sadabahar, 28: Nurjehan, 29: Pink Montezuma, 30: Surekha, 31: Dr. Benjamin Pal, 32: Pusa Ranjana, 33: Arunima, 34: Manasi, 35: Rose Sherbet, 36: Pusa Garima, 37: Pusa Gaurav, 38: Suryakiran, 39: Krishna, 40: Shola, 41: Pusa Pitamber, 42: Lahar, 43: Ganga, 44: Raja Ram Mohan Roy, 45: Iceberg, 46: Mridula, 47: Shabnam, 48: Chingari, 49: Surkhab, 50: Pusa Abhishek.
Antioxidants 11 02032 g005
Figure 6. Principal component analysis biplot for total anthocyanin content (ANC), total phenolic content (TPC), and antioxidant activities using FRAP and DPPH methods. 1: Pusa Arun, 2: Raktima, 3: Nehru Centenary, 4: Pusa Bahadur, 5: Lalima, 6: Bhim, 7: Ashwini, 8: Dr. S.S. Bhatnagar, 9: Jantar Mantar, 10: Jawani, 11: Raktagandha, 12: Pusa Mohit, 13: Pusa Ajay, 14: Pusa Muskan, 15: Pusa Barahmasi, 16: Pusa Virangana, 17: Pusa Priya, 18: Dr. Bharat Ram, 19: Dr. M.S. Randhawa, 20: Priyadarshini, 21: Dulhan, 22: Dr. B.P. Pal, 23: Anurag, 24: Arjun, 25: Haseena, 26: R.S.S. of Nalagarh, 27: Sadabahar, 28: Nurjehan, 29: Pink Montezuma, 30: Surekha, 31: Dr. Benjamin Pal, 32: Pusa Ranjana, 33: Arunima, 34: Manasi, 35: Rose Sherbet, 36: Pusa Garima, 37: Pusa Gaurav, 38: Suryakiran, 39: Krishna, 40: Shola, 41: Pusa Pitamber, 42: Lahar, 43: Ganga, 44: Raja Ram Mohan Roy, 45: Iceberg, 46: Mridula, 47: Shabnam, 48: Chingari, 49: Surkhab, 50: Pusa Abhishek.
Antioxidants 11 02032 g006
Figure 7. HPLC chromatograms of promising rose varieties. (a) Ashwini; (b) Pusa Arun; (c) Nehru Centenary; (d) Raktagandha; (e) Raktima; (f) Suryakiran; (g) Pusa Bahadur; (h) Bhim; (i) Dr. S.S. Bhatnagar; (j) Rose Sherbet; (k) Pusa Virangana; (l) Surkhab; (m) Pusa Ajay.
Antioxidants 11 02032 g007aAntioxidants 11 02032 g007bAntioxidants 11 02032 g007c
Table 1. List of rose varieties along with their parentage, group, and color.
Sr. No.Cultivar NameParentageGroupColor
1Pusa ArunQueen Elizabeth x Jantar MantarHybrid TeaDark red
2RaktimaHybrid seedling of Pink Parfait x SugandhaHybrid TeaRed
3Nehru CentenaryChristian Dior x AvonHybrid TeaDark red
4Pusa BahadurCara Mia x Century TwoHybrid TeaRed
5LalimaPicture x Jour d’eteHybrid TeaRed
6BhimCharles Mallerin x Delhi PrincessHybrid TeaRed
7AshwiniNot KnownHybrid TeaDark red
8Dr. S.S. BhatnagarNot KnownFloribundaDark red
9Jantar MantarNot KnownHybrid TeaRed
10JawaniSamourai x LouisianaHybrid TeaRed
11RaktaghandhaChristian Dior x seedling of CarrouselHybrid TeaRed
12Pusa MohitSuchitra x Christian DiorHybrid TeaPink
13Pusa AjayPink Parfait x Queen ElizabethHybrid TeaPink
14Pusa MuskanPink Parfait x AlinkaFloribundaColor blend (Cream with pink edges)
15Pusa BarahmasiNot KnownFloribundaPink
16Pusa ViranganaSelection from an open-pollinated seedling of Jantar MantarFloribundaRed
17Pusa PriyaJantar Mantar x Queen ElizabethHybrid TeaPink
18Dr. Bharat RamSweet Afton x GangaHybrid TeaPink
19Dr. M.S. RandhawaSabine x Kiss of FireHybrid TeaColor blend (White and pink)
20PriyadarshiniPink Parfait x First PrizeHybrid TeaColor blend (White and pink)
21DulhanBonne Nuit x Ena-HarknessHybrid TeaRed
22Dr. B.P. PalNot KnownHybrid TeaPink
23AnuragSweet Afton x GulzarHybrid TeaPink
24ArjunBlithe Spirit x MontezumaHybrid TeaPink
25HaseenaYouki San x BalineseHybrid TeaPink
26Raja Surendra Singh of NalagarhSamourai x MontezumaHybrid TeaPink
27Pusa SadabaharSeedling of FrolicFloribundaPink
28NurjehanSweet Afton x Crimson GloryHybrid TeaPink
29Pink MontezumaNot knownHybrid TeaPink
30SurekhaSeedling of Queen ElizabethHybrid TeaPink
31Dr. Benzamin PalSweet Afton x First PrizeHybrid TeaPink
32Pusa RanjanaSeedling of SabineHybrid TeaDeep pink
33ArunimaSeedling of FrolicFloribundaPink
34ManasiNot knownFloribundaPinkish white
35Rose SherbetSeedling of Gruss an TeplitzFloribundaDeep pink
36Pusa GarimaNot knownHybrid TeaPink
37Pusa GauravNot knownHybrid TeaDeep pink
38SuryakiranNot knownFloribundaOrange
39KrishnaNot knownFloribundaOrange
40SholaNot knownFloribundaOrange
41Pusa PitamberNot knownFloribundaYellow
42LaharHybrid seedling of Pink Parfait x GangaFloribundaYellow
43GangaSeedling of SabineHybrid TeaPale yellow
44Raja Ram Mohan RoyNot knownHybrid TeaYellow
45IcebergNot knownFloribundaWhite
46MridulaQueen Elizabeth x Seedling of Sir Henry SegraveHybrid TeaWhite
47ShabnamSeedling of Baby SylviaFloribundaWhite
48ChingariCharleston x Not knownFloribundaBicolored
(Yellow+ red)
49SurkhabNot knownHybrid TeaBicolored (Red + white)
50Pusa AbhishekBud sport of Jantar MantarFloribundaStriped (Pink with white stripes)
Table 2. Variation in total phenolic content and antioxidant activities of rose varieties.
VarietiesTotal Phenolic Content
(mgGAE/100 g)
FRAP
(μmol Trolox/g)
DPPH (%)
Pusa Arun306.78 ± 2.46237.145 ± 0.8487.43 ± 0.0.10 (69.20)
Raktima251.71 ± 1.56192.1467 ± 1.3883.88 ± 0.05 (66.30)
Nehru Centenary342.67 ± 3.05268.31 ± 1.8289.67 ± 0.16 (71.22)
Pusa Bahadur219.11 ± 1.67178.08 ± 0.9175.62 ± 0.18 (60.39)
Lalima195.45 ± 3.79169.83 ± 0.7971.58 ± 0.16 (57.76)
Bhim333.20 ± 1.43216.89 ± 0.7885.77 ± 0.14 (67.81)
Ashwini427.59 ± 3.47397.15 ± 0.8293.47 ± 0.19 (75.17)
Dr. S.S. Bhatnagar379.24 ± 2.26286.97 ± 1.3791.36 ± 0.05 (72.88)
Jantar Mantar209.12 ± 0.86174.22 ± 1.0972.62 ± 0.17 (58.43)
Jawani132.38 ± 3.75102.27 ± 1.0862.73 ± 0.08 (52.34)
Raktagandha217.99 ± 3.84193.32 ± 4.3181.80 ± 0.10 (64.72)
Pusa Mohit124.21 ± 2.05106.22 ± 0.8164.35 ± 0.16 (53.32)
Pusa Ajay101.03 ± 2.3286.76 ± 1.7035.71 ± 0.18 (36.68)
Pusa Muskan67.18 ± 1.9564.68 ± 1.6933.61 ± 0.17 (35.40)
Pusa Barahmasi116.45 ± 1.76110.81 ± 0.9666.44 ± 0.12(54.58)
Pusa Virangana201.22 ± 1.37183.93 ± 1.2880.67 ± 0.08(63.90)
Pusa Priya44.77 ± 2.6851.11 ± 1.0920.74 ± 0.05 (27.08)
Dr. Bharat Ram21.77 ± 0.5929.59 ± 0.6215.74 ± 0.16 (23.36)
Dr. M.S. Randhawa55.78 ± 2.6565.37 ± 0.8623.88 ± 0.00 (29.24)
Priyadarshini55.17 ± 2.4361.23 ± 1.1222.63 ± 0.10 (28.40)
Dulhan124.10 ± 2.85114.32 ± 2.6658.49 ± 0.09 (49.87)
Dr. B.P. Pal128.45 ± 1.39116.07 ± 1.3259.45 ± 0.10 (50.43)
Anurag64.44 ± 0.9072.35 ± 0.7128.52 ± 0.08 (32.27)
Arjun131.06 ± 0.90121.78 ± 00.7357.42 ± 0.06 (49.25)
Haseena163.04 ± 1.96142.60 ± 1.1860.41 ± 0.08 (50.99)
R.S.S. of Nalagarh129.69 ± 2.15113.97 ± 1.9946.41 ± 0.12 (42.93)
Sadabahar94.56 ± 1.2296.05 ± 0.7131.47 ± 0.13 (34.11)
Nurjehan90.71 ± 0.6192.25 ± 0.5430.69 ± 0.09 (33.63)
Pink Montezuma54.74 ± 2.1265.49 ± 0.8221.52 ± 0.15 (27.63)
Surekha70.68 ± 0.5477.31 ± 0.5925.86 ± 0.05 (30.56)
Dr. Benjamin Pal61.76 ± 1.7863.94 ± 0.5022.76 ± 0.11(28.49)
Pusa Ranjana199.61 ± 0.65179.70 ± 1.9270.47 ± 0.12 (57.06)
Arunima69.94 ± 3.3283.10 ± 1.0328.48 ± 0.13 (32.24)
Manasi12.21 ± 0.9721.92 ± 0.8910.74 ± 0.10 (19.12)
Rose Sherbet205.05 ± 3.15186.23 ± 1.3772.40 ± 0.11 (58.28)
Pusa Garima136.02 ± 1.16114.75 ± 0.7748.55 ± 0.09 (44.15)
Pusa Gaurav174.74 ± 0.64171.02 ± 0.8163.47 ± 0.13 (52.79)
Suryakiran153.48 ± 2.08167.93 ± 0.8962.31 ± 0.11 (52.10)
Krishna78.30 ± 0.8587.96 ± 0.9932.74 ± 0.09 (34.89)
Shola143.08 ± 1.76132.86 ± 1.1549.55 ± 0.14 (44.73)
Pusa Pitamber17.63 ± 1.5423.51 ± 0.4711.59 ± 0.18 (19.89)
Lahar21.92 ± 0.8627.47 ± 0.6212.77 ± 0.05 (20.93)
Ganga11.32 ± 0.5920.61 ± 0.498.51 ± 0.27 (16.95)
Raja Ram Mohan Roy18.91 ± 0.3825.43 ± 1.3311.62 ± 0.16 (19.92)
Iceberg5.21 ± 0.398.92 ± 0.364.45 ± 0.30 (12.17)
Mridula7.53 ± 0.7911.77 ± 0.475.36 ± 0.32 (13.38)
Shabnam11.11 ± 0.9317.81 ± 1.048.23 ± 0.09 (16.66)
Chingari92.40 ± 0.6499.77 ± 0.4644.66 ± 0.14 (41.92)
Surkhab164.41 ± 0.74161.40 ± 1.1561.68 ± 0.09 (51.73)
Pusa Abhishek130.60 ± 0.98129.10 ± 1.0558.40 ± 0.07 (49.82)
SEm±1.961.260.14
CD ( p ≤ 0.05)5.503.540.38
Values in parentheses are arc sin transformed values.
Table 3. Linear correlation coefficients (r) between total anthocyanin content, antioxidant assays (FRAP, DPPH), and total phenolic content in petals of 50 rose varieties obtained by Pearson’s analysis.
ParametersTACFRAPDPPHTPC
TAC10.934 **0.796 **0.932 **
FRAP 10.921 **0.988 **
DPPH 10.920 **
TPC 1
** Correlation is significant at the 0.01 level (2-tailed).
Publisher’s Note: MDPI stays neutral with regard to jurisdictional claims in published maps and institutional affiliations.

