Article

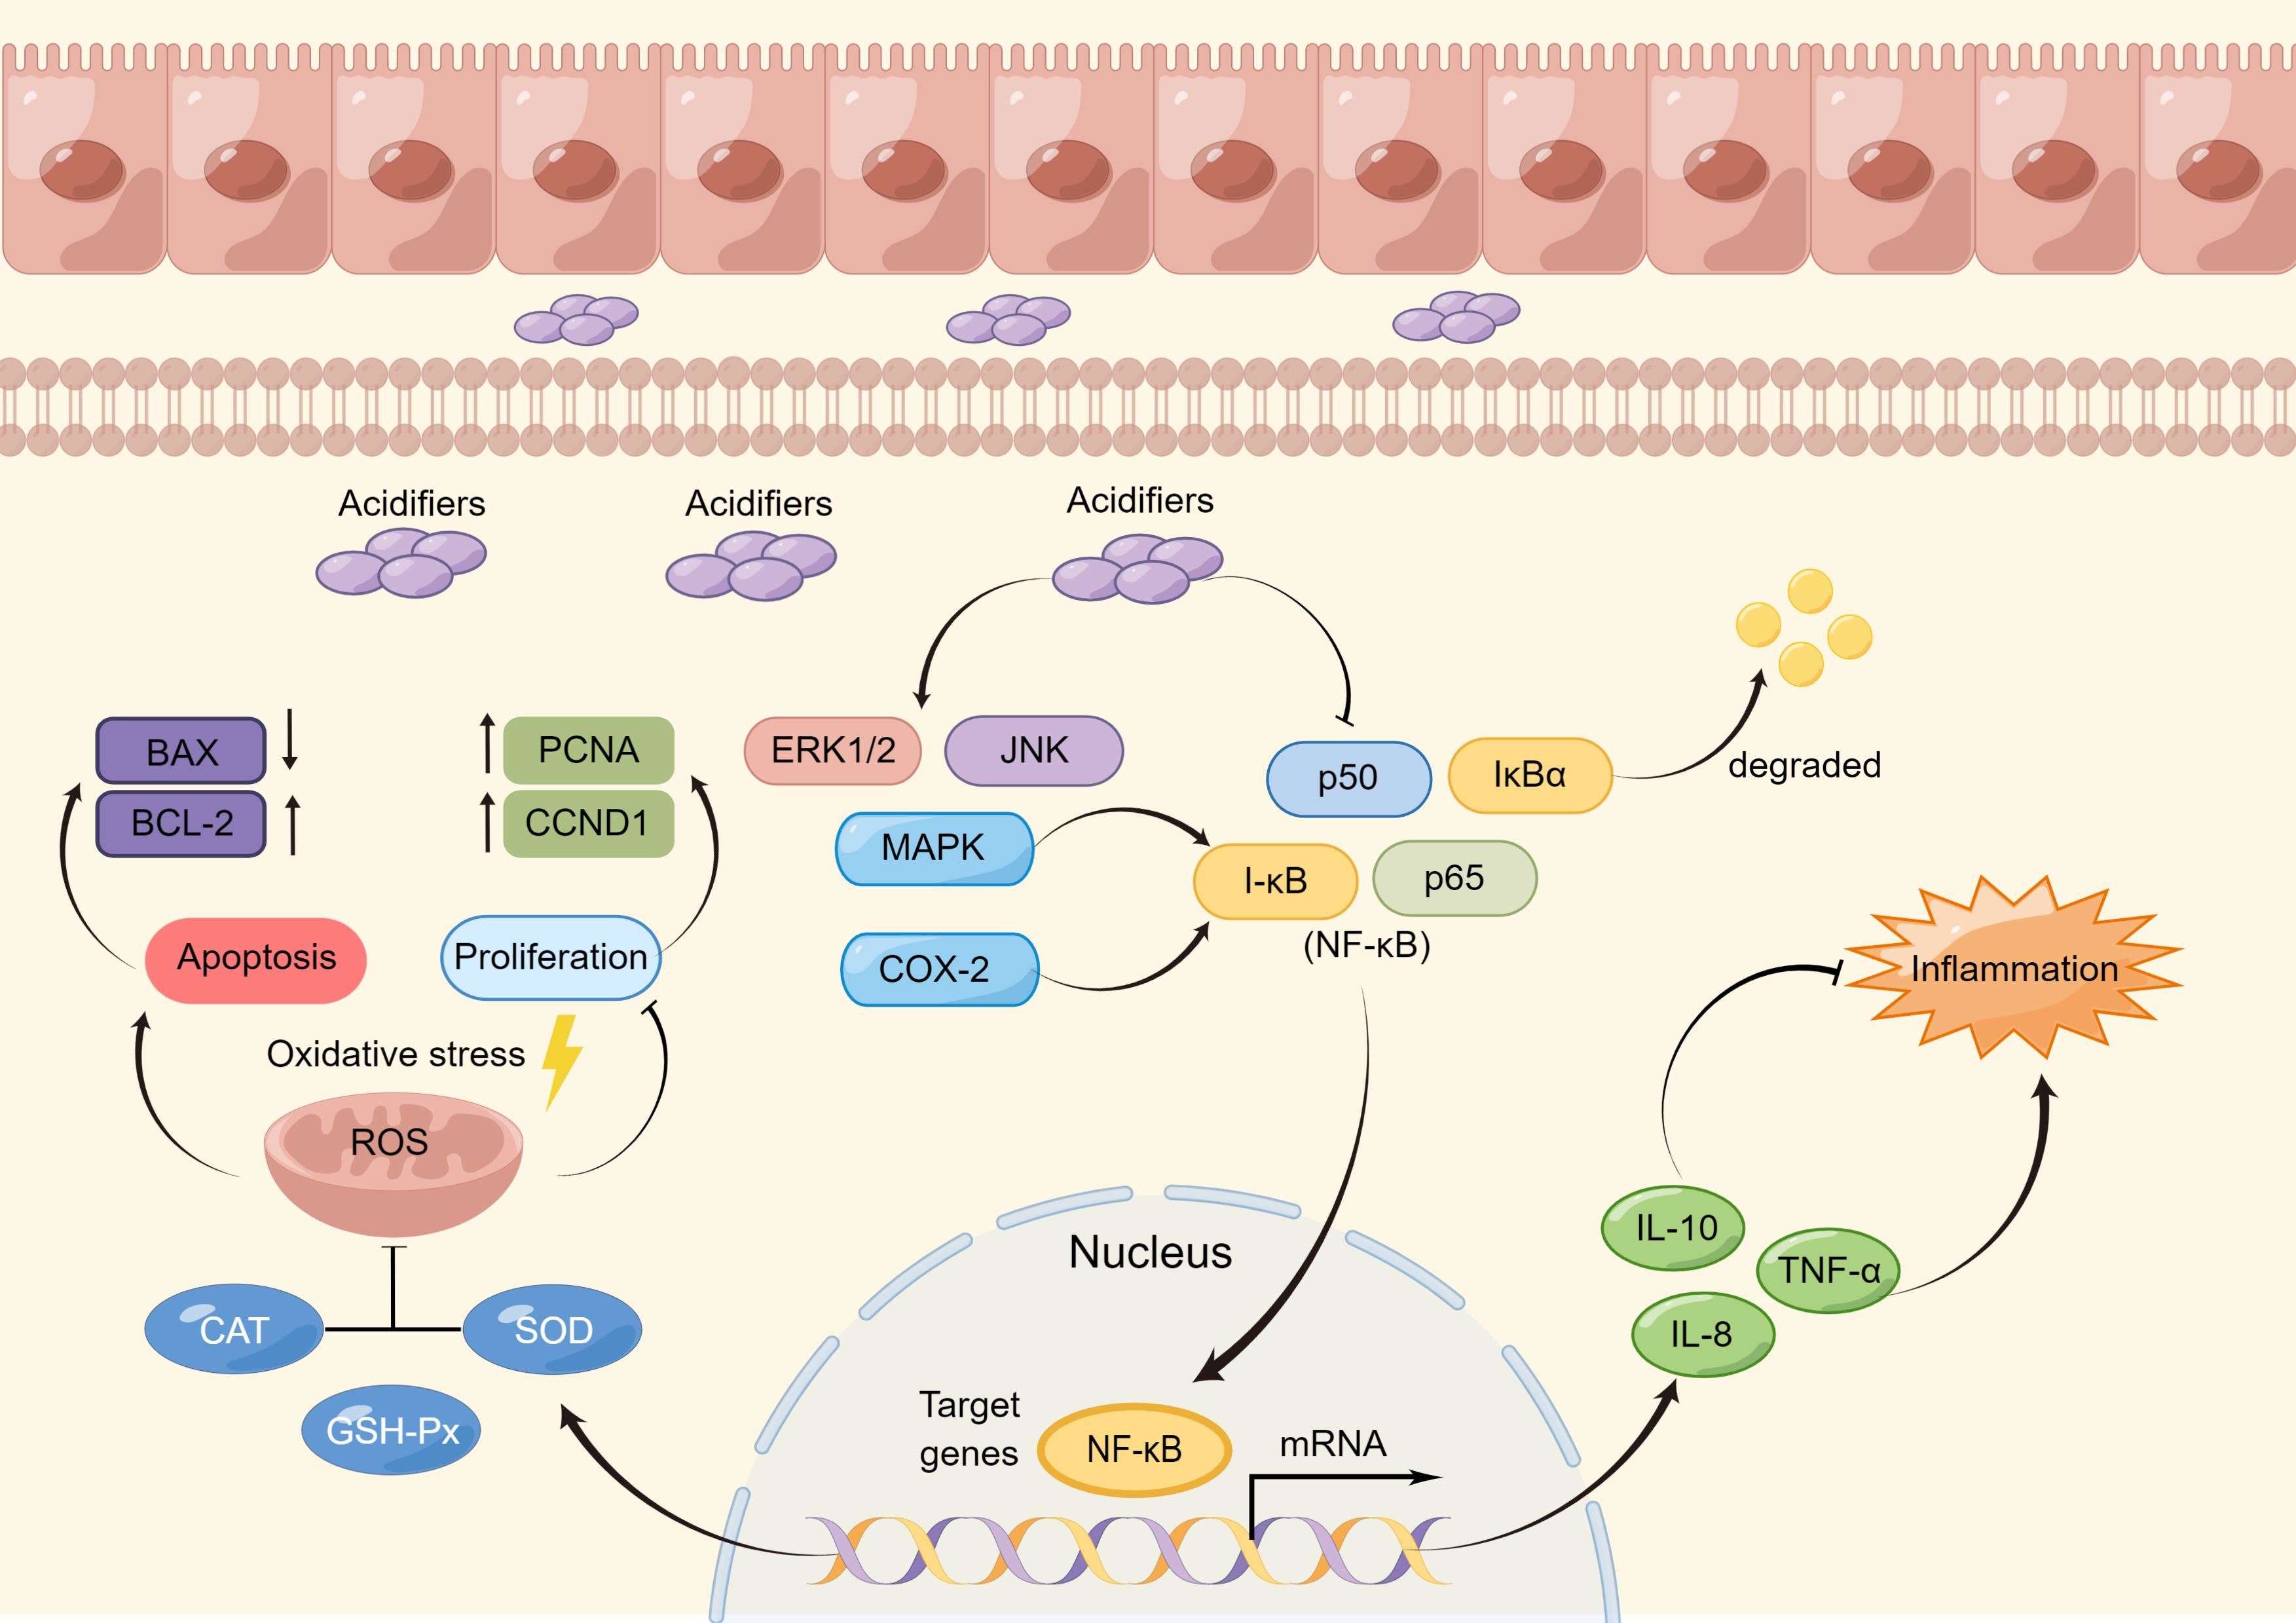
Acidifiers Attenuate Diquat-Induced Oxidative Stress and Inflammatory Responses by Regulating NF-κB/MAPK/COX-2 Pathways in IPEC-J2 Cells

1
College of Animal Science and Technology, Nanjing Agricultural University, Nanjing 210095, China
2
Yantai Jinhai Pharmaceutical Co., Ltd., Yantai 265323, China
*
Author to whom correspondence should be addressed.
Antioxidants 2022, 11(10), 2002; https://doi.org/10.3390/antiox11102002
Submission received: 30 August 2022 / Revised: 2 October 2022 / Accepted: 7 October 2022 / Published: 10 October 2022
(This article belongs to the Special Issue Oxidative Stress, Reactive Oxygen Species and Animal Nutrition)

Abstract

:
In this study, we evaluated the protective effects and potential mechanisms of acidifiers on intestinal epithelial cells exposure to oxidative stress (OS). IPEC-J2 cells were first pretreated with 5 × 10⁻⁵ acidifiers for 4 h before being exposed to the optimal dose of diquat to induce oxidative stress. The results showed that acidifiers attenuated diquat-induced oxidative stress, which manifests as the improvement of antioxidant capacity and the reduction in reactive oxygen species (ROS) accumulation. The acidifier treatment decreased cell permeability and enhanced intestinal epithelial barrier function through enhancing the expression of claudin-1 and occludin in diquat-induced cells. Moreover, acidifier treatment attenuated diquat-induced inflammatory responses, which was confirmed by the decreased secretion and gene expression of pro-inflammatory (TNF-α, IL-8) and upregulated anti-inflammatory factors (IL-10). In addition, acidifiers significantly reduced the diquat-induced gene and protein expression levels of COX-2, NF-κB, I-κB-β, ERK1/2, and JNK2, while they increased I-κB-α expression in IPEC-J2 cells. Furthermore, we discovered that acidifiers promoted epithelial cell proliferation (increased expression of PCNA and CCND1) and inhibited apoptosis (decreased expression of BAX, increased expression of BCL-2). Taken together, these results suggest that acidifiers are potent antioxidants that attenuate diquat-induced inflammation, apoptosis, and maintain cellular barrier integrity by regulating the NF-κB/MAPK/COX-2 signaling pathways.

Graphical Abstract

1. Introduction

At weaning, piglets are affected by many stress factors, such as the change of feed and environment, mixing group and so on, which lead to the decline of body immunity and weaning stress syndrome [1,2]. In the process of early weaning, piglets’ antioxidant capacity decreases and free radicals increase, forming oxidative stress in the body, which is considered to be an important reason for “early weaning syndrome”. The intestinal epithelium comprises monolayer cells and is the primary site of oxidative stress response [3]. At the same time, it also has the functions of nutrient absorption and innate immunity, which are very important for maintaining intestinal homeostasis [4]. The tight junction between intestinal epithelial cells is one of the important structural bases for maintaining the function of the intestinal barrier [5]. Recent studies have shown that oxidative stress destroys the tight junction between intestinal epithelial cells in a variety of ways, resulting in intestinal epithelial barrier dysfunction [6,7]. Some oxidative stressors increase the permeability of the intestinal epithelial barrier by disrupting tight junctions, accompanied by the disturbance of the NF-kappaB pathway and intestinal inflammation [8]. Therefore, treatment to maintain the integrity of the intestinal epithelial barrier may be beneficial to intestinal and host health to reduce inflammatory response and oxidative stress injury.
Acidifiers are natural organic acids and salts that have long been considered as the feed additives to replace antibiotics in weaned pigs [9]. Acidifiers improved growth performance [10], alleviated gut inflammation, and enforced gut barrier integrity in pigs [11]. It was reported that acidifiers had a higher antioxidant capacity under heat stress conditions in pigs [12]. Furthermore, studies have demonstrated that acidifiers exert their immune regulatory function and inhibit the invasion of enterotoxigenic Escherichia coli F4 in vitro [13,14]. Our previous study also showed that supplementing the drinking water with acidifiers had the potential as antioxidants, which was reflected in the improvement of growth performance, immunity, and antioxidant capacity in pigs [15]. However, the precise molecular mechanism of acidifier action still remains unclear. On the other hand, most studies have focused on its effects in vivo, and little is known about the underlying protective mechanisms of acidifiers in porcine small intestinal cells, which are related to reducing inflammatory responses as well as improving antioxidant capacity. IPEC-J2 cells were isolated from the middle jejunum of neonatal piglets [16]. In recent years, IPEC-J2 cells have been widely used in studying the intestinal functions associated with immune response [17], barrier function [18], and antioxidant capacity research in vitro [19].
Diquat (DQ) is a commonly used oxidative stress inducer, which produces reactive oxygen species (ROS) and reactive nitrogen species (RNS) through redox cycling processes, and then leads to oxidative stress and cell death [20,21]. Therefore, to clarify the mechanism of the antioxidant effect of the acidifiers, we explored the protective effect of acidifiers on intestinal porcine epithelial cells (IPEC-J2) that were exposed to oxidative stress induced by DQ to prove its effectiveness even when administered in vitro. We also investigated the potential important role of acidifiers in maintaining the integrity of the intestinal epithelial barrier and alleviating the inflammatory responses induced by DQ in the IPEC-J2 cells. Here, we report convincing evidence that acidifiers have antioxidant effects and immune function and provide key insights into their potential mechanisms of action.

2. Materials and Methods

2.1. IPEC-J2 Cells Culture

The intestinal porcine enterocyte cell (IPEC-J2) lines were kindly provided by the lab of Dr Chunmei Li (Nanjing Agricultural University). The IPEC-J2 cells were cultured and maintained in Dulbecco’s modified Eagle’s medium/nutrient mixture F12 (DMEM/F12) medium (Gibco, Grand Island, NY, USA) supplemented with 10% fetal bovine serum (FBS, Gibco, Grand Island, NY, USA) and penicillin-streptomycin (Gibco, Grand Island, NY, USA). The resuscitated IPEC-J2 cells were cultured in a humidified incubator at 37 °C with a 5% CO2 atmosphere. After 12 h, the culture medium was replaced for the first time with fresh medium. After that, the medium was replaced every 24 h depending on the developmental state of the cells. Then, when they reached 80% confluence, the cells were detached with 0.05% trypsin (Gibco, Grand Island, NY, USA) and subcultured in culture medium.

2.2. Establishment of Oxidative Stress Model in IPEC-J2 Cells

The DQ-induced oxidative stress model was used to evaluate cell proliferation and cytotoxicity utilizing an MTT cell assay kit (Jiancheng Bioengineering Institute, Nanjing, China). The IPEC-J2 cells grown at a logarithmic phase were treated with 0.1% trypsin to prepare a single cell suspension and then seeded in a 96-well cell culture plate. The number of seeds was 1 × 10⁴ cells/well. The cells were cultivated in an incubator at 37 °C with a constant concentration of 5% CO2 for 24 h. The medium was then discarded, and the wells were washed with sterile phosphate-buffered saline (PBS, Gibco, Grand Island, NY, USA) before being filled with medium containing 0, 100, 250, 500, 750, 1000, 1250, and 1500 μmol/L of DQ. Six hours was selected as the treatment time of diquat to induce the cytotoxicity of IPEC-J2 cells according to a previous report [22]. Then, 50 µL of MTT assay solution was added into each well, and it was incubated for 4 h. Afterward, a microplate reader (Tecan, Austria GmbH, Grödig, Austria) was used to determine the absorbance of the plate at 570 nm. In order to establish the cellular oxidative stress model for IPEC-J2 cells, the 50% inhibitory concentration (IC50) was determined as the optimal DQ concentration, causing a 50% reduction in cell viability based on the MTT assay. MTT assays were performed with eight replicate wells per dose and repeated twice to confirm the results.

2.3. Treatment of IPEC-J2 Cells with Acidifiers

The optimal concentration and time of acidifiers were determined using a cell counting kit (CCK-8 kit, Jiancheng Bioengineering Institute, Nanjing, China) according to the instruction of the manufacturer. The water-soluble liquid acidifiers (Jinlisuan, Yantai Jinhai Pharmaceutical Co., Ltd., Yantai, China) consist of 19% formic acid, 19% acetic acid, 15% lactic acid, 3.5% propionic acid, and its organic acid salts. The IPEC-J2 cells were treated with the medium containing 2 × 10⁻³, 1.5 × 10⁻³, 1 × 10⁻³, 5 × 10⁻⁴, 1 × 10⁻⁴, or 5 × 10⁻⁵ dilutions of acidifiers using the same seeding method as MTT for 2 h, 4 h, or 6 h. A total of 10 µL of CCK-8 solution was added to each well, and the plate was incubated for 1 h. The optimal acidifier concentration was calculated according to the cell viability based on the CCK-8 assay. The microplate reader (Tecan, Austria GmbH, Grödig, Austria) was used to determine the absorbance of the plate at 450 nm.
To estimate the antioxidant effect of acidifiers on IPEC-J2 cells, the cells were further allocated one of four groups: CON (without any treatments); DQ (DQ treatment, treated with optimal concentration and incubation time based on the above experiment); AC (acidifier treatment, treated with optimal concentration based on the above experiment); and AC + DQ (acidifier pretreatment and then DQ treatment) groups. Before the acidifier or DQ treatment, each group was washed twice with PBS at the same time.

2.4. Intracellular ROS Assays

A ROS assay kit (Jiancheng Bioengineering Institute, Nanjing, China) was used to detect the intracellular ROS level of the treated IPEC-J2 cells. The 2′, 7′-dichlorohydro-fluorescein diacetate (DCFH-DA) is the most sensitive and commonly used probe for detecting intracellular ROS. The IPEC-J2 cells were cultured in 96-well plates (104 cells per well, 8 replicates per group) and subjected to their indicated treatments. Next, the cells were washed twice with PBS and treated with 100 μL of 10 μM DCFH-DA (1:1000 dilution in serum-free DMEM/F12 medium) at 37 °C for 20 min. DCFH is oxidized into a strong green fluorescence substance, dichlorofluorescein (DCF), in the presence of ROS in cells, and its optimal excitation wavelength is 488 nm, while the emission wavelength is at 525 nm. Its fluorescence intensity is proportional to the ROS levels in cells. The fluorescence signals were monitored using a microplate reader (Tecan, Austria GmbH, Grödig, Austria).

2.5. Antioxidant Indicators and Cytokine Assay

After the cells were treated as described above, they were gently washed twice with PBS and lysed using a Radio Immunoprecipitation Assay lysis buffer (RIPA, Biosharp, Beijing, China) containing 1% phenylmethylsulfonyl fluride (PMSF, Biosharp, Beijing, China) on ice for 20 min. The cells were centrifuged at 10,000× g for 10 min at 4 °C, and the cell lysates were gathered to determine oxidative stress indicators: methane dicarboxylic aldehyde (MDA), total anti-oxidation capacity (T-AOC), total superoxide dismutase (T-SOD), catalase (CAT), and glutathione peroxidase (GSH-Px). Cell culture supernatant was harvested and determined the secretion of cytokine, including tumor necrosis factor-α (TNF-α), interleukin-8 (IL-8), and interleukin-10 (IL-10). All antioxidant indicators and inflammatory factors were determined using enzyme-linked immunosorbent assay (ELISA) kits (Jiancheng Bioengineering Institute, Nanjing, China) according to the manufacturer’s guidelines. In brief, we measured the absorbance (OD value) of each well and calculated the test samples according to the standard curve. For antioxidant indicators, the OD values of T-AOC, T-SOD, GSH-Px, MDA, and CAT were measured using a microplate reader (Tecan, Austria GmbH, Grödig, Austria) at 593 nm, 550 nm, 405 nm, 532 nm, and 405 nm, respectively. For cytokine, the OD values of TNF-α, IL-8, and IL-10 were measured at 450 nm. Each group had 6 replicates, and each sample was determined three times. The intra- and inter-assay coefficients of variation were less than 10%.

2.6. Immunofluorescence Analysis

The distribution of the tight-junction protein (claudin-1) in the IPEC-J2 cells was determined by an immunofluorescence analysis. Briefly, the IPEC–J2 cells were seeded on cover-slides treated with poly(L-lysine) (Biosharp, Beijing, China) and placed in 12-well plates for 12 h to reach 70% confluence. The cells were fixed with 4% paraformaldehyde (Beyotime, Shanghai, China) for 30 min, and then they were permeabilized with 0.5% Triton X-100 buffer (Beyotime, Shanghai, China) at room temperature for 20 min. Thereafter, the IPEC–J2 cells were incubated with anti-claudin-1 antibody (dilution 1:500; ABclonal, Wuhan, China) for 1 h at room temperature and then incubated with fluorescein conjugated goat anti-rabbit IgG (H + L) antibody (dilution 1:500; Proteintech, Wuhan, China) in the dark for 1 h. The cell nuclei were stained with 4′,6-Diamidino-2-Phenylindole (DAPI, Beyotime, Shanghai, China) solution. The slides were visualized under a laser scanning confocal microscope (Zeiss, LSM 700; Oberkochen, Germany).

2.7. Cell Proliferation Assay

IPEC-J2 cells proliferation was quantified using an ethynyldeoxyuridine (EdU) kit (RiboBio, Guangzhou, China) according to the manufacturer’s instruction. The cells were seeded into 12-well plates, as described above. Each well received 300 μL of 50 μM EdU, and the cells were incubated for an additional 2 h, after which they were washed with 500 µL of PBS and fixed with 4% paraformaldehyde for 30 min. To neutralize the excess aldehyde groups, 200 µL of 2 mg/mL of glycine was aliquoted per well and incubated with the cells for 5 min. Subsequently, 500 µL of PBS (0.5% Triton X-100) was added into each well to incubate with the cells for 10 min. After the cells were washed with PBS, 300 μL of Apollo reagent was added, and the cells were incubated in the dark for 30 min at room temperature. The cells were washed with PBS (0.5% Triton X-100) and the nuclei were stained with Hoechst 33342 reaction solution for 30 min in the dark. The EdU-stained cells were visualized and quantified using a fluorescence microscope. Three fields were randomly selected for quantification and statistical analysis.

2.8. Detection of Apoptosis by Flow Cytometry

Cellular apoptosis was assessed using Annexin V-fluorescein isothiocyanate (FITC) with a propidium iodide (PI) staining assay (Vazyme, Nanjing, China) according to the manufacturer’s instructions. Briefly, the cells were harvested and incubated with 5 μL of AnnexinV-FITC and PI for 10 min at room temperature in the dark. After that, the cells were resuspended in 400 µL 1 × binding buffer and then mixed thoroughly. Subsequently, the apoptotic cells were immediately measured by a BD FACS Calibur flow cytometer (BD Biosciences, San Jose, CA, USA) and analyzed with FlowJo software (Tree Star, Stanford University, CA, USA).

2.9. RNA Extractions and Real-Time Quantitative PCR (qRT-PCR)

Total RNA was extracted utilizing TRIzol Reagent (Invitrogen, Carlsbad, CA, USA) from IPEC-J2 cells. The Nanodrop spectrophotometer (Thermo Scientific, Waltham, MA, USA) was used to examine the RNA concentration and quality. We utilized the HiScript ® III RT SuperMix for qPCR (+gDNA wiper) (Vazyme, Nanjing, China) to synthesize cDNA according to the manufacturer’s instructions. The qRT-PCR was conducted using ChamQ Universal SYBR qPCR Master Mix (Vazyme, Nanjing, China) based on the manufacturer’s manual. All primers were synthesized commercially by TsingKe Biotech Co., Ltd. (Tsingke, Nanjing, China) and are shown in Table S1. Glyceraldehyde-3-phosphate dehydrogenase (GAPDH) was used as an endogenous control. The relative abundance of each mRNA was calculated using the 2−∆∆Ct method [23].

2.10. Western Blotting

Proteins were extracted from the IPEC-J2 cells using RIPA lysis buffer (Biosharp, Beijing, China). Protein concentrations were determined by a BCA protein quantification kit (Vazyme, Nanjing, China) and a microplate reader (Tecan, Austria GmbH, Grödig, Austria). Equal amounts of proteins were resolved on 4–20% sodium dodecyl sulfate polyacrylamide gel electrophoresis (SDS–PAGE, Genscript, Nanjing, China), and then transferred onto a polyvinylidene fluoride (PVDF) membrane (Immobilon Transfer Membranes, Merck Millipore, Merck KGaA, Darmstadt, Germany) with a wet transfer system (Tanon, Shanghai, China). After being blocked with TBST containing 5% non-fat milk powder (Mulinsen, Nanjing, China) for 1 h at room temperature, the membranes were incubated in specific primary antibodies, COX-2, NF-κB, I-κB-α, I-κB-β, ERK1/2, and JNK2 MAPK (1:500, ABclonal, Wuhan, China) at 4 °C overnight. The PVDF membranes were washed with TBST and then incubated with secondary antibody anti-rabbit (1:8000; Affinity, Changzhou, China) for 1 h at room temperature. Signal densities of the immunoblotting image were determined using a high-sensitivity chemiluminescence ECL detection kit (Vazyme, Nanjing, China) on a ChemiDocTM Imaging System (Bio-Rad, Hercules, CA, USA). Protein levels were normalized to GAPDH, and the densitometric quantification of Western blotting bands was analyzed using ImageJ software (NIH, Bethesda, MD, USA).

2.11. Statistical Analysis

The data were analyzed using a one-way analysis of variance (ANOVA) and Tukey’s test to determine the differences between treatments in SAS 9.4 software (SAS Inst. Inc., Cary, NC, USA). The results are expressed as means ± standard error of the mean (SEM). The calculation of median effective dose (IC50) was conducted using GraphPad Prism software (GraphPad Prism v8.0, GraphPad Software Inc., San Diego, CA, USA). The level of statistical significance was set at p < 0.05. The figures were also prepared using GraphPad Prism software.

3. Results

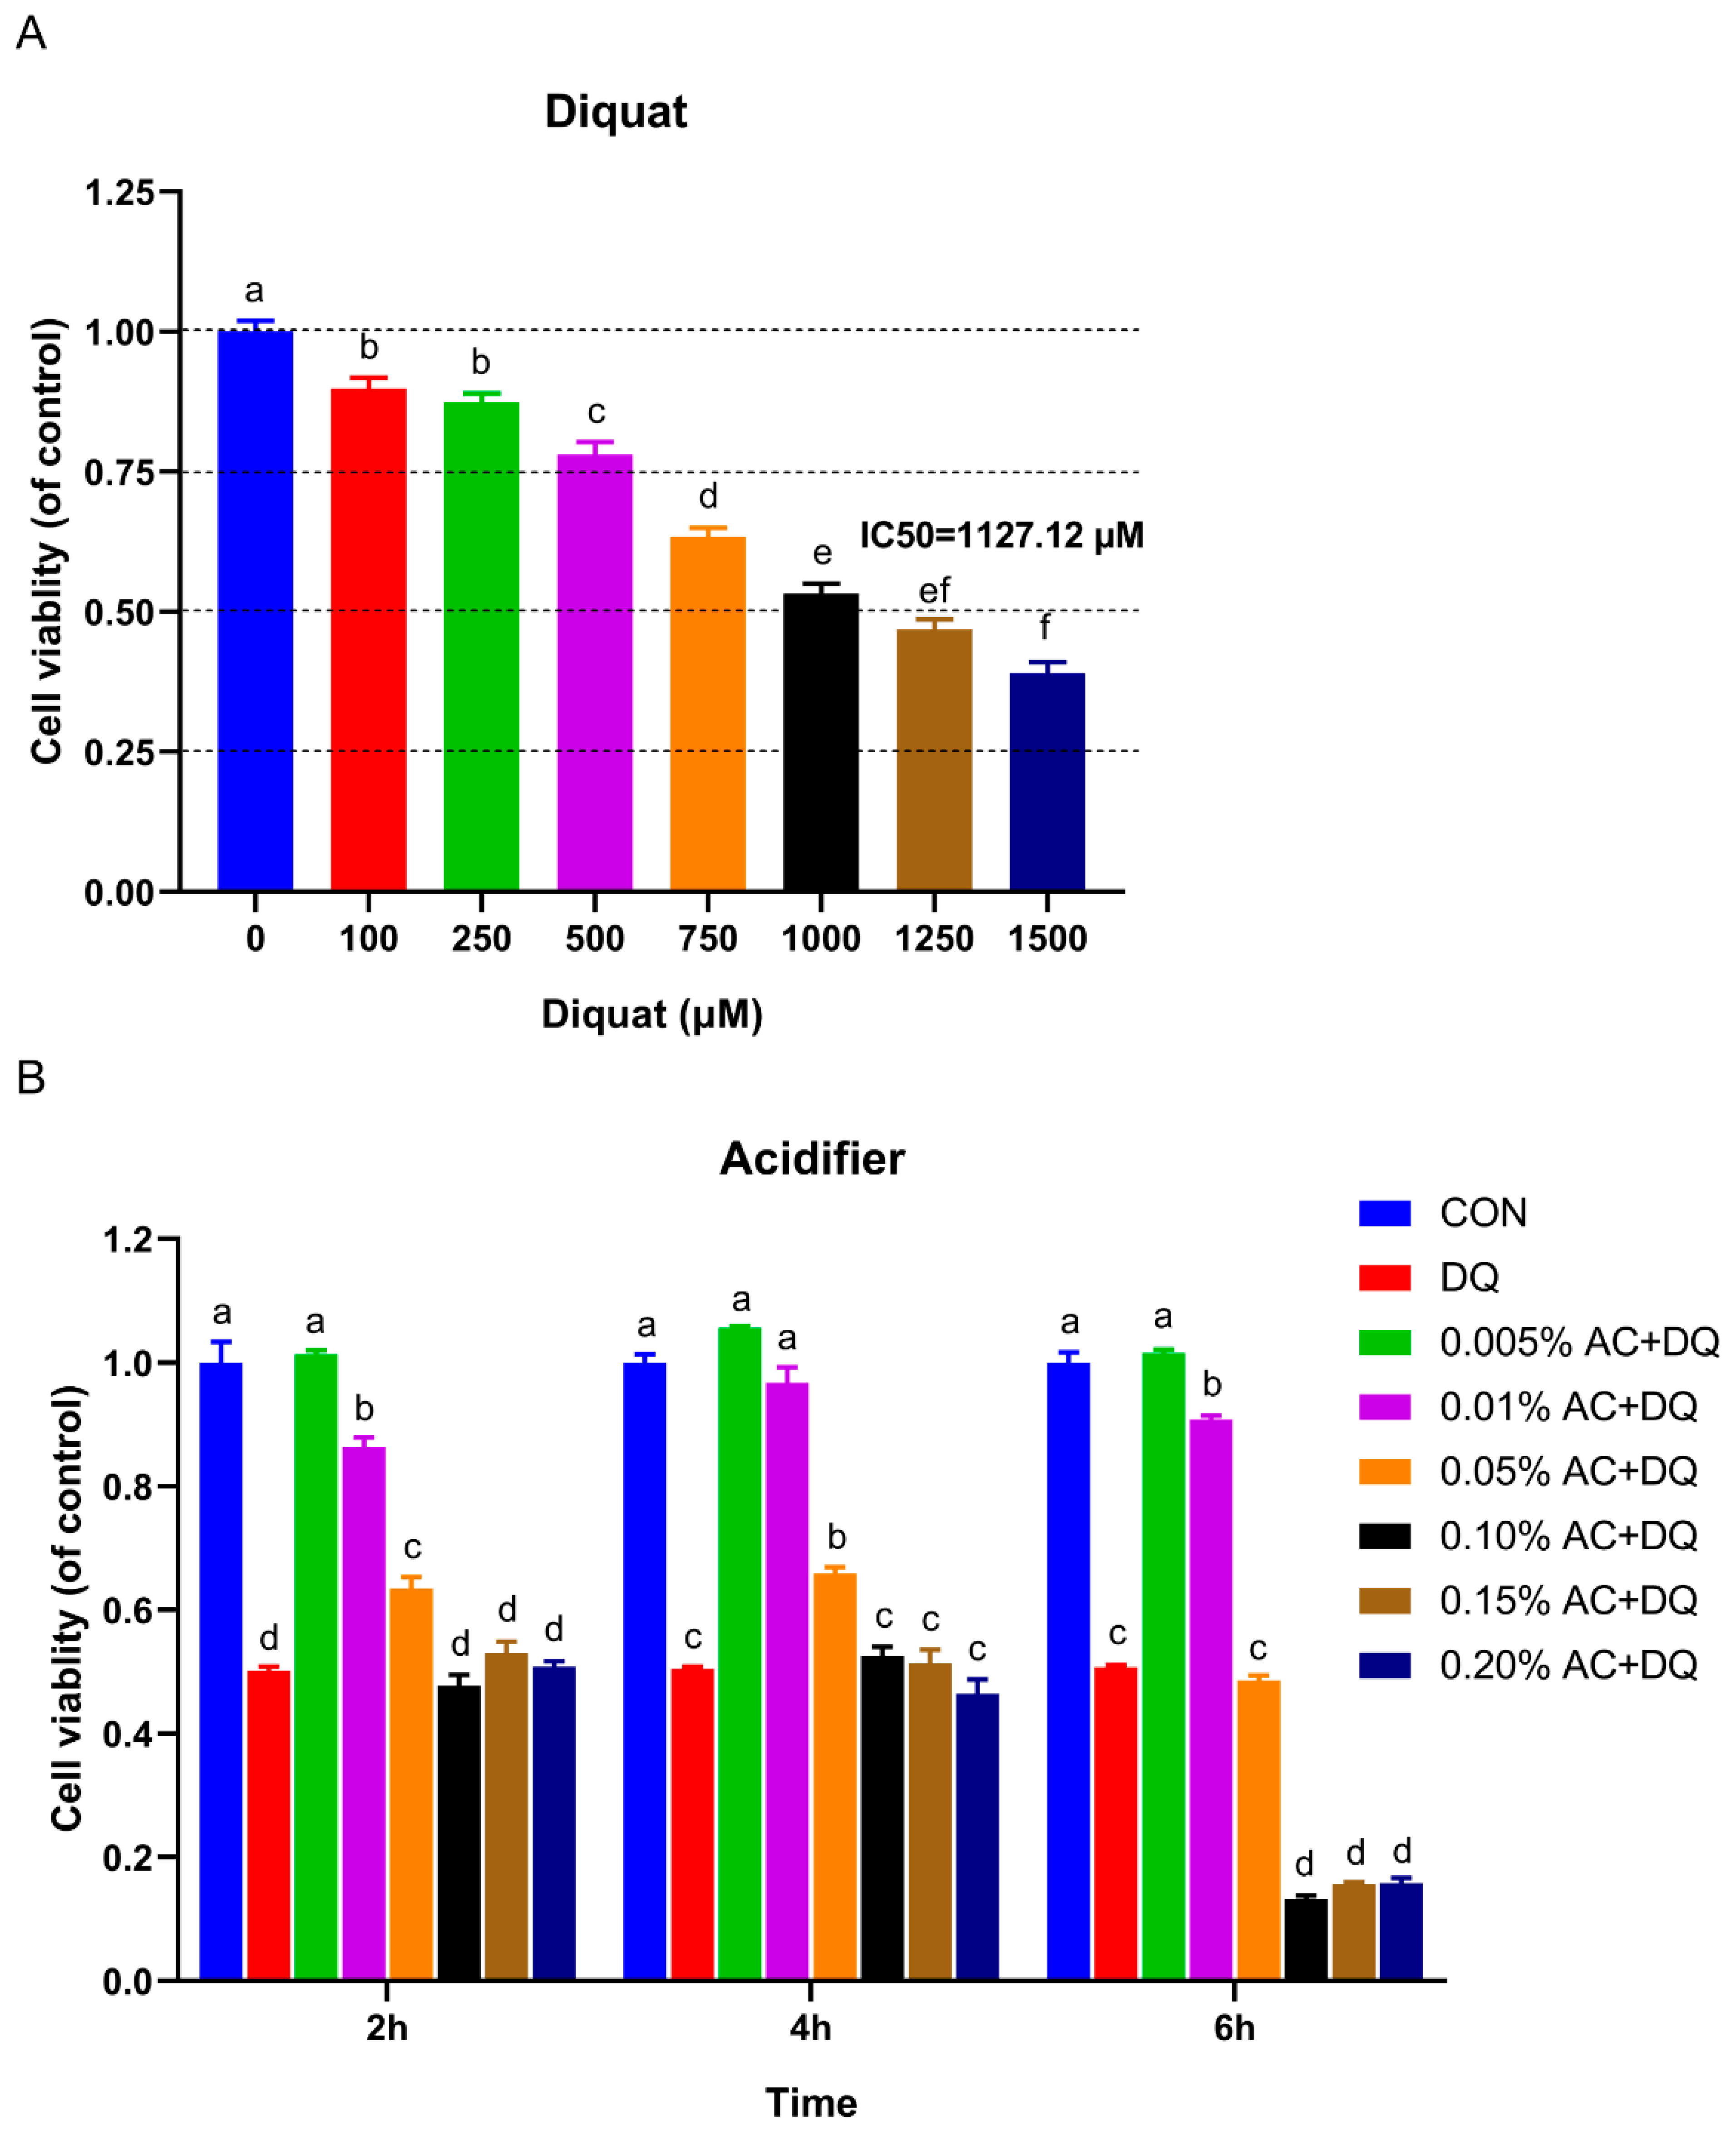
3.1. Establishment of Oxidative Stress Model Induced by DQ in IPEC-J2 Cells

The oxidative stress model of IPEC-J2 cells was established by the induction of DQ. IC50 represents 50% of the inhibitor concentration required for the inhibition of cell viability and enzymes activity [24]. The IPEC-J2 cells’ viability was significantly reduced by 100 μM of DQ and reduced to less than 50% of the control group by DQ of 1250 μM (Figure 1A). Notably, DQ reduced the IPEC-J2 cells’ viability in a dose-dependent manner. The IC50 of DQ for IPEC-J2 cells was approximately 1127.12 μM. Therefore, the concentration of 1150 μM was used as the optimal dose of DQ for the following experiments.
IPEC-J2 cells were pretreated with acidifiers at different concentrations (0, 5 × 10⁻⁵, 1 × 10⁻⁴, 5 × 10⁻⁴, 1 × 10⁻³, 1.5 × 10⁻³, and 2 × 10⁻³) and incubation times (2 h, 4 h, and 6 h), and then their cell viability was further detected. As shown in Figure 1B, both the high concentration of acidifier (i.e., 1 × 10⁻³) and the longer incubation time decreased cell viability (Figure 1B), while pretreatment with low concentrations of acidifier (e.g., 5 × 10⁻⁵) significantly increased cell viability. Specifically, the cell viability was significantly increased by pretreatment with acidifiers for 4 h. The cells that were pretreated with 5 × 10⁻⁵ acidifier had the greatest cell viability. Hence, the experimental parameters (5 × 10⁻⁵ acidifier concentration and 4 h pretreatment time) were used in the subsequent experiments.

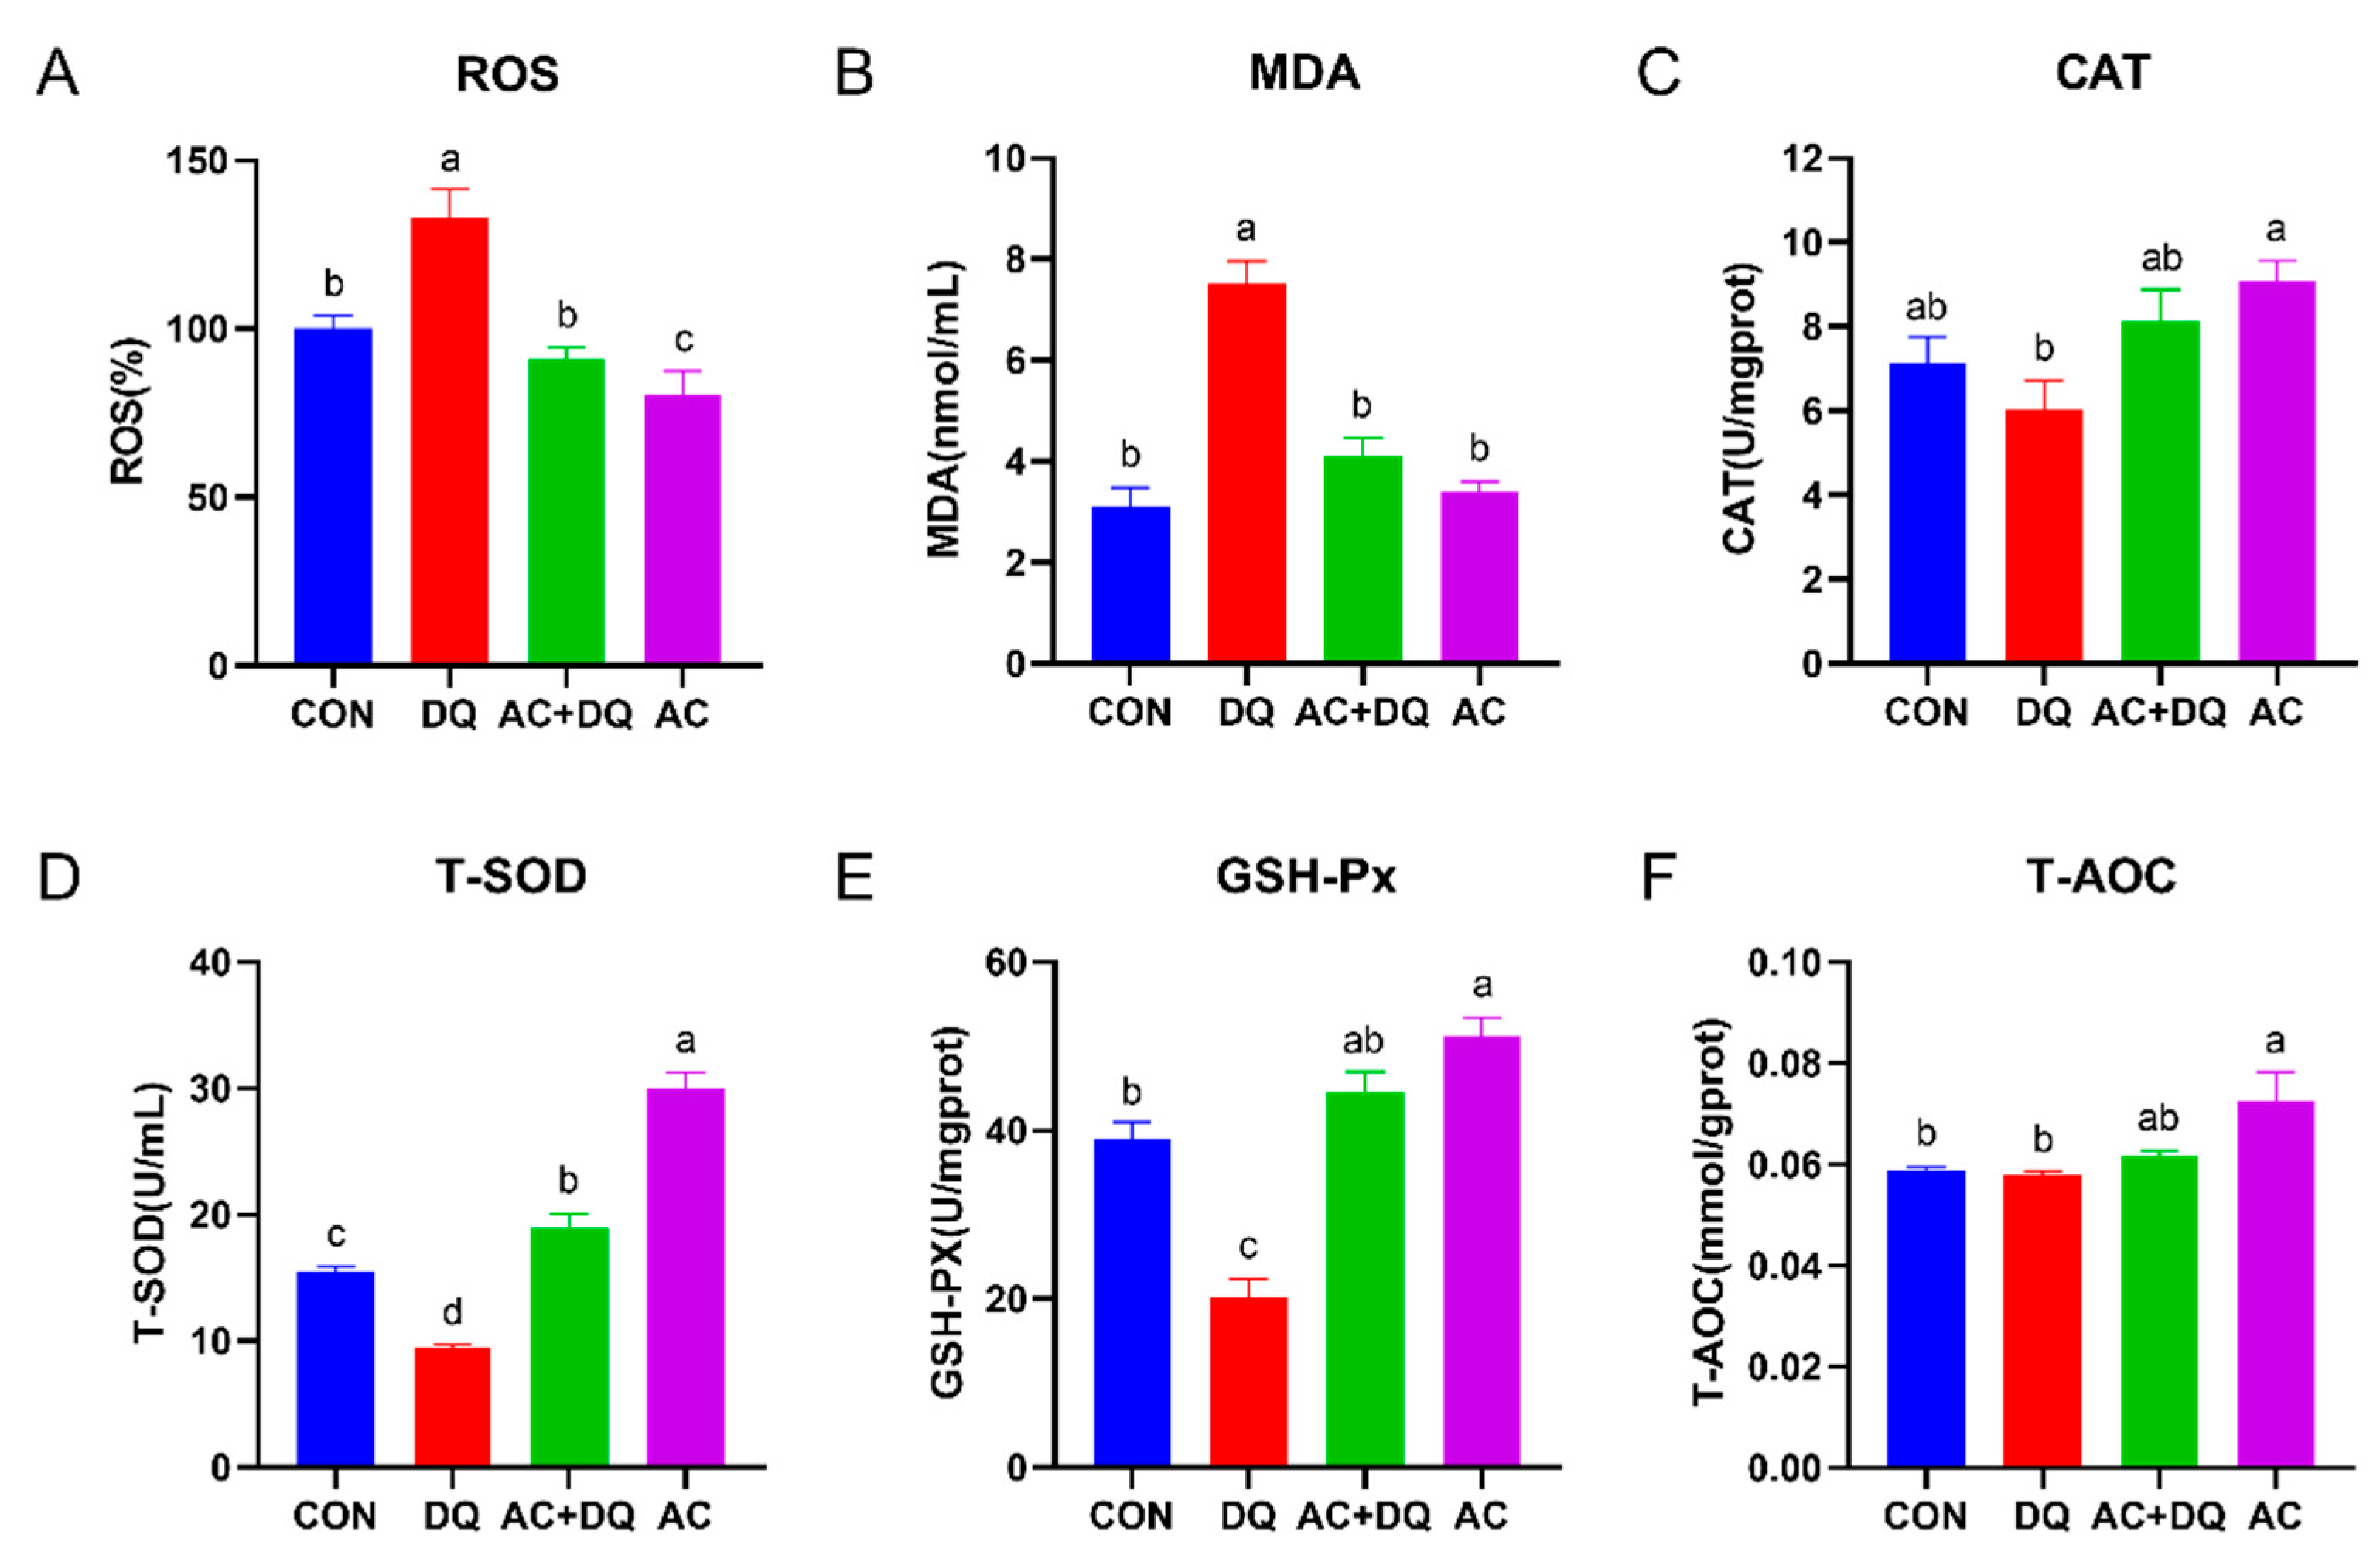
3.2. Effects of Acidifier on ROS Production and Antioxidant Capacity in DQ-Induced IPEC-J2 Cells

Oxidative stress is caused by an imbalance between the production and clearance of ROS [25]. We first examined the effects of acidifiers on ROS production in DQ-induced IPEC-J2 cells. DQ increased the generation of ROS compared with the CON group (p < 0.05), while acidifier markedly inhibited the generation of ROS (p < 0.05) (Figure 2A). At the same time, DQ increased the concentration of MDA, while acidifier+DQ (AC + DQ group) decreased the concentration of MDA (Figure 2B). In addition, the activity of CAT was decreased (p < 0.05) by 34.39% in the DQ group compared with the AC group (Figure 2C). Moreover, the activities of T-SOD and GSH-Px in the DQ group were lesser (p < 0.05) than those of the CON group, while those in the AC + DQ group were greater than those of the DQ group (Figure 2D,E). However, no significant difference in the activity of T-AOC was observed between the DQ and CON groups, but it was increased in the AC group compared with the CON group (p < 0.05) (Figure 2F).

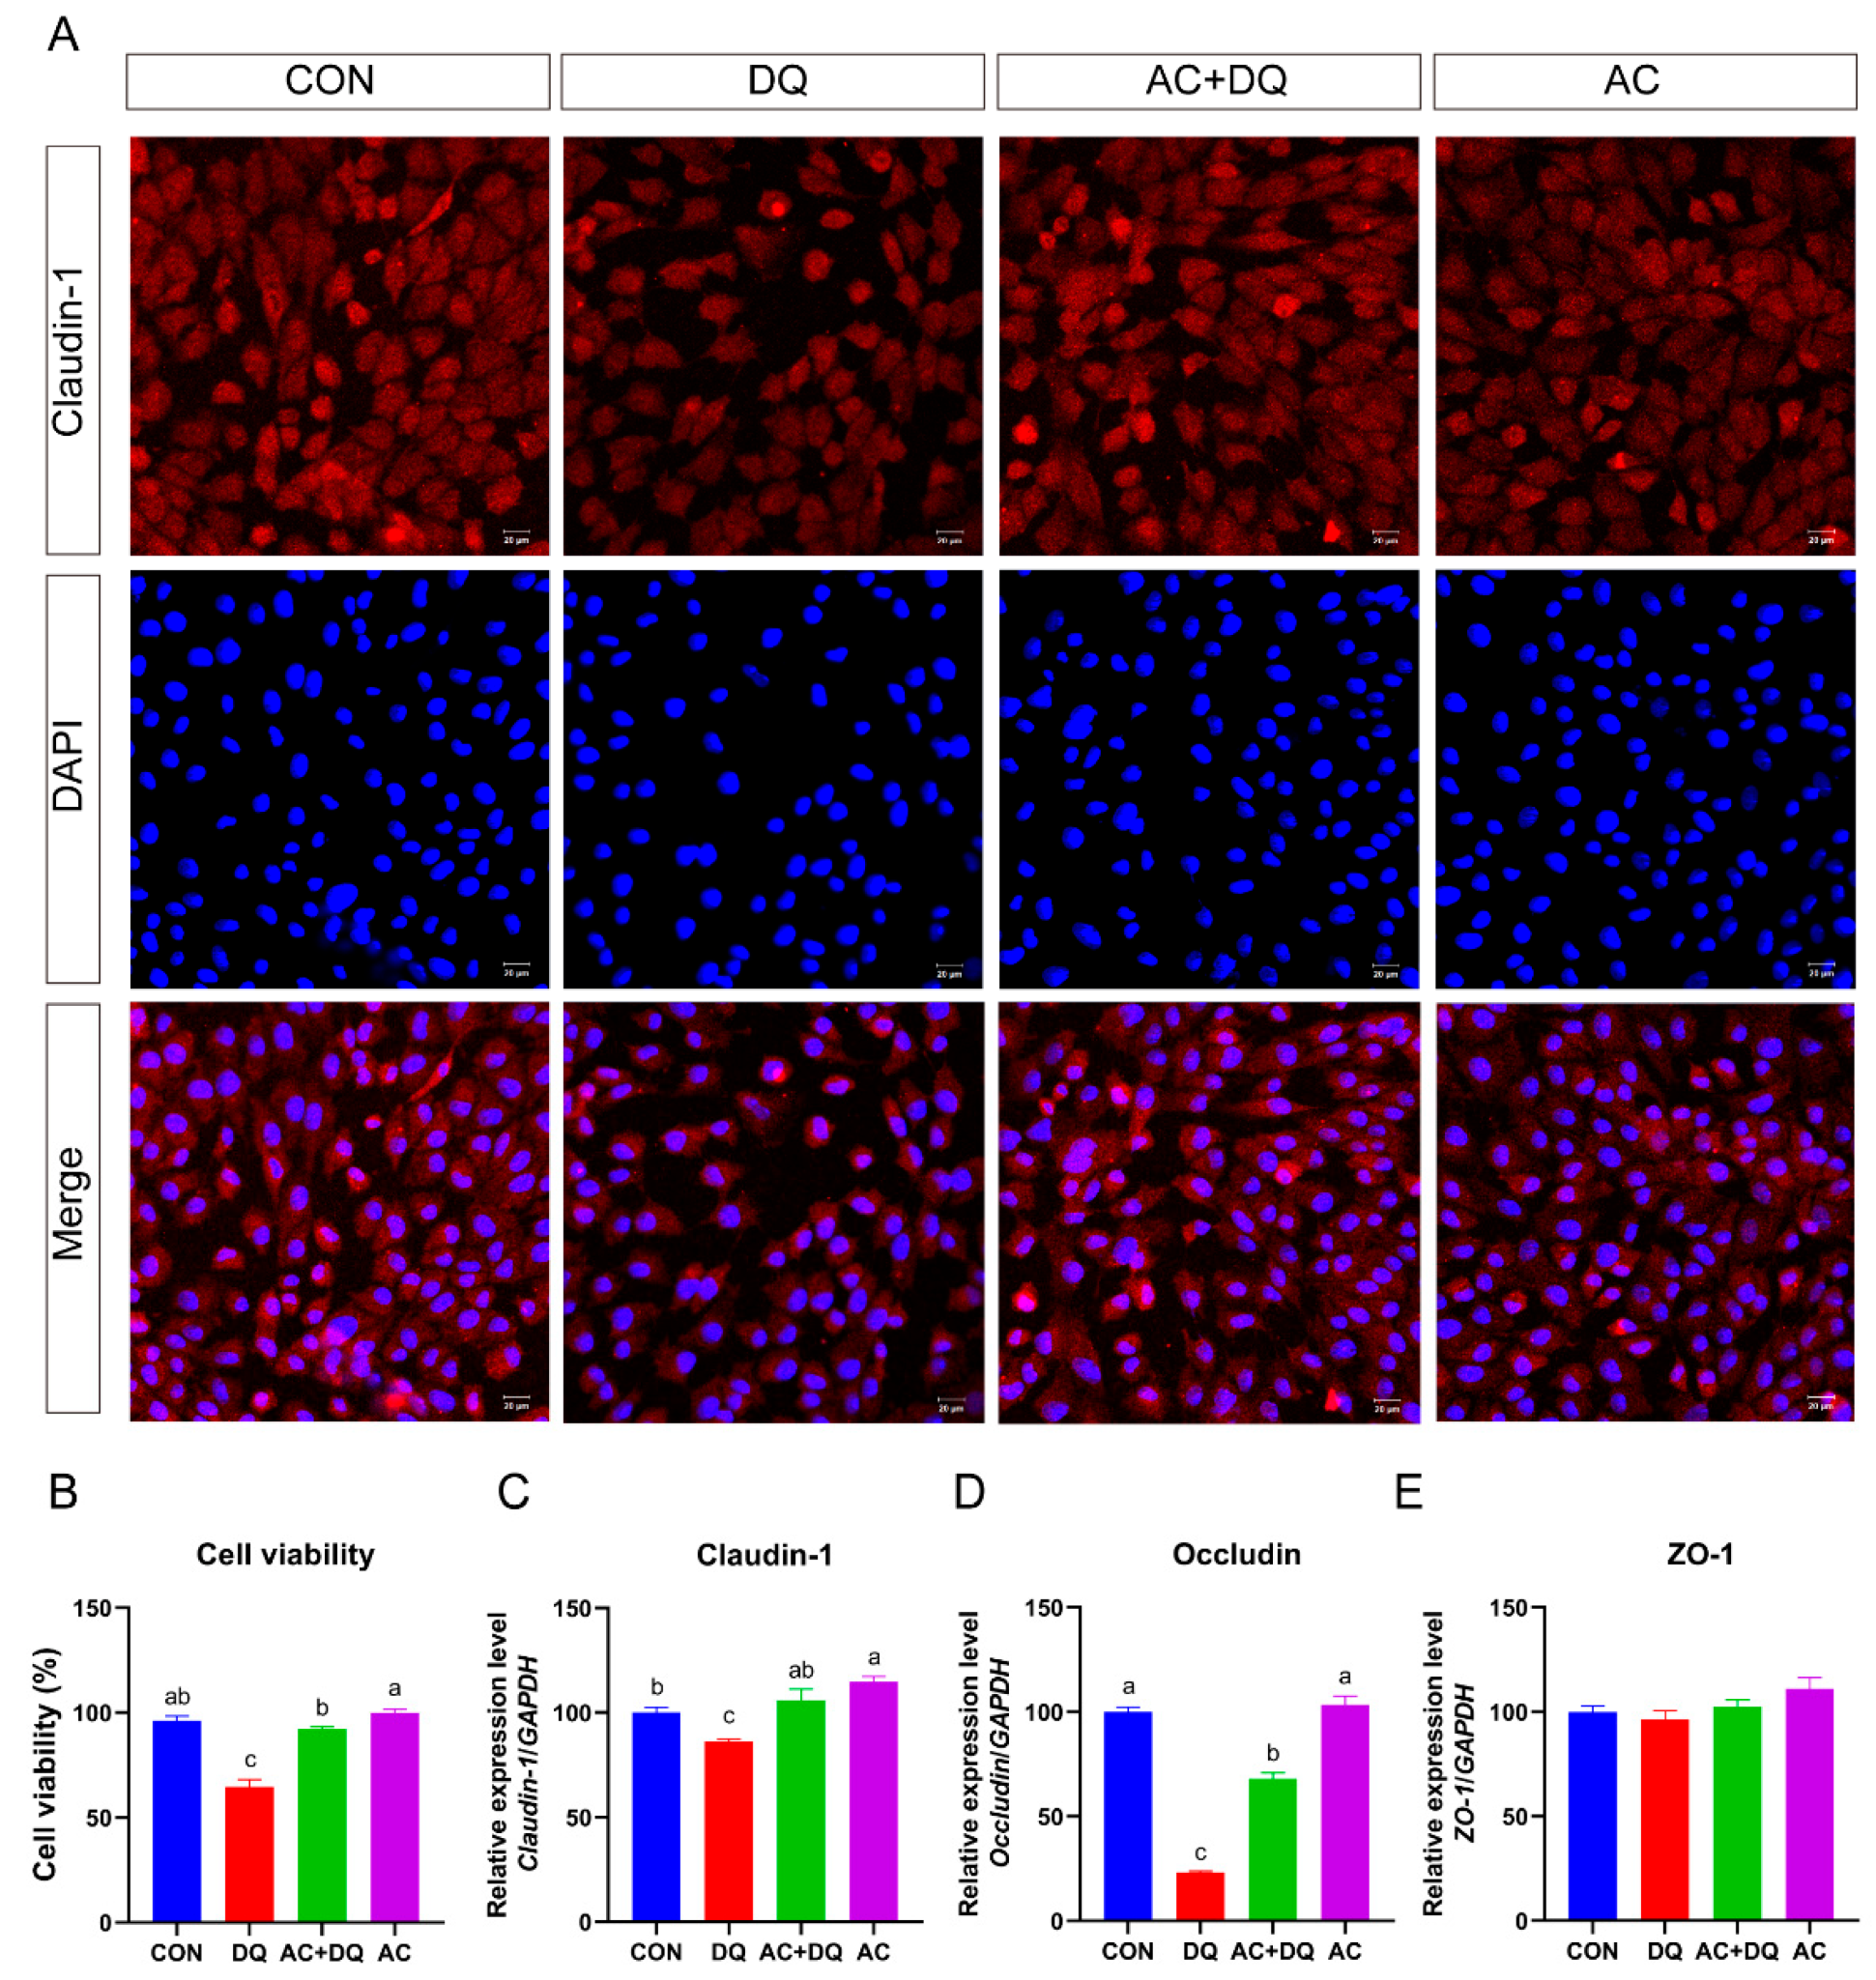
3.3. Protective Effect of Acidifiers on IPEC-J2 Cells Exposure to Oxidative Stress

Intestinal epithelial cells have barrier functions such as tight junctions, preventing the invasion of certain toxins from penetrating the intestine [26]. Next, we further investigated the protective potential of acidifiers on the barrier function of small intestinal epithelial cells after oxidative stress induced by DQ. DQ challenge decreased (p < 0.05) the abundance of tight-junction proteins (Claudin-1) (Figure 3A,B). DQ decreased the mRNA expression of claudin-1 in the IPEC-J2 cells compared with the CON treatment (p < 0.05) (Figure 3C), whereas the acidifiers increased the mRNA expression of claudin-1 in the DQ-induced cells (p < 0.05) (Figure 3C). Similarly, the cellular mRNA expression of occludin was also downregulated in the DQ group compared with those in the CON group (p < 0.05) (Figure 3D). The cellular expression of occludin in the AC + DQ group was greater than that in the DQ group (p < 0.05) (Figure 3D). However, no significant difference was found in the mRNA level of ZO-1 between treatment groups (Figure 3E).

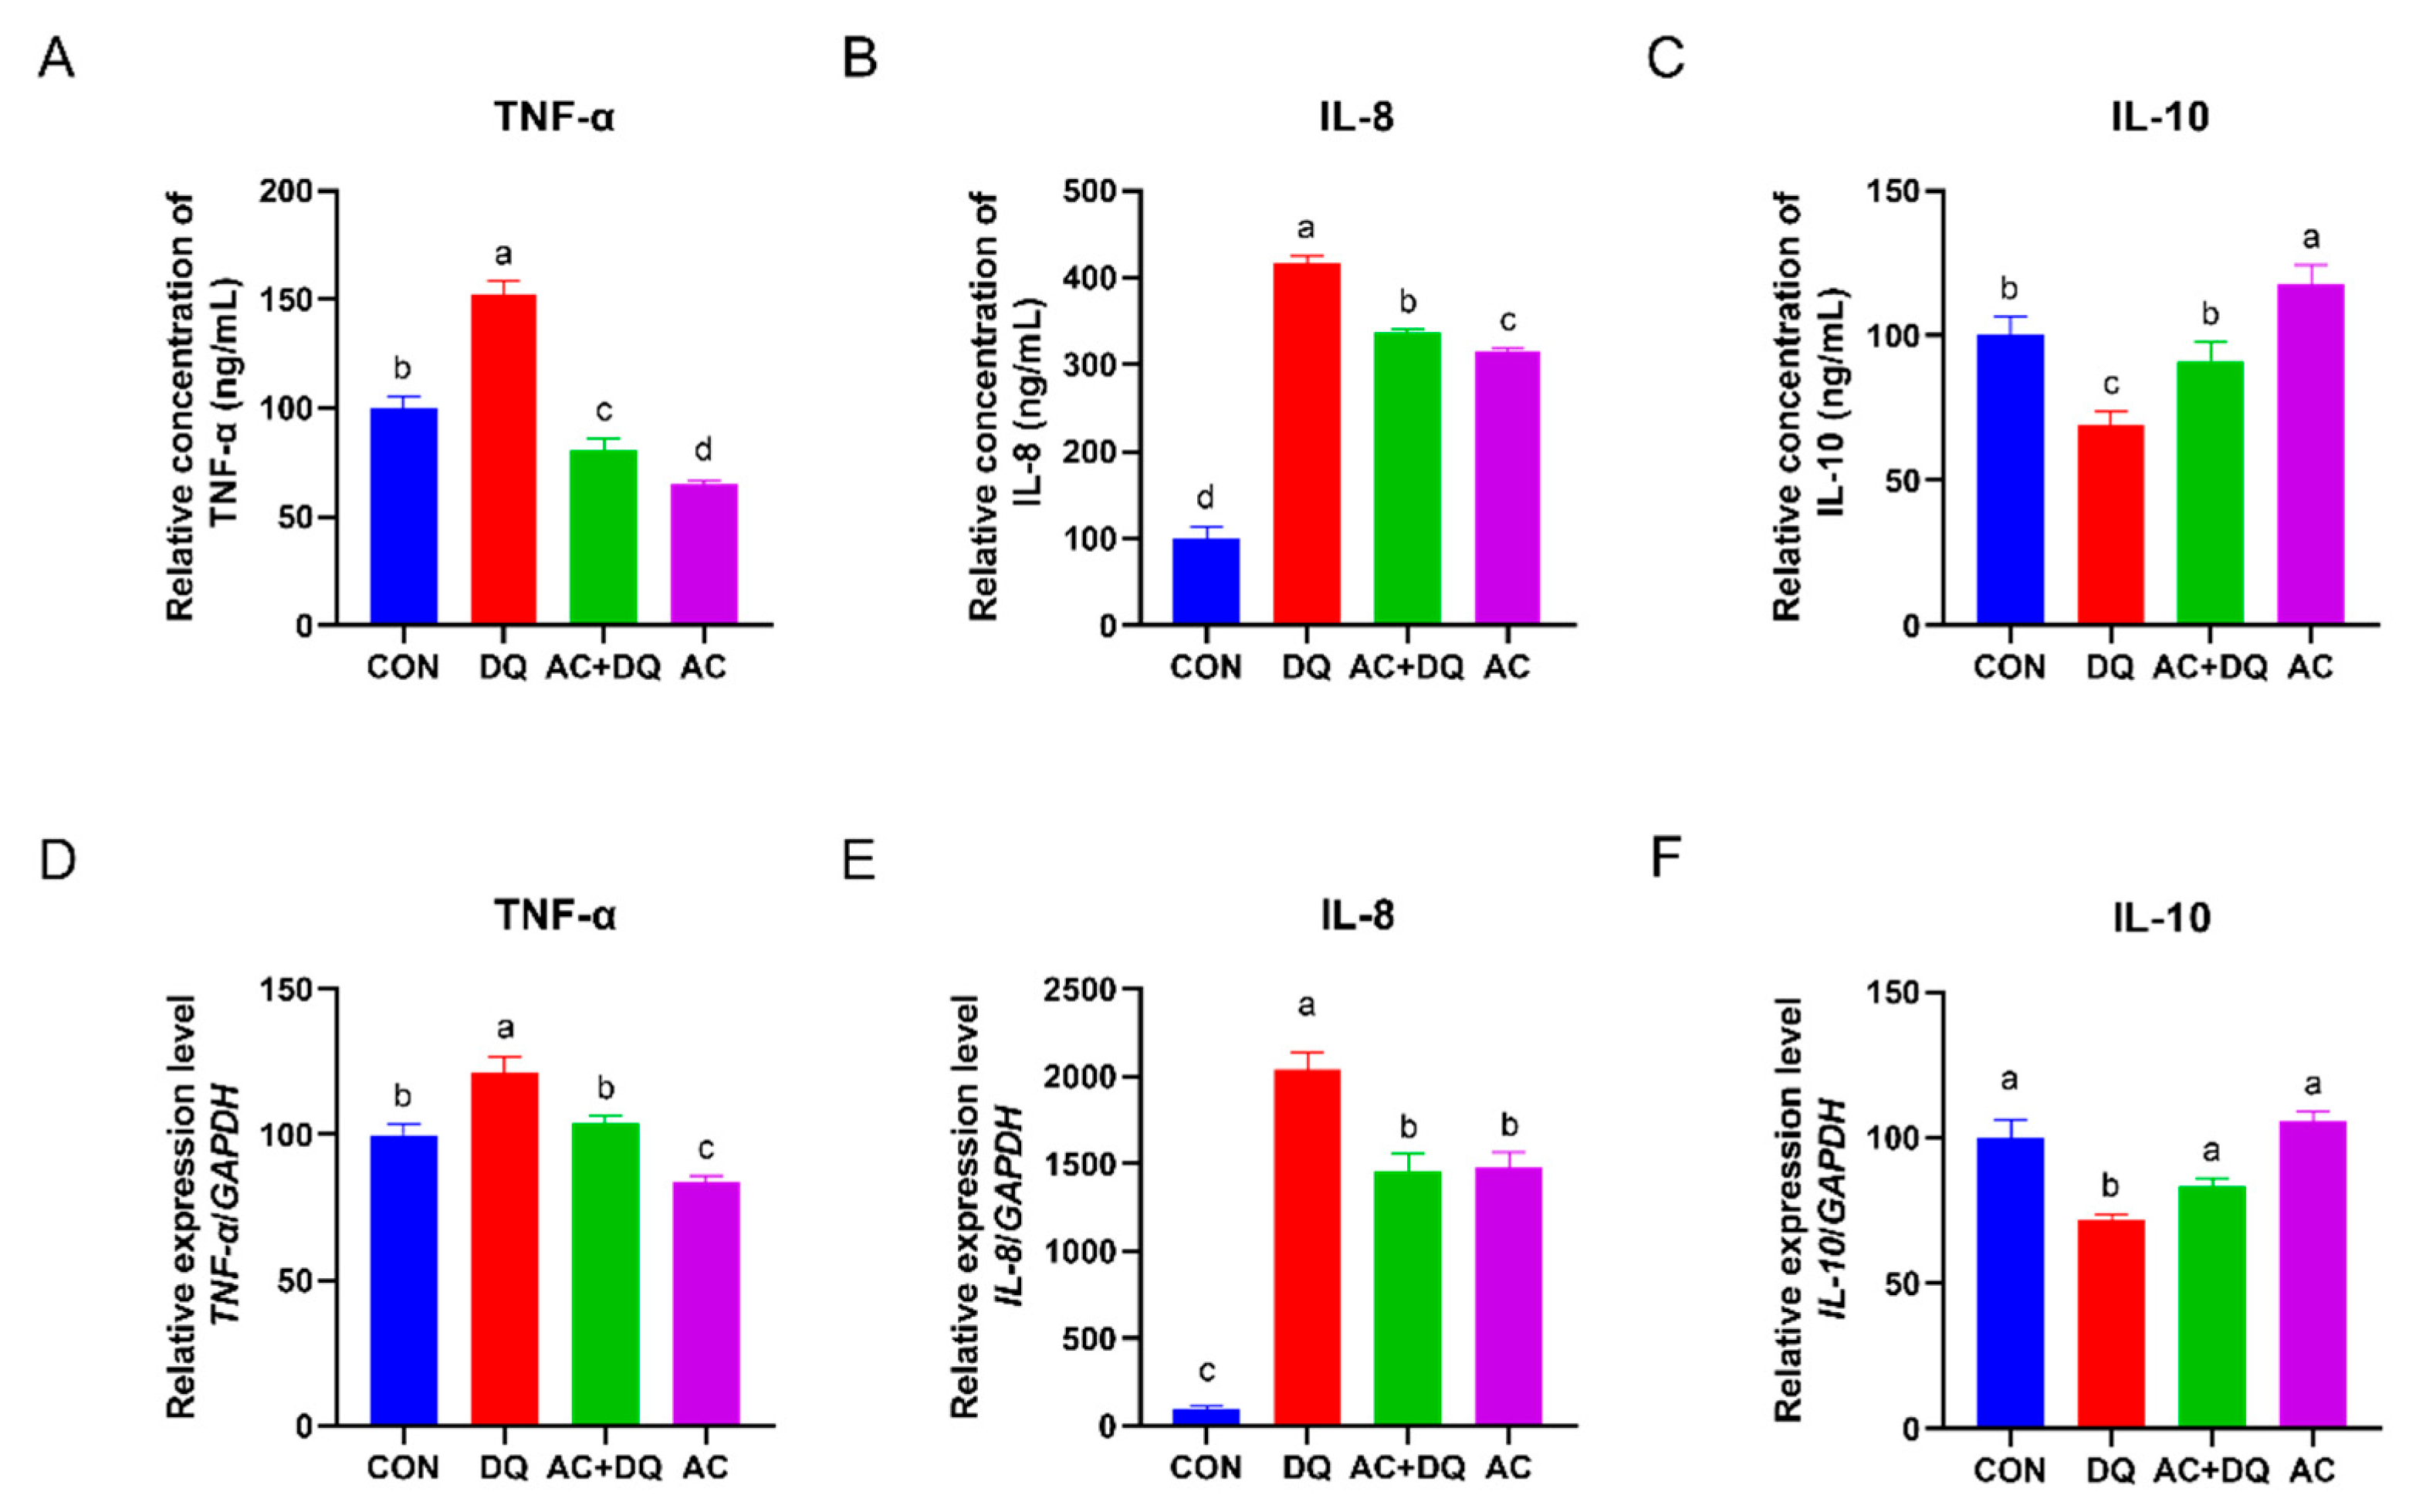
3.4. Effects of Acidifiers on the Inflammatory Cytokines in IPEC-J2 Cells

Oxidative stress has been linked to inflammation response and may be a defining feature of inflammation [27]. We next investigated the secretion and gene expression levels of cytokines involved in the inflammatory response. As shown in Figure 4A–C, IPEC-J2 cells stimulated with diquat alone secreted greater levels of pro-inflammatory cytokine TNF-α and IL-8, and a lower level of anti-inflammatory cytokine IL-10 in comparison with control group (p < 0.05). However, acidifiers reduced the secretion levels of pro-inflammatory cytokine TNF-α and IL-8 and increased IL-10 secretion level in the DQ-induced IPEC-J2 cells culture supernatant (Figure 4A–C). In addition, DQ increased the mRNA expression levels of TNF-α and IL-8 genes compared with those in the CON group (p < 0.05) (Figure 4D,E). However, acidifiers downregulated their expression in the DQ-induced IPEC-J2 cells (p < 0.05) (Figure 4D,E). In contrast, a lower expression level of IL-10 was detected in the DQ group than that in the CON group (p < 0.05). In addition, the IL-10 gene expression level was upregulated in the DQ+AC group compared with that in the DQ group (p < 0.05) (Figure 4F).

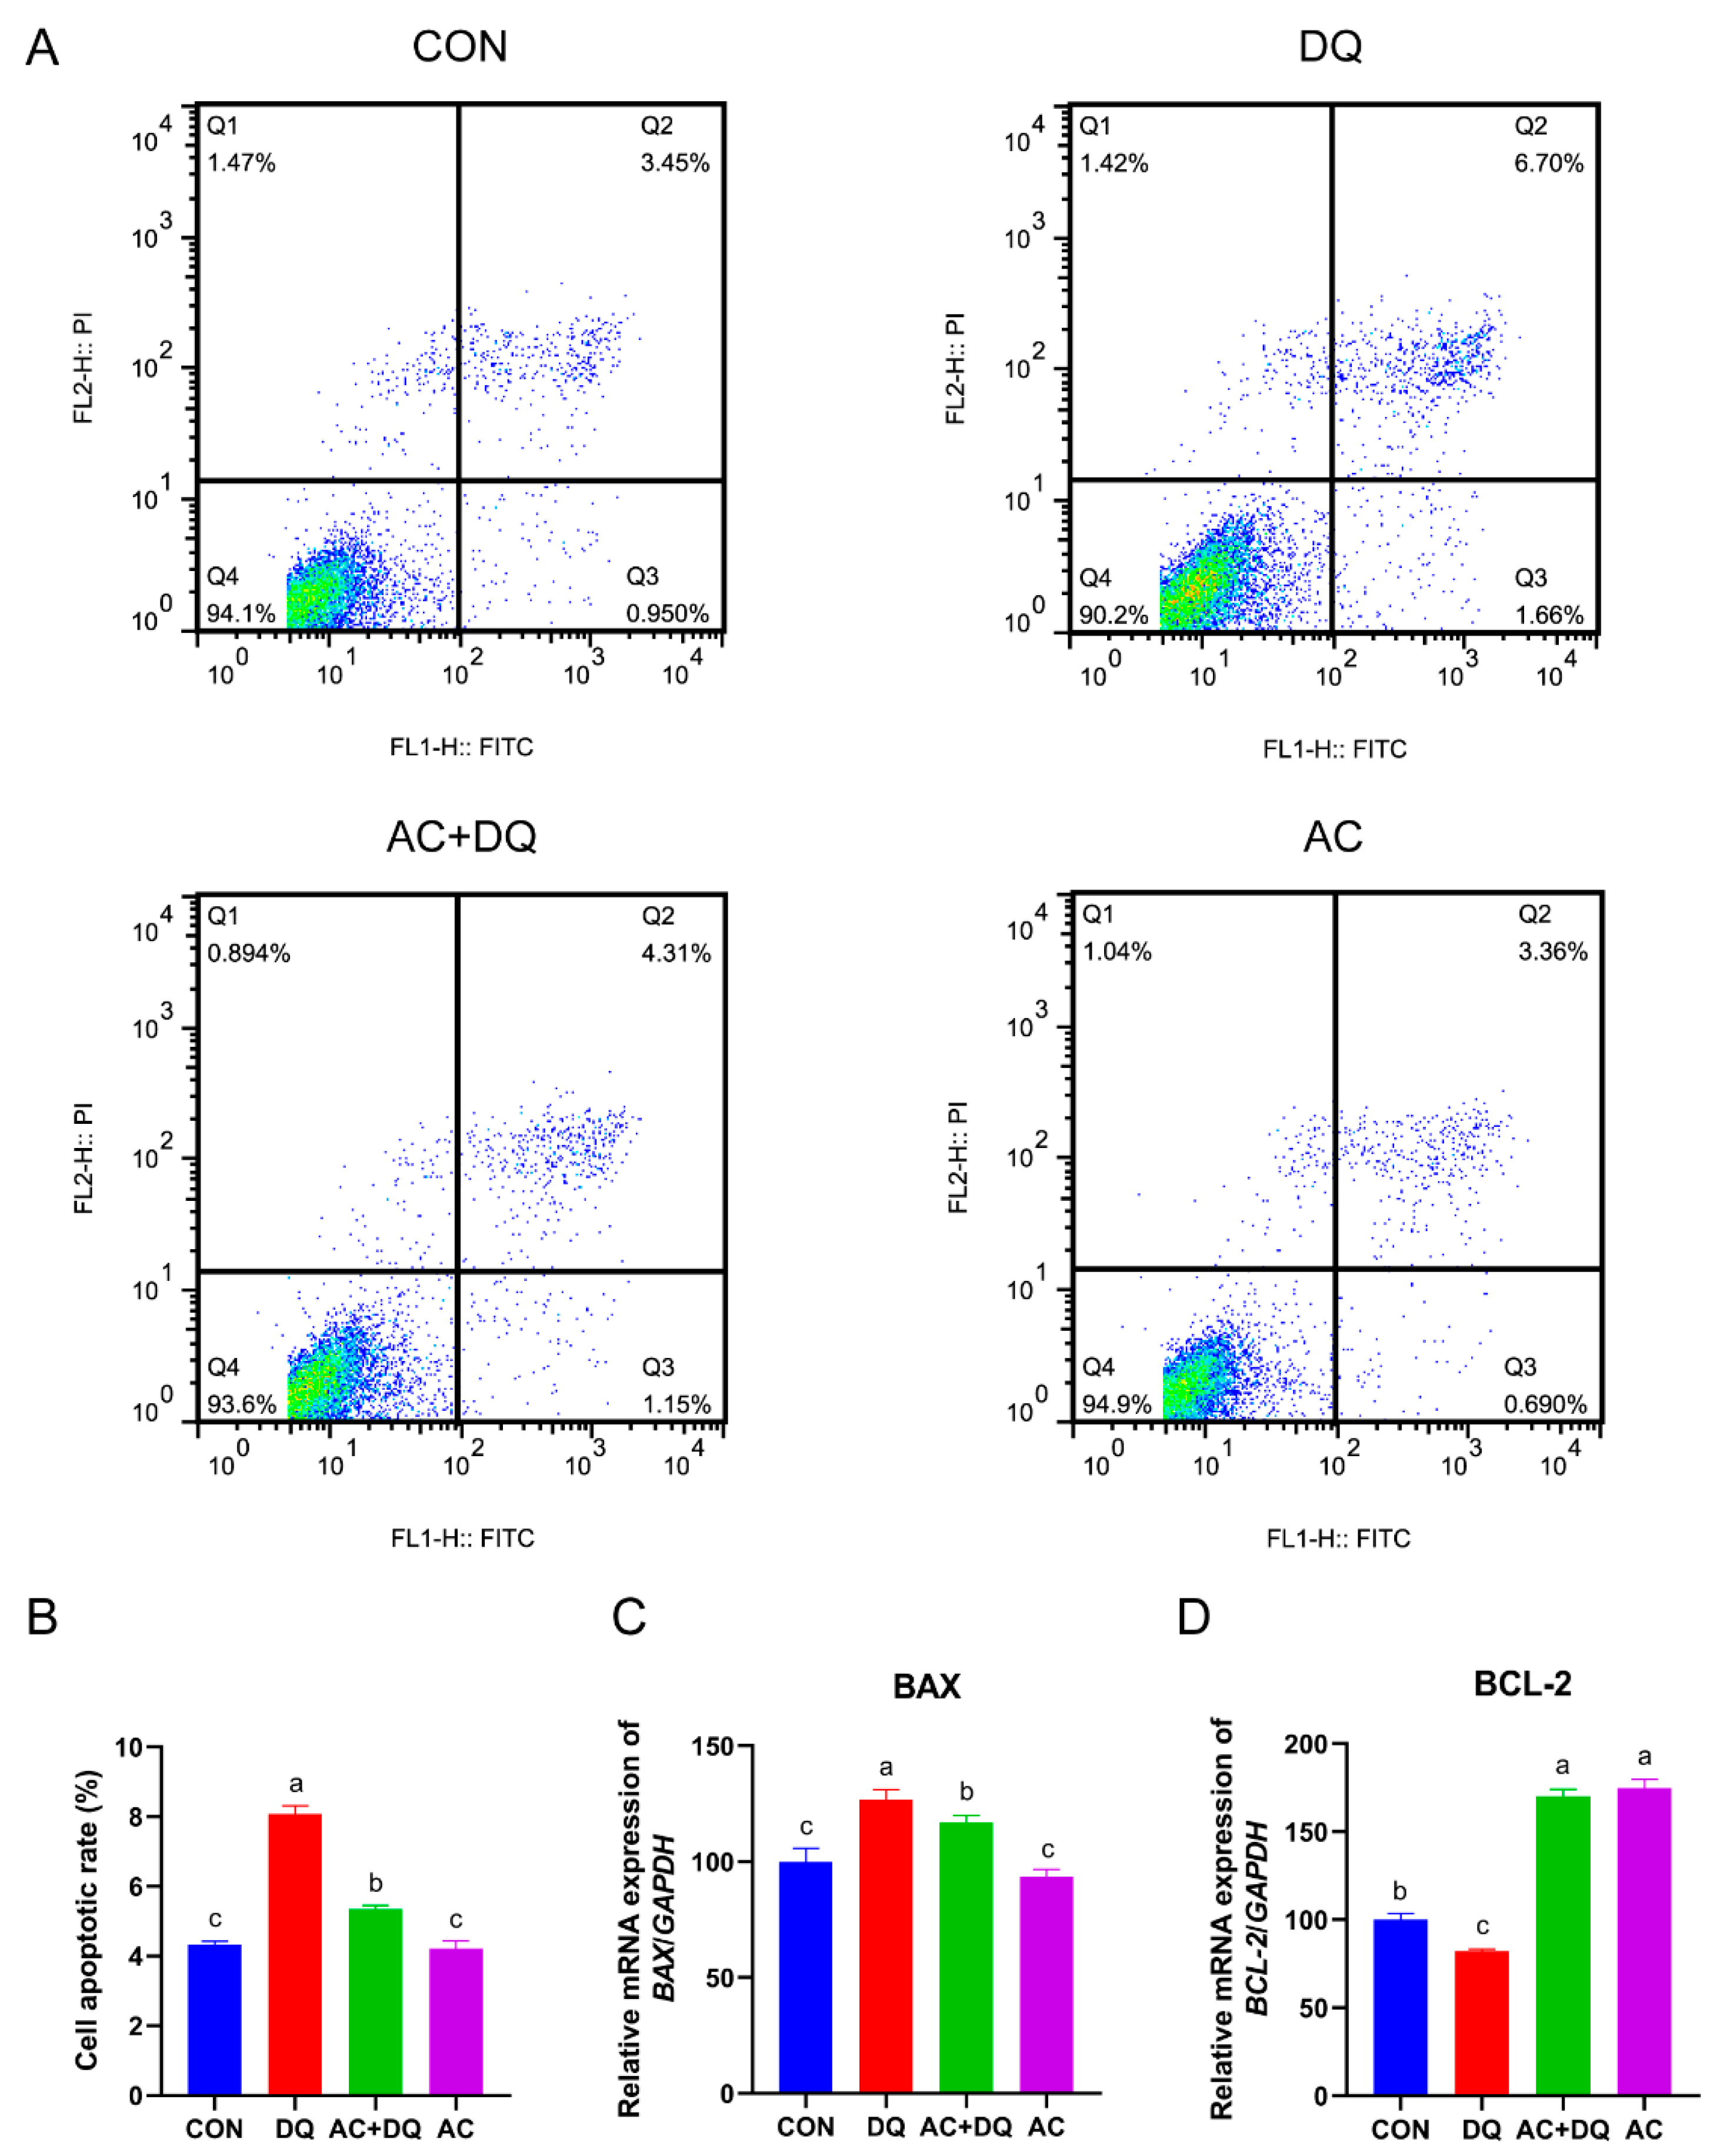
3.5. Acidifiers Alleviated Oxidative Stress-Induced Apoptosis in IPEC-J2 Cells

Oxidative stress triggers apoptosis in different types of cells, including intestinal epithelial cells [28]. We examined the effect of acidifiers on the apoptosis of IPEC-J2 cells induced by DQ. We first examined the IPEC-J2 cells apoptosis by Annexin-V staining and a flow cytometry analysis. The percentages of apoptotic cells in the CON, DQ, AC + DQ, and AC groups were 5.05 ± 1.31%, 12.95 ± 0.64%, 5.67 ± 0.45%, and 6.48 ± 0.40%, respectively (Figure 5A). DQ increased the apoptosis rate of IPEC-J2 cells, while acidifiers dramatically downregulated DQ-induced apoptosis (p < 0.05) (Figure 5B). Then, we detected the expression levels of apoptosis-related genes. The gene expression level of BAX was increased in the IPEC-J2 cells treated with DQ compared with those untreated cells, but acidifiers reversed this increase (p < 0.05) (Figure 5C). In addition, DQ markedly downregulated the gene expression level of BCL2 compared with the CON group (p < 0.05), while acidifiers upregulated the gene expression level of BCL2 compared with the DQ group (p < 0.05) (Figure 5D). In general, these findings suggest that the acidifiers might alleviate apoptosis triggered by DQ in IPEC-J2 cells.

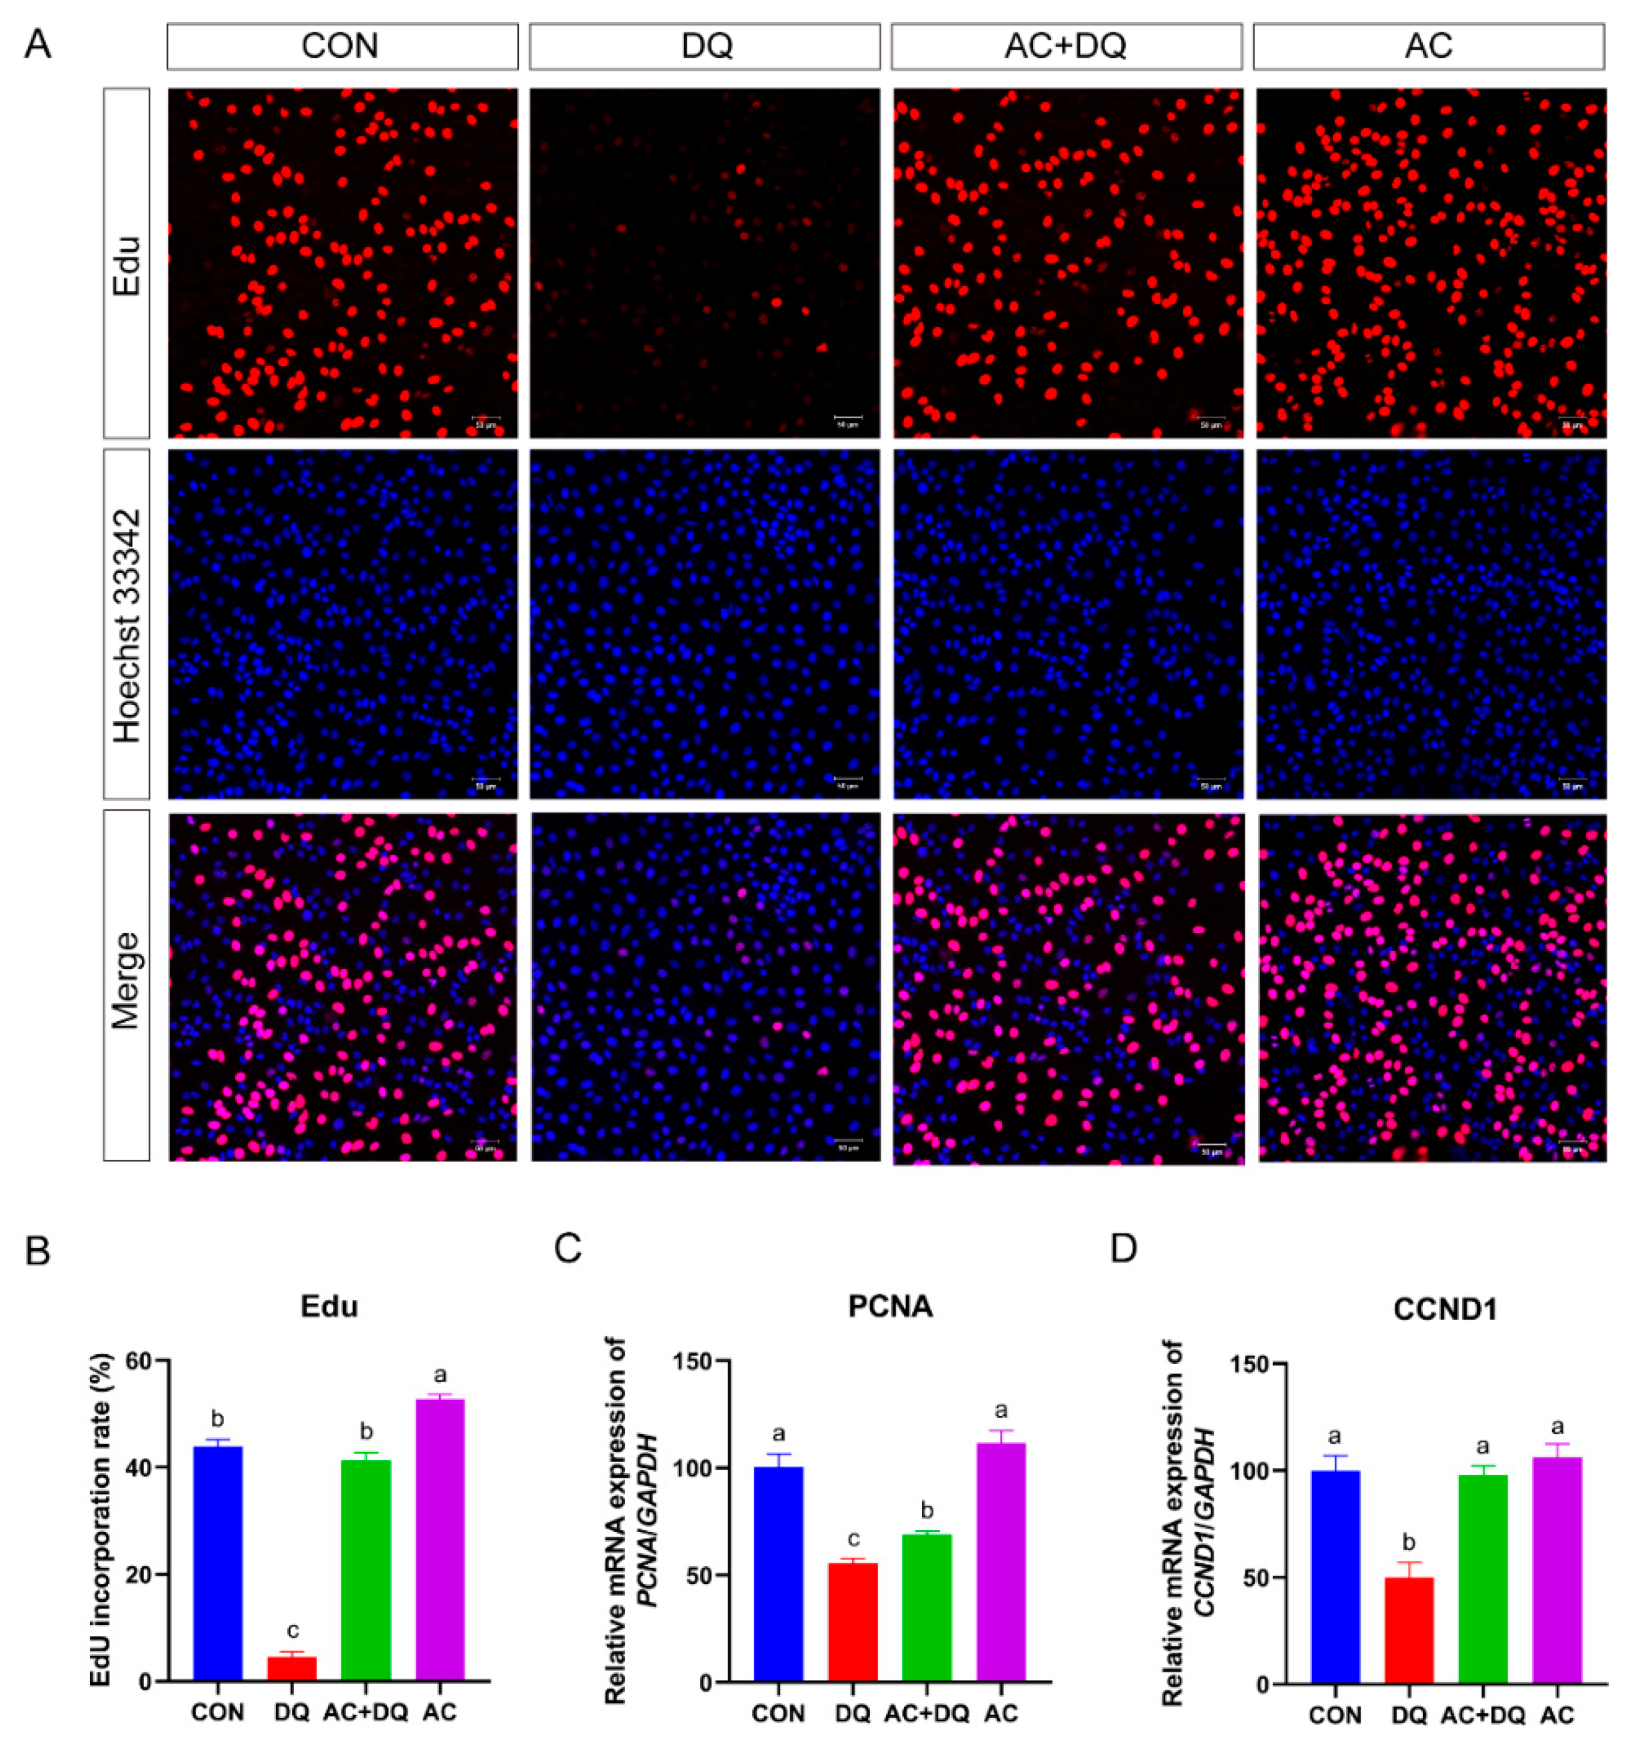
3.6. Effect of Acidifiers on the Proliferation of IPEC-J2 Cells Induced by DQ

At the cellular level, oxidative stress also triggers a wide range of responses, including cell proliferation [29]. To further demonstrate whether the acidifiers can rescue the DQ-induced inhibition of proliferation in IPEC-J2 cells, cell proliferation assays were conducted. The percentage of Edu-positive fluorescent cells in the DQ group was less than that in the CON group (p < 0.05), while the acidifiers increased the Edu-positive fluorescent cells (p < 0.05) and rescued the DQ-induced inhibition. (Figure 6A,B). Since the CCND1 and PCNA genes are related to cell proliferation, we examined the expression levels of these genes. DQ decreased the mRNA levels of PCNA and CCND1 genes (p < 0.05), while the acidifiers increased the mRNA levels (p < 0.05) and rescued DQ-induced inhibition (Figure 6C,D). The fluorescence intensity of IPEC-J2 cells was reduced after DQ treatment (p < 0.05) (Figure 6A), indicating that DQ reduced DNA replication activity. All these results indicate that the acidifiers can protect intestinal cells against DQ-induced oxidative stress by regulating proliferation and apoptosis-related proteins.

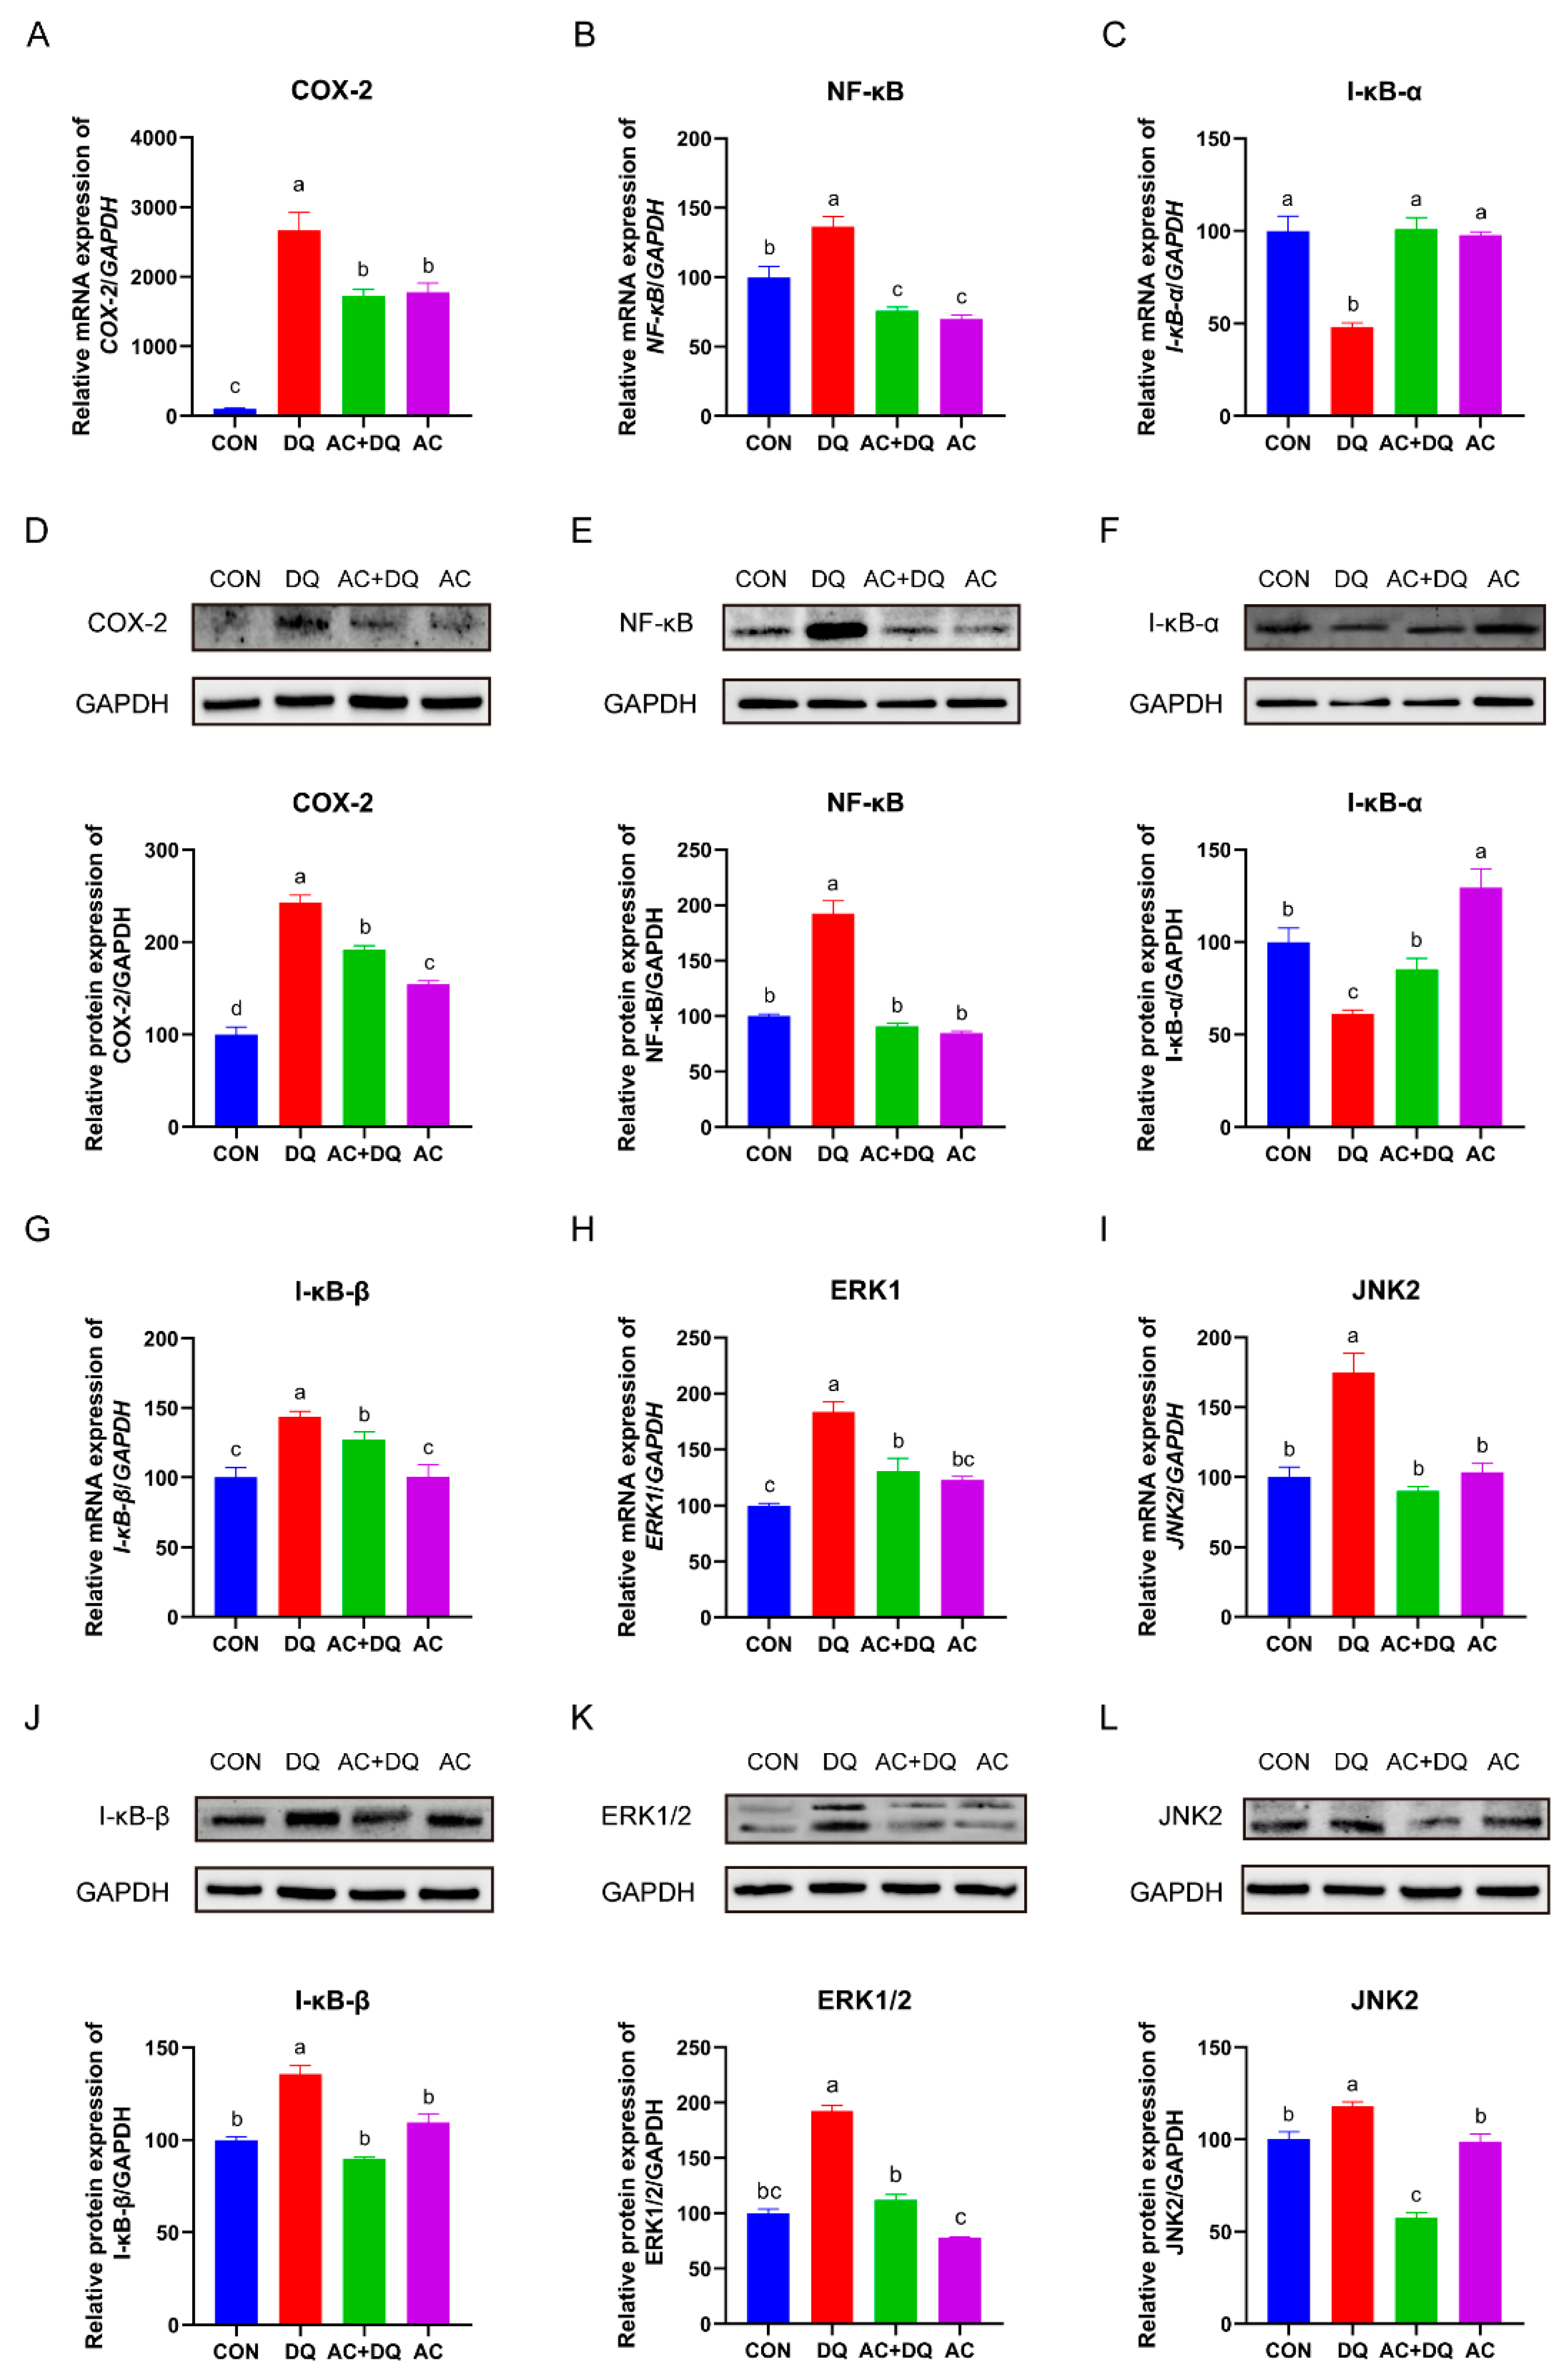
3.7. Effects of Acidifiers on the Activation of the NF-κB/MAPK/COX-2 Signaling Pathways in DQ-Induced IPEC-J2 Cells

To investigate whether the acidifiers can attenuate DQ-induced oxidative stress mediated by the NF-κB/MAPK/COX-2 signaling pathways, we determined the mRNA and protein expression levels of the COX-2, NF-κB, I-κB-α, I-κB-β, ERK1, and JNK2 in IPEC-J2 cells. As shown in Figure 7, we found that DQ upregulated COX-2, NF-κB, I-κB-β, ERK1, and JNK2 at both the mRNA (Figure 7A,B,G–I) and protein levels (Figure 7D,E,J–L). In contrast, the mRNA (Figure 7A,B,G–I) and protein (Figure 7D,E,J–L) levels of the COX-2, NF-κB, I-κB-β, ERK1, and JNK2 in the AC + DQ group were lower than those in the DQ group (p < 0.05). Moreover, DQ decreased the mRNA and protein expression levels of I-κB-α (Figure 7C,F). Importantly, the acidifiers rescued the mRNA and protein levels of I-κB-α in the DQ-induced IPEC-J2 cells (Figure 7C,F).

4. Discussion

Acidifiers, as vital feed additives in newly weaned piglets, play a critical role in the improvement of growth performance and the intestinal microbiota in pigs [30]. Our previous study found that supplementing a type of acidifier called Jinlisuan in drinking water increased the antioxidant capacity and immunity of weaned pigs [15]. However, its potential protective effects on intestinal epithelial cells and underlying molecular mechanism are not clear, especially after intestinal epithelial cells suffer from oxidative stress and present an inflammatory response [31]. Understanding the protective effects of acidifiers on small intestinal epithelial cells and their potential antioxidant mechanisms is important for their application in pig-feed additives. The IPEC-J2 cell line was isolated from the mid-jejunum of newborn piglets. IPEC-J2 cells have the ability to differentiate and are similar to primary intestinal epithelial cells [32]. DQ is a classic oxidative stress inducer that causes oxidative stress and cell dysfunction by producing reactive oxygen species and reactive nitrogen [33]. In this study, the IPEC-J2 cell line was used as a model cell line to investigate the antioxidative activity of acidifiers, and diquat was used as a stimulant to construct an intestinal epithelial exogenous oxidative stress model. Therefore, we established a DQ-induced oxidative stress model in the IPEC-J2 cells and evaluated the protective effects of the acidifiers on reducing the oxidative stress and inflammatory response in the IPEC-J2 cells.
The acidifier used in this study is a water-soluble liquid acidifier. The acidifier is composed of a mixture of organic acids such as formic acid, acetic acid, propionic acid, lactic acid and their salts in this study. The doses of liquid-type organic acid mixture are generally expressed by weight percentage in water [34]. In this study, we used the culture medium to dilute the liquid acidifier to analyze the optimal dosage in vitro. In the previous animal experiment, the purpose of diluting the acidifier was also achieved by adding liquid acidifier to drinking water [15]. Therefore, the effectiveness of an acidifier is determined by the dilution ratio. Previous studies have shown that acidifiers protected intestinal epithelial cells against damage and improved cell viability and proliferation [35]. Consistent with these results, the present study showed that the final dilution ratio of acidifiers of 1:2 × 10⁵ can improve cell viability in DQ-treated IPEC-J2 cells.
Importantly, we also found that high concentrations of acidifiers inhibited the cell viability of IPEC-J2 cells, while low concentrations of acidifiers increased cell viability. It was reported that low concentrations of organic acid promoted the differentiation of IPEC-J2 cells, while a higher concentration of organic acid impaired cell viability and inhibited cell proliferation in a dose-dependent manner [36]. The acidifiers used in the present study were weak organic acids, including formic acid, acetic acid, propionic acid, and lactic acid [37]. Therefore, we hypothesized that acidifiers improve cell viability at appropriate concentrations, but they can also cause severe damage to cells at excessive concentrations. Our experiment demonstrated that treatment of the acidifiers with appropriate concentrations and time enhanced the viability of IPEC-J2 cells.
ROS are important markers of oxidative stress, which are usually used to evaluate oxidative stress [38]. MDA is a lipid peroxidation biomarker that reflects oxidative damage [39]. To protect cells against ROS-induced oxidative damage, antioxidant systems including CAT, SOD, and GSH-Px are subsequently activated [40]. Importantly, total antioxidant capacity (T-AOC) refers to the total antioxidant level composed of various antioxidant substances and antioxidant enzymes, which help to protect cells and the body from oxidative stress damage caused by reactive oxygen free radicals [41]. Therefore, total antioxidant capacity is of great significance to scientifically evaluate the antioxidant capacity of antioxidant substances. In the present study, DQ increased ROS and MDA levels in IPEC-J2 cells, while the acidifiers decreased the levels of ROS and MDA by reversing the decrease in T-SOD and GSH-Px, suggesting that the acidifiers have potential antioxidant effects under cellular oxidative stress, which is consistent with previous studies [42,43].
Oxidative damage caused by oxidative stress increases the permeability of intestinal epithelial cells [44]. The increase in intestinal permeability impaired the integrity of the intestinal epithelial barrier [45]. Cell permeability is determined by the tight-junction proteins, including claudins, occludin, and ZO-1, which separate the internal environment from the external environment and block harmful substances [46]. A previous study revealed that sodium butyrate decreased the permeability and selectively increased the expression level of tight-junction proteins in IPEC-J2 cells [47]. Indole-3-propionic acid improved the expression of tight-junction proteins (claudin-1, occludin, and ZO-1) and the intestinal epithelial barrier [48]. Our present study is consistent with these findings, which suggest that the acidifiers can maintain epithelial integrity by preventing the increase in cell permeability caused by oxidative stress.
The inflammatory response is a defining feature of oxidative stress caused by ROS [49] because inflammatory factors are involved in biochemical reactions that produce ROS [50]. IL-8, IL-10, and TNF-α are inflammatory response markers [51]. Diquat is used as a model inducer of oxidative stress and induces an inflammatory response, which manifests as a decrease in the mRNA expression of IL-10 and an increase in TNF-α mRNA expression in weaned piglets [52]. In the present study, DQ induced an inflammatory response in IPEC-J2 cells by stimulating the production of proinflammatory cytokines such as TNF-α and IL-8, while inhibiting the production of anti-inflammatory cytokine IL-10. The acidifiers, on the other hand, downregulated the expression of TNF-α and IL-8 genes in the DQ-induced IPEC-J2 cells. Previous research has shown that the supplementation of organic acids reduces the concentration of pro-inflammatory cytokines IL-12 and IL-16, as well as inflammatory biomarker Pentraxin-3 in serum [53], which is consistent with our present study. These results suggest that the acidifiers can attenuate the DQ-induced cellular inflammatory response by decreasing the production of pro-inflammatory cytokines and increasing the production of anti-inflammatory cytokines.
Oxidative stress triggers apoptosis of the intestinal epithelial cells [54]. BCL-2 family members are apoptosis markers, in which BAX promotes apoptosis while BCL-2 inhibits apoptosis [55]. A previous study reported DQ-induced hepatic apoptosis and mitochondrial dysfunction in piglets [56]. In our present study, we found that IPEC-J2 cells treated with diquat increased the mRNA expression of BAX and decreased the mRNA expression of BCL-2, indicating that DQ induced IPEC-J2 cell apoptosis. IPEC-J2 cells pretreated with the acidifiers significantly increased the mRNA expression of BCL-2 compared with the DQ-treated group. Similarly, acidifiers markedly upregulated the mRNA level of BCL-2 compared with untreated cells, while no significant changes were found compared with the acidifiers pre-treatment (AC + DQ) group. These results indicated that pretreatment with acidifiers could reduce the apoptosis of IPEC-J2 cells via upregulating BCL-2 expression. Thus, the acidifiers rescued the apoptosis of IPEC-J2 cells by regulating the expression of apoptosis-related genes. In addition, oxidative stress is closely related to cell proliferation [57]. In mice, for example, hydrogen treatment preserved intestinal epithelial cell proliferation while reducing oxidative stress damage and the systemic inflammatory response [58]. As expected, our present study revealed that DQ decreased the percentage of Edu-positive fluorescent cells while the acidifiers rescued them. Similarly, the expression levels of genes (PCNA and CCND1) related to proliferation were decreased in the DQ group compared with those in the CON group, while the acidifiers rescued the mRNA expression levels of the PCNA and CCND1 genes. Taken together, these results suggest that the acidifiers can increase DNA replication activity and are capable of promoting IPEC-J2 cells proliferation.
Organic acid reduces oxidative stress damage and inflammation by modulating the activity of oxidative stress signaling pathways [59]. For example, oxidative stress activates the inflammatory response via redox regulation of the inhibitor(I)-κB/nuclear factor (NF)-κB signaling pathway [60]. In the present study, DQ increased the mRNA and protein expression levels of NF-κB and IκB in the IPEC-J2 cells, whereas the acidifiers decreased them. This indicated that DQ activated the NF-κB signaling pathway in the IPEC-J2 cells, while acidifiers led to the inhibition of the NF-B pathway, as well as a decrease in NF-κB-mediated transcription. On the other hand, inhibition of the NF-κB pathway leads to the reduction in proinflammatory cytokines [61], which may be the reason for the changes in cytokine levels in the present study. It has been reported that the activation of the mitogen-activated protein kinase (MAPK) pathway is highly correlated with the NF-κB pathway [62]. The MAPK signal pathway (ERK, JNK, p38) is involved in the regulation of cell growth, environmental adaptation to stress, and inflammatory reactions [63], which is also closely associated with oxidative stress [64]. In the present study, the acidifiers attenuated DQ-induced oxidative stress by downregulating the expression levels of proteins (ERK1/2 and JNK2) related to the MAPK signaling pathway. In addition, the COX-2 signaling pathway is considered to be the most important way to regulate oxidative stress. The activation of this signaling pathway leads to the release of free radicals and the transcription repression of genes encoding antioxidant enzymes [65]. In the present study, the acidifiers downregulated the expression of CoX-2 in the DQ-induced IPEC-J2 cells. It is reported that the inhibition of COX-2 expression reduced the production of ROS and prevented DNA damage [66], which implies that the decrease in COX-2 may be one of the reasons for the downregulation of ROS in the AC + DQ group. Taken together, these results suggest that the acidifiers can attenuate the DQ-induced oxidative stress and inflammatory responses by regulating the NF-κB/MAPK/COX-2 signaling pathways.

5. Conclusions

In the present study, DQ induced intestinal epithelial cells oxidative stress and inflammation and increased the apoptosis and permeability of the intestinal epithelial cells. However, the acidifiers not only reduced intracellular ROS, but also attenuated the DQ-induced inflammation and modulated the activities of antioxidant enzymes by regulating the NF-κB/MAPK/COX-2 signaling pathways, indicating the prominent antioxidative capacity of the acidifiers.

Supplementary Materials

The following supporting information can be downloaded at: https://www.mdpi.com/article/10.3390/antiox11102002/s1, Table S1: Primer sequences used for real-time quantitative PCR.

Author Contributions

Conceptualization, B.Z. and Q.X.; data curation, investigation, and methodology, Q.X.; visualization, M.L.; validation, X.C. and H.Y.; software, C.Z. (Chunlei Zhang) and J.C.; writing—original draft preparation, Q.X.; writing—review and editing, B.Z.; formal analysis and supervision, B.Z. and C.Z. (Chengxin Zhao); project administration, B.Z.; funding acquisition, B.Z. All authors have read and agreed to the published version of the manuscript.

Funding

This work was supported by the “Fundamental Research Funds for the Central Universities” (grant number KYLH202008).

Institutional Review Board Statement

This study was approved by the Nanjing Agricultural University Animal Care and Use Committee (SYXK Su 2017-0027). All procedures involving piglet feeding, management, and animal welfare strictly followed the Nanjing Agricultural University experimental guidelines during the experiment.

Informed Consent Statement

Not applicable.

Data Availability Statement

All data are presented in the article and Supplementary Materials.

Acknowledgments

We thank Chunmei Li (Nanjing Agricultural University, China) for kindly providing the IPEC-J2 cell line.

Conflicts of Interest

Q.X., M.L., X.C., C.Z., H.Y., J.C. and B.Z. declare that they have no conflict of interest; C.Z. is a member of Yantai Jinhai Pharmaceutical Co., Ltd. Yantai Jinhai Pharmaceutical Co., Ltd. has no potential financial conflicts of interest in this study.

References

  1. Martinez, G.; Dieguez, S.N.; Paggi, M.B.F.; Riccio, M.B.; Gaudio, D.S.P.; Rodriguez, E.; Amanto, F.A.; Tapia, M.O.; Soraci, A.L. Effect of fosfomycin, Cynara scolymus extract, deoxynivalenol and their combinations on intestinal health of weaned piglets. Anim. Nutr. 2019, 5, 386–395. [Google Scholar] [CrossRef] [PubMed]
  2. Upadhaya, S.D.; Kim, I.H. The Impact of Weaning Stress on Gut Health and the Mechanistic Aspects of Several Feed Additives Contributing to Improved Gut Health Function in Weanling Piglets—A Review. Animals 2021, 11, 2418. [Google Scholar] [CrossRef] [PubMed]
  3. Cao, S.; Wang, C.; Yan, J.; Li, X.; Wen, J.; Hu, C. Curcumin ameliorates oxidative stress-induced intestinal barrier injury and mitochondrial damage by promoting Parkin dependent mitophagy through AMPK-TFEB signal pathway. Free Radic. Biol. Med. 2020, 147, 8–22. [Google Scholar] [CrossRef] [PubMed]
  4. Allaire, J.M.; Crowley, S.M.; Law, H.T.; Chang, S.Y.; Ko, H.J.; Vallance, B.A. The Intestinal Epithelium: Central Coordinator of Mucosal Immunity. Trends Immunol. 2018, 39, 677–696. [Google Scholar] [CrossRef]
  5. Suzuki, T. Regulation of the intestinal barrier by nutrients: The role of tight junctions. Anim. Sci. J. 2020, 91, e13357. [Google Scholar] [CrossRef] [Green Version]
  6. Chen, L.; Zhang, S.; Wu, S.; Ren, Z.; Liu, G.; Wu, J. Synergistic Protective Effect of Konjac Mannan Oligosaccharides and Bacillus subtilis on Intestinal Epithelial Barrier Dysfunction in Caco-2 Cell Model and Mice Model of Lipopolysaccharide Stimulation. Front. Immunol. 2021, 12, 696148. [Google Scholar] [CrossRef]
  7. Vergauwen, H.; Prims, S.; Degroote, J.; Wang, W.; Casteleyn, C.; van Cruchten, S.; de Smet, S.; Michiels, J.; van Ginneken, C. In Vitro Investigation of Six Antioxidants for Pig Diets. Antioxidants 2016, 5, 41. [Google Scholar] [CrossRef] [Green Version]
  8. Zhao, G.P.; Wang, X.Y.; Li, J.W.; Wang, R.; Ren, F.Z.; Pang, G.F.; Li, Y.X. Imidacloprid increases intestinal permeability by disrupting tight junctions. Ecotoxicol. Environ. Saf. 2021, 222, 112476. [Google Scholar] [CrossRef]
  9. Luise, D.; Correa, F.; Bosi, P.; Trevisi, P. A Review of the Effect of Formic Acid and Its Salts on the Gastrointestinal Microbiota and Performance of Pigs. Animals 2020, 10, 887. [Google Scholar] [CrossRef]
  10. Lingbeek, M.M.; Borewicz, K.; Febery, E.; Han, Y.; Doelman, J.; van Kuijk, S.J.A. Short-chain fatty acid administration via water acidifier improves feed efficiency and modulates fecal microbiota in weaned piglets. J. Anim Sci. 2021, 99, skab307. [Google Scholar] [CrossRef]
  11. Grilli, E.; Tugnoli, B.; Passey, J.L.; Stahl, C.H.; Piva, A.; Moeser, A.J. Impact of dietary organic acids and botanicals on intestinal integrity and inflammation in weaned pigs. BMC Vet. Res. 2015, 11, 96. [Google Scholar] [CrossRef] [Green Version]
  12. Chen, J.; Guo, J.; Guan, W.T.; Song, J.J.; Deng, Z.X.; Cheng, L.; Deng, Y.L.; Chen, F.; Zhang, S.H.; Zhang, Y.Z.; et al. Effect of pad-fan cooling and dietary organic acid supplementation during late gestation and lactation on reproductive performance and antioxidant status of multiparous sows in hot weather. Trop. Anim. Health Prod. 2018, 50, 973–982. [Google Scholar] [CrossRef]
  13. Choi, J.; Wang, L.; Liu, S.; Lu, P.; Zhao, X.; Liu, H.; Lahaye, L.; Santin, E.; Liu, S.; Nyachoti, M.; et al. Effects of a microencapsulated formula of organic acids and essential oils on nutrient absorption, immunity, gut barrier function, and abundance of enterotoxigenic Escherichia coli F4 in weaned piglets challenged with E. coli F4. J. Anim. Sci. 2020, 98, skaa259. [Google Scholar] [CrossRef]
  14. Yang, C.; Zhang, L.; Cao, G.; Feng, J.; Yue, M.; Xu, Y.; Dai, B.; Han, Q.; Guo, X. Effects of dietary supplementation with essential oils and organic acids on the growth performance, immune system, fecal volatile fatty acids, and microflora community in weaned piglets. J. Anim. Sci. 2019, 97, 133–143. [Google Scholar] [CrossRef]
  15. Xu, Q.L.; Liu, C.; Mo, X.J.; Chen, M.; Zhao, X.L.; Liu, M.Z.; Wang, S.B.; Zhou, B.; Zhao, C.X. Drinking Water Supplemented with Acidifiers Improves the Growth Performance of Weaned Pigs and Potentially Regulates Antioxidant Capacity, Immunity, and Gastrointestinal Microbiota Diversity. Antioxidants 2022, 11, 809. [Google Scholar] [CrossRef]
  16. Brosnahan, A.J.; Brown, D.R. Porcine IPEC-J2 intestinal epithelial cells in microbiological investigations. Vet. Microbiol. 2012, 156, 229–237. [Google Scholar] [CrossRef] [Green Version]
  17. Dong, N.; Li, X.R.; Xue, C.Y.; Zhang, L.; Wang, C.S.; Xu, X.Y.; Shan, A.S. Astragalus polysaccharides alleviates LPS-induced inflammation via the NF-kappa B/MAPK signaling pathway. J. Cell Physiol. 2020, 235, 5525–5540. [Google Scholar] [CrossRef]
  18. Su, H.; Zhao, W.J.; Zhang, F.L.; Song, M.; Liu, F.F.; Zheng, J.S.; Ling, M.F.; Yang, X.H.; Yang, Q.; He, H.W.; et al. cis 9, trans 11, but not trans 10, cis 12 CLA isomer, impairs intestinal epithelial barrier function in IPEC-J2 cells and mice through activation of GPR120-[Ca2+](i) and the MLCK signaling pathway. Food Funct. 2020, 11, 3657–3667. [Google Scholar] [CrossRef]
  19. Reggi, S.; Giromini, C.; Dell’Anno, M.; Baldi, A.; Rebucci, R.; Rossi, L. In Vitro Digestion of Chestnut and Quebracho Tannin Extracts: Antimicrobial Effect, Antioxidant Capacity and Cytomodulatory Activity in Swine Intestinal IPEC-J2 Cells. Animals 2020, 10, 195. [Google Scholar] [CrossRef] [Green Version]
  20. Sule, R.O.; Condon, L.; Gomes, A.V. A Common Feature of Pesticides: Oxidative Stress-The Role of Oxidative Stress in Pesticide-Induced Toxicity. Oxid. Med. Cell Longev. 2022, 2022, 5563759. [Google Scholar] [CrossRef]
  21. Magalhaes, N.; Carvalho, F.; Dinis-Oliveira, R.J. Human and experimental toxicology of diquat poisoning: Toxicokinetics, mechanisms of toxicity, clinical features, and treatment. Hum. Exp. Toxicol. 2018, 37, 1131–1160. [Google Scholar] [CrossRef]
  22. Tang, L.; Zeng, Z.; Zhou, Y.; Wang, B.; Zou, P.; Wang, Q.; Ying, J.; Wang, F.; Li, X.; Xu, S.; et al. Bacillus amyloliquefaciens SC06 Induced AKT-FOXO Signaling Pathway-Mediated Autophagy to Alleviate Oxidative Stress in IPEC-J2 Cells. Antioxidants 2021, 10, 1545. [Google Scholar] [CrossRef]
  23. Livak, K.J.; Schmittgen, T.D. Analysis of relative gene expression data using real-time quantitative PCR and the 2(T)(-Delta Delta C) method. Methods 2001, 25, 402–408. [Google Scholar] [CrossRef]
  24. Su, D.; Zhang, D.D.; Jin, J.Y.; Ying, L.S.; Han, M.; Chen, K.Y.; Li, B.; Wu, J.Z.; Xie, Z.H.; Zhang, F.R.; et al. Identification of predictors of drug sensitivity using patient-derived models of esophageal squamous cell carcinoma. Nat. Commun. 2019, 10, 5076–5088. [Google Scholar] [CrossRef] [Green Version]
  25. Mugoni, V.; Postel, R.; Catanzaro, V.; De Luca, E.; Turco, E.; Digilio, G.; Silengo, L.; Murphy, M.P.; Medana, C.; Stainier, D.Y.R.; et al. Ubiad1 Is an Antioxidant Enzyme that Regulates eNOS Activity by CoQ10 Synthesis. Cell 2013, 152, 504–518. [Google Scholar] [CrossRef] [Green Version]
  26. He, Y.; Chen, J.; Zhang, Q.; Zhang, J.; Wang, L.; Chen, X.; Molenaar, A.J.; Sun, X. alpha-Chaconine Affects the Apoptosis, Mechanical Barrier Function, and Antioxidant Ability of Mouse Small Intestinal Epithelial Cells. Front. Plant Sci. 2021, 12, 673774. [Google Scholar] [CrossRef]
  27. Ferguson, K.K.; Chen, Y.H.; VanderWeele, T.J.; McElrath, T.F.; Meeker, J.D.; Mukherjee, B. Mediation of the Relationship between Maternal Phthalate Exposure and Preterm Birth by Oxidative Stress with Repeated Measurements across Pregnancy. Environ. Health Persp. 2017, 125, 488–494. [Google Scholar] [CrossRef]
  28. Spohn, S.N.; Bianco, F.; Scott, R.B.; Keenan, C.M.; Linton, A.A.; O’Neill, C.H.; Bonora, E.; Dicay, M.; Lavoie, B.; Wilcox, R.L.; et al. Protective Actions of Epithelial 5-Hydroxytryptamine 4 Receptors in Normal and Inflamed Colon. Gastroenterology 2016, 151, 933–944. [Google Scholar] [CrossRef] [Green Version]
  29. Fontana, G.A.; Rigamonti, A.; Lenzken, S.C.; Filosa, G.; Alvarez, R.; Calogero, R.; Bianchi, M.E.; Barabino, S.M.L. Oxidative stress controls the choice of alternative last exons via a Brahma-BRCA1-CstF pathway. Nucleic Acids Res. 2017, 45, 902–914. [Google Scholar] [CrossRef] [PubMed] [Green Version]
  30. Wang, H.L.; Long, W.T.; Chadwick, D.; Zhang, X.Y.; Zhang, S.; Piao, X.S.; Hou, Y. Dietary acidifiers as an alternative to antibiotics for promoting pig growth performance: A systematic review and meta-analysis. Anim. Feed Sci Tech. 2022, 289, 115320. [Google Scholar] [CrossRef]
  31. Cao, W.; Kayama, H.; Chen, M.L.; Delmas, A.; Sun, A.; Kim, S.Y.; Rangarajan, E.S.; McKevitt, K.; Beck, A.P.; Jackson, C.B.; et al. The Xenobiotic Transporter Mdr1 Enforces T Cell Homeostasis in the Presence of Intestinal Bile Acids. Immunity 2020, 52, 571–572. [Google Scholar] [CrossRef] [PubMed]
  32. Hu, P.; Zhao, F.Z.; Wang, J.; Zhu, W.Y. Lactoferrin attenuates lipopolysaccharide-stimulated inflammatory responses and barrier impairment through the modulation of NF-kappa B/MAPK/Nrf2 pathways in IPEC-J2 cells. Food Funct. 2020, 11, 8516–8526. [Google Scholar] [CrossRef] [PubMed]
  33. Fussell, K.C.; Udasin, R.G.; Gray, J.P.; Mishin, V.; Smith, P.J.S.; Heck, D.E.; Laskin, J.D. Redox cycling and increased oxygen utilization contribute to diquat-induced oxidative stress and cytotoxicity in Chinese hamster ovary cells overexpressing NADPH-cytochrome P450 reductase. Free Radical Biol. Med. 2011, 50, 874–882. [Google Scholar] [CrossRef] [PubMed] [Green Version]
  34. De Busser, E.V.; Dewulf, J.; Zutter, L.D.; Haesebrouck, F.; Callens, J.; Meyns, T.; Maes, W.; Maes, D. Effect of administration of organic acids in drinking water on faecal shedding of E. coli, performance parameters and health in nursery pigs. Vet. J. 2011, 188, 184–188. [Google Scholar] [CrossRef]
  35. Wang, Q.Y.; Lin, Y.Y.; Sheng, X.L.; Xu, J.Z.; Hou, X.N.; Li, Y.; Zhang, H.; Guo, H.Y.; Yu, Z.Q.; Ren, F.Z. Arachidonic Acid Promotes Intestinal Regeneration by Activating WNT Signaling. Stem Cell Rep. 2020, 15, 374–388. [Google Scholar] [CrossRef]
  36. Yang, Y.; Huang, J.; Li, J.Z.; Yang, H.S.; Yin, Y.L. The Effects of Butyric Acid on the Differentiation, Proliferation, Apoptosis, and Autophagy of IPEC-J2 Cells. Curr Mol. Med. 2020, 20, 307–317. [Google Scholar] [CrossRef]
  37. Nygard, Y.; Mojzita, D.; Toivari, M.; Penttila, M.; Wiebe, M.G.; Ruohonen, L. The diverse role of Pdr12 in resistance to weak organic acids. Yeast 2014, 31, 219–232. [Google Scholar] [CrossRef]
  38. Kurtoglu, Y.E.; Navath, R.S.; Wang, B.; Kannan, S.; Romero, R.; Kannan, R.M. Poly(amidoamine) dendrimer-drug conjugates with disulfide linkages for intracellular drug delivery. Biomaterials 2009, 30, 2112–2121. [Google Scholar] [CrossRef] [Green Version]
  39. Shi, H.T.; Ye, T.T.; Chen, F.F.; Cheng, Z.M.; Wang, Y.P.; Yang, P.F.; Zhang, Y.S.; Chan, Z.L. Manipulation of arginase expression modulates abiotic stress tolerance in Arabidopsis: Effect on arginine metabolism and ROS accumulation. J. Exp. Bot. 2013, 64, 1367–1379. [Google Scholar] [CrossRef] [Green Version]
  40. Jin, M.; Liu, L.; Wang, D.N.; Yang, D.; Liu, W.L.; Yin, J.; Yang, Z.W.; Wang, H.R.; Qiu, Z.G.; Shen, Z.Q.; et al. Chlorine disinfection promotes the exchange of antibiotic resistance genes across bacterial genera by natural transformation. Isme J. 2020, 14, 1847–1856. [Google Scholar] [CrossRef]
  41. Chen, D.; Xiao, Z.; Guo, H.; Gogishvili, D.; Setroikromo, R.; van der Wouden, P.E.; Dekker, F.J. Identification of a Bromodomain-like Region in 15-Lipoxygenase-1 Explains Its Nuclear Localization. Angew. Chem. Int. Ed. Engl. 2021, 60, 21875–21883. [Google Scholar] [CrossRef]
  42. Xiang, X.D.; Deng, Z.C.; Wang, Y.W.; Sun, H.; Wang, L.; Han, Y.M.; Wu, Y.Y.; Liu, J.G.; Sun, L.H. Organic Acids Improve Growth Performance with Potential Regulation of Redox Homeostasis, Immunity, and Microflora in Intestines of Weaned Piglets. Antioxidants 2021, 10, 1665. [Google Scholar] [CrossRef]
  43. Zhang, Y.; Wang, Y.; Chen, D.W.; Yu, B.; Zheng, P.; Mao, X.B.; Luo, Y.H.; Li, Y.; He, J. Dietary chlorogenic acid supplementation affects gut morphology, antioxidant capacity and intestinal selected bacterial populations in weaned piglets. Food Funct. 2018, 9, 4968–4978. [Google Scholar] [CrossRef]
  44. Song, D.G.; Cheng, Y.Z.; Li, X.X.; Wang, F.Q.; Lu, Z.Q.; Xiao, X.; Wang, Y.Z. Biogenic Nanoselenium Particles Effectively Attenuate Oxidative Stress-Induced Intestinal Epithelial Barrier Injury by Activating the Nrf2 Antioxidant Pathway. ACS Appl. Mater. Inter. 2017, 9, 14724–14740. [Google Scholar] [CrossRef]
  45. Lounder, D.T.; Khandelwal, P.; Dandoy, C.E.; Jodele, S.; Grimley, M.S.; Wallace, G.; Lane, A.; Taggart, C.; Teusink-Cross, A.C.; Lake, K.E.; et al. Lower levels of vitamin A are associated with increased gastrointestinal graft-versus-host disease in children. Blood 2017, 129, 2801–2807. [Google Scholar] [CrossRef] [Green Version]
  46. Sharma, D.; Malik, A.; Guy, C.S.; Karki, R.; Vogel, P.; Kanneganti, T.D. Pyrin Inflammasome Regulates Tight Junction Integrity to Restrict Colitis and Tumorigenesis. Gastroenterology 2018, 154, 948–964. [Google Scholar] [CrossRef]
  47. Yan, H.; Ajuwon, K.M. Butyrate modifies intestinal barrier function in IPEC-J2 cells through a selective upregulation of tight junction proteins and activation of the Akt signaling pathway. PLoS ONE 2017, 12, e0179586. [Google Scholar] [CrossRef] [Green Version]
  48. Li, J.J.; Zhang, L.; Wu, T.; Li, Y.F.; Zhou, X.J.; Ruan, Z. Indole-3-propionic Acid Improved the Intestinal Barrier by Enhancing Epithelial Barrier and Mucus Barrier. J. Agric. Food Chem. 2021, 69, 1487–1495. [Google Scholar] [CrossRef]
  49. Franzosa, E.A.; Sirota-Madi, A.; Avila-Pacheco, J.; Fornelos, N.; Haiser, H.; Reinker, S.; Vatanen, T.; Hall, A.B.; Mallick, H.; Mclver, L.J.; et al. Gut microbiome structure and metabolic activity in inflammatory bowel disease. Nat. Microbiol. 2019, 4, 293–305. [Google Scholar] [CrossRef]
  50. Huang, W.; Wang, G.F.; Lu, S.E.; Kipen, H.; Wang, Y.D.; Hu, M.; Lin, W.W.; Rich, D.; Ohman-Strickland, P.; Diehl, S.R.; et al. Inflammatory and Oxidative Stress Responses of Healthy Young Adults to Changes in Air Quality during the Beijing Olympics. Am. J. Resp. Crit. Care 2012, 186, 1150–1159. [Google Scholar] [CrossRef]
  51. Burte, F.; Brown, B.J.; Orimadegun, A.E.; Ajetunmobi, W.A.; Afolabi, N.K.; Akinkunmi, F.; Kowobari, O.; Omokhodion, S.; Osinusi, K.; Akinbami, F.O.; et al. Circulatory hepcidin is associated with the anti-inflammatory response but not with iron or anemic status in childhood malaria. Blood 2013, 121, 3016–3022. [Google Scholar] [CrossRef] [PubMed]
  52. Xun, W.; Fu, Q.; Shi, L.; Cao, T.; Jiang, H.; Ma, Z. Resveratrol protects intestinal integrity, alleviates intestinal inflammation and oxidative stress by modulating AhR/Nrf2 pathways in weaned piglets challenged with diquat. Int. Immunopharmacol. 2021, 99, 107989. [Google Scholar] [CrossRef] [PubMed]
  53. Bortoluzzi, C.; Lahaye, L.; Oxford, J.; Detzler, D.; Eyng, C.; Barbieri, N.L.; Santin, E.; Kogut, M.H. Protected Organic Acid and Essential Oils for Broilers Raised Under Field Conditions: Intestinal Health Biomarkers and Cecal Microbiota. Front. Physiol. 2021, 12, 722339. [Google Scholar] [CrossRef] [PubMed]
  54. Wu, B.; Qiu, W.; Wang, P.; Yu, H.; Cheng, T.; Zambetti, G.P.; Zhang, L.; Yu, J. p53 independent induction of PUMA mediates intestinal apoptosis in response to ischaemia-reperfusion. Gut 2007, 56, 645–654. [Google Scholar] [CrossRef] [Green Version]
  55. Jiao, S.; Li, Z. Nonapoptotic function of BAD and BAX in long-term depression of synaptic transmission. Neuron 2011, 70, 758–772. [Google Scholar] [CrossRef] [Green Version]
  56. Zhang, H.; Chen, Y.N.; Chen, Y.P.; Jia, P.L.; Ji, S.L.; Xu, J.X.; Li, Y.; Wang, T. Comparison of the effects of resveratrol and its derivative pterostilbene on hepatic oxidative stress and mitochondrial dysfunction in piglets challenged with diquat. Food Funct. 2020, 11, 4202–4215. [Google Scholar] [CrossRef]
  57. Liu, J.; Xie, Y.X.; Ducharme, D.M.K.; Shen, J.; Diwan, B.A.; Merrick, B.A.; Grissom, S.F.; Tucker, C.J.; Paules, R.S.; Tennant, R.; et al. Global gene expression associated with hepatocarcinogenesis in adult male mice induced by in utero arsenic exposure. Environ. Health Persp. 2006, 114, 404–411. [Google Scholar] [CrossRef] [Green Version]
  58. Qiu, X.C.; Dong, K.S.; Guan, J.Z.; He, J.M. Hydrogen attenuates radiation-induced intestinal damage by reducing oxidative stress and inflammatory response. Int. Immunopharmacol. 2020, 84, 106517. [Google Scholar] [CrossRef]
  59. Luan, F.; Rao, Z.; Peng, L.; Lei, Z.; Zeng, J.; Peng, X.; Yang, R.; Liu, R.; Zeng, N. Cinnamic acid preserves against myocardial ischemia/reperfusion injury via suppression of NLRP3/Caspase-1/GSDMD signaling pathway. Phytomedicine 2022, 100, 154047. [Google Scholar] [CrossRef]
  60. Schneider, D.; Ganesan, S.; Comstock, A.T.; Meldrum, C.A.; Mahidhara, R.; Goldsmith, A.M.; Curtis, J.L.; Martinez, F.J.; Hershenson, M.B.; Sajjan, U. Increased Cytokine Response of Rhinovirus-infected Airway Epithelial Cells in Chronic Obstructive Pulmonary Disease. Am. J. Resp. Crit. Care. 2010, 182, 332–340. [Google Scholar] [CrossRef]
  61. Lu, Y.; Chen, B.; Song, J.H.; Zhen, T.; Wang, B.Y.; Li, X.; Liu, P.; Yang, X.; Zhang, Q.L.; Xi, X.D.; et al. Eriocalyxin B ameliorates experimental autoimmune encephalomyelitis by suppressing Th1 and Th17 cells. Proc. Natl. Acad. Sci. USA 2013, 110, 2258–2263. [Google Scholar] [CrossRef] [Green Version]
  62. Geraldes, P.; Hiraoka-Yamamoto, J.; Matsumoto, M.; Clermont, A.; Leitges, M.; Marette, A.; Aiello, L.P.; Kern, T.S.; King, G.L. Activation of PKC-delta and SHP-1 by hyperglycemia causes vascular cell apoptosis and diabetic retinopathy. Nat. Med. 2009, 15, 1298–1306. [Google Scholar] [CrossRef] [Green Version]
  63. Zhang, Y.; Chen, H.X.; Zhou, S.Y.; Wang, S.X.; Zheng, K.; Xu, D.D.; Liu, Y.T.; Wang, X.Y.; Wang, X.; Yan, H.Z.; et al. Sp1 and c-Myc modulate drug resistance of leukemia stem cells by regulating survivin expression through the ERK-MSK MAPK signaling pathway. Mol. Cancer 2015, 14, 56–73. [Google Scholar] [CrossRef] [Green Version]
  64. Jian, Z.; Liang, B.; Pan, X.; Xu, G.; Guo, S.S.; Li, T.; Zhou, T.; Xiao, Y.B.; Li, A.L. CUEDC2 modulates cardiomyocyte oxidative capacity by regulating GPX1 stability. Embo Mol. Med. 2016, 8, 813–829. [Google Scholar] [CrossRef]
  65. Brenhouse, H.C.; Andersen, S.L. Nonsteroidal anti-inflammatory treatment prevents delayed effects of early life stress in rats. Biol. Psychiatry 2011, 70, 434–440. [Google Scholar] [CrossRef] [Green Version]
  66. Kang, K.B.; Zhu, C.; Yong, S.K.; Gao, Q.; Wong, M.C. Enhanced sensitivity of celecoxib in human glioblastoma cells: Induction of DNA damage leading to p53-dependent G1 cell cycle arrest and autophagy. Mol. Cancer 2009, 8, 66–81. [Google Scholar] [CrossRef]
Figure 1. The establishment of an oxidative stress model induced by diquat. (A) Effects of different concentrations of diquat on the viability of IPEC-J2 cells for 6 h. The IC50 was calculated using GraphPad Prism 8 software. Cell cytotoxicity was evaluated utilizing an MTT cell assay kit. (B) Effects of acidifier pretreatment with different concentrations on the viability of IPEC-J2 cells treated with optimal dose of diquat at different times. IPEC-J2 cells were incubated with or without acidifiers at the different concentrations for 2 h, 4 h, or 6 h. Then, the culture medium was replaced with fresh medium containing 1150 μM of diquat. After incubation for 6 h, cell viability was measured by the CCK-8 assay kit. CON, IPEC-J2 cells without being treated; DQ, cells were only treated by 1150 μM diquat. AC + DQ at 0.005%, 0.01% AC + DQ, 0.05% AC + DQ, 0.1% AC + DQ, 0.15% AC + DQ, 0.20% AC + DQ, cells were pretreated by 0.005%, 0.01%, 0.05%, 0.1%, 0.15%, and 0.20% concentrations acidifiers for 2, 4, 6 h, respectively, and were then treated by 1150 µM of diquat for 6 h. Data were presented as mean ± SEM (n = 8). Statistical significance was determined by one-way ANOVA with Tukey’s post hoc test. Different superscript letters denote a statistically significant difference between groups (p < 0.05), while same letters denote no significant difference.
Antioxidants 11 02002 g001
Figure 2. Acidifiers alleviated oxidative stress induced by diquat in IPEC-J2 cells and improved antioxidant capacity. (A) Intracellular contents of oxygen reactive species (ROS). (B) Cellular MDA levels. (C) Cellular CAT activity. (D) Cellular T-SOD activity. (E) Cellular GSH-Px activity. (F) Cellular T-AOC levels. CON, cells without being treated; DQ, cells were only treated by 1150 µM of diquat for 6 h; AC + DQ, cells were pretreated by 0.005% acidifier for 4 h and were then treated by 1150 µM of diquat for 6 h. AC, cells were only treated by 1150 µM of acidifier for 4 h. All values were represented as means ± SEM (n = 6). Different superscript letters denote a statistically significant difference between groups (p < 0.05), while same letters denote no significant difference.
Antioxidants 11 02002 g002
Figure 3. Effects of acidifiers on the expressions of tight-junction-related genes in diquat-challenged IPEC-J2 cells. (A) Localization of the tight-junction protein claudin-1 by immunofluorescence staining. IPEC-J2 cells were plated in 12-well plates at a density of 1 × 10⁵ cells per well and pretreated by 0.005% acidifiers for 4 h, and the cells were then challenged by diquat (1150 µM) for 6 h. Immunofluorescence staining of IPEC-J2 cells with claudin-1 (red) and DAPI (blue). Magnification 20×, and scale bars representing 20 μm. (B) Assays of cell viability. (C) The mRNA expression level of claudin-1 (CLDN1). (D) The mRNA expression level of occludin (OCLN). (E) The mRNA expression level of ZO-1. CON, cells without being treated; DQ, cells were only treated by 1150 µM of diquat for 6 h; AC + DQ, cells were pretreated by 0.005% acidifier for 4 h and were then treated by 1150 µM of diquat for 6 h. AC, cells were only treated by 1150 µM of acidifier for 6 h. All values were represented as means ± SEM (n = 6). Different superscript letters denote a statistically significant difference between groups (p < 0.05), while same letters denote no significant difference.
Antioxidants 11 02002 g003
Figure 4. Effects of acidifiers on the secretion and gene expression level of inflammatory cytokines in diquat-challenged IPEC-J2 cells. (A) Concentration of TNF-α in the IPEC-J2 cells culture supernatant. (B) Concentration of IL-8 in the IPEC-J2 cells culture supernatant. (C) Concentration of IL-10 in the IPEC-J2 cells culture supernatant. (D) The gene expression level of TNF-α. (E) The gene expression level of IL-8. (F) The gene expression level of IL-10. CON, cells without being treated; DQ, cells were only treated by 1150 µM of diquat for 6 h; AC + DQ, cells were pretreated by 0.005% acidifier for 4 h and were then treated by 1150 µM of diquat for 6 h. AC, cells were only treated by 1150 µM of acidifier for 6 h. All values were represented as means ± SEM (n = 6). Different superscript letters denote a statistically significant difference between groups (p < 0.05), while same letters denote no significant difference.
Antioxidants 11 02002 g004
Figure 5. Effect of acidifiers on the apoptosis of IPEC-J2 cells induced by diquat. (A) Annexin V-FITC/PI apoptosis assay. Apoptotic cell rates were detected with a FITC annexin V-FITC/PI apoptosis kit, and then analyzed by flow cytometry. (B) The cell apoptosis of IPEC-J2 cells. (C) The mRNA expression level of BAX was determined using a qRT-PCR. (D) The mRNA expression level of BCL-2 was determined using a qRT-PCR. CON, cells without being treated; DQ, cells were only treated by 1150 µM of diquat for 6 h; AC + DQ, cells were pretreated by 0.005% acidifier for 4 h and were then treated by 1150 µM of diquat for 6 h. AC, cells were only treated by 1150 µM of acidifier for 6 h. All values were represented as means ± SEM (n = 6). Different superscript letters denote a statistically significant difference between groups (p < 0.05), while same letters denote no significant difference.
Antioxidants 11 02002 g005
Figure 6. The effect of acidifiers on the proliferation of IPEC-J2 cells induced by diquat. (A) Edu staining of IPEC-J2 cells (magnification 10×, scale bar = 50 μm). (B) Statistical results of the proportion of EdU-positive cells. (C) Relative mRNA level of PCNA gene. (D) Relative mRNA level of CCND1 gene. CON, cells without being treated; DQ, cells were only treated by 1150 µM of diquat for 6 h; AC + DQ, cells were pretreated by 0.005% acidifier for 4 h and were then treated by 1150 µM of diquat for 6 h. AC, cells were only treated by 1150 µM of acidifier for 6 h. All values were represented as means ± SEM (n = 6). Different superscript letters denote a statistically significant difference between groups (p < 0.05), while same letters denote no significant difference.
Antioxidants 11 02002 g006
Figure 7. Effects of acidifiers on the NF-κB/MAPK/COX-2 signaling pathways in IPEC-J2 cells. The mRNA levels of COX-2 (A), NF-κB (B), and I-κB-α (C). The protein expression level of COX-2 (D), NF-κB (E), and I-κB-α (F). The mRNA levels of I-κB-β (G), ERK1 (H), and JNK2 (I). The protein expression level of I-κB-β (J), ERK1/2 (K), and JNK2 (L). CON, cells without being treated; DQ, cells were only treated by 1150 µM of diquat for 6 h; AC + DQ, cells were pretreated by 0.005% acidifier for 4 h and were then treated by 1150 µM of diquat for 6 h. AC, cells were only treated by 1150 µM of acidifier for 6 h. All values were represented as means ± SEM (n = 3). Different superscript letters denote a statistically significant difference between groups (p < 0.05), while same letters denote no significant difference.
Antioxidants 11 02002 g007
Publisher’s Note: MDPI stays neutral with regard to jurisdictional claims in published maps and institutional affiliations.

