Article

Mycobacterium tuberculosis H2S Functions as a Sink to Modulate Central Metabolism, Bioenergetics, and Drug Susceptibility

by
Tafara T. R. Kunota
1,†,
Md. Aejazur Rahman
1,†,
Barry E. Truebody
1,
Jared S. Mackenzie
1,
Vikram Saini
2,
Dirk A. Lamprecht
1,‡,
John H. Adamson
1,
Ritesh R. Sevalkar
3,
Jack R. Lancaster, Jr.
4,
Michael Berney
5,
Joel N. Glasgow
3 and
Adrie J. C. Steyn
1,3,6,*
1
Africa Health Research Institute, University of KwaZulu Natal, Durban 4001, South Africa
2
Department of Biotechnology, All India Institute of Medical Sciences, New Delhi 110029, India
3
Department of Microbiology, University of Alabama at Birmingham, Birmingham, AL 35294, USA
4
Department of Pharmacology and Chemical Biology, Vascular Medicine Institute, University of Pittsburgh School of Medicine, Pittsburgh, PA 15261, USA
5
Department of Microbiology and Immunology, Albert Einstein College of Medicine, New York, NY 10462, USA
6
Centers for AIDS Research and Free Radical Biology, University of Alabama at Birmingham, Birmingham, AL 35294, USA
*
Author to whom correspondence should be addressed.
Co-first authors, both authors contributed equally.
Current address: Janssen Pharmaceutica, Global Public Health, Turnhoutseweg 30, B-2340 Beerse, Belgium.
Antioxidants 2021, 10(8), 1285; https://doi.org/10.3390/antiox10081285
Submission received: 8 June 2021 / Revised: 4 August 2021 / Accepted: 7 August 2021 / Published: 13 August 2021
(This article belongs to the Special Issue Hydrogen Sulfide in Biology)

Abstract

:
H2S is a potent gasotransmitter in eukaryotes and bacteria. Host-derived H2S has been shown to profoundly alter M. tuberculosis (Mtb) energy metabolism and growth. However, compelling evidence for endogenous production of H2S and its role in Mtb physiology is lacking. We show that multidrug-resistant and drug-susceptible clinical Mtb strains produce H2S, whereas H2S production in non-pathogenic M. smegmatis is barely detectable. We identified Rv3684 (Cds1) as an H2S-producing enzyme in Mtb and show that cds1 disruption reduces, but does not eliminate, H2S production, suggesting the involvement of multiple genes in H2S production. We identified endogenous H2S to be an effector molecule that maintains bioenergetic homeostasis by stimulating respiration primarily via cytochrome bd. Importantly, H2S plays a key role in central metabolism by modulating the balance between oxidative phosphorylation and glycolysis, and it functions as a sink to recycle sulfur atoms back to cysteine to maintain sulfur homeostasis. Lastly, Mtb-generated H2S regulates redox homeostasis and susceptibility to anti-TB drugs clofazimine and rifampicin. These findings reveal previously unknown facets of Mtb physiology and have implications for routine laboratory culturing, understanding drug susceptibility, and improved diagnostics.

1. Introduction

Tuberculosis (TB) remains a major cause of morbidity and mortality in underdeveloped and developing countries. While substantial progress has been made in understanding the biological basis of Mtb pathogenesis, precisely how Mtb physiology and metabolism contribute to persistence, pathogenesis, and drug resistance is poorly understood.
The gasotransmitters carbon monoxide (CO) and nitric oxide (NO) have important roles in Mtb physiology [1,2,3,4]. A third gasotransmitter, hydrogen sulfide (H2S), is involved in a wide variety of physiological processes in eukaryotes and prokaryotes [5]. H2S is a weak acid in solution and at physiological pH, it exists predominantly as a hydrosulfide anion (HS, 75–80%), with the rest as H2S (20–25%) and only trace amounts of S2− [6]. Notably, H2S diffuses easily through cell membranes unlike its deprotonated conjugate bases HS and S2−. The complex nature of H2S in solution and its volatility make this molecule very difficult to measure and challenging to work with [6,7]. Furthermore, H2S can be generated non-enzymatically from media components [8] and, therefore, methods for measuring H2S require rigorous validation.
Cysteine (Cys) is frequently used as a substrate by bacterial Cys desulfhydrases for H2S production. Intracellular Cys levels require careful control, since excessive levels can stimulate oxidative stress via the Fenton reaction, which produces hydroxyl radicals [9]. On the other hand, H2S is also a substrate for Cys biosynthesis, which is required for the formation of low molecular weight thiols such as mycothiol (MSH) and ergothioneine (EGT) and biogenesis of iron sulfur cluster proteins [10,11]. The ability of bacteria to produce H2S has been widely used as a diagnostic test and for taxonomic purposes [12,13].
H2S production in bacteria has been attributed mainly to the enzymatic activity of cystathionine β-synthase (CBS), cystathionine γ-lyase (CSE), and 3-mercaptopyruvate sulfurtransferase (3MST) [14,15]. Addition of Cys to bacterial cultures has been shown to stimulate H2S production [14,15,16,17]. In both bacterial and mammalian cells, Cys is used as a substrate by CBS and CSE to produce H2S [15,18,19]. Although bacterial production of H2S was initially considered to be a byproduct of sulfur metabolism with unclear physiological relevance, studies in several bacterial species have shown that disrupting H2S-producing genes increases antibiotic susceptibility [15]. Obviously, these findings have important implications for understanding drug resistance in bacterial pathogens. In E. coli, 3MST produces the majority of cellular H2S from Cys [14] and genetic disruption of this gene leads to increased sensitivity to oxidative stress [14], implicating 3MST-derived H2S in maintaining redox homeostasis.
Several studies have shown that H2S reversibly inhibits cytochrome c oxidase (Complex IV) at high concentrations and stimulates mitochondrial respiration at low concentrations [20,21]. We have recently shown that exogenous H2S also targets the Mtb electron transport chain to increase respiration and ATP levels leading to increased growth [22], and that host-generated H2S exacerbates TB in mice [22,23]. Further, CSE and 3MST protein levels are substantially increased in human tuberculous lung tissue, and it has been proposed that Mtb triggers supraphysiological levels of host-generated H2S at the site of infection to suppress host immunity, thereby exacerbating disease [23]. Notably, Mtb senses host-generated H2S during infection and reprograms its metabolism accordingly [22].
H2S plays important roles in modulating mammalian immunity, although its effects have been shown to be both pro- and anti-inflammatory [18,24]. Thus, H2S produced by bacterial pathogens could act as a signaling molecule in the host, potentially exacerbating disease. The presence of Mtb homologues of H2S-producing enzymes identified in KEGG [25] and several biochemical studies [26,27,28,29,30] suggest that Mtb has the capacity to produce H2S. However, formal genetic and biochemical demonstration of H2S production by Mtb cells and its functions in Mtb physiology is lacking. Due to the diverse roles H2S plays in prokaryotic biology and bacterial classification, clear evidence that Mtb produces H2S is expected to widely influence our understanding of Mtb physiology, disease, and diagnostics.
Here, we tested the hypothesis that Mtb produces H2S by measuring H2S production in drug-susceptible (DS) and multidrug-resistant (MDR) clinical strains, laboratory Mtb strains, and non-pathogenic mycobacterial species. We then identified a gene and corresponding protein responsible for H2S production in Mtb. We generated an Mtb knockout strain and utilized flow cytometry, extracellular metabolic flux analysis, 13C stable isotope analyses, and drug studies to determine the effect of endogenously produced H2S on respiration, central metabolism, redox balance, and drug susceptibility. We expect our findings to broadly impact our understanding of Mtb physiology and drug resistance.

2. Materials and Methods

2.1. General

All mycobacteria strains (See Supplementary Materials, Table S1) were cultured in Middlebrook 7H9 media (BD Difco, New York, NY, USA) supplemented with 0.01% tyloxapol (Sigma–Aldrich, USA), 0.2% glycerol (Sigma–Aldrich, New York, NY, USA), and 10% (oleic acid, bovine albumin fraction V, dextrose, and catalase (OADC, BD Difco, New York, NY, USA) unless stated otherwise. Cultures were placed in a shaking incubator (100 rpm) at 37 °C. Strains examined included Mb H37Rv, Mtb CDC1551, Mycobacterium bovis (supplemented media with 100 µM sodium pyruvate), Mycobacterium bovis BCG, M. smegmatis, two drug susceptible Mtb strains (i.e., TKK-01-0027 and TKK-01-0047), and two multi-drug resistant Mtb strains (i.e., TKK-01-0035 and TKK-01-0001). The drugs’ MIC50 values used during this study were as follows: clofazimine (CFZ), 211 nM; rifampicin (RIF), 486 nM; isoniazid (INH), 240 nM. Where required, the following antibiotics were used; hygromycin B (100 µg/mL for E. coli, 50 µg/mL for mycobacteria) and kanamycin (50 µg/mL for E. coli, 25 µg/mL for mycobacteria). Dihydroethidium (DHE) was purchased from Thermo Fisher Scientific (New York, NY, USA) (Cat# D11347). Restriction enzymes were obtained from Thermo Fisher Scientific (Germany). The KOD Xtreme Hotstart DNA polymerase kit was obtained from Merck (Darmstadt, Germany). T4 DNA ligase was obtained from New England Biolabs (NEB, New York, NY, USA). E. coli DH5α, used for cloning and DNA manipulation, was routinely cultured in Luria-Bertani liquid media at 37 °C. Oligonucleotides were synthesized by Thermo Fisher Scientific (USA). All other reagents were purchased from Merck or Sigma–Aldrich.

2.2. Preparation of Mycobacterial Lysates

All cultures were grown to an OD600 of ~0.8. The cells were then harvested from 30 mL of culture and centrifuged at 4000× g for 5 min. The supernatant was discarded, and the pellet was resuspended in 1–2 mL of lysis buffer (50 mM Tris-HCl, pH 8.0; 150 mM NaCl; protease inhibitor (Roche, New York, NY, USA)), depending on the size of the cell pellet. Cells were lysed in a MagNA Lyser (Roche, USA) at 7000 rpm for 1 min and then placed on ice for 4 min. This was repeated 3–4 times. The lysates were then centrifuged at 15,000× g for 10 min. The supernatant was collected and passed through a 0.22 µm filter. Protein concentrations were determined using the Micro BCA Protein Assay Kit (Thermo Fisher Scientific, USA), and the absorbance at 562 nm was measured using a Biotek Synergy H4 Hybrid Reader (BioTek, New York, NY, USA. Lysates were stored at 80 °C until use.

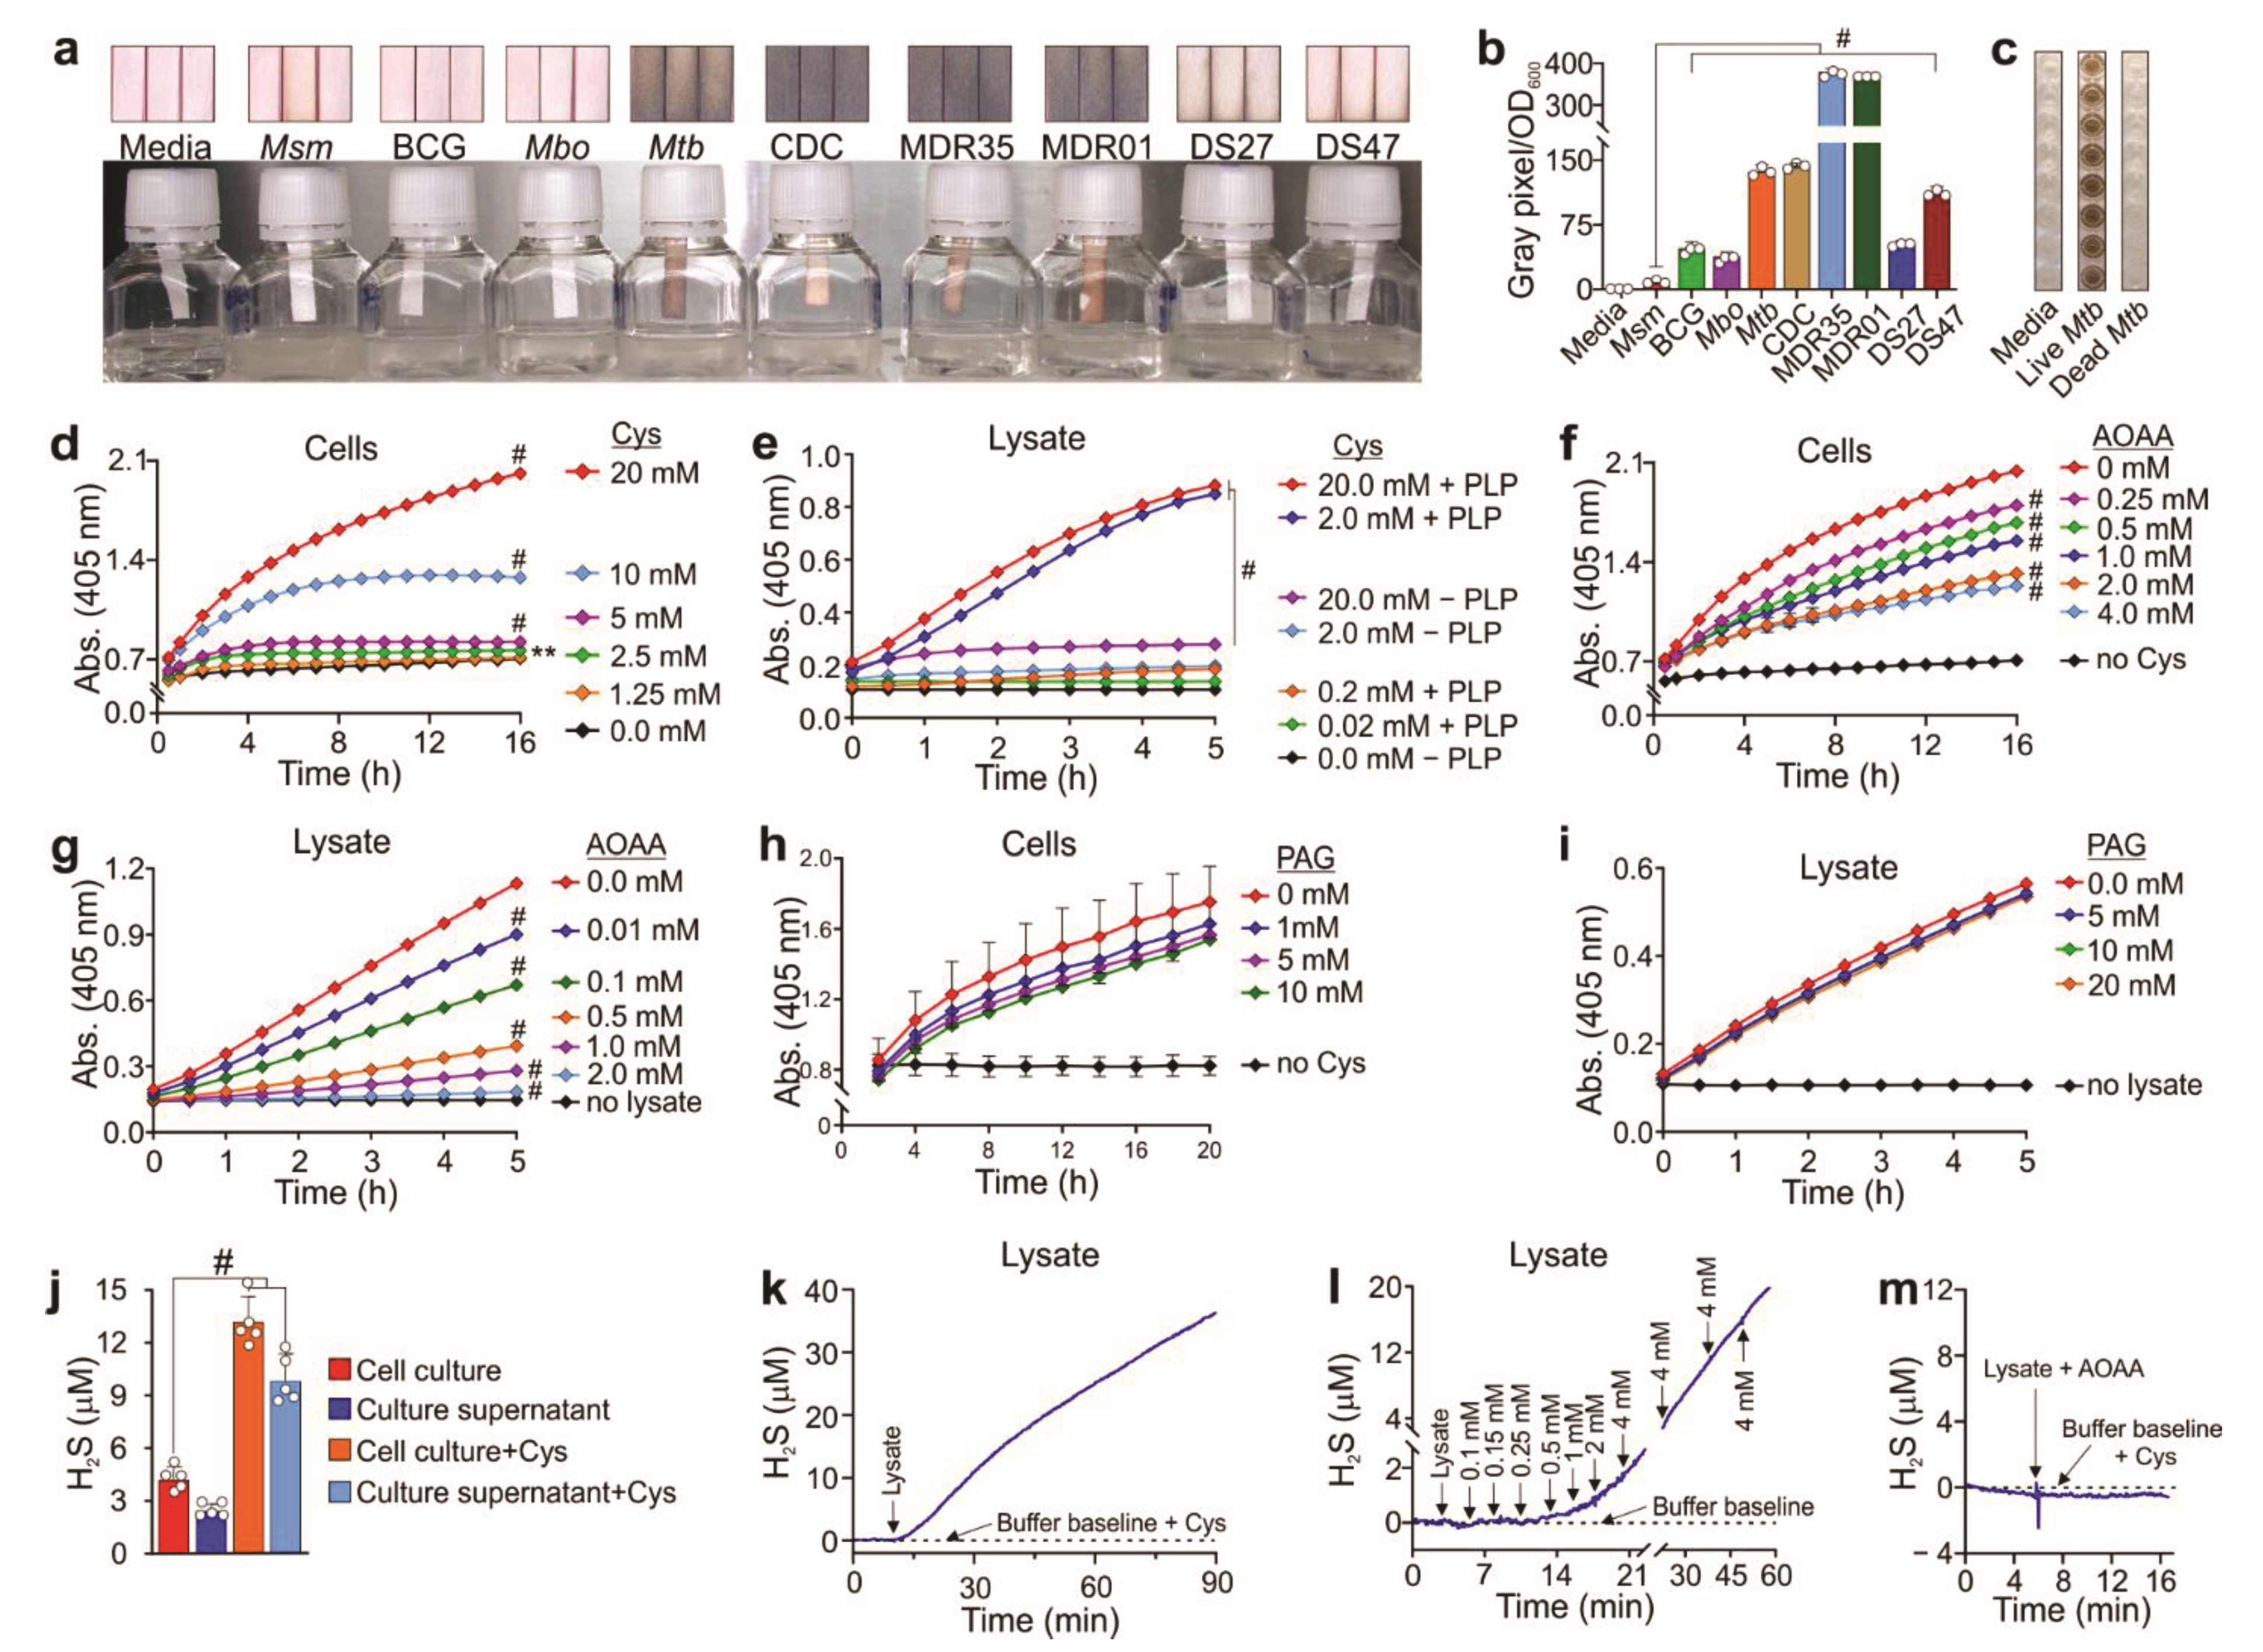
2.3. H2S Measurement Using the Lead Acetate Assay

Mycobacterial cultures were harvested at an OD600 of 0.8–1 and centrifuged at 3500× g for 5 min. The bacterial pellet was resuspended in an equal volume of 7H9 media containing 0.01% tyloxapol, 0.2% glycerol, and 10% OADC. 10 mL of diluted culture at an OD600 of 0.1 was then transferred to a 30 mL culture bottle. Lead acetate strips (Thermo Fisher Scientific, USA) were affixed to the inner wall of the culture bottles. The strips were monitored for the formation of dark colored lead sulfide precipitate and scanned after 48 h. The intensity of the dark lead sulfide stain is proportional to the amount of H2S present. The lead sulfide stain was then scanned and quantified by measuring the grayscale values for a specific area of each strip and normalized to OD600 using ImageJ software version 1.53a (Java 1.8.8_12 (64 bit)) [31].

2.4. H2S Measurement Using the Bismuth (III) Chloride (BiCl3) Assay

The BiCl3 (BC) assay is used to measure H2S based on the reaction of H2S with a bismuth (III) salt to form bismuth (III) sulfide (Bi2S3), which appears as a brown-to-black precipitate [32]. The microplate BC assay was performed in 96-well plates using intact H37Rv bacteria and lysates as described by Basic et al. (2015) [33]. Once the OD600 of cultures reached ~0.8–1, the cultures were centrifuged at 3500× g for 5 min. The supernatant was discarded, and the culture pellet was resuspended in the original volume of media before centrifugation. The BC assay solution (2×) contains 0.4 M triethanolamine–HCl/Tris–HCl (Sigma–Aldrich, USA), pH 8.0; 1 mM BiCl3 (Sigma–Aldrich, New York, NY, USA); 20 µM pyridoxal 5-phosphate monohydrate (PLP) (Sigma–Aldrich, USA), 20 mM EDTA (Sigma–Aldrich, USA), and 40 mM l-cysteine (Cys) (Sigma–Aldrich, USA). One hundred microliters of the mycobacteria cell suspension (OD600 = 1.0) or lysate (5 μg), with or without the inhibitors AOAA and PAG, was mixed with 100 µL of freshly prepared 2× bismuth solution in clear, flat-bottomed 96-well microtiter plates (Corning Inc., New York, NY, USA). For H2S measurements when Mtb was grown on different carbon sources, 100 µL of mycobacterial cell suspension in 7H9 medium containing 0.01% tyloxapol was supplemented with either: 0.4% glycerol, 1 mM sodium butyrate (Sigma–Aldrich, USA), 8 mM sodium acetate (Sigma), 2 mM sodium propionate (Sigma–Aldrich, USA) or 0.02% (w/v) cholesterol (Sigma–Aldrich, USA). These cell suspensions were then mixed with 100 µL of freshly prepared 2× bismuth solution in clear flat-bottomed 96-well microtiter plates. The working stock cholesterol was initially dissolved at 100 mg/mL in a solution of tyloxapol:ethanol (1:1) at 80 °C. Bi2S3 formation was determined by measuring the absorbance at 405 nm. The kinetics for mycobacterial cells was measured every 30 min for 15–20 h at 37 °C with shaking using a Hidex Sense Plate reader (Hidex, Finland). Enzymatic kinetics using lysates was measured every 5 min for 5–20 h with shaking at room temperature (~20–22 °C) using a Biotek Synergy H4 Hybrid Reader, (BioTek, New York, NY, USA).

2.5. Mtb Growth in Fatty Acids or Cholesterol as the Sole Carbon Source

One hundred microliters of mycobacterial cell suspension of OD600 ~0.1 in 7H9 containing 0.01% tyloxapol were mixed with 100 µL of 7H9 media containing 0.01% tyloxapol supplemented with either: 0.4% glycerol, 1 mM sodium butyrate, 8 mM sodium acetate, 2 mM sodium propionate, or 0.02% (w/v) cholesterol in clear, flat-bottomed 96-well microtiter plates. The plates were placed in an incubator at 37 °C. OD600 measurements were taken after 7 days.

2.6. H2S Measurement Using the Unisense Amperometric Microsensor

H2S released by cell cultures and lysates was measured at room temperature with a sensitive sulfide amperometric microsensor, H2S-500 (Unisense A/S, Denmark), connected to a microsensor multimeter (Unisense, A/S, Denmark) as an amplifier for data acquisition. The signal for H2S was collected in mV and converted to µM using a NaHS (Thermo Fisher Scientific) standard curve generated from a concentration range of 0–100 μM (freshly prepared in an anaerobic glovebox). The H2S microsensor was calibrated in accordance with the manufacturer’s instructions. Bacteria at an OD600 of 0.2 were cultured in media with or without 1 mM Cys. After 72 h, H2S concentrations were measured using the microsensor in the cell culture and the cell-free culture supernatants (referred to as “cleared supernatants”). Alternatively, Mtb strains were cultured to OD600 of ~0.8 without L-Cys and H2S measured after mixing 700 µL Mtb culture and 300 µL assay buffer (4 mL of 1.0 M Tris-HCl, pH 7.0, 1.0 mL of 400 mM L-Cys, and 1.0 mL of 200 mM EDTA) using the microsensor at different time points. H2S levels were normalized according to optical density.
For real-time H2S measurement in lysates, the microsensor was placed in a 2 mL tube containing 200 µL of 2× assay buffer (0.4 M triethanolamine-HCl, pH 8.0; 20 µM PLP, 20 mM EDTA) with or without 40 mM L-Cys and 160 µL lysis buffer (50 mM Tris-HCl, pH 8.0; 150 mM NaCl). The signal was allowed to generate a stable buffer baseline for ~5 min after which 40 µg (adjusted volume to 40 µL) of mycobacterial lysate was added to the reaction. When appropriate, L-Cys (0.1–4 mM) was subsequently added to the tube at different time intervals. To confirm AOAA inhibition, Mtb lysate preincubated with AOAA (4 mM) was added to the assay buffer containing 20 mM L-Cys. OASS activity was measured by placing the microsensor in 1 mL PBS solution. A 10 µL aliquot of 25 mM NaHS was added to the reaction tube twice, and after the signal stabilized, 30 ng of OASS was added to the reaction. After 2 min, OAS was added to the reaction to a final concentration of 10 mM, and the H2S signal was monitored in real time.

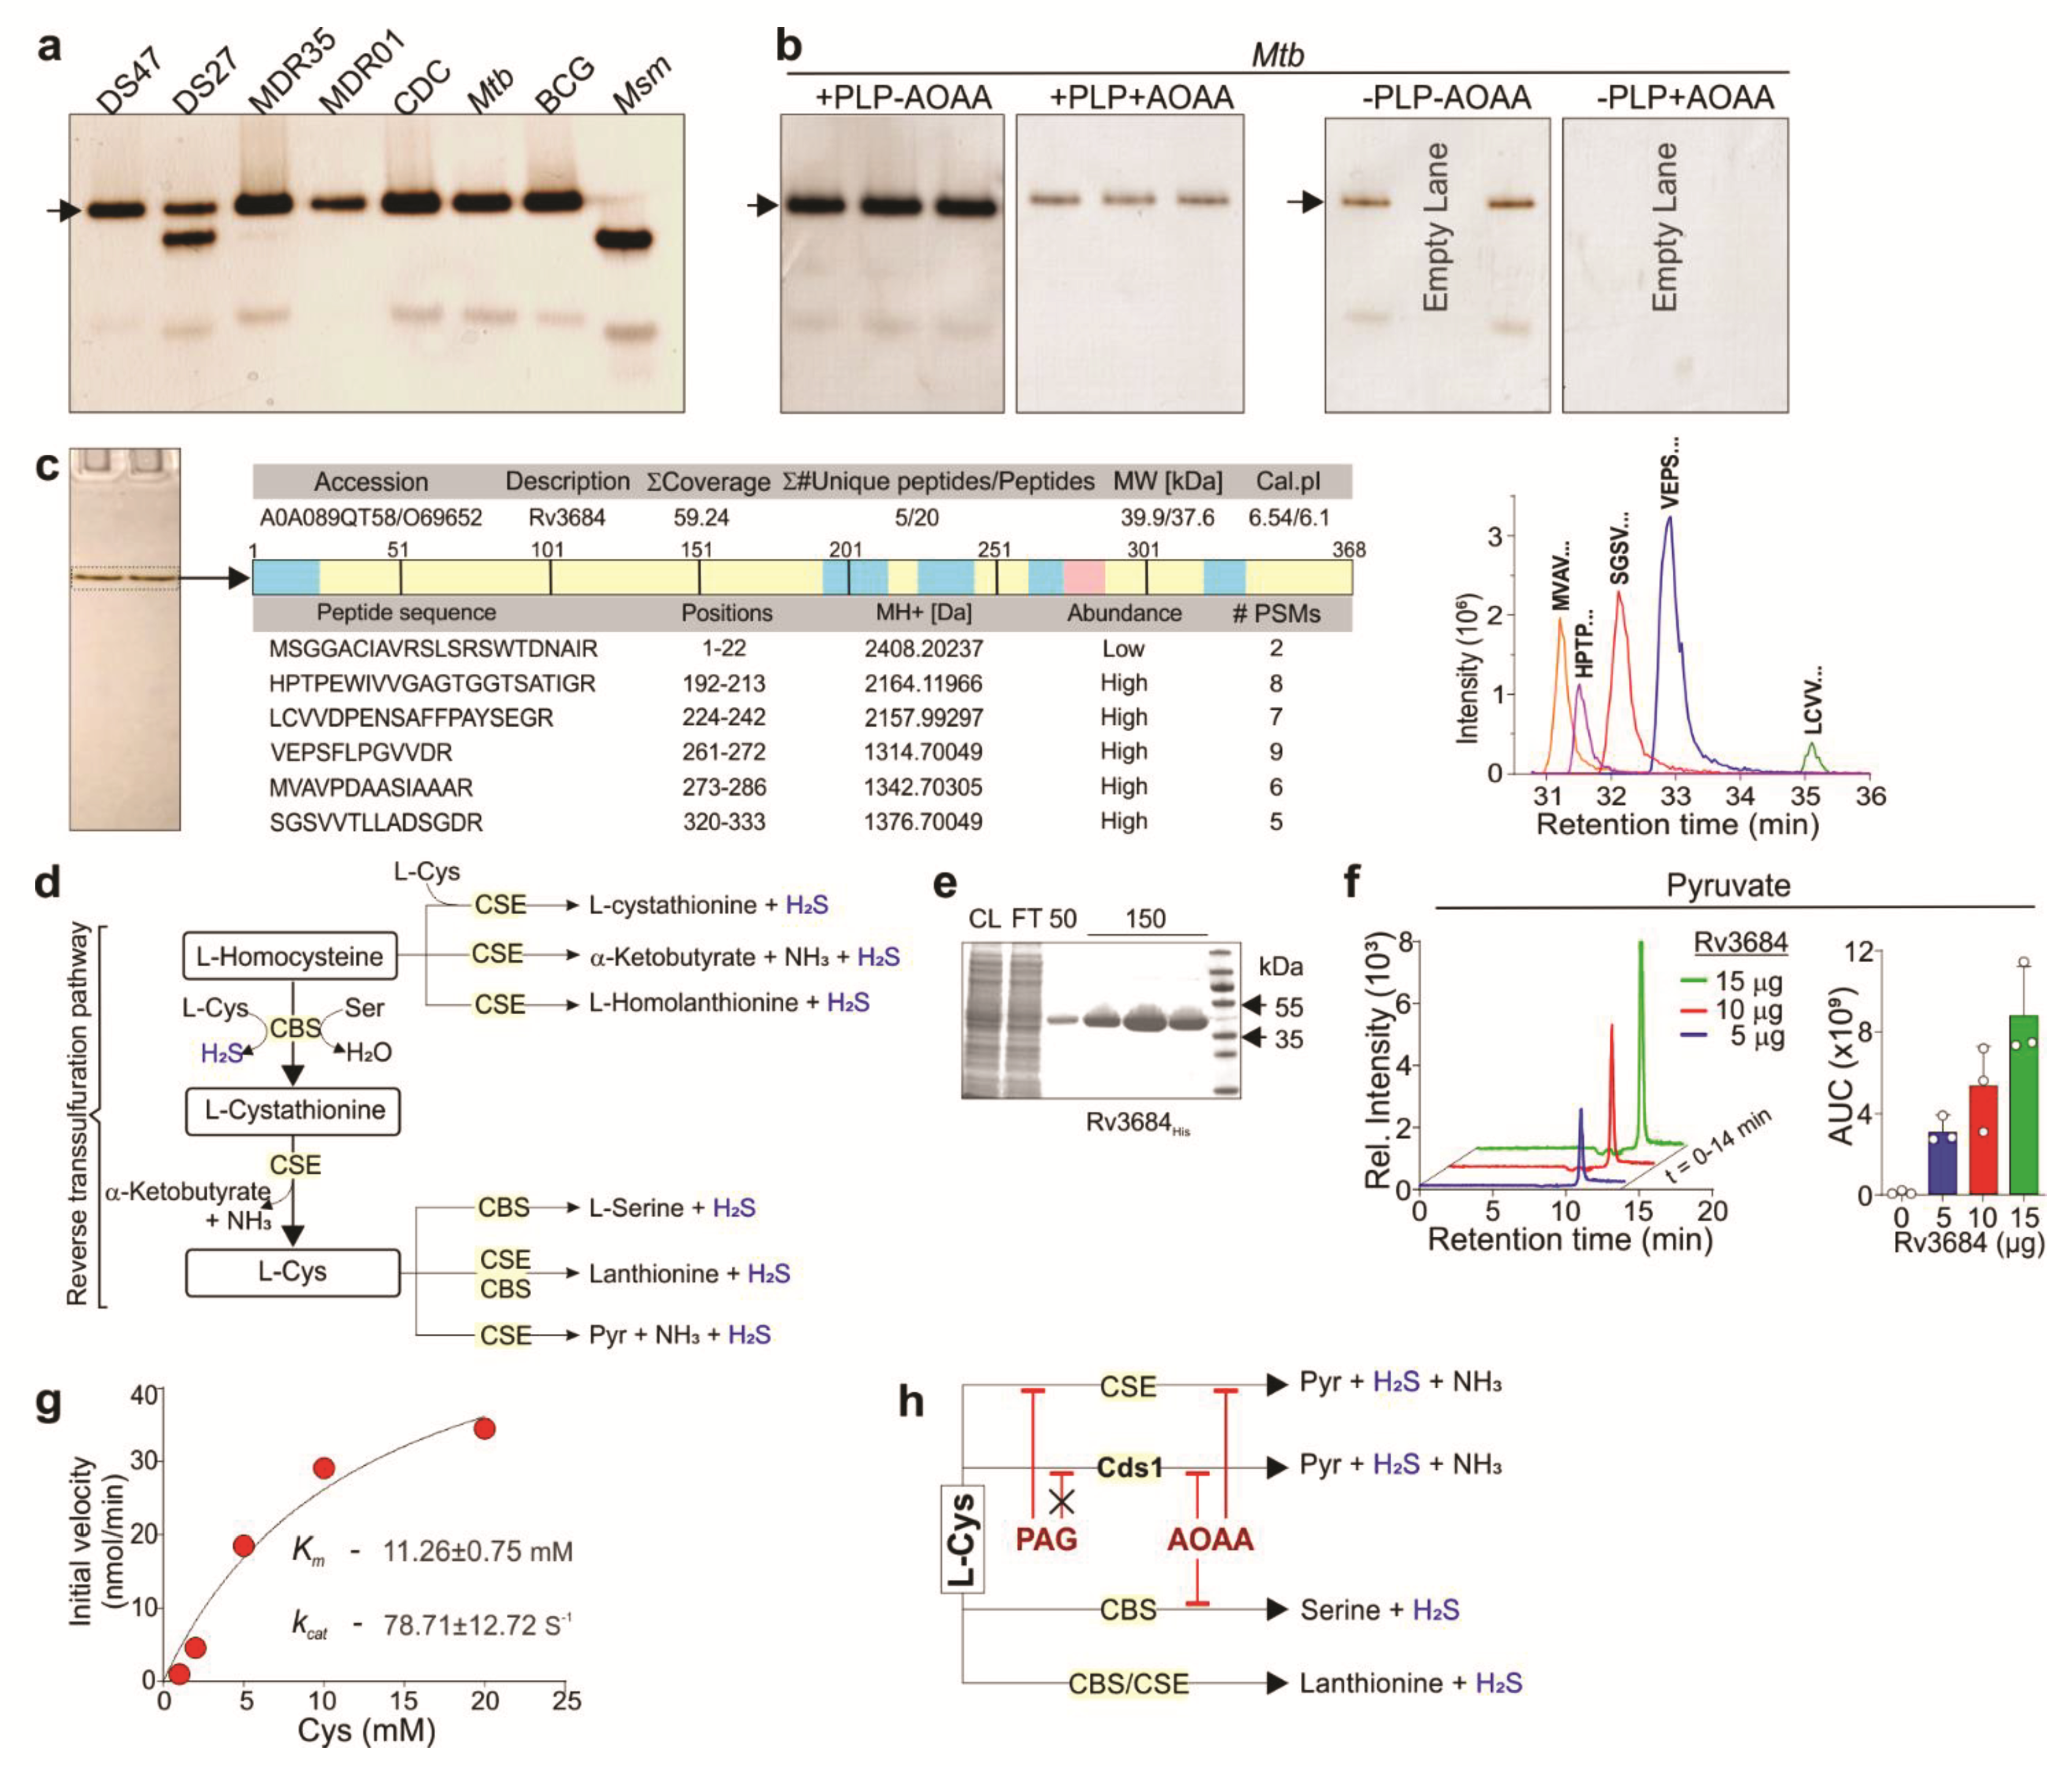
2.7. Native PAGE Analysis and In-Gel BC Assay

Equal amounts (15–25 µg per lane) of mycobacterial lysate were resolved on 10% PAGE gels (Bio-Rad, New York, NY, USA) under non-denaturing conditions using running buffer containing 25 mM Tris-base and 190 mM glycine. To detect the presence of H2S-producing proteins, gels were incubated in 20–50 mL of BC solution and incubated at room temperature with shaking. Gels were monitored every 20–60 min for the appearance of dark-colored Bi2S3. For gels exposed to AOAA, gels were incubated in 20 mL of 2 mM AOAA in 50 mM Tris-HCl pH 8.0 with shaking at room temperature for 5 min, followed by BC solution containing 2 mM AOAA overnight.

2.8. Extracellular Flux Analysis

The oxygen consumption rates (OCR) of Mtb strains were measured using a Seahorse XFe96 Extracellular Flux Analyzer (Agilent Technologies Inc., New York, NY, USA). Mtb bacilli were adhered to the bottom of a Cell-Tak-coated XF cell culture microplate at 2 × 10⁶ bacilli per well. Cell-Tak has no effect on Mtb basal respiration [34]. Assays were carried out in unbuffered 7H9 media (pH 7.35) with no carbon source. Mtb bacilli were grown in this unbuffered 7H9 media, containing only 0.01% Tyloxapol, for 24 h before being seeded into the XF cell culture microplate at the start of the experiment. In general, basal OCR was measured for ~25 min before automatic sequential injection of various compounds through the drug ports of the sensor cartridge. The duration of OCR measurements after compound addition and the concentrations used varied by experiment. OASS modulation of Mtb OCR in the presence of L-Cys was performed by the simultaneous addition of Cys, OASS, and substrate OAS (final concentration of 4 mM, 0.03 µg/mL, and 4 mM, respectively). Q203-based modulation of the OCR in Mtb and ΔcydAB cells was performed in the presence of the indicated Cys concentration followed by the addition of Q203 (300 × MIC50; MIC50 for Q203 is 3 nM) [34]. To chemically complement Δcds1 cells with H2S, different concentrations of NaHS were added to cells after measuring the baseline OCR. All OCR data figures indicate the time of each addition as dotted lines. OCR data points are representative of the average OCR during 4 min of continuous measurement in the transient microchamber, with the error being calculated from the OCR measurements taken from at least three replicate wells by the Seahorse Wave Desktop 2.2 software (Agilent Technologies Inc., New York, NY, USA). The transient microchamber was automatically re-equilibrated between measurements through the up and down mixing of the probes of the XF96 sensor cartridge in the wells of the XF cell culture microplate.

2.9. CFU-Based Assay

Mid-log phase mycobacterial cultures were diluted to an OD600 of 0.01 in 7H9 media. For survival studies in the presence of NaHS, bacterial cultures (7H9 with 10% OAD) were untreated or treated with anti-TB drugs and NaHS at indicated concentrations. For survival studies in the presence of antioxidants, bacterial cultures (7H9 with 10% OAD) were treated with or without 0.25 mM cumene hydroperoxide (CHP) for 16 h. For survival studies in the presence of CFZ, bacterial cultures (7H9 with 10% OADC) were treated with or without clofazimine at MIC 60×, 100× and 300× for 8 days. For all studies, samples were taken at indicated time points, serially diluted in PBS containing 0.01% tyloxapol and plated onto 7H11 OADC agar plates. Plates were incubated at 37 °C for 4 weeks to determine CFU counts.

2.10. ROI Assay

ROI production in Mtb strains (OD600 ~1.0) was measured using the dihydroethidium ROI sensing dye (DHE, excitation/emission at 500/605 nm). Mtb strains were cultured in Middlebrook 7H9 media supplemented with 0.2% glycerol and 0.01% tyloxapol at 37 °C with either 10% OAD (oleic acid, albumin, dextrose) with/without 0.25 mM cumene hydroperoxide (CHP) or 10% OADC (oleic acid, albumin, dextrose, and catalase) with or without 60 × MIC of CFZ for 16 h in 4 replicates. After treatment, Mtb cultures were washed by centrifugation (3000× g) and resuspended in 1× PBS (pH 7.4) containing 10 µM DHE, incubated further for 20 min at 37 °C followed by two washes with PBS to remove residual extracellular dye. The fluorescence of DHE-stained cells was acquired with a FACS Aria III cell sorter using the 500 nm laser excitation, and BP 610/20 nm for emission acquisition (PerCP-CyTM5.5). The cells were acquired at a constant flow rate of setting 4, a threshold rate of approximately 1000–2000 events per second, and 100,000 total events were recorded per sample. For analysis, the bacterial population was identified according to the forward and side scattering property of the population (FSC versus SSC). To obtain single cell populations, bacterial aggregation was removed from the data analysis using doublet discrimination from the FCS-height versus FSC-area plots. The percentage of DHE+ cells and mean fluorescent intensity were calculated with FlowJoTM v10.4.2 (Tree Star, Ashland, OR, USA).

2.11. Identification of Proteins by LC-MS/MS

The entire Bi2S3-stained protein band was excised from the gel, rinsed with water, and cut into approximately 1 mm × 4mm pieces using a sterile scalpel. The gel slices were then rinsed with 100 mM ammonium bicarbonate solution and collectively transferred into a sterile Eppendorf® LoBind (Eppendorf, Germany) 1.5 mL microcentrifuge tube. Five hundred microliters of acetonitrile (ACN) was added, and the sample was incubated on ice for 10 min. The sample was then briefly centrifuged, the acetonitrile removed, and 100 µL of 10 mM dithiothreitol (DTT) solution was added to rehydrate the gel pieces and reduce the proteins. The sample was incubated in 10 mM DTT solution at 56 °C for 30 min, removed, cooled to room temperature, and then 500 µL of ACN was added and the sample was incubated on ice for 10 min. The sample was then centrifuged, and the supernatant removed, then 100 µL of 55 mM iodoacetamide solution was added and the sample was incubated at room temperature for 30 min in the dark to facilitate protein alkylation. Following alkylation, 500 µL of ACN was added and the sample was incubated on ice for 10 min. All solution was then removed, and 200 µL of trypsin (Promega, sequence grade) solution at a concentration of 13 ng/mL was added to the gel slices; the sample was mixed gently and incubated at 4 °C for 2 h to allow the gel slices to re-hydrate and for the slow diffusion of trypsin into the polyacrylamide gel matrix. The samples were incubated in the trypsin solution at 37 °C overnight (18–24 h) for optimum in-gel protein digestion. The resulting peptides were extracted by adding 400 µL of 5% formic acid/acetonitrile (1:2, v/v) solution to the sample followed by 15 min incubation at 37 °C on a shaking heating block set at 450 rpm. The sample was briefly centrifuged, the supernatant transferred to a sterile microcentrifuge tube and dried using a SpeedVac concentrator (Labconco, New York, NY, USA) set at 40 °C. The extracted, dried peptides were then reconstituted in 50 µL of 5% formic acid solution, transferred to a glass vial, and 1 µL of sample was injected for nano-LC-MS/MS analysis.
The peptide digests were analyzed using a Thermo Q Exactive Orbitrap mass spectrometer coupled to a DionexTM UltiMateTM 3000 UPLC system. The tryptic peptides were maintained at 6 °C in the autosampler and were separated on a 15 cm nano-capillary column (ID 75 μM) packed in the laboratory with Supelco® (Supelco Inc., New York, NY, USA) 3.5 μM C18 stationary phase. A 45 min gradient from 1% acetonitrile, 99% water/0.1% formic acid, to 50% acetonitrile/water, 0.1% formic acid, flow rate 300 nL/min, was used for the analysis. Peptide fragment mass spectra were acquired using a full MS, data dependent MS2 Top 10 method. The MS RAW files were processed using Thermo Scientific™ Proteome Discoverer™ (Thermo Fisher Scientific, USA) 2.2 software and SEQUEST™ (Thermo Fisher Scientific, USA) peak-finding search engine application to compare the mass spectra to the Mtb FASTA database to identify relevant proteins and peptides. The method was set to consider carbamidomethyl modifications and methionine oxidation. The protein candidates were then screened for pyridoxal phosphate binding domains and potential roles in sulfur metabolism. A targeted method was constructed using the 5 strongest peptide fragment ions for the most likely candidate, Rv3684/Cds1, and the samples re-analyzed using this method to confirm the presence of this protein.

2.12. Preparation of Mycobacterial Genomic DNA

Genomic DNA was isolated from Mtb H37Rv as follows: Mtb H37Rv was grown to late log phase (OD600 = 1.0) in 50 mL 7H9 liquid media. Cells were harvested (2000× g, 20 min), the supernatant was discarded, and 6 mL of a freshly prepared solution of 3 parts chloroform to 1 part methanol added. Tubes were then vortexed for 1 min. Tris-buffered phenol (6 mL) was then added and the tube vortexed for a further 30 s. Finally, 9 mL of 4 mM guanidine thiocyanate solution was added, and the tubes inverted several times. After centrifuging at 2000× g for 15 min, the upper phase was removed, and an equal volume of isopropanol was added to precipitate genomic DNA. The DNA was collected by centrifugation and washed with 70% ethanol before being air-dried and suspended in 100 µL Tris-EDTA, pH 7.5.

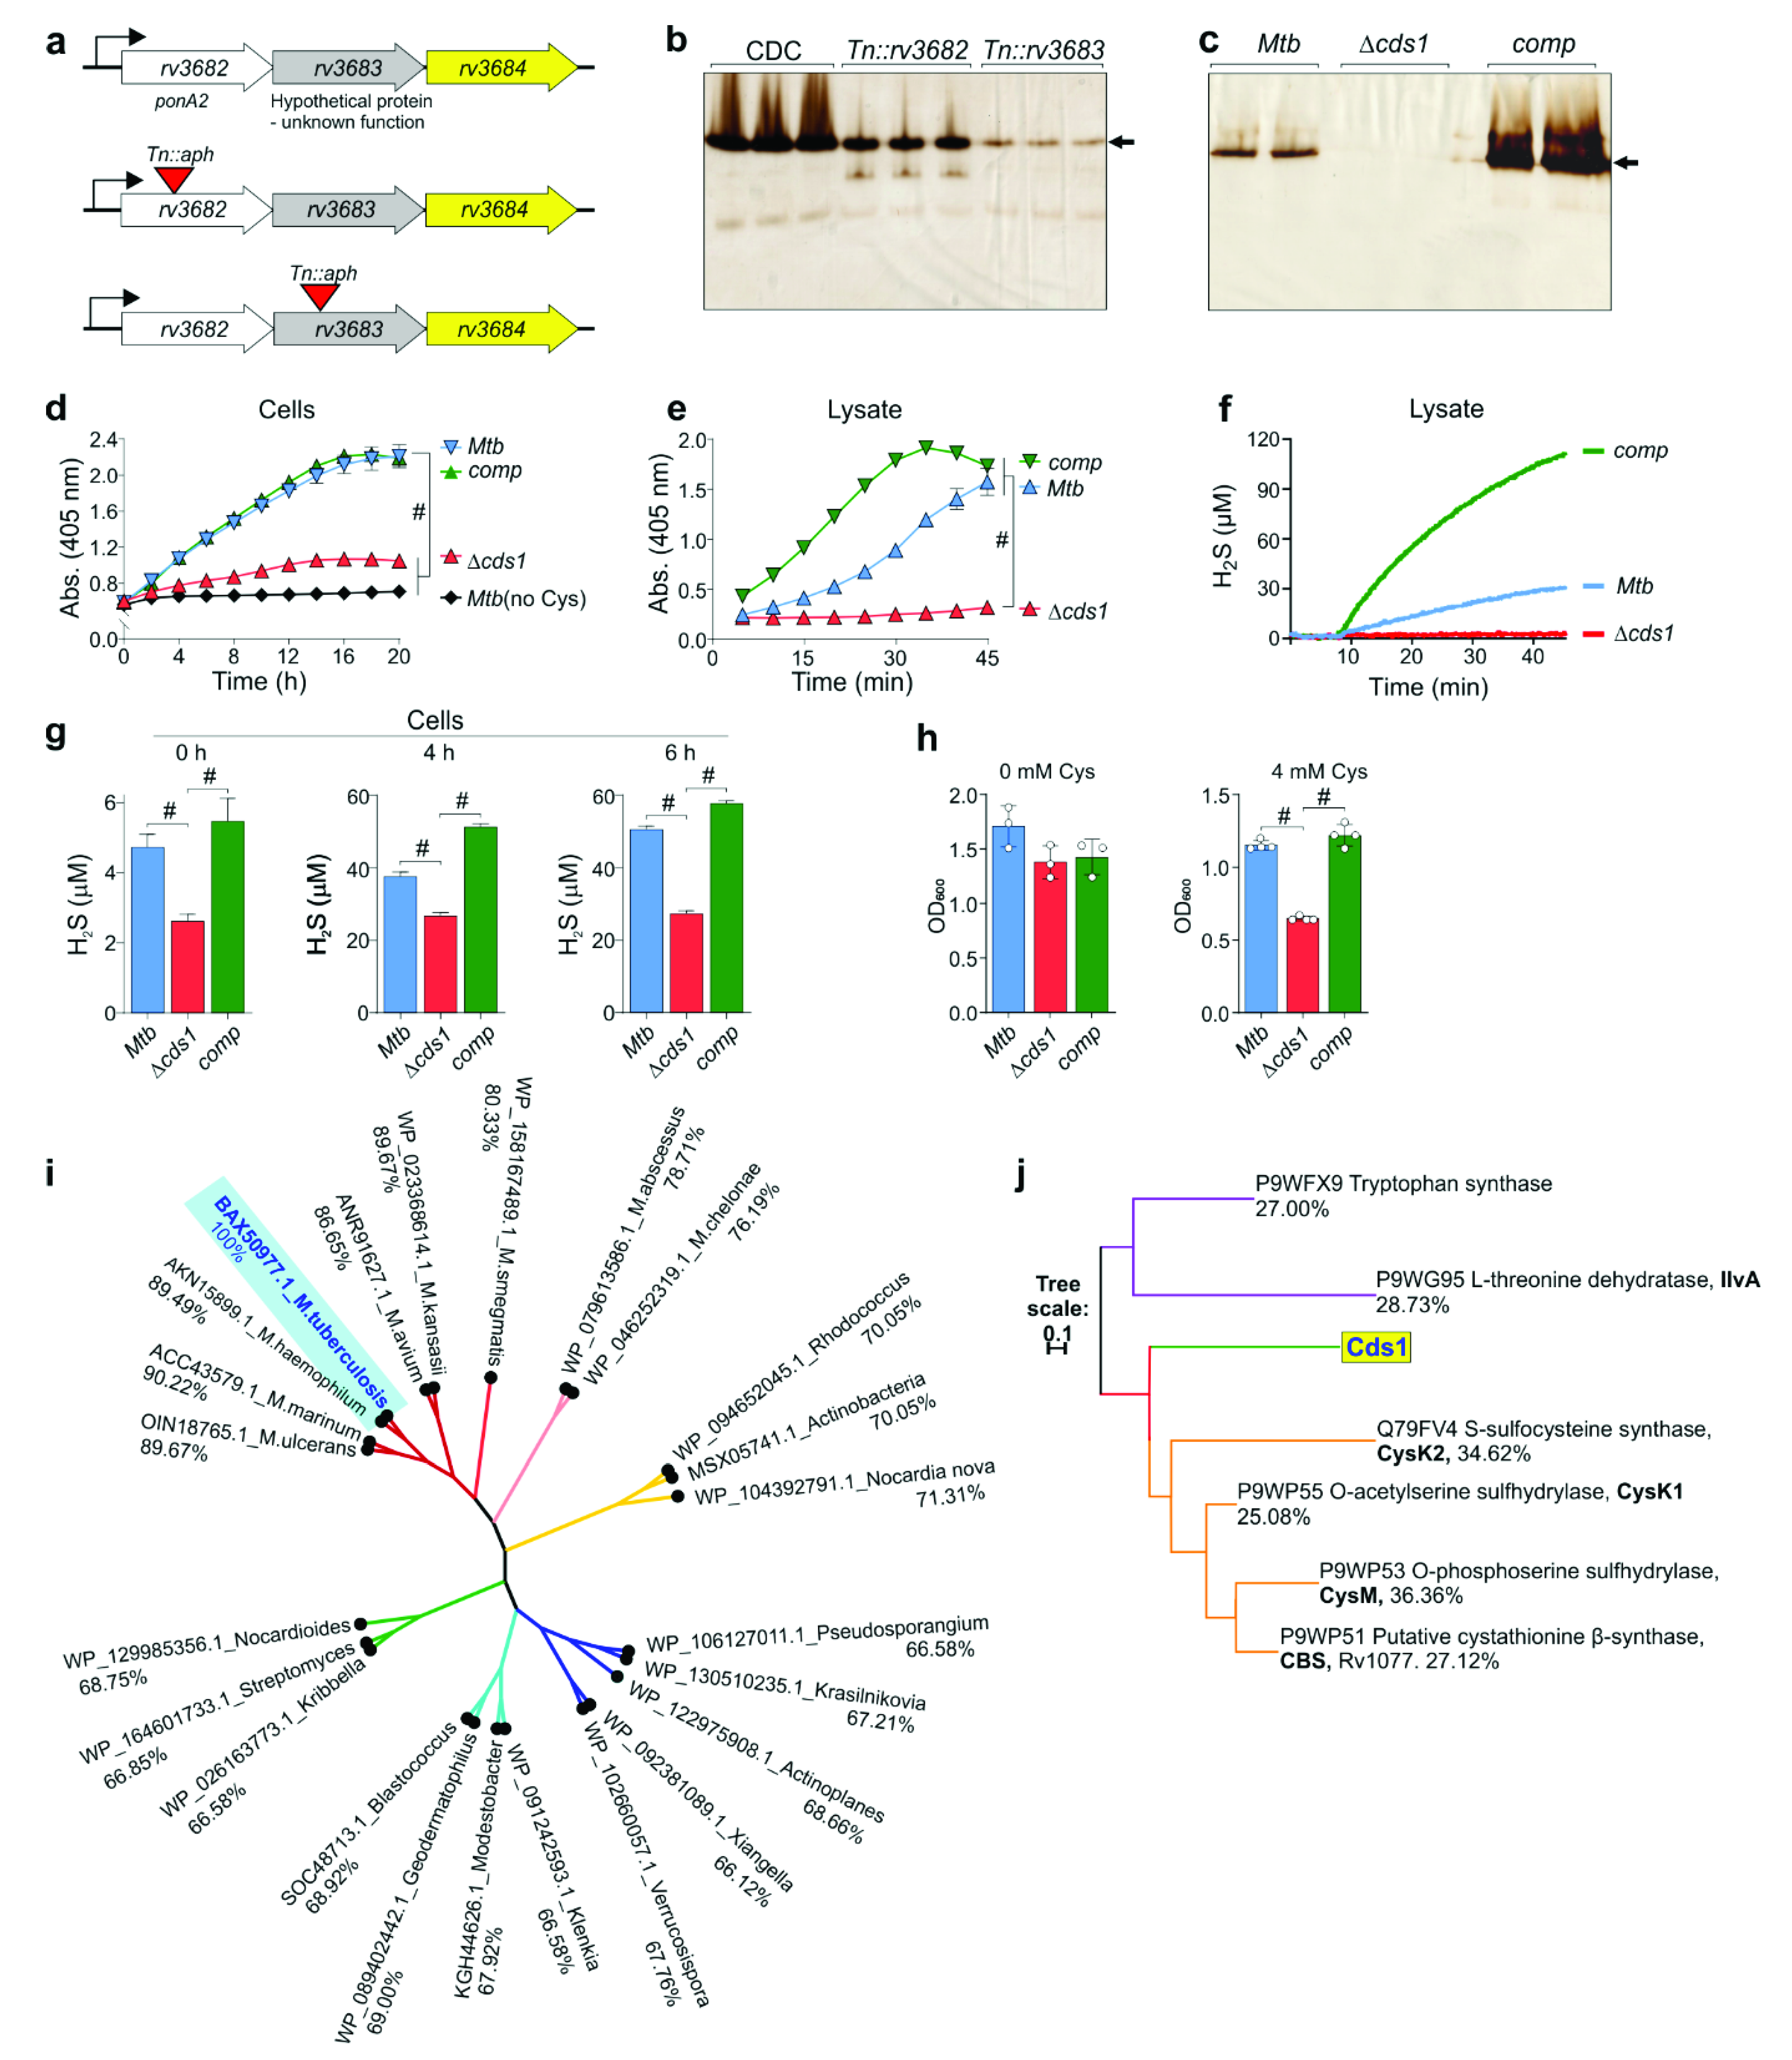
2.13. Construction of Δcds1 and Δrv1077 Mycobacterial Strains

The rv1077 (cbs) and rv3684 (cds1) knockout Mtb strains were generated by homologous recombination using specialized phage transduction according to Badarov, et al. (2002) [35] (see Supplementary Materials, Table S2). The cds1 allelic exchange substrate (AES) phasmid was a kind gift from Michelle Larsson (Albert Einstein College of Medicine). The AES contained cds1 disrupted by the hygromycin resistance gene. Briefly, the AES phasmid was amplified in E. coli DH5α and purified using a DNA Plasmid Miniprep Kit (Thermo). M. smegmatis was then transduced with the AES, and a high titer phage lysate was prepared. Mtb H37Rv was grown to an OD600 of ~0.8 and washed twice with buffer (50 mM Tris-HCl, pH 7.6, 150 mM NaCl, 10 mM MgCl2, 2 mM CaCl2), then mixed with the high titer phage lysate in a 1:1 (CFU:plaque forming units) ratio, and incubated at 37 °C overnight. After centrifugation (16,000× g, 10 min, 4 °C) the pellet was resuspended in 0.2 mL 7H9 media and plated on hygromycin-containing 7H10 agar. After 3 weeks at 37 °C, 5 individual colonies were inoculated in 7H9 media supplemented with 50 µg/mL hygromycin. The genomic DNA of each colony was extracted and gene deletion confirmed using PCR with primers Rv3684CF, Rv3684CR (rv3684) or Rv1077CF, Rv1077CR (rv1077), and UUT (See Supplementary Materials, Table S3).

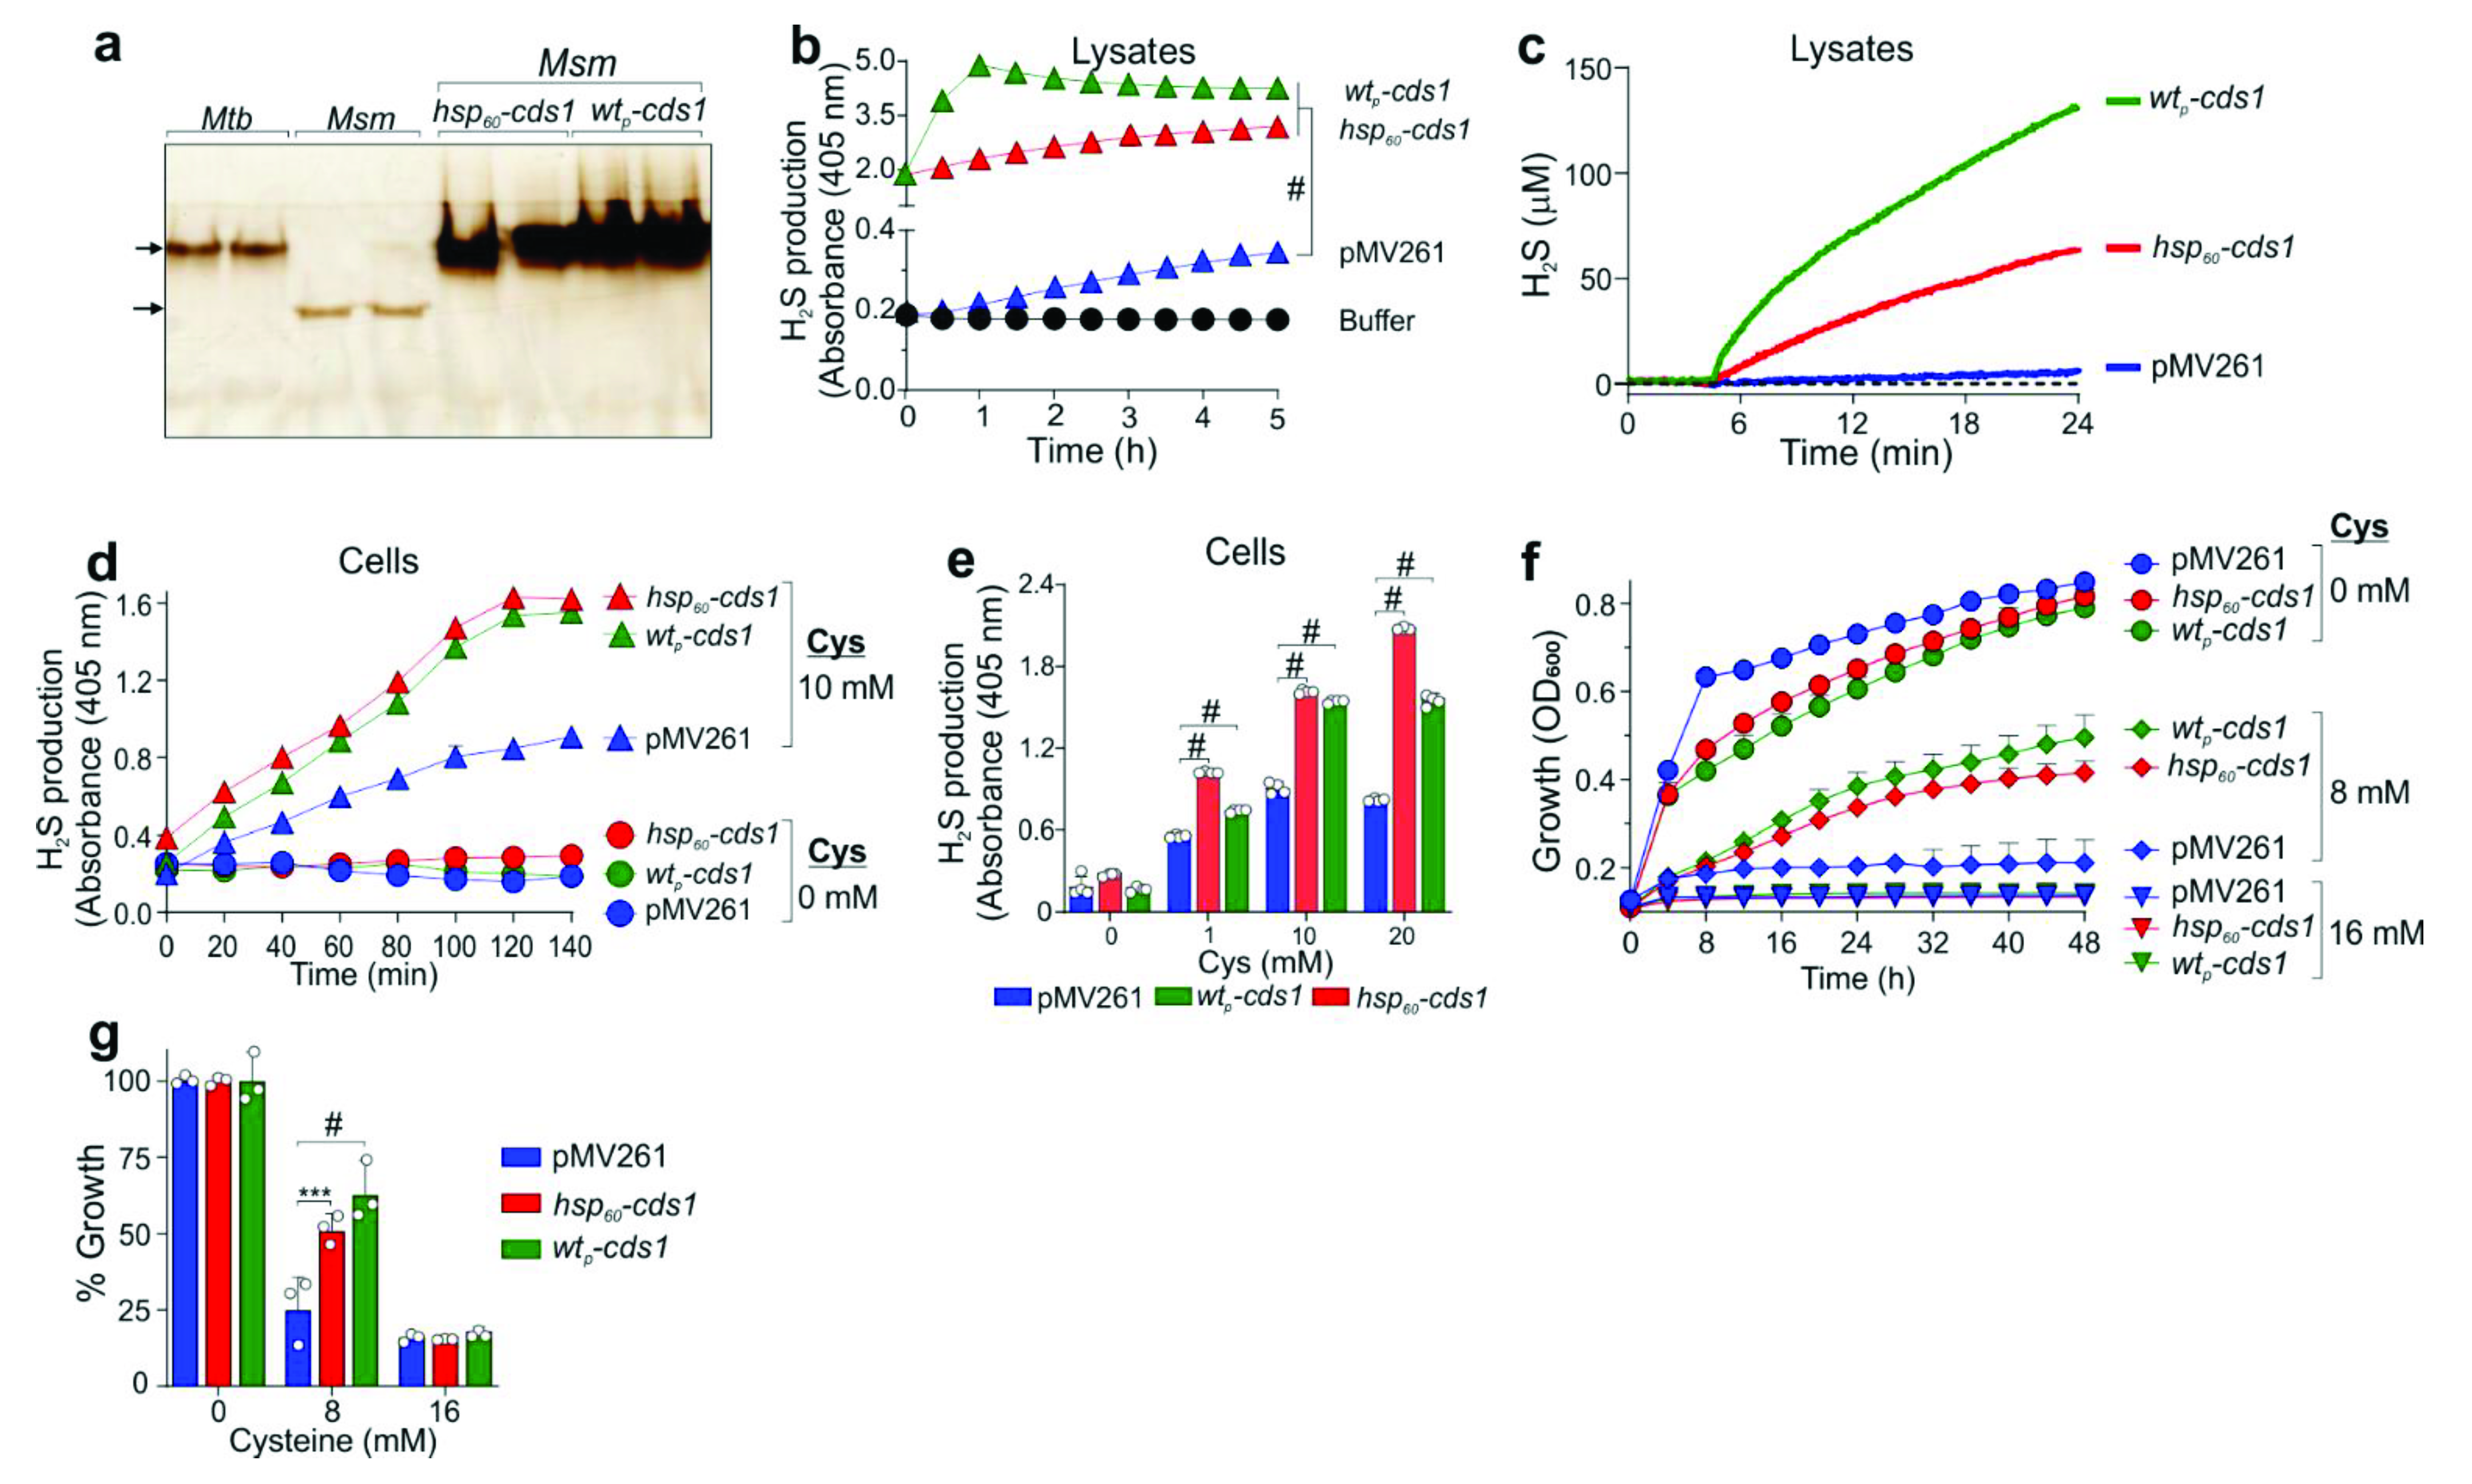
2.14. Mycobacterial Complementation

The cds1 ORF was PCR amplified from genomic Mtb DNA using KOD Xtreme HotStart DNA polymerase (Roche, New York, NY, USA) according to the manufacturer’s protocol and primers (Rv3684F and Rv3684R); see Supplementary Materials Table S3. The PCR product and pMV261 vector were digested with Bam HI and Cla I (Thermo Fisher Scientific, USA), isolated using agarose purification, and ligated using T4 DNA ligase (NEB, USA) to produce pMV261::hsp60-cds1 (see Supplementary Materials, Table S2). A second complementation vector was constructed. The ORF of rv3682, rv3683 and cds1, with an additional 500 bp upstream region, was PCR amplified using primers ponABCF and ponABCR (see Supplementary Materials, Table S3). The amplicon was digested using BamHI and ClaI and ligated into the pMV261 vector. Complementation vectors expressing cds1 under the control of either the hsp60 or native promoter were electroporated (Gene Pulser Xcell, Bio-Rad, USA) into the Mtb Δcds1 strain and transformants selected on 7H10 agar plates containing hygromycin (50 µg/mL) and kanamycin (25 µg/mL). These vectors were similarly electroporated into M. smegmatis. Complemented strains were grown in 7H9 media containing 25 µg/mL kanamycin.

2.15. Purification of Recombinant Proteins

The cds1 1041 bp open reading frame was PCR amplified using Mtb genomic DNA and the primers Rv3684CEF and Rv3684CER (see Supplementary Materials, Table S3). The PCR product was digested with Nde I and Bam HI and then ligated into the pET15b expression vector previously digested with Nde I and Bam HI. These restriction sites are in the pET15b MCS downstream of a 6-His coding region, resulting in the addition of a 6-His tag to the N-terminus of the encoded protein. The ligated construct (i.e., pET15b-cds1) was then verified by sequencing. E. coli BL21 (DE3) cells were transformed with pET15b-cds1 and grown until the OD600 reached 0.5–0.6. Protein expression was induced by the addition of 0.4 mM of IPTG followed by growth overnight at 18 °C. The cells were pelleted by centrifugation at 5000 rpm for 10 min, sonicated, and the lysate used for protein purification using nickel-affinity resin (Bio-Rad, USA) by gravity chromatography. pET28b-EhOASS expressing recombinant OASS containing an N-terminal 6×His tag was overexpressed and purified from E. coli as described previously [36].

2.16. Cds1 Enzyme Kinetics

The rate of H2S production by purified recombinant Cds1 was monitored via formation of Bi2S3, which has an absorbance maximum at 405 nm [32]. Briefly, purified Cds1 enzyme (1 µg of enzyme in 20 µL buffer) and 180 µL of BC solution were mixed in a well of a flat bottom, clear 96-well plate (Corning Inc., USA). Bi2S3 formation was monitored at room temperature over 30 min (readings taken once per minute) using a Biotek Synergy H1 hybrid plate reader. The absorbance at 405 nm was converted into product concentrations using the Beer–Lambert equation. The molar absorption coefficient for Bi2S3 was determined to be 3156.9 M−1 cm−1 using Na2S.9H2O (Sigma–Aldrich, USA) as a standard. Initial velocities were calculated and plotted against Cys concentrations. The Km and Vmax values were determined in GraphPad Prism (version 8.4.3) using the Michaelis–Menten equation. The kcat values were calculated by dividing Vmax by the nanomoles of enzyme used in the reaction.

2.17. Identification of Cds1 Enzymatic Products by LC-MS/MS

Purified Cds1 was added to three separate reaction tubes containing 50 µL of 20 mM L-Cys in PBS (20 mM Na2HPO4, 100 mM NaCl, pH 7.5, and 20 µM PLP), and the reaction was allowed to proceed for 15 min at room temperature. The reactions were stopped by heating to 80 °C for 5 min and the tubes centrifuged at 15,000 rpm for 5 min. Ten microliter aliquots of each reaction solution were taken from the supernatant and analyzed by LC-MS/MS. We then identified the enzymatic products of Cds1 using ultra-high liquid chromatography coupled to high-resolution/high-accuracy mass spectrometry based on the analyte’s exact mass and HPLC retention time compared to authentic metabolite reference standards. A reference standard mixture of important negatively charged metabolites, including pyruvate and the study samples, were analyzed on the Q-Exactive LCMS system, as described elsewhere, using high-resolution molecular ion scans. The RAW files were subjected to post-run analysis using Skyline software along with a template constructed to monitor the relevant analytes. The exact theoretical mass for 12C pyruvate standard is 87.008768 (87.0088) Da. The standard was present in the molecular ion scans with the same mass in the standard mixture when subjected to analysis. The retention time for the pyruvate in the standard mix on the Aminex column (Bio-Rad, USA) used was 11.0 min. In the samples, a peak was observed with the same retention time and exact mass as the pyruvate standard, and this was considered sufficient evidence for verification of identity. Each sample was assayed in triplicate.

2.18. In Vitro CFU Assay

Thioglycollate-elicited peritoneal macrophages were isolated from C57BL/6 mice [23] and were plated at 1.0 × 10⁶ cells per well in 6-well plates. Cells were infected with Mtb strains at an MOI of 0.2 and incubated at 37 °C for 2 h, followed by washing cells twice to remove non-internalized bacilli (day 0 post infection). At 0, 1, 2, and 4 days, cells were lysed with DPBS containing 0.05% SDS, and CFU were determined by plating serial dilutions of lysates on 7H11 agar plates supplemented with 10% OADC. Plates were incubated at 37 °C with 5% CO2 for 4 weeks to determine CFU counts.

2.19. LC-MS/MS Targeted Metabolomics Analyses

Mtb strains in replicate were inoculated from freshly grown culture in 7H9 media (containing 0.01% tyloxapol, 0.2% glycerol, and 10% OADC) with 4 mM cysteine at an OD600 of approximately 0.05. These strains were cultured (~30 mL each) in inkwell bottles to an OD600 of ~0.8 at 37 °C with shaking (150 rpm). Each culture was pelleted by centrifuging at 3500× g for 10 min. The culture supernatant was discarded, and cells were washed three times with 7H9 containing 0.01% tyloxapol. After the last wash, the pelleted cells were resuspended in 5 mL of 7H9 media containing 0.01% tyloxapol, 0.2% glycerol, 10% OAS (oleic acid, bovine albumin, and NaCl), 0.2% [U-13C]-Glucose (Sigma–Aldrich, USA) or 0.01% tyloxapol, 0.2% glycerol, 10% OADS (oleic acid, bovine albumin, dextrose, and NaCl), 100 µM [U-13C]-cysteine (Cambridge Isotope Laboratories Inc., USA), or 7H9 media containing 0.01% tyloxapol, 0.2% glycerol, 10% OAD, and 0.25 mM CHP. After resuspension of the pellet, the cultures were then incubated overnight at 37 °C with shaking (150 rpm) and harvested by centrifugation at 3500× g for 3 min. Cells pellets were immediately snap-frozen on dry-ice for approximately 5 min and then thawed and prepared for lysis using a MagNA Lyser (Roche, USA) at 7000 rpm for 1 min, followed by cooling on ice for 4 min, repeated 3–4 times. The lysis was performed using a 1.8 mL solution of methanol, acetonitrile, and water in the ratio of 2:2:1). The lysate was then centrifuged at 15,000–17,000× g for 10 min. The supernatant was collected and filtered through a 0.22 µm filter. The recovered lysate was then vacuum concentrated to dryness (Eppendorf Concentrator Plus, Eppendorf, Germany) at 30 °C for 12 h. The dried lysate pellets were then resuspended in 200 µL of purified water. 100 µL of this suspension for each replicate was submitted for LC-MS/MS targeted organic acid (metabolites) analysis and 100 µL (50 µL resuspension plus 50 µL acetonitrile) was submitted for LC-MS/MS targeted amino acid analysis.
LC-MS/MS was used for relative quantification of each organic acid and amino acid. The LC-MS/MS sample analysis was performed using a Thermo Scientific DionexTM UltiMateTM 3000 UHPLC system coupled to a Thermo Scientific Q-Exactive Mass Spectrometer with a HESI source. A sample volume of 1 µL was injected onto a Waters Xbridge® BEH HILIC HPLC column (2.5 µm particles, 2.1 × 100 mm), column oven set at 40 °C and chromatographic separation was performed using gradient elution at a flow rate of 200 µL/min and total run time of 26 min. Mobile phase A contained water with 0.1% formic acid and mobile phase B contained acetonitrile with 0.1% formic acid. Data were acquired using full-scan MS (without HCD fragmentation) in positive mode over the m/z range 50–750 Da at a 70,000 resolution. A QC sample was prepared using 21 different amino acids at a concentration of 500 ng/mL to monitor amino acid retention time consistency and MS sensitivity. Each sample was spiked with deuterated alanine (D4-Alanine, Sigma–Aldrich, USA) as an internal standard to monitor processing efficiency and data normalization. The data were processed, and peak areas were calculated using Skyline 3.7 (MacCoss Lab, University of Washington, Seattle, WA, USA).

2.20. Total ATP Quantitation

ATP quantitation was performed on cell lysates prepared for use in our metabolomics analysis (see Section 2.19). ATP levels of cell lysates were measured using a Roche ATP Bioluminescence kit CLS II according to the manufacturer’s instructions. ATP levels were normalized to the protein concentration of each cell lysate.

2.21. Statistics

Unless specified otherwise in Section 2, all experiments were performed on 3–8 biological replicates, and the data were expressed as the mean ± SD or the mean ± SEM. Statistical significance of the data was determined using GraphPad Prism 8.4.3 (GraphPad Software, Inc., USA). Specific statistical tests are noted in the figure legends and include the Student’s unpaired t-test (two-tailed) and one-way or two-way ANOVA.

3. Results

3.1. H2S Production by Mycobacteria

Since H2S can be spontaneously generated by media components [8] and some H2S detection methods are prone to artifacts (e.g., non-specific reaction of lead acetate strips with sulfides [12]), we carefully controlled the experimental conditions under which H2S levels were measured in solution or in a headspace using validated techniques. Three different methods were employed to measure H2S production in mycobacteria: the widely used lead acetate [Pb(Ac)2] method, the bismuth chloride (BiCl3; (BC)) method [32,33], and a highly sensitive amperometric microsensor (Unisense A/S, Denmark) [37].
We first used lead acetate strips to detect the presence of H2S in the headspace of mycobacterial cultures (Figure 1a). This method is based on the reaction of lead acetate with H2S to form lead sulfide (PbS), seen as a dark-colored precipitate on the strip [38]. We assessed the production of H2S in slow-growing laboratory strains (Mtb H37Rv and Mtb CDC1551 (CDC)), clinical strains (drug-sensitive (DS) and multidrug-resistant (MDR)), M. bovis BCG (BCG), M. bovis (Mbov) as well as the fast-growing mycobacterial strain M. smegmatis (Msm), inoculated to the same optical density. Notably, all mycobacteria tested produced H2S (Figure 1a). Since H2S production appears to be growth- and strain-dependent, we quantified lead sulfide formation on Pb(Ac)2 strips and normalized the values to culture density as described previously [31] (Figure 1b). BCG, Mbov, and the DS Mtb clinical strain produced significantly less H2S than the laboratory strains Mtb H37Rv and CDC. Notably, slow-growing pathogenic Mtb strains, particularly the MDR strains, produced the highest levels of H2S, whereas H2S production in Msm was virtually undetectable (Figure 1b).
To verify the results shown in Figure 1a,b, we employed a BC microplate assay to detect H2S in mycobacterial culture media and cell lysates. The BC microplate assay relies on the reaction of BiCl3 with H2S to generate bismuth sulfide (Bi2S3), a brownish black precipitate [32]. Importantly, BC-based H2S measurements are not influenced by cell proliferation, since the high concentrations of EDTA and Cys required for the assay inhibit growth. Furthermore, EDTA prevents the spontaneous generation of H2S from Cys and iron [8]. In the BC assay, we observed that only live Mtb produced H2S and not heat-killed bacilli or media alone (Figure 1c), and that H2S levels positively correlated with the concentrations of Cys present in the growth medium (Figure 1d; Supplementary Materials, Figure S1). Several H2S-producing enzymes use Cys as a substrate and pyridoxal 5-phosphate (PLP) as a co-factor [18,19]. As shown in Figure 1e, addition of PLP significantly increased H2S production in Mtb lysates containing various concentrations of Cys. This suggests that the BC-based method is effective for measuring H2S in culture medium and cell lysates, and that at least one PLP-dependent enzyme is responsible for H2S production in Mtb.
Next, we attempted to characterize the H2S-producing enzymes in Mtb by using specific enzyme inhibitors. Aminooxyacetic acid (AOAA) is an inhibitor of PLP-dependent enzymes, including cystathionine β-synthase (CBS) and cystathionine γ-lyase, whereas DL-propargylglycine (PAG) inhibits only cystathionine γ-lyase (CSE) [39]. Addition of AOAA resulted in a concentration-dependent reduction of H2S in intact cells (Figure 1f) and in lysates (Figure 1g). In contrast, H2S levels were not significantly altered by PAG in either intact cells (Figure 1h) or lysates (Figure 1i). Again, these findings suggest that at least one PLP-dependent enzyme is a major contributor to H2S production in Mtb.
To further support these findings, we used a highly sensitive amperometric H2S microsensor (Unisense, A/S, Denmark) to directly detect H2S. Using this method, we observed that, compared to untreated controls, the addition of 1 mM Cys resulted in a three-fold increase in H2S levels in the media of dispersed Mtb cultures or in the corresponding cleared media containing pelleted cells after 72 h of incubation (Figure 1j). In addition, this microsensor allowed us to monitor H2S production in Mtb lysates using a single Cys concentration (Figure 1k) or increasing Cys concentrations in real time (Figure 1l), supporting our findings shown in Figure 1e. In contrast, when AOAA was pre-incubated with the lysate, no H2S was produced following addition of Cys (Figure 1m), indicating complete inhibition of H2S-producing activity.
In summary, using three different methods, we provide evidence that laboratory and clinical strains of Mtb produce H2S. We showed that this activity is PLP-dependent, is inhibited by AOAA and not PAG, and uses Cys as a sulfur source. An intriguing finding was the significant variation in H2S production among MDR and laboratory strains of Mtb, which is growth- and species-dependent. These findings have important implications for routine culturing of Mtb and improved diagnostics.

3.2. Identification of H2S-Producing Enzymes in Mtb

We searched the Kyoto encyclopedia of genes and genomes (KEGG) database [25] for enzymes encoded by Mtb H37Rv involved in H2S production. We identified 11 enzymes putatively involved in the metabolism of sulfur, sulfur-containing amino acids, and H2S (Supplementary Materials, Table S4). CBS is a well-studied enzyme that produces H2S in mammalian and bacterial cells, and Mtb encodes an ortholog of CBS, Rv1077 [25] (Supplementary Materials, Table S4). To determine the role of Rv1077 in H2S production, we deleted rv1077/cbs in Mtb H37Rv (Δcbs) using specialized phage transduction [35]. Analysis of H2S production in intact Δcbs cells or lysates revealed that H2S production in Δcbs was not reduced compared to wild-type (WT) Mtb (Supplementary Materials, Figure S2a–c).
We then pursued a biochemical approach to identify H2S-producing enzymes in Mtb. In this approach, equal amounts of mycobacterial lysates were resolved on non-denaturing polyacrylamide gels and enzymatic production of H2S was detected by applying the BC assay solution directly to the gel [40]. Figure 2a shows the formation of Bi2S3 resulting from H2S production in various mycobacteria, seen as dark-colored bands of different intensities in the gel. Notably, addition of AOAA prior to the BC assay solution delayed the emergence and reduced the intensity of the major H2S-producing band (Figure 2b), consistent with the reduction in H2S production observed with AOAA in microplate assays (Figure 1f,g). Further, H2S production was markedly increased in the presence of PLP, suggesting that the prominent dark band contained the same enzyme assayed in Figure 1e, where PLP also increased the H2S-producing activity. Moreover, in the absence of PLP, the H2S-producing activity was completely abolished with AOAA (Figure 2b).
We next performed in-gel tryptic digestion of the main H2S-producing band from Mtb (Figure 2c) followed by LC-MS/MS analysis. Several overlapping peptide fragments were identified with high confidence, which identified Rv3684 as the putative H2S-producing enzyme (Figure 2c). Notably, Rv3684 was annotated as belonging to the Cys synthase/cystathionine β-synthase protein family (Mycobrowser.epfl.ch) (Supplementary Materials, Figure S3). Importantly, we noticed an annotation ambiguity regarding the exact open reading frame (ORF) of rv3684. Based on our LC MS/MS data, we found that the actual start codon of the rv3684 ORF overlaps the stop codon of rv3683, and that these ORFs are in different coding frames (Supplementary Materials, Figure S4). On this basis, we conclude that the rv3684 ORF has been incorrectly annotated in Mycobrowser.epfl.ch, resulting in the omission of the first 66 nucleotides.
CBS and CSE can use Cys as a substrate to generate H2S and other products such as serine (CBS) or pyruvate (CSE) (Figure 2d). To characterize the Rv3684 enzymatic activity, Rv3684 was overexpressed in E. coli and purified (Figure 2e). Using Cys as a substrate, we determined that Rv3684 produces H2S and pyruvate, as shown by the in-gel BC assay (Supplementary Materials, Figure S5a) and LC-MS/MS analysis (Figure 2f), indicating this enzyme is functionally distinct from CBS. We next determined the initial velocities of H2S production at increasing Cys concentrations via the BC assay. From these data, we determined the Km of Rv3684 to be 11.26 ± 0.75 mM with a kcat of 78.71 ± 12.72 S−1 (Figure 2g). These data strongly suggest that Rv3684 catalyzes the conversion of Cys to form H2S, pyruvate, and ammonia in an α- and β-elimination reaction analogous to CSE (Figure 2h) [19]. Hence, we designated Rv3684 as a cysteine desulfhydrase enzyme (Cds1).
In sum, we employed a non-denaturing in-gel BC assay that demonstrates the activity of H2S-producing enzymes in mycobacterial lysates and identified Cds1 as an H2S-producing enzyme in Mtb. Identification of the enzymatic products indicates that Cds1 is a cysteine desulfhydrase that generates H2S and pyruvate from Cys.

3.3. Genetic Disruption of rv3684 Reduces H2S Production and Slows Mtb Growth in the Presence of Cys

To characterize the rv3684 (cds1) genetic locus, we used Mtb CDC1551 transposon mutants Tn::rv3682 (ponA2) and Tn::rv3683, positioned upstream of cds1 (Figure 3a). Notably, we observed that these mutants exhibited consecutively reduced H2S production from equal amounts of cell lysate (Figure 3b), confirming that cds1 encodes an H2S-producing enzyme and that this locus is subject to a strong polar effect. Next, we created a cds1 deletion mutant in Mtb H37Rv (Δcds1) using specialized phage transduction [35] (Supplementary Materials, Figure S5b). We observed no Bi2S3 staining indicative of H2S production in Δcds1 lysates in the in-gel BC assay (Figure 3c), and saw significantly reduced H2S production in intact Δcds1 cells (Figure 3d) and lysates (Figure 3e). Genetic complementation of cds1 in Δcds1 cells, MtbΔcds1::hsp60-cds1 (comp), restored H2S production (Figure 3c–e). As shown in Figure 3d, the amount of H2S production in WT Mtb and comp cells were virtually identical. However, H2S production in comp lysates exceeded that of WT Mtb (Figure 3c,e), suggesting that Cys availability is limiting in intact comp cells, and that Cys import likely influences H2S production in Mtb. Of note, H2S production was reduced, but not eliminated in Δcds1 cells (Figure 3d), suggesting the presence of additional H2S-producing enzymes in Mtb. This is consistent with the appearance of a second band in our in-gel BC assay (Figure 2a). In contrast, we observed no H2S production in Δcds1 lysates (Figure 3e). This was not unexpected, since H2S-producing enzymes may require specific substrates, cofactors (e.g., NADPH, NADH, and heme) and may be influenced by environmental conditions (e.g., oxygen) [41]. H2S production was further confirmed in cellular lysates (Figure 3f) and whole cells (Figure 4g) of each strain using the Unisense amperometric microsensor.
Since exogenous and host-derived H2S supports Mtb bioenergetics and growth [22], we determined the consequence of cds1 deletion on Mtb growth in medium containing Cys, a major source of sulfur and a substrate of Cds1 for H2S production. Compared to WT and comp cells, Δcds1 cells exhibited a significant growth defect in the presence of 4 mM Cys (Figure 3h). This finding is analogous to studies in E. coli, where disruption of D-cysteine desulfhydrase activity renders the bacteria susceptible to D-cysteine [42]. This suggests that Cds1 can mitigate toxic levels of Cys by converting excess Cys into H2S.
We investigated the role of cds1 in Mtb survival during macrophage infection (Supplementary Materials, Figure S6) and observed no significant difference in bacterial burden between WT Mtb and Δcds1 cells. This was not unexpected, as Mtb encodes multiple enzymes that may produce H2S (Supplementary Materials, Table S4), and conclusive demonstration of a role for H2S in pathogenesis may require genetic disruption of multiple H2S-producing genes and assessment in an in vivo model for TB. Since Mtb relies on lipid catabolism in vivo [43], we also investigated whether the growth of Δcds1 cells was influenced by utilization of fatty acids as a sole carbon source. Medium containing glycerol as the carbon source showed optimal growth for all Mtb strains, and no significant growth differences were observed between WT Mtb and Δcds1 cells in the presence of other fatty acids as the sole carbon source (Supplementary Materials, Figure S7). In contrast, H2S production by Δcds1 cells was significantly reduced compared to WT or comp cells in all media containing fatty acids as the sole carbon sources (Supplementary Materials, Figure S8). Notably, H2S production by Δcds1 cells was prolonged in media containing acetate, propionate or butyrate compared to glycerol and cholesterol-containing media.
Bioinformatic analyses showed that a homolog of Cds1 with >76% identity is present in all mycobacterial species (Figure 3i). Phylogenetic analysis revealed that orthologs are also present in bacteria other than Mycobacterium spp. (Figure 3i) (e.g., Pseudosporangium, Streptomyces, and Rhodococcus spp.). Further phylogenetic analyses of other sulfur metabolizing enzymes in mycobacteria demonstrate that sulfur metabolizing enzymes, such as CysK2, CysM, and CBS, show substantial similarities to Cds1 (Figure 3j). Of note was the similarity between Cds1, which converts Cys to H2S, and CysK1 which utilizes H2S as a substrate to form Cys [44].
In summary, using a series of biochemical and genetic approaches, we demonstrated that Mtb produces H2S primarily through Cds1. We functionally complemented Δcds1 cells and show that genes upstream of cds1 exert a strong polar effect on Cds1 levels, suggesting that cds1 is in an operon with rv3682 (ponA2) and rv3683. Lastly, we show that Cds1 is conserved in virtually all mycobacterial species with orthologs present in numerous other bacteria.

3.4. Conferring Increased H2S-Generating Activity to M. smegmatis

Msm has been widely used as a fast-growing surrogate for Mtb in numerous genetic and secretion studies [45]. Further, we observed that Msm produced very little H2S in our Pb(Ac)2 assay (Figure 1a,b). We reasoned that heterologous expression of cds1 in Msm would allow the rapid study of how endogenous H2S affects mycobacterial physiology. To this end, we transformed Msm with plasmids that express cds1 under control of the hsp60 promoter (Msm–hsp60cds1), or the Mtb wild-type (“native”; wtp) promoter (Msm–wtpcds1) (see Supplementary Materials, Table S2). Msm–hsp60cds1 and Msm–wtpcds1 lysates generated Bi2S3 bands with a migration pattern similar to that in Mtb lysates. However, Bi2S3 formation substantially increased compared to WT Mtb, likely due to the fact of cds1 overexpression from multi-copy expression plasmids (Figure 4a). We also observed a Bi2S3 band in WT Msm lysates, indicating the presence of an endogenously expressed H2S-producing enzyme with migration properties distinct from Mtb Cds1. This Msm H2S-producing band was not observed in Msm–hsp60cds1 or Msm–wtpcds1 lysates, possibly due to the altered transcriptional or post-transcriptional regulation in the presence of overexpressed Cds1. H2S production in Msm–wtpcds1 and the Msm–hsp60cds1 lysates using the BC assay (Figure 4b) or the Unisense microsensor (Figure 4c) was more rapid and robust than in Msm containing the empty vector (Msm-pMV261), suggesting overproduction of Cds1 as observed in Figure 4a.
However, H2S production in intact Cds1-producing Msm cells measured over time (Figure 4d) or at an endpoint (Figure 4e) was markedly lower than in the corresponding lysates (Figure 4b,c), suggesting that the lower H2S levels observed in Msm cells may be due to the limitations in Cys transport.
We next examined the impact of overexpressed cds1 on the growth of Msm cultured in media containing Cys (0, 8, and 16 mM). Msm–hsp60–cds1 and Msm–wtp–cds1 maintained a significant growth advantage over control Msm-pMV261 after 48 h in medium containing 8 mM Cys (Figure 4f,g). These results suggest that Cds1 confers resistance to Cys-induced toxicity in Msm by converting excess Cys into H2S. Hence, our data suggest that due to its low capacity for H2S production, Msm can be used as an effective surrogate for studying the effect of H2S on mycobacterial physiology.

3.5. Endogenous H2S Stimulates Respiration in Mtb

Several studies have shown that H2S can inhibit or stimulate mammalian respiration in a concentration-dependent manner [20,21]. Similarly, a recent study has shown that exogenous H2S can stimulate Mtb cellular respiration [22]. On the other hand, biochemical studies have shown that H2S inhibits purified E. coli cytochrome bc1/aa3 [22,46] and that cytochrome bd oxidase is resistant to inhibition by H2S [36,47]. Hence, we hypothesized that endogenous H2S produced by Cds1 can modulate Mtb respiration. To test this hypothesis, we used extracellular metabolic flux analysis, a methodology developed for eukaryotic cells which we optimized for real-time, quantitative study of Mtb respiration [22,34].
First, we measured the basal oxygen consumption rate (OCR) of Δcds1, which was ~40% lower than the basal rate in WT or comp (Figure 5a). Of note, a reduction in respiration of this magnitude is highly significant in bioenergetic terms and suggests that endogenous H2S stimulates Mtb respiration. Next, we sought to determine whether Cds1-generated H2S acts as an effector to directly modulate basal respiration in Mtb. Several lines of evidence indicate that this is the case. Firstly, addition of L-Cys leads to increased respiration in Mtb in a concentration-dependent manner (Figure 5b), whereas the OCR of Δcds1 cells is unchanged by the addition of 4 mM Cys, in contrast to WT and comp (Figure 5c). Secondly, deletion of cbs (rv1077) in Mtbcbs) did not significantly reduce the OCR compared to WT cells in the presence of 4 mM Cys (Supplementary Materials, Figure S9). Thirdly, addition of AOAA, an inhibitor of PLP-dependent enzymes, such as Cds1, eliminated the Cys-stimulated increase in OCR in WT Mtb (Figure 5d). Likewise, addition of AOAA followed by Cys decreased respiration in Mtb cells (Supplementary Materials, Figure S10A), which was attributed to the inhibition of Cds1 and other PLP-dependent enzymes by AOAA. Importantly, AOAA alone has no significant effect on respiration in the absence of Cys (Supplementary Materials, Figure S10B). Taken together, these data suggest that Cds1-generated H2S is important for maintaining basal respiration in Mtb.
To further confirm that H2S is the endogenous effector molecule modulating Mtb respiration, we exposed Δcds1 cells to exogenous H2S and observed reversal of the respiratory defect in these cells (Supplementary Materials, Figure S11). Next, we used an H2S-degrading enzyme, O-acetylserine sulfhydrylase [44] (OASS), in our bioenergetic assays (Supplementary Materials, Figure S12). Using H2S and O-acetylserine (OAS) as substrates, OASS catalyzes a β-replacement reaction to produce Cys and acetate. Enzymatic activity of OASS was confirmed by monitoring a reduction in H2S concentration using the Unisense microsensor (Figure 5e). Sequential addition of NaHS increased H2S levels, whereas injection of purified OASS caused a rapid decrease in H2S levels after addition of the substrate, OAS (Figure 5e). On this basis, we posited that addition of OASS and its substrate OAS would deplete H2S produced by Mtb, resulting in a sustained or reduced OCR. Indeed, as shown in Figure 5f, our data suggest that addition of OAS and purified OASS to wells containing Mtb prevents the Cys-mediated increase in OCR via degradation of Mtb-generated H2S by OASS activity. Although a product of the OASS reaction is Cys, which can re-enter the cell as a substrate for H2S production, Cys transport across the membrane is rate-limiting. Hence, exogenous OASS depletes H2S faster than Cys can be transported into the cytoplasm and used for H2S production. Overall, OASS and OAS significantly reduced H2S in our experimental system. Lastly, cytoplasmic H2S may also be consumed by Mtb CysK1 using exogenous OAS as a substrate [44]. Indeed, addition of OAS and Cys to Mtb cells significantly reduced OCR compared to Mtb cells treated with Cys alone, suggesting CysK1 can consume excess H2S depending on intracellular levels of OAS (Figure 5g) and led to the model in Figure 5h.
We next examined the mechanism whereby H2S stimulates Mtb respiration. In a previous study [22], our findings in M. smegmatis and Mtb implicated cytochrome bc1/aa3 and cytochrome bd (CytBD) in enhancing respiration when exposed to H2S, primarily because the Mtb electron transport chain (ETC) can rapidly reroute electrons to either of these oxidases (Figure 5i). To investigate whether Cys-generated H2S regulates respiration through cytochrome bc1/aa3 and/or CytBD, we examined ΔcydAB cells (genetic knockout of Mtb cytBD) in the presence of Cys and the cytochrome bc1/aa3 inhibitor Q203. Hence, the ΔcydAB strain of Mtb produces only a functional cytochrome bc1/aa3 [48], and cellular respiration can be fully inhibited by Q203 [34]. Intriguingly, both WT Mtb (Figure 5j) and ΔcydAB cells (Figure 5k) show increased respiration when exposed to Cys, suggesting that H2S stimulates Mtb respiration via cytochrome bc1/aa3 oxidase. However, Mtb cells treated with the cytochrome bc1/aa3 oxidase inhibitor, Q203, and Cys showed a more profound increase in respiration (OCR% ~330; Figure 5l) compared to ΔcydAB cells (OCR% ~145; Figure 5k) at 1 mM Cys. This suggests that Cys-generated H2S stimulates Mtb respiration more strongly through cytochrome bd compared to cytochrome bc1/aa3 oxidase. As expected, respiration was dramatically reduced when ΔcydAB cells were exposed to Q203 alone or Q203 and Cys (Figure 5m). While recognizing that the precise mechanism whereby H2S stimulates Mtb respiration is complex, these data provide strong evidence that Cds1 uses Cys as a source of sulfur to produce H2S, which modulates Mtb respiration predominantly via CytBD.

3.6. Mtb H2S Regulates Sulfur Metabolism

Our data demonstrate that Cds1 is a cysteine desulfhydrase that generates H2S from Cys (Figure 2f). Hence, Cds1 may serve to eliminate toxic levels of Cys, which can induce oxidative stress via the Fenton reaction [9,49]. Not surprisingly, Cys can be rapidly oxidized to cystine (the disulfide form of Cys; Cysox) [50]. Overall, the enzymatic properties of Cds1 are consistent with our data showing that Δcds1 cells exhibit reduced growth in medium containing toxic concentrations of Cys (Figure 3f). To test the hypothesis that Cds1-generated H2S regulates cellular sulfur metabolism, we performed carbon tracing experiments using [U-13C]-Cys (100 µM in 7H9 medium; capable of inducing H2S production [Supplementary Material, Figure S1]), to track the fate and incorporation of Cys carbons into metabolites. We subsequently examined metabolite abundance and the carbon isotopologue distribution (CID) of targeted sulfur metabolites (Figure 6a–g) in WT Mtb, Δcds1, and comp cells.
We observed an overall increase in the abundance of sulfur pathway metabolites cystathionine (Cth), O-succinyl homoserine (OSH), homoserine (Hse), homocysteine (Hcy), Met, Cys, and Cysox in Δcds1 cells (Figure 6a–g). A likely explanation for the build-up of these sulfur metabolites is that sulfur atoms cannot be dissipated via Cds1-mediated release of H2S, thereby generating back pressure and a subsequent metabolite build up. Exogenous [U-13C]-Cys rapidly converted into Cysox, which accumulated significantly more in Δcds1 cells (Figure 6a) compared to the controls due to the lack of Cds1 activity and a subsequently impaired capacity to recycle sulfur atoms via CysK1 and O-acetyl serine (OAS) back to Cys (Figure 6b). In Δcds1 cells, most of the carbons in Cys were unlabeled (Figure 6b), which suggests that most carbons for de novo synthesis of Cys originated from glucose or glycerol, leading to a small but significant increase in unlabeled Cys. Lastly, the significant changes in CID of M + 5 and M + 6 species in the OSH metabolite pool and increased abundance of Cth (Figure 6c), OSH (Figure 6d), and Hse (Figure 6e) are indicative of reduced flux of [U-13C]-Cys carbons in the sulfur pathway leading to the subsequent buildup in Δcds1 cells. Notably, Hcy was almost completely labeled, pointing to the importance of this metabolite in the Cys–Cth conversion step and anabolism of Hcy via MetC (Figure 6g).
To complement our [U-13C]-Cys results, in an independent experiment, we used [U-13C]-glucose as the carbon tracer. The rationale for using labeled glucose is twofold; firstly, unlike [U-13C]-Cys, this approach allowed us to trace the incorporation of glucose-derived carbons into sulfur metabolites. Secondly, it allowed us to trace the incorporation of glucose carbons into de novo-synthesized Cys, which is a substrate for H2S production in the absence of an exogenous substrate. Importantly, similar to our [U-13C]-Cys results (Figure 6a–g), we also observed an accumulation of sulfur pathway metabolites (e.g., Cys, Cth, OSH, Hse, and Met) in Δcds1 cells compared to WT and comp (Figure 6h–m). Hence, the [U-13C]-glucose tracing data complement our Cys carbon tracing data (Figure 6a–g), as they show that de novo synthesis of Cys is required for H2S production, which is not possible to demonstrate using [U-13C]-Cys, since it is a substrate for H2S production (Supplementary Materials, Figure S1).
Intriguingly, all Cys carbons were unlabeled, and Cys showed increased abundance in Δcds1 cells (Figure 6i), suggesting that >50% of Cysox carbons originated from glucose, whereas most of the Cys carbons originated from glycerol when cultured in 7H9 medium containing [U-13C]-glucose and glycerol. Increased accumulation of Hse was noted in Δcds1 cells despite reduced flux, which was evident by an increase in CID of M + 0 species and decreases in CID of M + 1, M + 2, and M + 3 species (Figure 6l).
In summary, these data demonstrate that Cds1 is important for maintaining homeostatic levels of sulfur pathway metabolites through the production of H2S, which allows recycling of sulfur atoms back to Cys and metabolites in the sulfur pathway. Lack of Cds1 activity triggers metabolic dysregulation of key sulfur pathway metabolites as is evident by the corresponding build-up of Cys, Cysox, Cth, OSH, Hse, Hcy, and Met. Hence, our data suggest that Cds1-generated H2S functions as a sink to maintain sulfur homeostasis.

3.7. Mtb H2S Regulates Central Metabolism

There is a surprising lack of targeted metabolomic studies of sulfur metabolism in bacteria, as we could identify only two such studies [51,52]. Both studies reported that different sulfur fuel sources affect glycolysis, the TCA cycle, amino acid levels, and redox couples such as glutathione and MSH. Since we have shown that Cds1/H2S modulates growth (Figure 3f) and respiration (Figure 5c,g), which is tightly linked to metabolism, we tested the hypothesis that Cds1-generated H2S modulates Mtb central metabolism. To test this hypothesis, we cultured WT Mtb, Δcds1, and comp cells in 7H9 medium containing [U-13C]-Cys and examined metabolites in glycolysis, the pentose phosphate pathway (PPP), TCA cycle, and all amino acids (Figure 7). A striking observation was the significant increase in most amino acids (Figure 7a), glycolytic metabolites, PPP metabolites (6-phosphogluconate (6PG) and ribulose-5-phosphate (R5P)), and TCA intermediates in Δcds1 cells compared to WT and comp cells (Figure 7b), which strongly suggests that H2S plays a key role in modulating central metabolism. Importantly, we observed a similar, and significant increase in amino acids in Δcds1 cells compared to WT and comp cells using [U-13C]-glucose as the carbon tracer (Supplementary Materials, Figure S13). This was not entirely unanticipated as endogenous (Figure 5g) and exogenous H2S regulate respiration (OXPHOS) in Mtb [22]. Also, H2S directly targets enzymes in the glycolytic pathway through persulfidation to modulate their activity [53,54] and was shown to suppress glycolysis in Mtb-infected macrophages [23]. The overall reduced labeling of amino acids and glycolysis/TCA cycle metabolites in Δcds1 cells is consistent with the concept that these metabolites obtain their carbons mainly from glucose or glycerol and not Cys. We observed a similar accumulation of sulfur pathway metabolites. On the other hand, F16BP and PEP were substantially labeled (~50%) in all three strains, which are the product and substrate of the first and last rate-limiting steps in glycolysis, respectively. This points to phosphofructokinase-1 (Pfk1) and pyruvate kinase (PykA) as important rate-limiting flux control points for the metabolism of Cys carbons into central metabolism. Further, to ascertain whether increased glycolytic and TCA metabolites translate into changes in ATP levels, we quantified ATP in cells with or without Cys (100 μM). As shown in Figure 7c, ATP levels were significantly increased in Δcds1 cells cultured with Cys, whereas no differences in ATP levels were observed in the absence of Cys.
In summary, our targeted metabolomics data demonstrate that Cds1-generated H2S suppresses the central metabolism, which is evident by increased levels of glycolytic and TCA cycle metabolites and amino acids in Δcds1 cells. In addition, the reduction in H2S levels in Δcds1 cells, which is associated with decreased respiration (OXPHOS) (Figure 5a), triggers a compensatory glycolytic response to maintain bioenergetic homeostasis as was evident by increased ATP levels in Δcds1 cells. Collectively, our data demonstrate that endogenous H2S functions as a modulator of the balance between OXPHOS and glycolysis in Mtb.

3.8. Endogenous H2S Exacerbates Oxidative Stress and Regulates Intracellular Redox Homeostasis

Several studies have reported a role for H2S in the modulation of redox homeostasis [55,56,57]. In E. coli, endogenously produced H2S maintains redox homeostasis by rendering E. coli resistant to oxidative stress [14]. Hence, we tested the hypothesis that Cds1-generated H2S modulates redox homeostasis in Mtb by measuring the abundance and flux of the two major redox couples EGT and MSH via metabolomics and by quantifying reactive oxygen intermediates (ROI) by flow cytometry [22]. Since catalase is present in standard 7H9 growth medium to protect cells against toxic peroxides and promote growth, we examined the levels of ROI in Mtb cells (Supplementary Materials, Figure S14) in the presence and absence of catalase. In medium containing catalase, we observed ~43% more ROI-positive Δcds1 bacilli compared to WT and comp (Figure 8a), suggesting that in WT Mtb, H2S may function as an antioxidant as has been reported in mammalian cells [18]. In the absence of catalase, the percentage of ROI-positive cells increased by 4–10-fold in all strains compared to cells in the presence of catalase (Figure 8a). Of note, ~25% fewer Δcds1 bacilli were ROI-positive compared to WT or comp cells, suggesting that H2S functions as a pro-oxidant under these conditions.
Next, since Cys is a sulfur-containing precursor of MSH and EGT, we examined the abundance and CID of these redox couples in Δcds1 cells cultured in 7H9 medium containing [U-13C]-glucose (Figure 8b). Intriguingly, EGT and MSH levels were reduced in Δcds1 cells. Further, the increase in the CID of M + 1, M + 2, M + 3, M + 4, and M + 1 and M + 2 species in EGT and MSH, respectively, suggests increased carbon scrambling and reduced flux of carbons in response to the failure to recycle H2S back to Cys in Δcds1 cells. This agrees with the lack of increase in fully labeled species of EGT (M + 9) and MSH (M + 17). Therefore, our data demonstrate that H2S is necessary for maintaining homeostatic levels of MSH and EGT and, thus, redox balance. To further examine the role of H2S in Mtb redox homeostasis, we exposed Mtb to the oxidant cumene hydroperoxide (CHP) without catalase and monitored ROI production and cell viability. After 16 h of exposure to 0.25 mM CHP, Δcds1 cells had significantly fewer ROI-positive cells (Figure 8c) with increased survival (Figure 8d) compared to WT and comp cells. Notably, we observed no significant differences in the abundance of MSH or EGT between WT, comp, and Δcds1 cells after exposure to CHP (Supplementary Materials, Figure S15).
Collectively, these data show that H2S can function either as a pro-oxidant or antioxidant depending on the experimental conditions. Further, the survival data indicate that reduced homeostatic levels of H2S promote survival during oxidative stress in the absence of catalase. Hence, under oxidative stress conditions, endogenously produced H2S in Mtb functions as a pro-oxidant. Lastly, our data demonstrate that Cds1-generated H2S modulates the levels of the major redox couples, EGT and MSH.

3.9. Endogenous H2S Increases Mtb Susceptibility to Clofazimine (CFZ) and Rifampicin (RIF)

H2S has been shown to alter antibiotic susceptibility in several bacterial pathogens including E. coli, Bacillus anthracis, Pseudomonas aeruginosa, and Staphylococcus aureus [14,15]. Hence, understanding the impact of endogenous H2S on Mtb drug susceptibility may have clinical implications. We posited that Cds1-generated H2S modulates susceptibility to the anti-TB drug clofazimine (CFZ), a known ROI generator [34]. After 24 h of CFZ exposure at 60× MIC, ~30% fewer Δcds1 cells were ROI-positive compared to WT or comp cells (Figure 8e). Further, we observed significantly increased CFU-based survival of Δcds1 versus WT control cells after 8 days of CFZ exposure (Figure 8f). These differences in survival between Δcds1 and WT and comp strains exposed to CFZ were significant, albeit modest, which may be due to the fact that H2S production was reduced but not eliminated in Δcds1 cells (Figure 3d). Hence, genetic knockout of multiple genes involved in H2S biosynthesis may further decrease Mtb sensitivity to CFZ. Regardless, these CFZ-exposure data indicate that endogenous H2S increases ROI in WT Mtb that contributes to CFZ susceptibility.
Exogenous H2S has been shown to modulate antibiotic susceptibility in a range of bacterial pathogens [14,15,18,55]. To determine whether exogenous H2S plays a role in Mtb drug susceptibility, CFZ-treated Mtb cells were exposed to H2S via addition of NaHS. Exogenous H2S significantly reduced survival of CFZ-treated Mtb cells (Figure 8g,h). Likewise, Mtb cells treated with rifampicin (RIF) or isoniazid (INH) for five days were exposed to exogenous H2S. As shown in (Figure 8i), H2S significantly increased susceptibility to RIF but not to INH. In summary, these data suggest that H2S increases Mtb susceptibility to CFZ and RIF through its function as a pro-oxidant.

4. Discussion

This study elucidated several previously unrecognized physiological features of Mtb. Using three different methods, we showed that laboratory and MDR and DS clinical Mtb strains produced H2S as do non-pathogenic slow- and fast-growing mycobacterial strains. We then identified the genetic locus cds1 (rv3684) and confirmed that the gene product, Cds1, is a PLP-dependent H2S-producing enzyme. Importantly, we demonstrated that endogenous H2S can influence Mtb bioenergetics by enhancing respiration, primarily via CytBD, and by modulating the balance between respiration (OXPHOS) and glycolysis. Further, we described a plausible mechanism by which Mtb mitigates oxidative stress by converting excess Cys into H2S, which is released and then recycled. Our findings point to a paradigm whereby Mtb-generated H2S, together with host-generated H2S, exacerbates TB disease by dysregulating host immunity [23]. Lastly, since H2S production by Mtb has been an overlooked confounder in routine culturing of Mtb, we anticipate our findings to have a broad practical impact in the TB field.
Since the discovery of Mtb by Robert Koch in 1882, formal proof that Mtb produces H2S has been lacking. One likely reason is that since Mtb is highly contagious and spread through aerosols, smelling of cultures is a significant health risk and extreme measures are taken to avoid inhalation. Nonetheless, several biochemical studies [26,27,28,29,30] as well as homologues of H2S-producing enzymes in the Mtb genome have provided strong circumstantial evidence that Mtb is a likely producer of H2S. Furthermore, complicating factors are that H2S is a difficult molecule to study because measuring it is complex [6] and H2S can be spontaneously generated from media components [8]. Hence, we employed multiple approaches to provide compelling evidence that Mtb produces H2S.
Our findings that two clinical MDR Mtb strains produced the highest levels of H2S, followed by laboratory strains and clinical DS strains, have considerable clinical importance for several reasons. Firstly, many clinical MDR and XDR Mtb strains are notoriously difficult to culture due to extremely slow growth. Since high concentrations of H2S inhibit respiration [20,58], it is not unreasonable to propose that excessive H2S production contributes to the slow growth of many of these strains, even when cultured in the absence of Cys. Secondly, our findings that endogenous levels of H2S suppress central metabolism suggest that excessively high levels of H2S produced by MDR Mtb strains could reprogram metabolism by shifting the balance between OXPHOS and glycolysis, ultimately leading to an energetically impaired state that inhibits growth. Thirdly, the large variation in H2S production among clinical strains likely reflects functional differences that are due to the fact of SNPs or genomic rearrangements that contribute to strain-specific transcriptional regulation. Lastly, since H2S is widely used as a diagnostic test for bacteria, there is potential for the development of H2S-based diagnostics for Mtb, e.g., detection of H2S in the exhaled breath or sputum of TB patients.
How do these findings contribute to a more accurate understanding of Mtb physiology and pathogenesis? In two recent studies, it was shown that host-derived H2S exacerbates Mtb disease in the mouse model of TB [22,23] and that CSE and 3MST protein levels are markedly increased in human TB lesions that surround necrotic granulomas and cavities [23]. Hence, it was proposed that because of the strong immunomodulatory activity of H2S, excessive host H2S production triggered by Mtb infection dysregulates immunity to promote disease [23]. Considering the findings in this study, we posit that Mtb-generated H2S may act as a signaling molecule in the host, further contributing to excessive H2S levels in vivo to exacerbate disease. This is possible since Cys concentrations range from ~128–250 μM in human cells and plasma [59,60]. Although a role for Mtb cds1 in TB disease has not yet been reported, our genetic knockout (Figure 3d) and other data (Supplementary Materials, Table S4) indicate that more than one enzyme contributes to H2S production in Mtb. Therefore, multiple gene knockouts may be necessary to convincingly demonstrate a role for endogenously-produced H2S in TB disease.
Discovery of a gene responsible for H2S production in Mtb cells establishes a paradigm for how H2S modulates Mtb physiology. While homologues of CBS and CSE are encoded in the Mtb genome, these proteins were not identified in our non-denaturing in-gel BC assays. However, this could be explained by the fact that the conditions of our in-gel BC assay were suboptimal for certain enzymes, and that alterations in environmental factors (substrate, pH, temperature, oxygen, etc.) or redox-dependent cofactors (e.g., NADH, NADPH, and heme) would allow for the detection of additional enzymes.
Based on our cell-based assays, Cds1 contributes significantly to H2S production and showed increased activity when cells were exposed to Cys. Since the total sulfur atom concentration in bacteria (e.g., E. coli) is ~130 mM and intracellular Cys serves as the primary supplier of sulfur atoms [47], it is possible that Cds1 shuttles sulfur atoms among metabolites to meet cellular demand and to maintain redox balance. Indeed, Cds1 protects Mtb and Msm against toxic concentrations of Cys, providing insight into the mechanisms, whereby Cds1 mitigates intracellular oxidative stress triggered by Cys, which feeds the Fenton reaction to generate free radicals [9]. Therefore, our data (Figure 3f, Figure 6 and Figure 7) support the concept that the Cds1-mediated conversion of Cys into H2S functions as a sink for excess Cys. This concept is further supported by studies showing that high levels of Cys inhibit growth [61], induce ROI production, and lead to DNA damage in E. coli [9] and Mtb [49].
Like other small nonelectrolytes, such as •NO, CO, and O2, at a gas/liquid interface H2S in solution (as a dissolved solute) readily “escapes” solvation and volatilizes. Likewise, as a gas at this interface, it will readily dissolve and, so, with a confined headspace, a dynamic equilibrium of volatilization/dissolution will exist, defined quantitatively by Henry’s Law. As pointed out elsewhere [18], the ability of H2S to exist as a gas has functional biological relevance only in the presence of such a gas/liquid interface, which is also true for •NO, CO, and O2 [62]. As demonstrated previously [63], the contribution of volatilization in vitro will be determined by the specific experimental configuration. In the lung, where such an interface is central to organ function, the “headspace” is not confined. Therefore, according to Le Chatelier’s principle, the process of ventilation will serve to pull this equilibrium in the direction of volatilization and, therefore, may well serve to amplify the importance of desulfhydration as a sink for H2S (and its conjugate bases HS and S2−) in vivo. The relative importance of volatilization as a sink will depend on its magnitude compared to other competing mechanisms of consumption in the organism and tissue [64].
Our finding that Cds1 generates H2S and pyruvate using Cys as a substrate suggests that Cds1 is catalytically similar to mammalian and bacterial CSE, which converts Cys into H2S, pyruvate, and ammonia [19]. Elegant biochemical studies have shown that Mtb Rv1079 possesses both CSE and cystathionine γ-synthase (CGS) activity [27]. However, Rv1079 lacks Cys desulfhydrase activity, and these authors speculated that an as yet uncharacterized enzyme performed this important role [27]. We provide genetic and biochemical evidence that Cds1 fulfils this function through its Cys desulfhydrase activity, which adds to our understanding of how Mtb detoxifies Cys.
An unusual feature of H2S is its ability to stimulate bioenergetics at low concentrations and inhibit respiration at higher concentrations. In a recent study, we demonstrated that low concentrations of exogenous H2S stimulate Mtb respiration and growth [22]. In mammals, H2S has been implicated in reversibly inhibiting cytochrome c oxidase (Complex IV) at high concentrations, and, conversely, stimulating mitochondrial respiration at low concentrations [20,21,65,
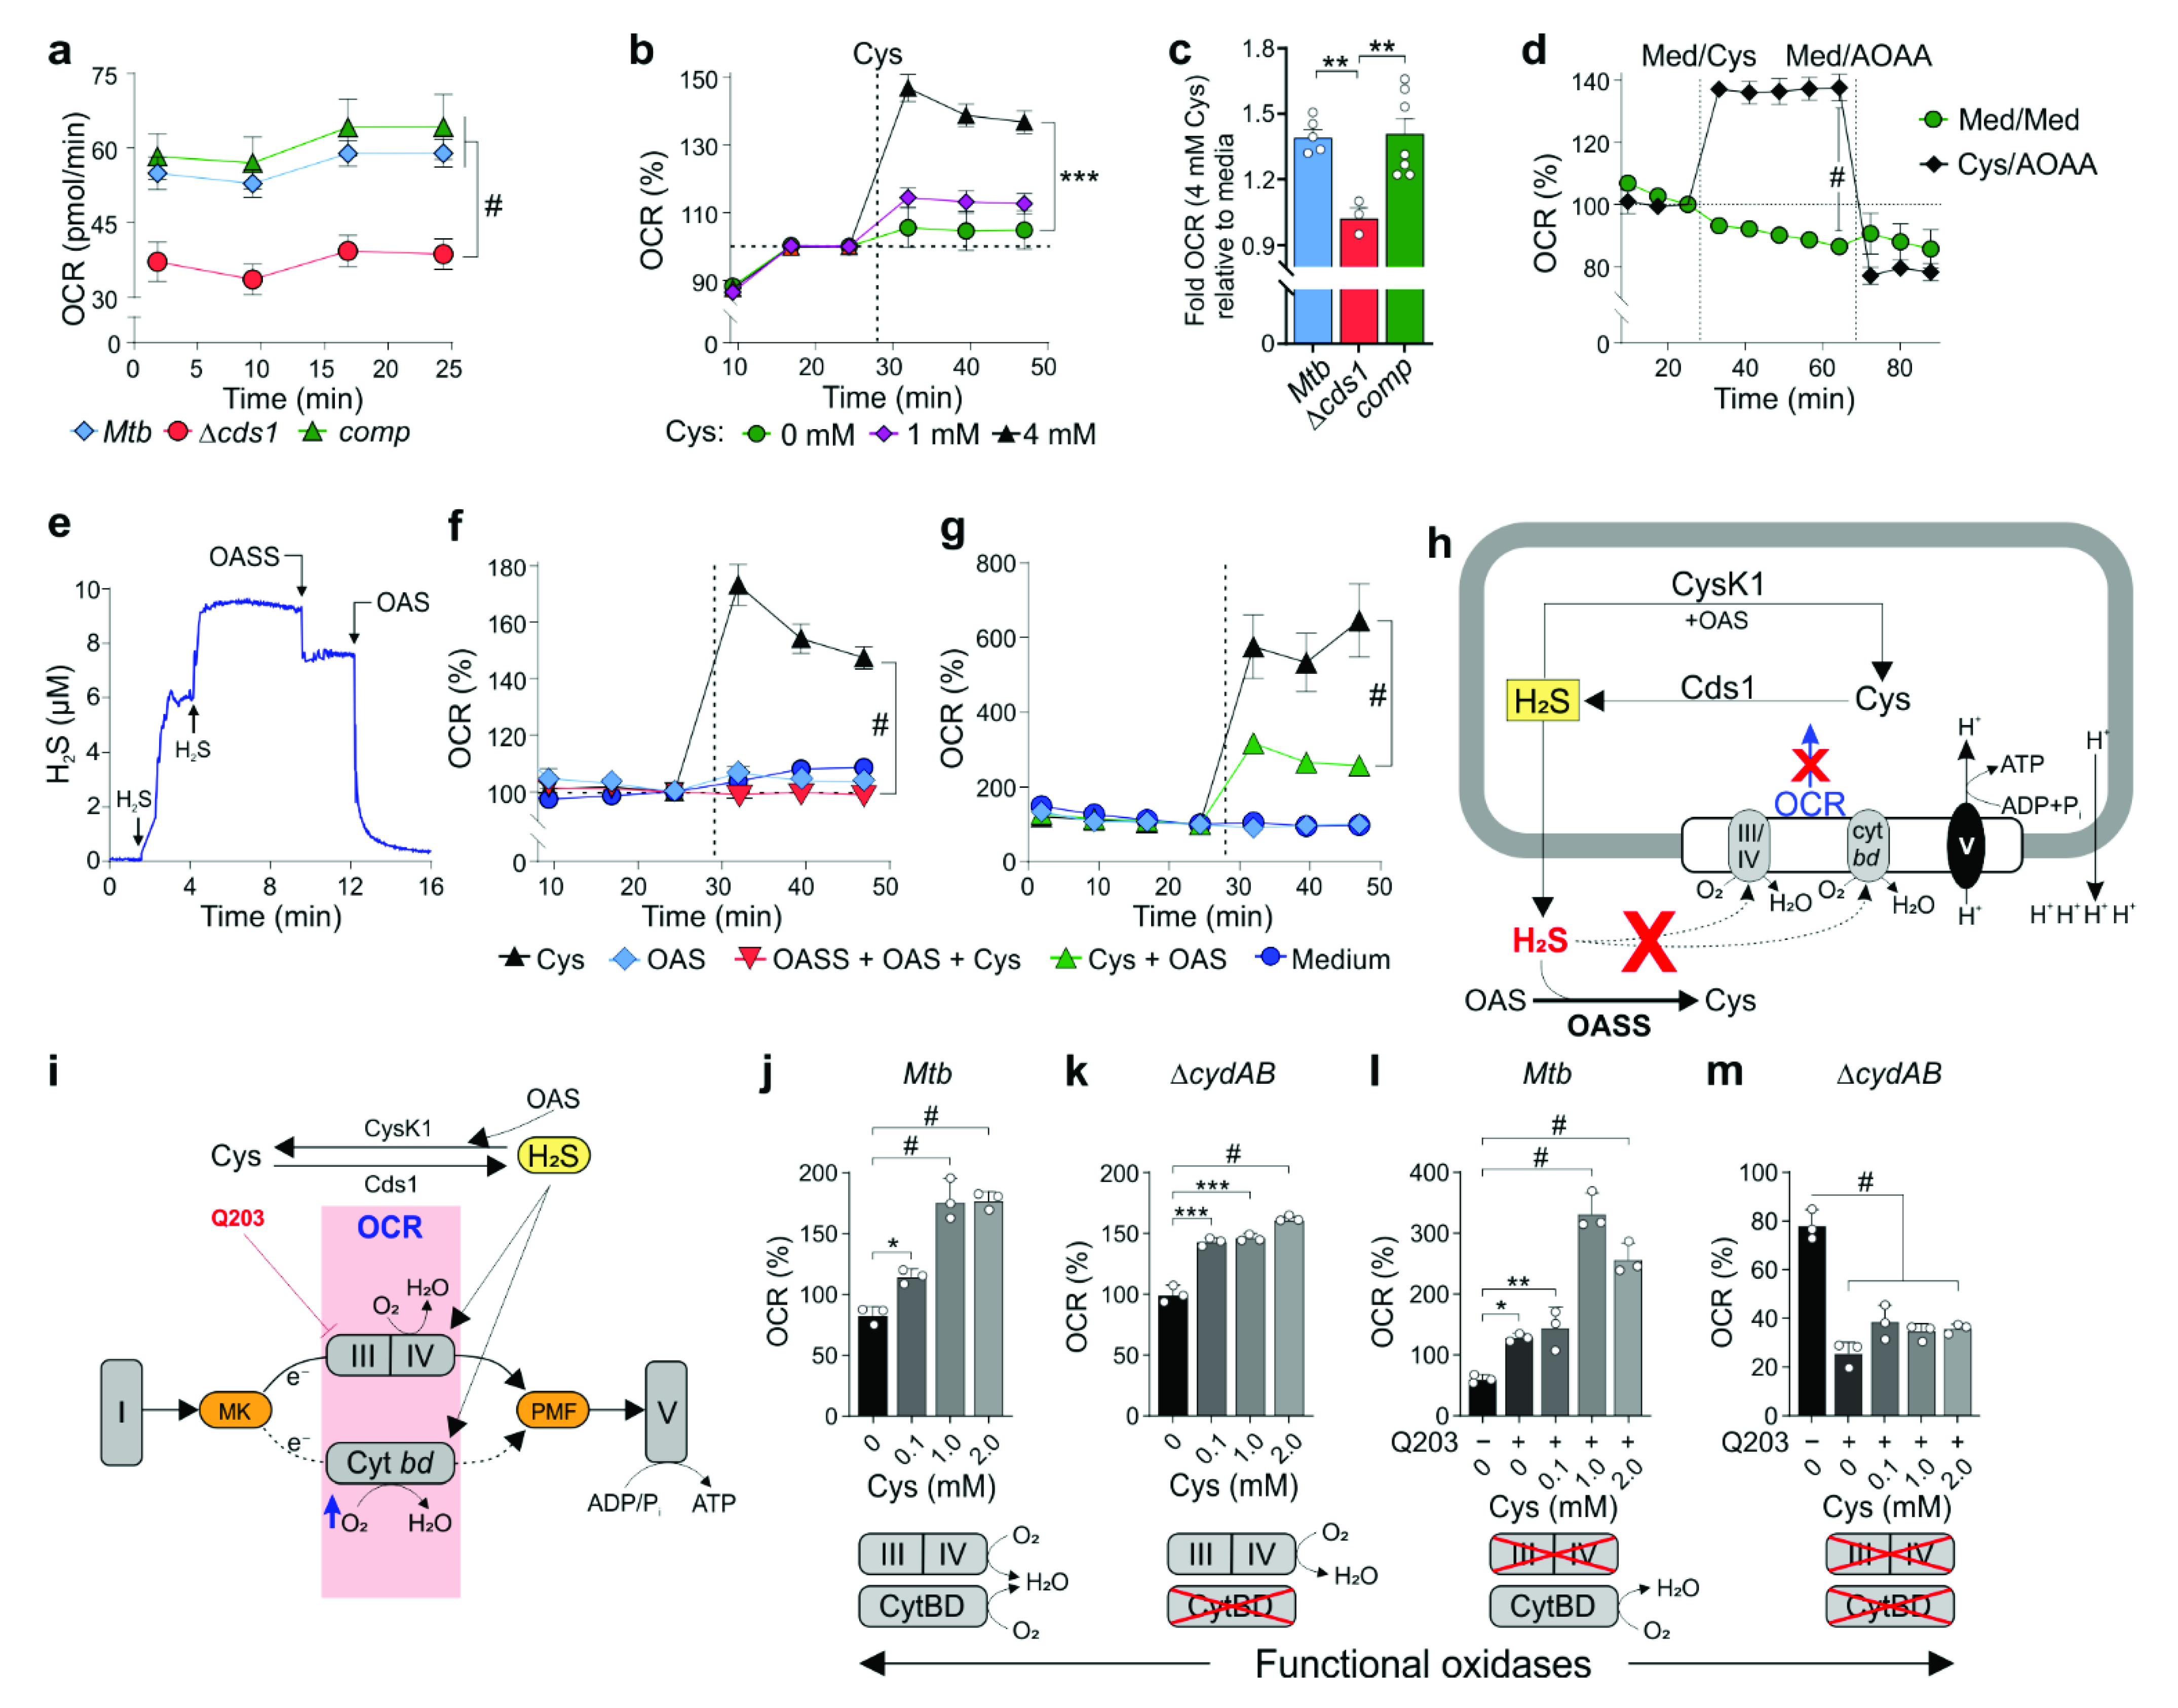
66]. Our finding that Cds1-generated H2S is an effector molecule that modulates basal respiration reveals a previously unknown facet of Mtb physiology. This is supported by genetic and bioenergetic data showing a ~40% reduction in the basal respiration of Δcds1 cells compared to WT Mtb.
By exploiting a Mtb cytBD mutant and pharmacological inhibition of cytochrome bc1/aa3, our findings provide insight into how H2S can stimulate respiration. Contrary to studies in E. coli that show cytochrome bo3 oxidase is susceptible to H2S and its two bd oxidases are resistant to H2S [36,47], our current data suggest that Cys-generated H2S stimulates respiration via both Mtb cytochrome bc1/aa3 and CytBD, consistent with our previous findings [22]. For example, in the presence of Cys, respiration is dramatically increased when cytochrome bc1/aa3 oxidase is inhibited with Q203 compared to respiration in the Mtb cytBD mutant. Hence, CytBD plays a more prominent role than cytochrome bc1/aa3 in H2S-mediated stimulation. Determining whether H2S directly binds to one or both oxidases in Mtb to stimulate respiration will require further investigation. Mtb and E. coli respond differently to H2S, likely because they occupy vastly different niches. Mtb is an obligate aerobe that colonizes the human lung, whereas E. coli is a facultative anaerobe and ubiquitous member of the human gut microbiota that is exposed to millimolar concentrations of H2S. More importantly, unlike other bacteria, Mtb has the unusual ability to rapidly reroute ETC flux to either cytochrome bc1/aa3 or CytBD [34] depending on which oxidase is inhibited. This remarkable plasticity allows Mtb to effectively respond to host gases, such as NO and CO, which inhibit respiration, and H2S, which can stimulate respiration.
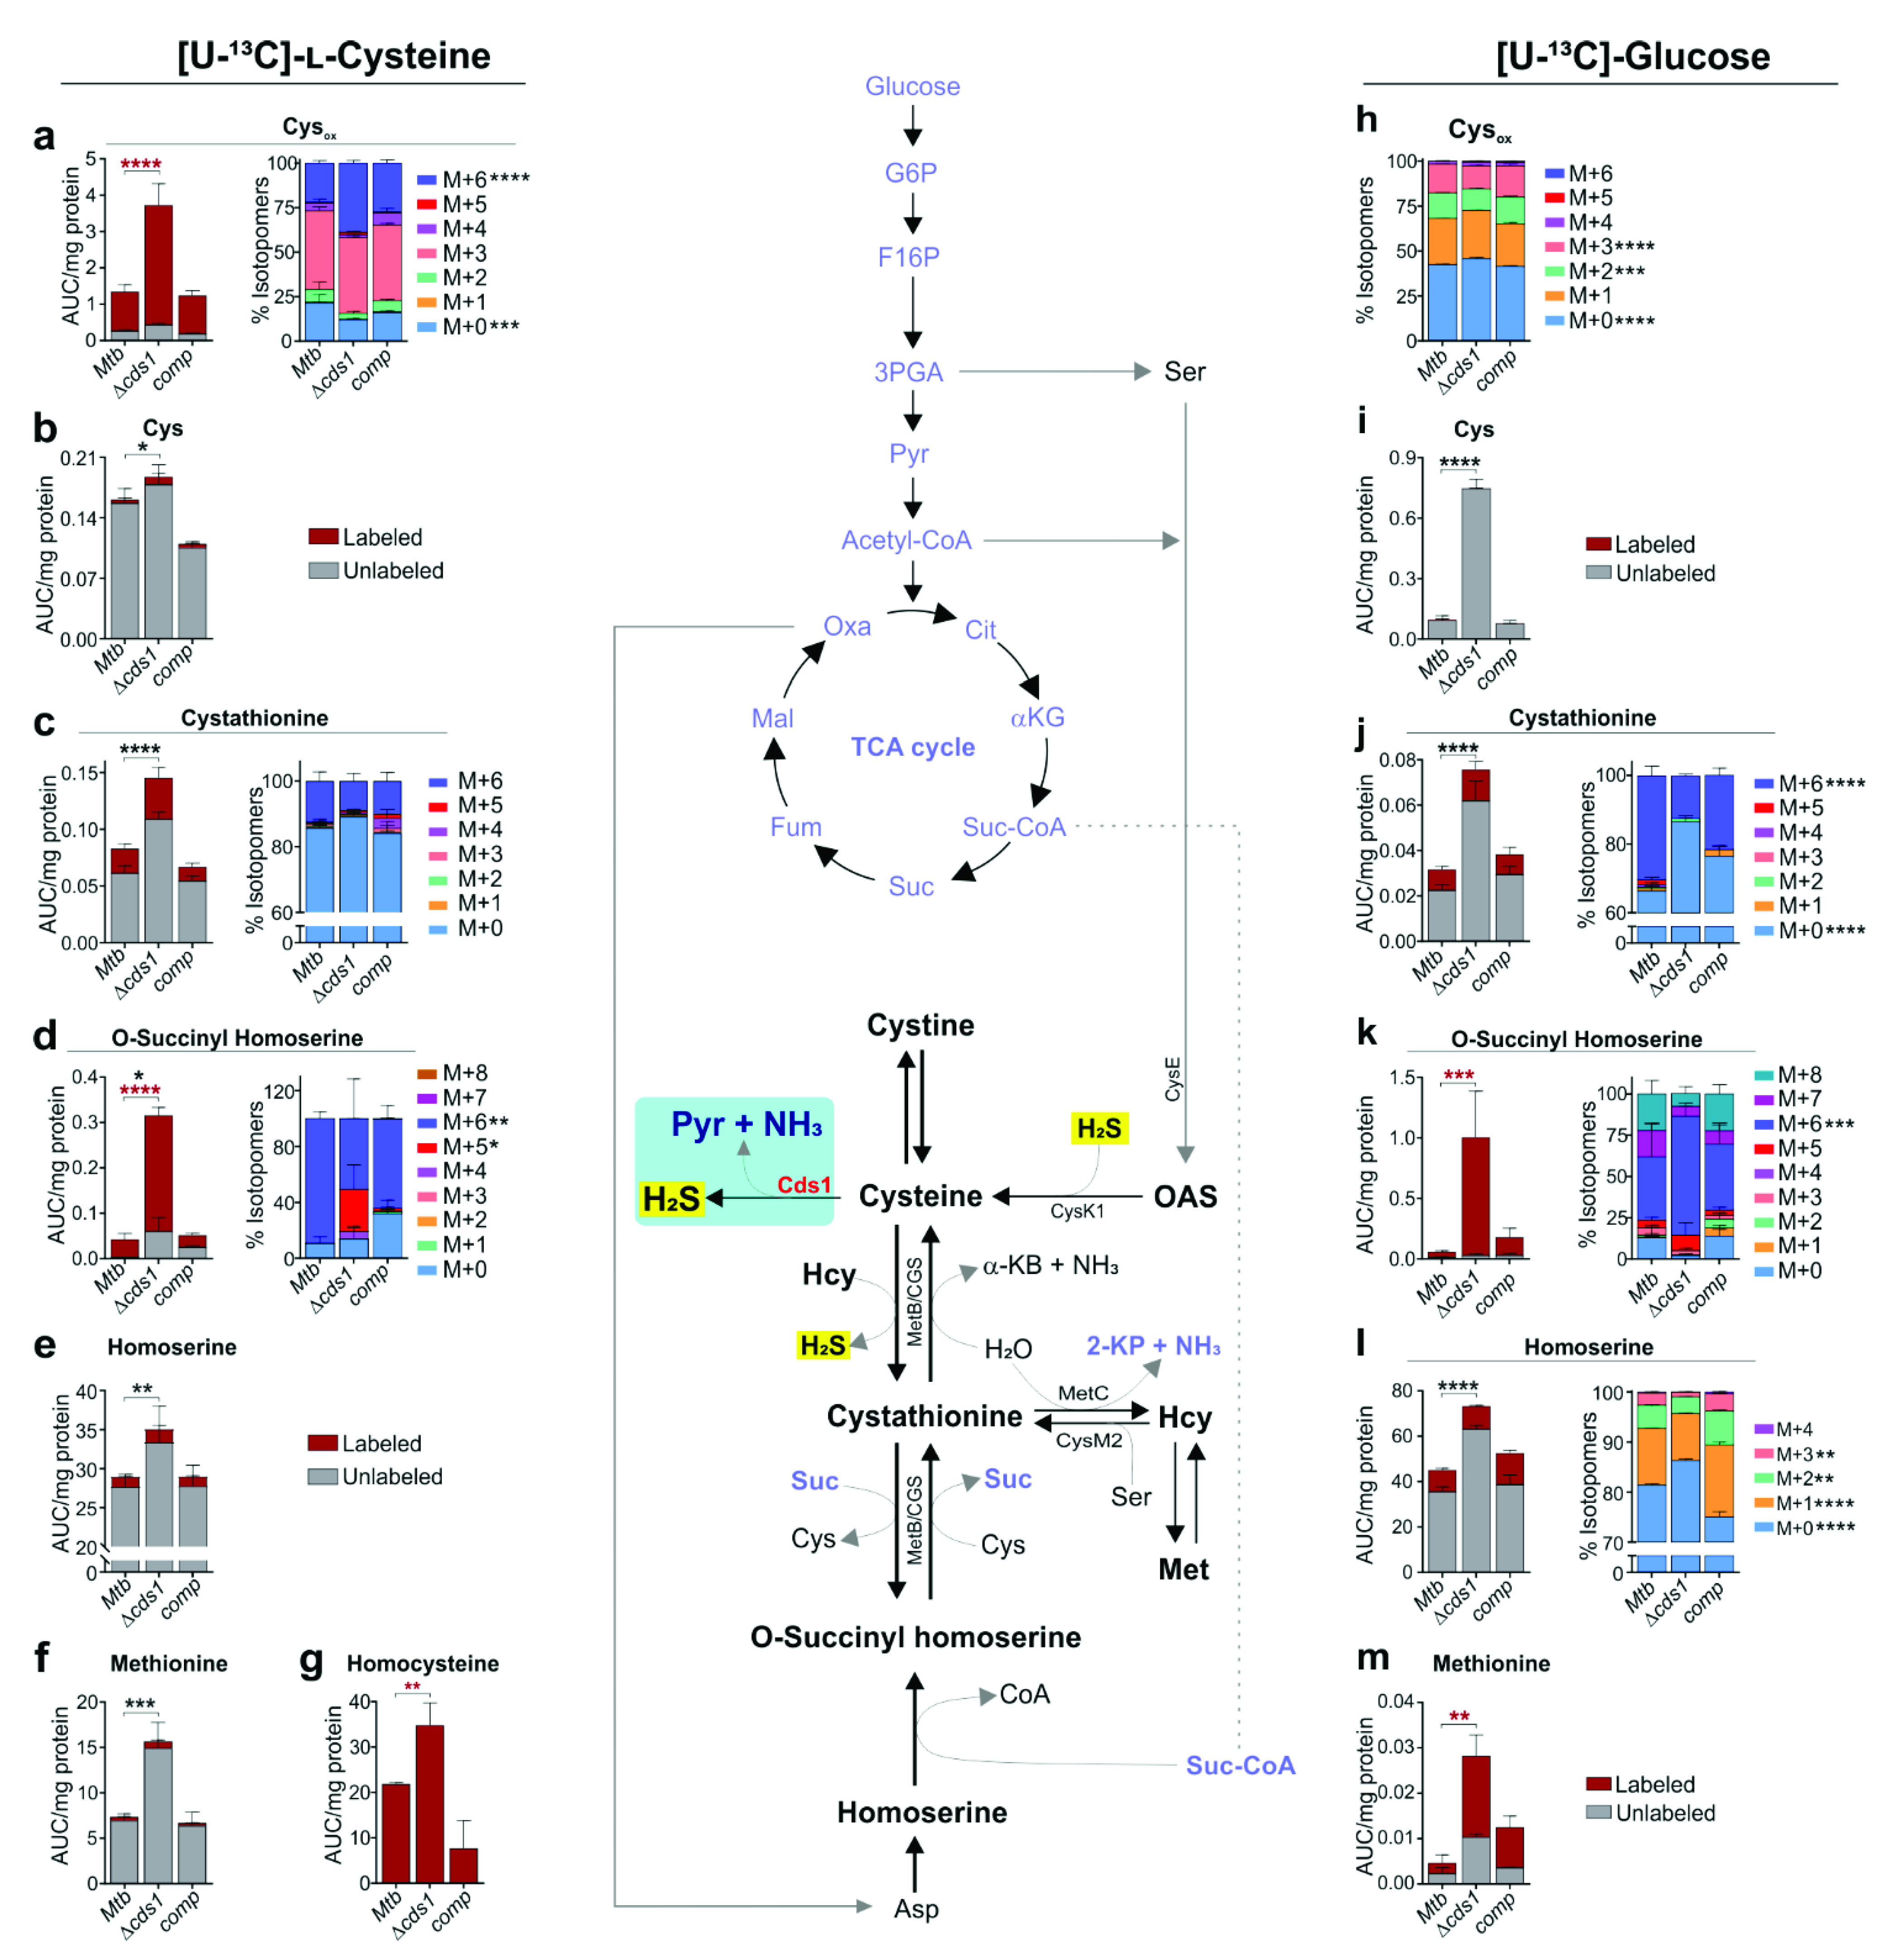
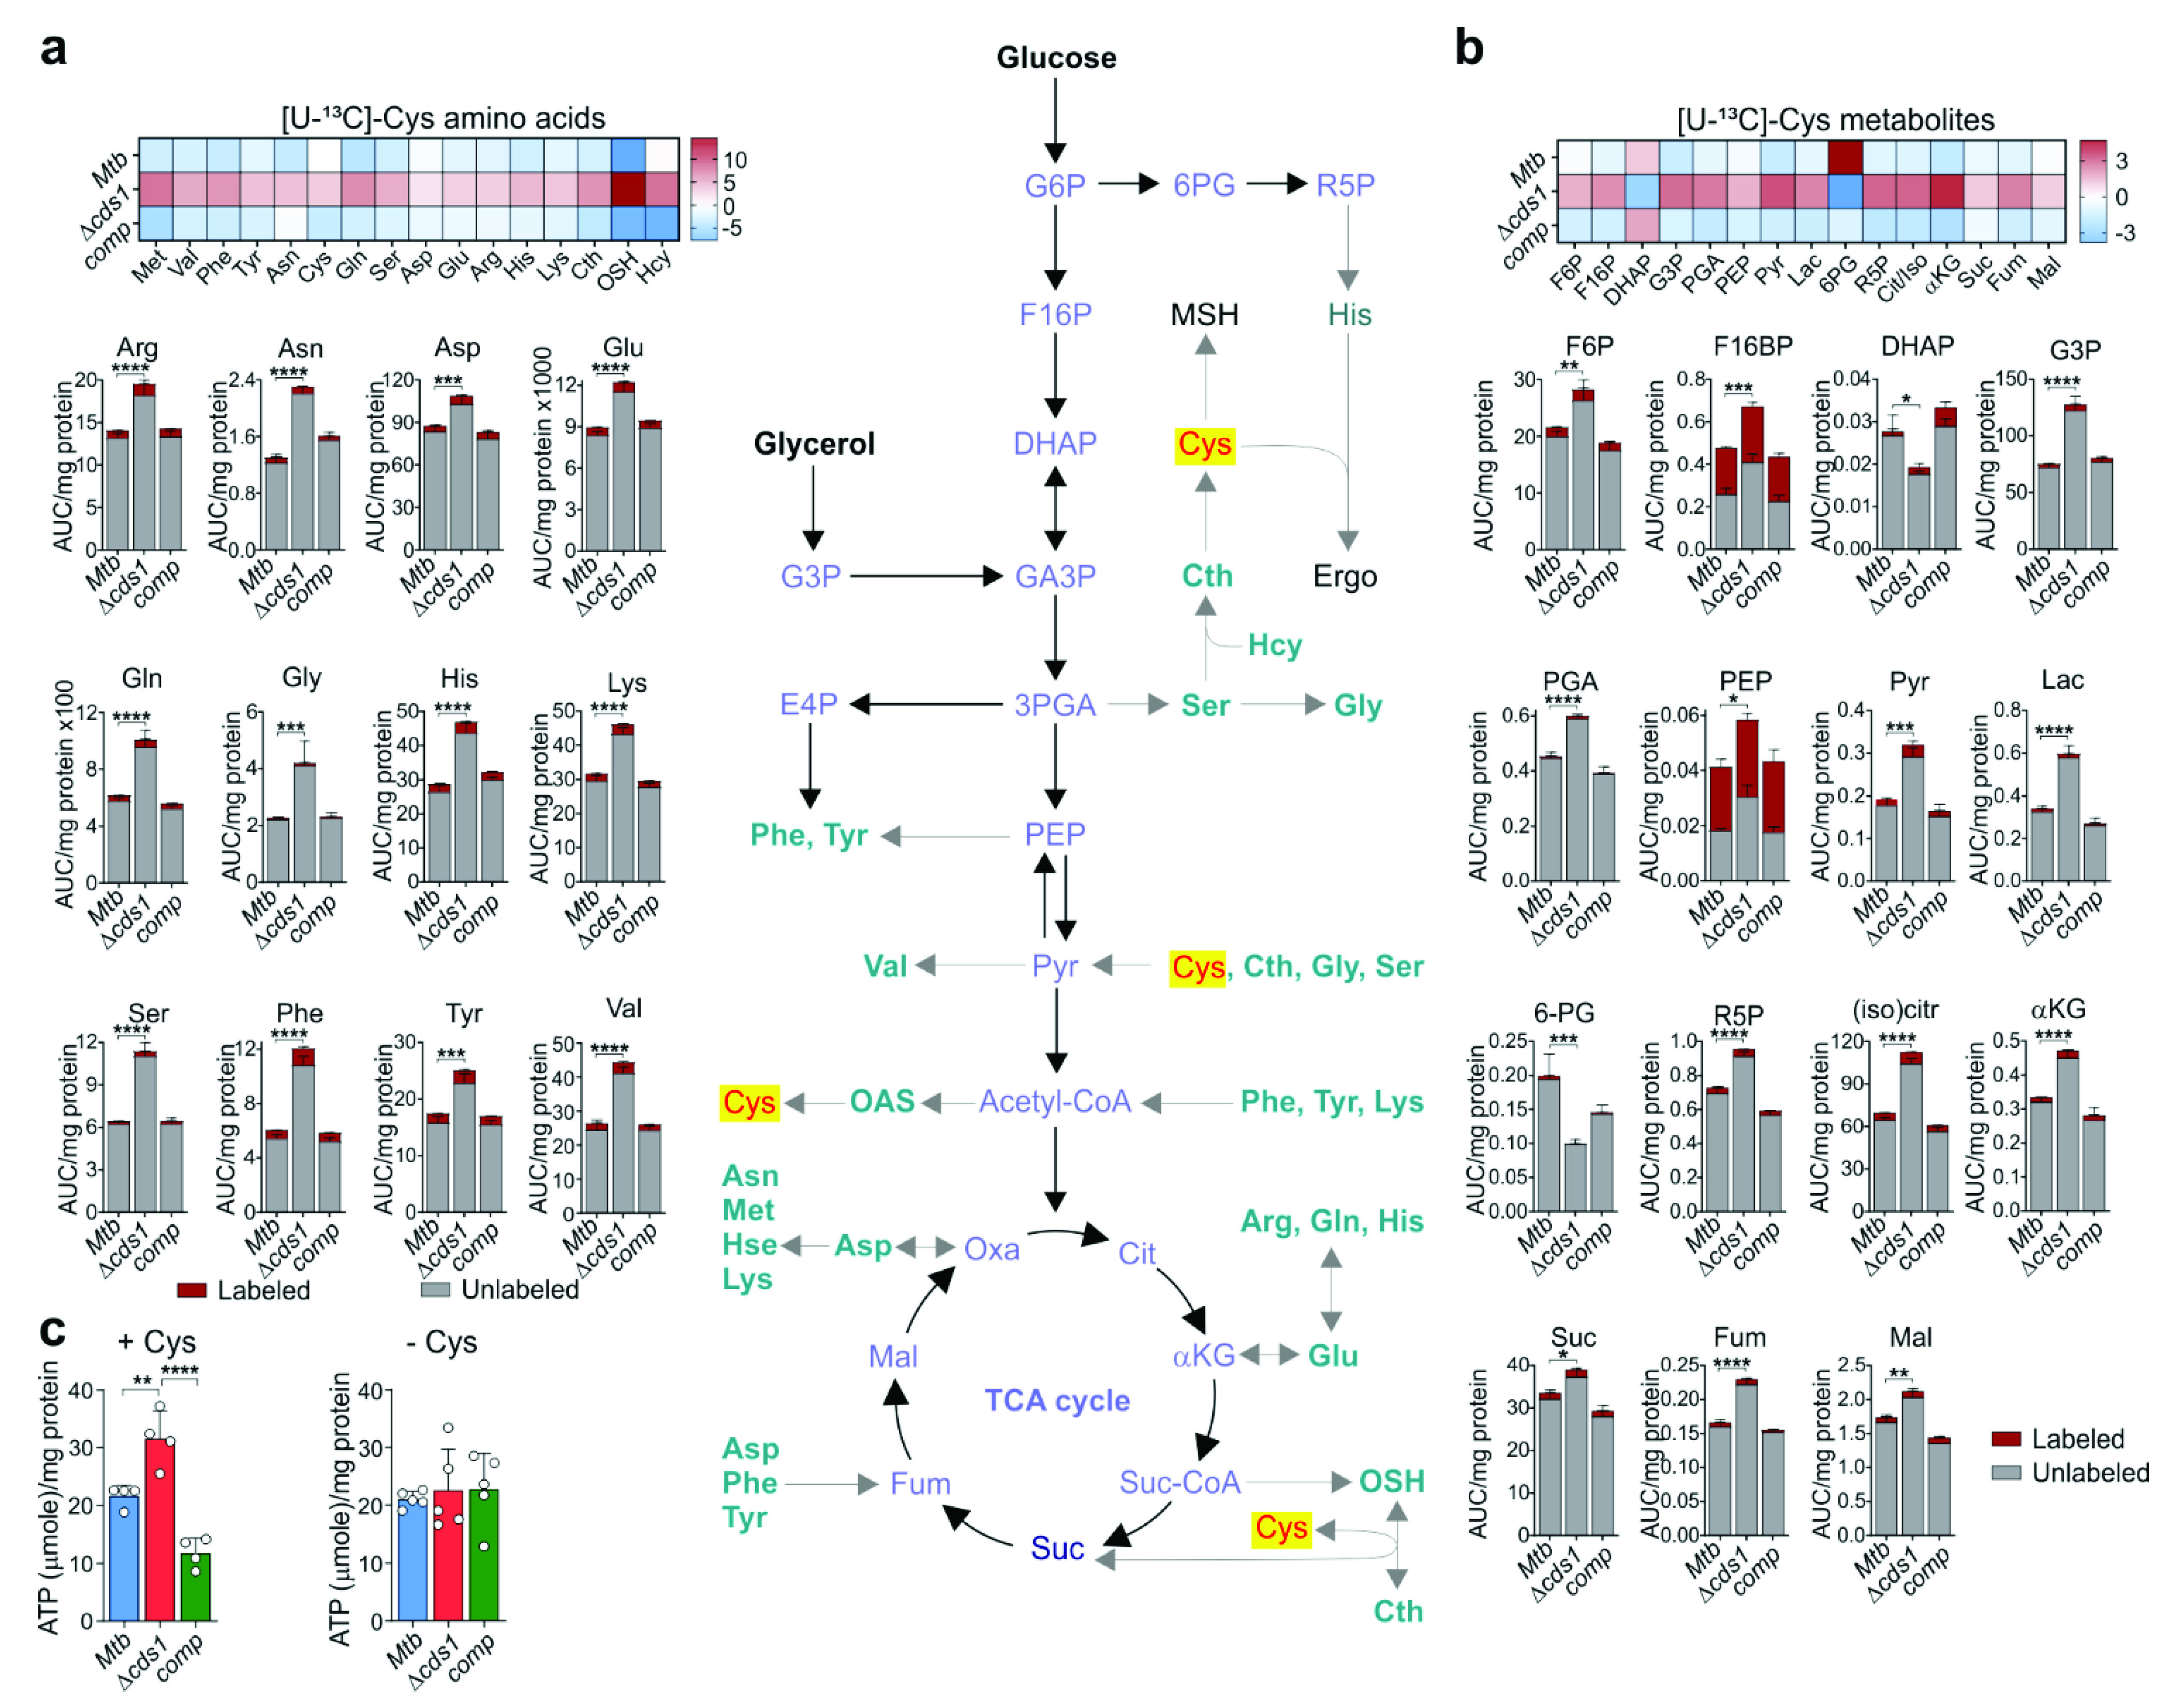
Respiration is directly linked to central metabolism, and not surprisingly, Cds1-generated H2S suppresses glycolysis in WT Mtb as was evident by increased levels of numerous glycolytic metabolites in Δcds1 cells. We propose two plausible mechanisms whereby H2S could modulate the balance between OXPHOS and glycolysis (Figure 8j): Firstly, reduced respiration (OXPHOS) in Δcds1 cells triggers a compensatory glycolytic response, i.e., substrate level of phosphorylation to meet the bioenergetic demands for ATP. This is not an unusual metabolic response, as it was previously posited that bedaquiline-mediated inhibition of OXPHOS leads to a compensatory induction of glycolysis to meet the demand for ATP through substrate-level phosphorylation [34,67]. In addition, recent studies on Bacillus and Staphylococcus spp. showed that glycolysis can reverse polymyxin B-mediated ATP depletion that resulted from dysregulation of OXPHOS [68,69]. Secondly, H2S can directly target enzymes in the glycolytic pathway through persulfidation to modulate their activity [53,54]. This is supported by recent studies showing that H2S suppresses glycolysis in macrophages upon Mtb infection [23].
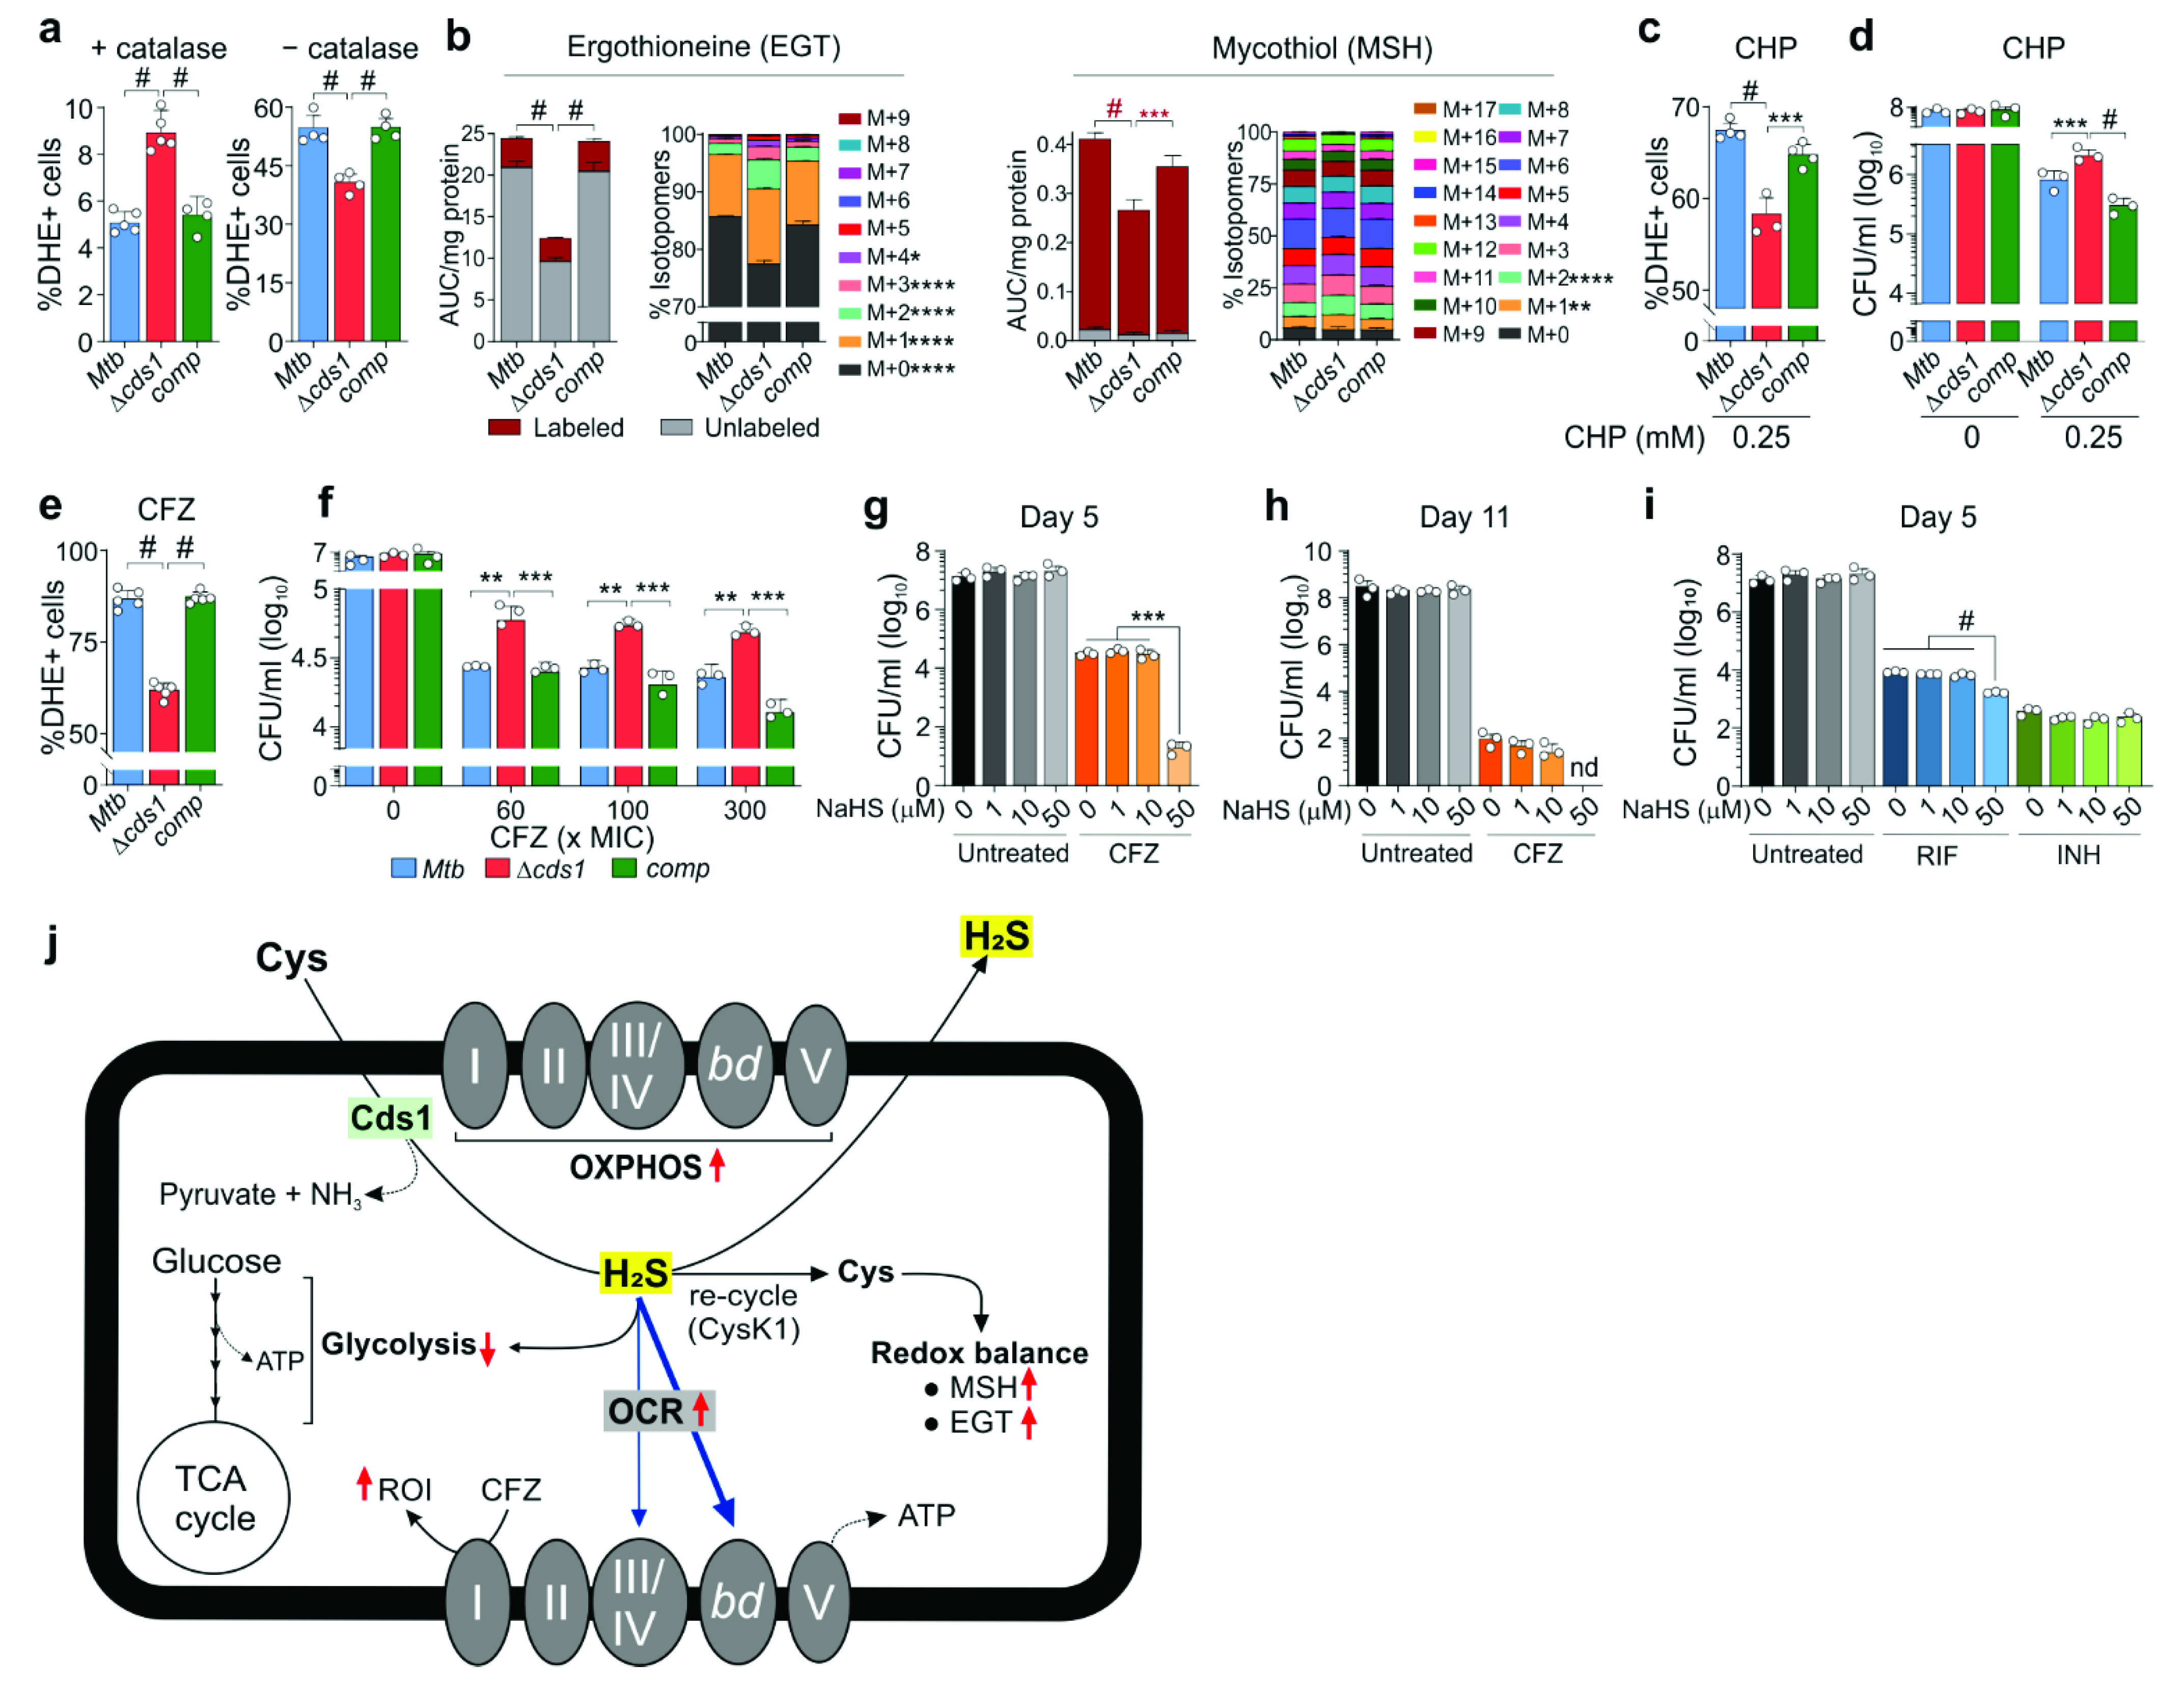
Respiration and central metabolism are also linked to redox balance (via MSH and EGT) and ROI production in bacteria [70], and we demonstrated that Cds1-generated H2S plays a role in maintaining Mtb redox homeostasis. Our data show that catalase in growth media influences ROI production and that H2S can function as an oxidant or reductant depending on the environmental conditions. In this regard, careful consideration should be given to experimental design and subsequent conclusions, since exogenous catalase in 7H9 medium is widely known to influence INH drug susceptibility and is routinely excluded from medium in INH susceptibility studies. It has been suggested that 3MST-derived H2S protects E. coli against oxidative stress via H2S-mediated sequestration of Fe2+ [14]. In Mtb, exogenous H2S upregulates key members of the copper regulon, suggesting that copper, which has a high affinity for H2S, may contribute to increased ROI when exposed to excess H2S [22].
The unusual effect of H2S on Mtb respiration and oxidative stress, as demonstrated in this study as well as previous studies on how H2S impacts antibiotic resistance [15], guided us toward considering a role for H2S in the cellular response to anti-TB drugs, such as CFZ, which kills Mtb via ROI production [71]. Indeed, our data demonstrate that H2S exacerbates oxidative stress in the presence of CFZ. Not surprisingly, Δcds1 cells are more resistant to CFZ, consistent with our data showing that addition of exogenous H2S to CFZ-treated cells increases Mtb killing. On this basis, we propose that endogenous H2S stimulates respiration leading to increased ROI production that synergizes with ROI produced by CFZ, ultimately increasing killing. Whereas previous studies have shown that addition of Cys to Mtb cells increases respiration and killing of Mtb persisters treated with INH and RIF [49], our study suggests that H2S could be the effector molecule in that model. It should be recognized that exogenous Cys also generates H2O2 to trigger the Fenton reaction, which leads to continuous OH formation that damages DNA which may exacerbate the effect of INH, particularly in closed vessels where H2O2 accumulates [50]. Exogenous H2S in combination with RIF also increased Mtb killing, likely because RIF also generates oxidative stress [72], but this effect was less pronounced. These findings may have important implications for TB therapy, as they suggest that sulfur sources in vivo could influence anti-TB drug efficacy. Similarly, recent studies have shown that exogenous H2S with RIF (and other antibiotics) confer hypersensitivity to Acinetobactor baumannii [73].

5. Conclusions

In this study, we showed that pathogenic Mtb strains produce H2S mainly through Rv3684/Cds1 to regulate energy metabolism and ameliorate cysteine toxicity. Our findings represent a significant conceptual advance that may broadly impact the TB field, especially since H2S production by Mtb is a previously overlooked confounding factor in routine TB experimentation. Our findings present a basis for understanding how Mtb-derived H2S regulates Mtb OXPHOS and glycolysis, redox homeostasis, and anti-TB drug susceptibility. These findings may also contribute to original virulence paradigms whereby host- and Mtb-generated H2S subverts host immunity. Lastly, we anticipate that our findings will contribute to a fresh understanding of phenotypic variation in clinical strains of Mtb as well as novel diagnostics based on H2S production.

Supplementary Materials

The following are available online at https://www.mdpi.com/article/10.3390/antiox10081285/s1: Figure S1. Mtb H2S production when exposed to exogenous Cys, Figure S2. Role of Mtb Rv1077 (CBS) in H2S production, Figure S3. Multiple sequence alignment of the CDS/CBS protein family, Figure S4. Complete Rv3684/Cds1 amino acid sequence, Figure S5. In-gel BC assay of purified Cds1 and confirmation of cds1 deletion in Mtb strains, Figure S6. Survival of cds1-deficient Mtb in macrophages, Figure S7. Mtb Δcds1 growth in the presence of fatty acids or precursors as a single carbon source, Figure S8. Mtb H2S production when cultured in the presence of fatty acids or precursors as a single carbon source, Figure S9. Role of Cbs (Rv1077) in Mtb respiration, Figure S10. AOAA inhibits Cys-mediated increases in Mtb respiration, Figure S11. Exogenous H2S reverses the respiratory defect in Mtbcds1 cells, Figure S12. SDS-PAGE of purified O-acetylserine sulfhydrylase (OASS), Figure S13. Cds1 regulates amino acid metabolism in Mtb, Figure S14. Gating strategy for detection of DHE-positive Mtb cells for measuring ROI, Figure S15. Mycothiol and ergothioneine levels in Mtb after exposure to CHP, Table S1. Bacterial strains used in this study, Table S2. Plasmids used in this study, Table S3. Oligonucleotides used in this study, Table S4. Mtb H37Rv enzymes putatively involved in sulfur-containing amino acid biosynthesis, H2S production or sulfur metabolism.

Author Contributions

A.J.C.S., T.T.R.K., and M.A.R. designed the research; T.T.R.K., M.A.R., J.N.G., and A.J.C.S. wrote the paper; T.T.R.K., M.A.R., B.E.T., J.S.M., and R.R.S. performed the research; J.H.A. performed the LC-MS/MS analyses; T.T.R.K., M.A.R., V.S., D.A.L., J.R.L.J., and M.B. analyzed the data. All authors have read and agreed to the published version of the manuscript.

Funding

This work was supported by NIH grants R01AI134810, R01AI152110, R01AI137043, R33AI138280, a Bill and Melinda Gates Foundation Award (OPP1130017), South Africa (SA) MRC, SA NRF BRICS Program to AJCS, and CSIR to TTRK.

Institutional Review Board Statement

Not applicable.

Informed Consent Statement

Not applicable.

Data Availability Statement

Proteomics data were deposited at the ProteomeXchange Consortium via the PRIDE partner repository with the data set identifier PXD022969.

Acknowledgments

We thank Michelle Larson (Albert Einstein College of Medicine, NY, USA) for providing the specialized transducing phage for rv3684 and Alessandro Giuffrè (CNR Institute of Molecular Biology and Pathology, Rome, Italy) for providing the OASS expressing plasmid.

Conflicts of Interest

Authors declare no competing interests.

References

  1. Wareham, L.K.; Southam, H.M.; Poole, R.K. Do nitric oxide, carbon monoxide and hydrogen sulfide really qualify as ’gasotransmitters’ in bacteria? Biochem. Soc. Trans. 2018, 46, 1107–1118. [Google Scholar] [CrossRef] [Green Version]
  2. Shiloh, M.U.; Manzanillo, P.; Cox, J.S. Mycobacterium tuberculosis senses host-derived carbon monoxide during macrophage infection. Cell Host Microbe 2008, 3, 323–330. [Google Scholar] [CrossRef] [Green Version]
  3. Kumar, A.; Deshane, J.S.; Crossman, D.K.; Bolisetty, S.; Yan, B.-S.; Kramnik, I.; Agarwal, A.; Steyn, A.J. Heme oxygenase-1-derived carbon monoxide induces the Mycobacterium tuberculosis dormancy regulon. J. Biol. Chem. 2008, 283, 18032–18039. [Google Scholar] [CrossRef] [Green Version]
  4. Chinta, K.C.; Saini, V.; Glasgow, J.N.; Mazorodze, J.H.; Rahman, M.A.; Reddy, D.; Lancaster, J.R., Jr.; Steyn, A.J. The emerging role of gasotransmitters in the pathogenesis of tuberculosis. Nitric Oxide 2016, 59, 28–41. [Google Scholar] [CrossRef] [Green Version]
  5. Wang, R. Physiological implications of hydrogen sulfide: A whiff exploration that blossomed. Physiol. Rev. 2012, 92, 791–896. [Google Scholar] [CrossRef] [Green Version]
  6. Li, Q.; Lancaster, J.R. Chemical foundations of hydrogen sulfide biology. Nitric Oxide 2013, 35, 21–34. [Google Scholar] [CrossRef] [Green Version]
  7. Olson, K.R.; DeLeon, E.R.; Liu, F. Controversies and conundrums in hydrogen sulfide biology. Nitric Oxide 2014, 41, 11–26. [Google Scholar] [CrossRef]
  8. Yang, J.; Minkler, P.; Grove, D.; Wang, R.; Willard, B.; Dweik, R.; Hine, C. Non-enzymatic hydrogen sulfide production from cysteine in blood is catalyzed by iron and vitamin B6. Commun. Biol. 2019, 2, 194. [Google Scholar] [CrossRef] [Green Version]
  9. Park, S.; Imlay, J.A. High levels of intracellular cysteine promote oxidative DNA damage by driving the fenton reaction. J. Bacteriol. 2003, 185, 1942–1950. [Google Scholar] [CrossRef] [Green Version]
  10. Kessler, D. Enzymatic activation of sulfur for incorporation into biomolecules in prokaryotes. FEMS Microbiol. Rev. 2006, 30, 825–840. [Google Scholar] [CrossRef] [Green Version]
  11. Ulrich, K.; Jakob, U. The role of thiols in antioxidant systems. Free Radic. Biol. Med. 2019, 140, 14–27. [Google Scholar] [CrossRef]
  12. Barrett, E.L.; Clark, M.A. Tetrathionate reduction and production of hydrogen sulfide from thiosulfate. Microbiol. Rev. 1987, 51, 192–205. [Google Scholar] [CrossRef]
  13. Kuester, E.; Williams, S.T. Production of hydrogen sulfide by streptomyces and methods for its detection. Appl. Microbiol. 1964, 12, 46–52. [Google Scholar] [CrossRef]
  14. Mironov, A.; Seregina, T.; Nagornykh, M.; Luhachack, L.G.; Korolkova, N.; Lopes, L.E.; Kotova, V.; Zavilgelsky, G.; Shakulov, R.; Shatalin, K.; et al. Mechanism of H2S-mediated protection against oxidative stress in escherichia coli. Proc. Natl. Acad. Sci. USA 2017, 114, 6022–6027. [Google Scholar] [CrossRef] [Green Version]
  15. Shatalin, K.; Shatalina, E.; Mironov, A.; Nudler, E. H2S: A universal defense against antibiotics in bacteria. Science 2011, 334, 986–990. [Google Scholar] [CrossRef]
  16. Clarke, P.H. Hydrogen sulphide production by bacteria. Microbiology 1953, 8, 397–407. [Google Scholar] [CrossRef] [PubMed] [Green Version]
  17. Basic, A.; Blomqvist, M.; Dahlén, G.; Svensäter, G. The proteins of Fusobacterium spp. involved in hydrogen sulfide production from L-cysteine. BMC Microbiol. 2017, 17, 61. [Google Scholar] [CrossRef] [PubMed] [Green Version]
  18. Rahman, M.A.; Glasgow, J.N.; Nadeem, S.; Reddy, V.P.; Sevalkar, R.R.; Lancaster, J.R., Jr.; Steyn, A.J.C. The role of host-generated H2S in microbial pathogenesis: New perspectives on tuberculosis. Front. Cell Infect. Microbiol. 2020, 10, 586923. [Google Scholar] [CrossRef] [PubMed]
  19. Singh, S.; Banerjee, R. PLP-dependent H2S biogenesis. Biochim. Et Biophys. Acta 2011, 1814, 1518–1527. [Google Scholar] [CrossRef] [PubMed] [Green Version]
  20. Szabo, C.; Ransy, C.; Modis, K.; Andriamihaja, M.; Murghes, B.; Coletta, C.; Olah, G.; Yanagi, K.; Bouillaud, F. Regulation of mitochondrial bioenergetic function by hydrogen sulfide. Part I. Biochemical and physiological mechanisms. Br. J. Pharm. 2014, 171, 2099–2122. [Google Scholar] [CrossRef] [Green Version]
  21. Kabil, O.; Banerjee, R. Redox biochemistry of hydrogen sulfide. J. Biol. Chem. 2010, 285, 21903–21907. [Google Scholar] [CrossRef] [Green Version]
  22. Saini, V.; Chinta, K.C.; Reddy, V.P.; Glasgow, J.N.; Stein, A.; Lamprecht, D.A.; Rahman, M.A.; Mackenzie, J.S.; Truebody, B.E.; Adamson, J.H.; et al. Hydrogen sulfide stimulates Mycobacterium tuberculosis respiration, growth and pathogenesis. Nat. Commun. 2020, 11, 557. [Google Scholar] [CrossRef]
  23. Rahman, M.A.; Cumming, B.M.; Addicott, K.W.; Pacl, H.T.; Russell, S.L.; Nargan, K.; Naidoo, T.; Ramdial, P.K.; Adamson, J.H.; Wang, R.; et al. Hydrogen sulfide dysregulates the immune response by suppressing central carbon metabolism to promote tuberculosis. Proc. Natl. Acad. Sci. USA 2020, 117, 6663–6674. [Google Scholar] [CrossRef] [Green Version]
  24. Dilek, N.; Papapetropoulos, A.; Toliver-Kinsky, T.; Szabo, C. Hydrogen sulfide: An endogenous regulator of the immune system. Pharmacol. Res. 2020, 161, 105119. [Google Scholar] [CrossRef]
  25. Available online: https://www.genome.jp/kegg/ (accessed on 18 February 2020).
  26. Mishra, R.; Kohli, S.; Malhotra, N.; Bandyopadhyay, P.; Mehta, M.; Munshi, M.; Adiga, V.; Ahuja, V.K.; Shandil, R.K.; Rajmani, R.S.; et al. Targeting redox heterogeneity to counteract drug tolerance in replicating Mycobacterium tuberculosis. Sci. Transl. Med. 2019, 11, eaaw6635. [Google Scholar] [CrossRef]
  27. Wheeler, P.R.; Coldham, N.G.; Keating, L.; Gordon, S.V.; Wooff, E.E.; Parish, T.; Hewinson, R.G. Functional demonstration of reverse transsulfuration in the Mycobacterium tuberculosis complex reveals that methionine is the preferred sulfur source for pathogenic mycobacteria. J. Biol. Chem. 2005, 280, 8069–8078. [Google Scholar] [CrossRef] [Green Version]
  28. Schnell, R.; Sandalova, T.; Hellman, U.; Lindqvist, Y.; Schneider, G. Siroheme- and [Fe4-S4]-dependent NirA from Mycobacterium tuberculosis is a sulfite reductase with a covalent Cys-Tyr bond in the active site. J. Biol. Chem. 2005, 280, 27319–27328. [Google Scholar] [CrossRef] [Green Version]
  29. Pinto, R.; Harrison, J.S.; Hsu, T.; Jacobs, W.R., Jr.; Leyh, T.S. Sulfite reduction in mycobacteria. J. Bacteriol. 2007, 189, 6714–6722. [Google Scholar] [CrossRef] [Green Version]
  30. Berney, M.; Greening, C.; Conrad, R.; Jacobs, W.R., Jr.; Cook, G.M. An obligately aerobic soil bacterium activates fermentative hydrogen production to survive reductive stress during hypoxia. Proc. Natl. Acad. Sci. USA 2014, 111, 11479–11484. [Google Scholar] [CrossRef] [Green Version]
  31. Hine, C.; Mitchell, J.R. Endpoint or kinetic measurement of hydrogen sulfide production capacity in tissue extracts. Bio-protoc 2017, 7, e2382. [Google Scholar] [CrossRef] [Green Version]
  32. Yoshida, A.; Yoshimura, M.; Ohara, N.; Yoshimura, S.; Nagashima, S.; Takehara, T.; Nakayama, K. Hydrogen sulfide production from cysteine and homocysteine by periodontal and oral bacteria. J. Periodontol. 2009, 80, 1845–1851. [Google Scholar] [CrossRef]
  33. Basic, A.; Blomqvist, S.; Carlén, A.; Dahlén, G. Estimation of bacterial hydrogen sulfide production in vitro. J. Oral Microbiol. 2015, 7, 28166. [Google Scholar] [CrossRef] [Green Version]
  34. Lamprecht, D.A.; Finin, P.M.; Rahman, M.A.; Cumming, B.M.; Russell, S.L.; Jonnala, S.R.; Adamson, J.H.; Steyn, A.J. Turning the respiratory flexibility of Mycobacterium tuberculosis against itself. Nat. Commun. 2016, 7, 12393. [Google Scholar] [CrossRef]
  35. Bardarov, S.; Bardarov, S.; Pavelka, M.S.; Sambandamurthy, V.; Larsen, M.; Tufariello, J.; Chan, J.; Hatfull, G.; Jacobs, W.R. Specialized transduction: An efficient method for generating marked and unmarked targeted gene disruptions in Mycobacterium tuberculosis, M. bovis BCG and M. smegmatis. Microbiology 2002, 148, 3007–3017. [Google Scholar] [CrossRef] [Green Version]
  36. Forte, E.; Borisov, V.B.; Falabella, M.; Colaco, H.G.; Tinajero-Trejo, M.; Poole, R.K.; Vicente, J.B.; Sarti, P.; Giuffre, A. The terminal oxidase cytochrome bd promotes sulfide-resistant bacterial respiration and growth. Sci. Rep. 2016, 6, 23788. [Google Scholar] [CrossRef] [Green Version]
  37. Jeroschewski, P.; Steuckart, C.; Kühl, M. An amperometric microsensor for the determination of H2S in aquatic environments. Anal. Chem. 1996, 68, 4351–4357. [Google Scholar] [CrossRef]
  38. Forbes, B.A.; Sahm, D.F.; Weissfeld, A. Diagnostic Microbiology; Mosby: St. Louis, MO, USA, 1998. [Google Scholar]
  39. Asimakopoulou, A.; Panopoulos, P.; Chasapis, C.T.; Coletta, C.; Zhou, Z.; Cirino, G.; Giannis, A.; Szabo, C.; Spyroulias, G.A.; Papapetropoulos, A. Selectivity of commonly used pharmacological inhibitors for cystathionine β synthase (CBS) and cystathionine γ lyase (CSE). Br. J. Pharmacol. 2013, 169, 922–932. [Google Scholar] [CrossRef] [PubMed] [Green Version]
  40. Claesson, R.; Edlund, M.B.; Persson, S.; Carlsson, J. Production of volatile sulfur compounds by various Fusobacterium species. Oral Microbiol. Immunol. 1990, 5, 137–142. [Google Scholar] [CrossRef]
  41. Brychkova, G.; Yarmolinsky, D.; Ventura, Y.; Sagi, M. A novel in-gel assay and an improved kinetic assay for determining in vitro sulfite reductase activity in plants. Plant Cell Physiol 2012, 53, 1507–1516. [Google Scholar] [CrossRef]
  42. Soutourina, J.; Blanquet, S.; Plateau, P. Role of D-cysteine desulfhydrase in the adaptation of Escherichia coli to D-cysteine. J. Biol. Chem. 2001, 276, 40864–40872. [Google Scholar] [CrossRef] [Green Version]
  43. Lee, W.; VanderVen, B.C.; Fahey, R.J.; Russell, D.G. Intracellular Mycobacterium tuberculosis exploits host-derived fatty acids to limit metabolic stress. J. Biol. Chem. 2013, 288, 6788–6800. [Google Scholar] [CrossRef] [Green Version]
  44. Schnell, R.; Oehlmann, W.; Singh, M.; Schneider, G. Structural insights into catalysis and inhibition of O-acetylserine sulfhydrylase from mycobacterium tuberculosis. Crystal structures of the enzyme alpha-aminoacrylate intermediate and an enzyme-inhibitor complex. J. Biol. Chem. 2007, 282, 23473–23481. [Google Scholar] [CrossRef] [Green Version]
  45. Jacobs, W.R., Jr. Gene transfer in Mycobacterium tuberculosis: Shuttle phasmids to enlightenment. Microbiol. Spectr. 2014, 2. [Google Scholar] [CrossRef] [Green Version]
  46. Nicholls, P.; Marshall, D.C.; Cooper, C.E.; Wilson, M.T. Sulfide inhibition of and metabolism by cytochrome c oxidase. Biochem. Soc. Trans. 2013, 41, 1312–1316. [Google Scholar] [CrossRef] [Green Version]
  47. Korshunov, S.; Imlay, K.R.; Imlay, J.A. The cytochrome bd oxidase of Escherichia coli prevents respiratory inhibition by endogenous and exogenous hydrogen sulfide. Mol. Microbiol. 2016, 101, 62–77. [Google Scholar] [CrossRef] [Green Version]
  48. Arora, K.; Ochoa-Montano, B.; Tsang, P.S.; Blundell, T.L.; Dawes, S.S.; Mizrahi, V.; Bayliss, T.; Mackenzie, C.J.; Cleghorn, L.A.; Ray, P.C.; et al. Respiratory flexibility in response to inhibition of cytochrome C oxidase in Mycobacterium tuberculosis. Antimicrob. Agents Chemother. 2014, 58, 6962–6965. [Google Scholar] [CrossRef] [PubMed] [Green Version]
  49. Vilchèze, C.; Hartman, T.; Weinrick, B.; Jain, P.; Weisbrod, T.R.; Leung, L.W.; Freundlich, J.S.; Jacobs, W.R. Enhanced respiration prevents drug tolerance and drug resistance in Mycobacterium tuberculosis. Proc. Natl. Acad. Sci. USA 2017, 114, 4495–4500. [Google Scholar] [CrossRef] [Green Version]
  50. Korshunov, S.; Imlay, K.R.C.; Imlay, J.A. Cystine import is a valuable but risky process whose hazards escherichia coli minimizes by inducing a cysteine exporter. Mol. Microbiol. 2020, 113, 22–39. [Google Scholar] [CrossRef]
  51. Weissgerber, T.; Watanabe, M.; Hoefgen, R.; Dahl, C. Metabolomic profiling of the purple sulfur bacterium Allochromatium vinosum during growth on different reduced sulfur compounds and malate. Metabolomics 2014, 10, 1094–1112. [Google Scholar] [CrossRef] [Green Version]
  52. Forquin, M.-P.; Hébert, A.; Roux, A.; Aubert, J.; Proux, C.; Heilier, J.-F.; Landaud, S.; Junot, C.; Bonnarme, P.; Martin-Verstraete, I. Global regulation of the response to sulfur availability in the cheese-related bacterium Brevibacterium aurantiacum. Appl. Environ. Microbiol. 2011, 77, 1449–1459. [Google Scholar] [CrossRef] [Green Version]
  53. Guo, J.; Xing, H.; Chen, M.; Wang, W.; Zhang, H.; Xu, S. H2S inhalation-induced energy metabolism disturbance is involved in LPS mediated hepatocyte apoptosis through mitochondrial pathway. Sci. Total Environ. 2019, 663, 380–386. [Google Scholar] [CrossRef] [PubMed]
  54. Mustafa, A.K.; Gadalla, M.M.; Sen, N.; Kim, S.; Mu, W.; Gazi, S.K.; Barrow, R.K.; Yang, G.; Wang, R.; Snyder, S.H. H2S signals through protein S-sulfhydration. Sci. Signal. 2009, 2, ra72. [Google Scholar] [CrossRef] [PubMed] [Green Version]
  55. Shukla, P.; Khodade, V.S.; SharathChandra, M.; Chauhan, P.; Mishra, S.; Siddaramappa, S.; Pradeep, B.E.; Singh, A.; Chakrapani, H. “On demand” redox buffering by H2S contributes to antibiotic resistance revealed by a bacteria-specific H2S donor. Chem. Sci. 2017, 8, 4967–4972. [Google Scholar] [CrossRef] [Green Version]
  56. Xie, Z.-Z.; Liu, Y.; Bian, J.-S. Hydrogen Sulfide and Cellular Redox Homeostasis. Oxidative Med. Cell. Longev. 2016, 2016, 6043038. [Google Scholar] [CrossRef] [Green Version]
  57. Kimura, Y.; Goto, Y.; Kimura, H. Hydrogen sulfide increases glutathione production and suppresses oxidative stress in mitochondria. Antioxid. Redox Signal. 2010, 12, 1–13. [Google Scholar] [CrossRef]
  58. Modis, K.; Bos, E.M.; Calzia, E.; van Goor, H.; Coletta, C.; Papapetropoulos, A.; Hellmich, M.R.; Radermacher, P.; Bouillaud, F.; Szabo, C. Regulation of mitochondrial bioenergetic function by hydrogen sulfide. Part II. Pathophysiological and therapeutic aspects. Br. J. Pharmacol. 2014, 171, 2123–2146. [Google Scholar] [CrossRef] [Green Version]
  59. Yeh, M.W.; Kaul, M.; Zheng, J.; Nottet, H.S.; Thylin, M.; Gendelman, H.E.; Lipton, S.A. Cytokine-stimulated, but not HIV-infected, human monocyte-derived macrophages produce neurotoxic levels of l-cysteine. J. Immunol. 2000, 164, 4265–4270. [Google Scholar] [CrossRef] [Green Version]
  60. Pastore, A.; Massoud, R.; Motti, C.; Lo Russo, A.; Fucci, G.; Cortese, C.; Federici, G. Fully automated assay for total homocysteine, cysteine, cysteinylglycine, glutathione, cysteamine, and 2-mercaptopropionylglycine in plasma and urine. Clin. Chem. 1998, 44, 825–832. [Google Scholar] [CrossRef]
  61. Kari, C.; Nagy, Z.; Kovacs, P.; Hernadi, F. Mechanism of the growth inhibitory effect of cysteine on Escherichia coli. Microbiology 1971, 68, 349–356. [Google Scholar] [CrossRef] [Green Version]
  62. Fukuto, J.M.; Carrington, S.J.; Tantillo, D.J.; Harrison, J.G.; Ignarro, L.J.; Freeman, B.A.; Chen, A.; Wink, D.A. Small molecule signaling agents: The integrated chemistry and biochemistry of nitrogen oxides, oxides of carbon, dioxygen, hydrogen sulfide, and their derived species. Chem. Res. Toxicol. 2012, 25, 769–793. [Google Scholar] [CrossRef]
  63. DeLeon, E.R.; Stoy, G.F.; Olson, K.R. Passive loss of hydrogen sulfide in biological experiments. Anal. Biochem. 2012, 421, 203–207. [Google Scholar] [CrossRef]
  64. Vitvitsky, V.; Kabil, O.; Banerjee, R. High turnover rates for hydrogen sulfide allow for rapid regulation of its tissue concentrations. Antioxid. Redox Signal. 2012, 17, 22–31. [Google Scholar] [CrossRef] [Green Version]
  65. Hill, B.C.; Woon, T.C.; Nicholls, P.; Peterson, J.; Greenwood, C.; Thomson, A.J. Interactions of sulphide and other ligands with cytochrome c oxidase. An electron-paramagnetic-resonance study. Biochem. J. 1984, 224, 591–600. [Google Scholar] [CrossRef] [PubMed]
  66. Goubern, M.; Andriamihaja, M.; Nubel, T.; Blachier, F.; Bouillaud, F. Sulfide, the first inorganic substrate for human cells. FASEB J. 2007, 21, 1699–1706. [Google Scholar] [CrossRef]
  67. Mackenzie, J.S.; Lamprecht, D.A.; Asmal, R.; Adamson, J.H.; Borah, K.; Beste, D.J.V.; Lee, B.S.; Pethe, K.; Rousseau, S.; Krieger, I.; et al. Bedaquiline reprograms central metabolism to reveal glycolytic vulnerability in Mycobacterium tuberculosis. Nat. Commun. 2020, 11, 6092. [Google Scholar] [CrossRef] [PubMed]
  68. Yu, W.-B.; Pan, Q.; Ye, B.-C. Glucose-induced cyclic lipopeptides resistance in bacteria via ATP maintenance through enhanced glycolysis. iScience 2019, 21, 135–144. [Google Scholar] [CrossRef] [PubMed] [Green Version]
  69. Vestergaard, M.; Nohr-Meldgaard, K.; Bojer, M.S.; Krogsgard Nielsen, C.; Meyer, R.L.; Slavetinsky, C.; Peschel, A.; Ingmer, H. Inhibition of the ATP synthase eliminates the intrinsic resistance of Staphylococcus aureus towards polymyxins. mBio 2017, 8, e01114–e01117. [Google Scholar] [CrossRef] [Green Version]
  70. Saini, V.; Cumming, B.M.; Guidry, L.; Lamprecht, D.A.; Adamson, J.H.; Reddy, V.P.; Chinta, K.C.; Mazorodze, J.H.; Glasgow, J.N.; Richard-Greenblatt, M. Ergothioneine maintains redox and bioenergetic homeostasis essential for drug susceptibility and virulence of Mycobacterium tuberculosis. Cell Rep. 2016, 14, 572–585. [Google Scholar] [CrossRef] [Green Version]
  71. Yano, T.; Kassovska-Bratinova, S.; Teh, J.S.; Winkler, J.; Sullivan, K.; Isaacs, A.; Schechter, N.M.; Rubin, H. Reduction of clofazimine by mycobacterial type 2 NADH:quinone oxidoreductase: A pathway for the generation of bactericidal levels of reactive oxygen species. J. Biol. Chem. 2011, 286, 10276–10287. [Google Scholar] [CrossRef] [Green Version]
  72. Piccaro, G.; Pietraforte, D.; Giannoni, F.; Mustazzolu, A.; Fattorini, L. Rifampin induces hydroxyl radical formation in Mycobacterium tuberculosis. Antimicrob. Agents Chemother. 2014, 58, 7527–7533. [Google Scholar] [CrossRef] [Green Version]
  73. Ng, S.Y.; Ong, K.X.; Surendran, S.T.; Sinha, A.; Lai, J.J.H.; Chen, J.; Liang, J.; Tay, L.K.S.; Cui, L.; Loo, H.L.; et al. Hydrogen Sulfide Sensitizes Acinetobacter baumannii to Killing by Antibiotics. Front. Microbiol. 2020, 11, 1875. [Google Scholar] [CrossRef] [PubMed]
Figure 1. Mycobacterial species produce H2S. (a) Detection of H2S in the headspace of cultures of mycobacterial species using lead acetate strips. Msm: M. smegmatis; BCG: M. bovis BCG; Mbo: M. bovis; Mtb: Mtb H37Rv; CDC: Mtb CDC1551; MDR: multi-drug resistant; DS: drug-sensitive clinical strains of Mtb. Note that strips shown, ((a) top insert) were scanned after 48 h of incubation. The inkwell bottles shown are representative of an independent experiment after 72 h of incubation. (b) Estimation of H2S production by quantifying lead sulfide staining ((a) top insert) using densitometric analysis. Data normalized to the optical density (OD600) of each culture, (n = 3). (c) Microplate-based BC assay showing H2S production by live and heat-killed Mtb H37Rv. Time course measurement of H2S production using a BC assay for (d) intact Mtb H37Rv cells, (n = 5–8) and (e) lysates with different concentrations of Cys, (n = 3–4). BC assay of (f) intact Mtb H37Rv cells (n = 3–5) and (g) Mtb H37Rv lysates in the presence of AOAA showing reduced H2S production, (n = 4). No significant inhibition of H2S production for (h) intact Mtb H37Rv cells (n = 3–4) and (i) lysates was demonstrated in the presence of PAG, (n = 4). A Unisense A/S H2S microsensor was used to measure the H2S concentration in (j) Mtb H37Rv cultures and bacteria-free supernatants, (n = 4). Microsensor measurements of real-time H2S production in Mtb H37Rv lysates in assay buffer (0.2 M triethanolamine–HCl, pH 8.0; 10 µM PLP, 10 mM EDTA) with (k) 20 mM L-Cys, (l) stepwise addition of L-Cys (arrows indicate the amount of Cys [mM] added at the time point) and (m) 20 mM L-Cys followed by the addition of Mtb lysate preincubated with AOAA (4 mM). Representative experiments are shown; each experiment was repeated at least twice. Data represent the mean ± SD from the indicated n (number of replicates per data set) except for (k,l,m) which show representative real-time measurements for one sample with 2–3 independent repeats. All p-values are relative to untreated controls or as indicated. Statistical analyses were performed using GraphPad Prism 8.4.3. One-way ANOVA with Dunnett’s multiple comparisons test was used to determine statistical significance. # p < 0.0001.
Antioxidants 10 01285 g001
Figure 2. Identification of H2S-producing enzymes in Mtb. (a) Equal quantities of mycobacterial lysates were resolved on a native polyacrylamide gel (PAGE) and assayed for H2S production by an in-gel BC assay. The arrow indicates the predominant H2S-producing enzyme, upper band, for most mycobacterial species except for Msm. (b) The effect of PLP and AOAA on the production of H2S in Mtb H37Rv lysate using an in-gel BC assay. All lanes were loaded with equal amounts of lysate (n = 2–3). (c) Identification of Rv3684 from Mtb lysate resolved by native PAGE. Trypsin-digested peptide fragments of Rv3684 were identified using LC-MS/MS. The locations of the observed peptide fragments (blue and pink regions within the full-length peptide map) and their amino acid sequences are shown. PSM: peptide spectrum matches; MH+ (Da): protonated, monoisotopic mass of the peptide. Retention time of each LC-MS/MS identified peptide of Rv3684 are shown (right panel, (c)). (d) Schematic showing H2S-generating enzymes and their reactions in the reverse transsulfuration pathway. (e) SDS-PAGE analysis of eluted fractions of purified His-tagged Rv3684 expressed in E. coli. (f) LC-MS/MS identification and quantification of pyruvate from Rv3684 using L-Cys (10 mM) as a substrate, (n = 3). (g) Michaelis–Menten plot of the initial reaction velocity as a function of Cys concentration used to determine the Km and kcat of purified Rv3684. H2S-producing activity of purified Cds1 (Rv3684) using a BC assay, (n = 4). (h) Proposed catalytic activity of Cds1 using Cys as a substrate. Representative experiments are shown; each experiment was repeated at least twice. Data represent the mean ± SD from the indicated n (number of replicates per data set).
Antioxidants 10 01285 g002
Figure 3. Deletion of rv3684 in Mtb reduces H2S production. (a) The proposed operonic location of rv3684. Bacterial lysates resolved on native polyacrylamide gels (PAGE) were assayed for H2S production using an in-gel BC assay in (b) Mtb CDC1551, CDC Tn::rv3682, and CDC Tn::rv3683 (n = 3) and (c) Mtb H37Rv, ∆cds1, and comp, (n = 2). The arrow indicates the Cds1 band. (d) H2S production in intact Mtb H37Rv, ∆cds1, and comp cells (n = 8) and (e) lysates (n = 3–4) using the BC method (in the presence of 10 μM PLP and 20 mM L-Cys). (f) H2S production in Mtb H37Rv, ∆cds1, and comp lysates and (g) cells at 0, 4, and 6 h using the Unisense amperometric microsensor. (h) Growth (OD600) of Mtb H37Rv, ∆cds1, and comp cultures after 8 days in 0 and 4 mM L-Cys, (n = 3–4). (i) Phylogenetic tree of Cds1 (Rv3684) homologs in different Mycobacterium sp. and other bacteria (NCBI protein accession number) and >65% amino acid identity with Cds1. (j) Putative sulfur metabolism proteins in Mtb H37Rv (NCBI protein accession number and the percent identity with Cds1 provided). Representative experiments are shown in each panel, each experiment was repeated at least twice. Data represent the mean ± SD or ± SEM (panel (e)) from the indicated n (number of replicates per data set). (f) The microsensor reading for a buffer baseline for a few min followed by addition of the lysate to initiate the reaction. (g) At least 10–20 amperometric measurements were taken for each strain and condition once the Unisense microsensor readings stabilized. Statistical analyses were performed using GraphPad Prism 8.4.3. One-way ANOVA with Dunnett’s multiple comparisons test was used to determine statistical significance. # p < 0.0001.
Antioxidants 10 01285 g003
Figure 4. Conferring H2S-producing activity to M. smegmatis. (a) Equal quantities of bacterial lysates from Mtb H37Rv, Msm, and cds1-expressing Msm–wtpcds1 and Msm–hsp60cds1 cells were resolved on native polyacrylamide gels (PAGE) and assayed for H2S production using an in-gel BC assay, (n = 2). (b) BC assay of H2S production in Msm lysates. pMV261-Msm transformed with an empty pMV261 vector (Msm-pMV261) and a buffer–lysate suspension buffer and BC solution, (n = 4). (c) H2S production in Msm lysates using the Unisense amperometric microsensor. The microsensor readings were allowed to measure a buffer baseline for 5 min followed by addition of the lysate to initiate the reaction. (d) Time course of H2S production in intact Msm cells in the presence of 0 and 10 mM L-Cys in the BC assay, (n = 4). (e) H2S production in intact Msm cells in the presence of 0, 1, 10, and 20 mM L-Cys after 140 min in the BC assay, (n = 4). (f) Growth kinetics (OD600) of Msm strains in Cys-containing media, (n = 3). (g) Relative percent growth of Msm strains in L-Cys-containing media after 48 h, (n = 3). Representative experiments are shown; each experiment was repeated at least twice. Data represent the mean ± SD or ± SEM (d,f) from the indicated n (number of replicates per data set). Statistical analysis was performed using GraphPad Prism 8.4.3. One-way ANOVA (b) and two-way ANOVA (d,f), and Dunnett’s multiple comparisons test were used to determine statistical significance. *** p < 0.001, # p < 0.0001.
Antioxidants 10 01285 g004
Figure 5. Endogenous H2S stimulates respiration in Mtb. Mtb respiration was measured using an Agilent Seahorse XFe96 Analyzer. (a) An OCR profile showing the basal respiration of Mtb strains (n = 5–7), (b) %OCR of Mtb upon addition of Cys (n = 3–5), (c) fold OCR of Mtb strains relative to media control in the presence of 4 mM Cys (n = 3–7), (d) %OCR of Mtb with sequential injection of Cys and AOAA (1 mM) or media (Med) as a control (n = 3), and (e) measurement of H2S concentration in an OASS enzymatic activity assay using the Unisense H2S microsensor. H2S levels rapidly diminished after addition of OASS and substrate O-acetyl-L-serine (OAS). (f) %OCR of Mtb after injecting either Cys or OAS or Cys, OAS, and OASS, (n = 3–4). (g) %OCR of Mtb after injecting either Cys or Cys and OAS, (n = 3–4). (h) Model showing how H2S stimulates respiration via both oxidases (dotted-line arrows) and how respiration was reduced by the exogenous addition of the H2S-consuming enzyme OASS and endogenous CysK1. Red “X”: inhibition: blue arrow: increased OCR. (i) Model showing electron flow through Complex I to the menaquinone pool (MK) and then through Complex III/IV (cytochrome bc1/aa3) or re-routing of electrons through cytochrome bd if Complex III/IV was inhibited by Q203. This contributes to the proton-motive force that powers ATP synthesis by Complex V (ATP synthase). The OCR profiles of WT Mtb (j,l) or ΔcydAB cells (k,m) exposed to Cys or Cys and Q203 (300 × MIC50), (n = 3). Representative experiments are shown; each experiment was repeated at least twice. Data represent the mean ± SEM or ± SD (a) from the indicated n (number of replicates per data set). Statistical analysis was performed using GraphPad Prism 8.4.3. One-way ANOVA with Dunnett’s multiple comparisons test (unpaired t-test for panel (d)) was used to determine statistical significance. * p < 0.05, ** p < 0.01, *** p < 0.001, # p < 0.0001.
Antioxidants 10 01285 g005
Figure 6. Cds1 regulates sulfur metabolism in Mtb. Schematic (center) showing metabolites in the transsulfuration pathway (black) linked with the glycolysis and TCA cycle (blue). LC-MS/MS analysis of metabolites in Mtb strains cultured in 7H9 medium with [U-13C]-Cys (100 µM) (ag) or [U-13C]-glucose (0.2%) (hm). Representative experiments are shown; each experiment was repeated at least twice. Data represent the mean ± SEM for n = 3–5 biological replicates. Statistical analysis was performed using GraphPad Prism 8.4.3. Two-way ANOVA with Dunnett’s multiple comparisons test was used to determine statistical significance. * p < 0.05, ** p < 0.01, *** p < 0.001, and **** p < 0.0001.
Antioxidants 10 01285 g006
Figure 7. Cds1 regulates central metabolism in Mtb. Cds1 in Mtb regulates amino acids (turquoise), Cys (red), and glycolysis and TCA cycle metabolites (blue). LC-MS/MS analysis of (a) amino acids, (b) glycolysis, the pentose phosphate pathway, and the TCA cycle metabolites is indicated by heat maps (top) and total abundance. Mtb strains were cultured in 7H9 medium with [U-13C]-Cys (100 µM). (c) ATP levels measured in Mtb strains with (+) and without (−) 100 mM Cys. Representative experiments are shown; each experiment was repeated at least twice. Data represent the mean ± SEM for n = 3–5 biological replicates. Statistical analysis was performed using GraphPad Prism 8.4.3. Two-way ANOVA (a,b) or one-way ANOVA (c), Dunnett’s multiple comparisons test were used to determine statistical significance. * p < 0.05, ** p < 0.01, *** p < 0.001, **** p < 0.0001.
Antioxidants 10 01285 g007
Figure 8. Endogenous H2S in Mtb exacerbates the effect of oxidative stress and increases susceptibility to CFZ: (a) Intracellular ROI levels shown as the percent of DHE-positive Mtb cultured in 7H9 media supplemented with or without catalase, (n = 4–5). (b) LC-MS/MS analysis showing total abundance and carbon isotopologue distribution of EGT and MSH in Mtb strains cultured in [U-13C]-glucose, (n = 3–5). (c) Intracellular ROI levels after exposure to 0.25 mM cumene hydroperoxide (CHP) for 16 h, (n = 4). (d) Survival of bacilli after exposure to 0.25 mM CHP for 16 h, (n = 3). Bacilli were treated with clofazimine (CFZ) at 60× MIC and observed for (e) ROI levels after 24 h of treatment, (n = 5) and (f) survival after 8 days of treatment, (n = 3). CFU of Mtb after exposure to different amounts of NaHS with or without 60× MIC of CFZ for 5 days (g) or 11 days (h), (n = 3). (i) Survival of Mtb after exposure to different amounts of NaHS with or without RIF (60× MIC) or INH (60× MIC) for 5 days, (n = 3). (j) Diagram showing endogenous H2S production in Mtb leading to increased respiration (OXPHOS) and suppression of glycolysis. Indicated, also, is recycling of H2S to generate Cys, which regulates redox balance via MSH and EGT. Red arrows pointing up: increase; down: decrease. Thick/thin blue arrows: more/less pronounced effects, respectively. Representative experiments are shown; each experiment was repeated at least twice. Data represent the mean ± SD (mean ± SEM for panel (b)) from the indicated n (number of biological replicates). Statistical analysis and data presentation performed using GraphPad Prism 8.4.3. One-way ANOVA with Tukey’s (a,e,i) or Dunnett’s (c,g,h) multiple comparisons test were used to determine statistical significance. Two-way ANOVA with Tukey’s multiple comparisons test was used to determine statistical significance for (b,d,f). * p < 0.05, ** p < 0.01, *** p < 0.001, **** p < 0.0001, # p < 0.0001; nd = not detected.
Antioxidants 10 01285 g008
Publisher’s Note: MDPI stays neutral with regard to jurisdictional claims in published maps and institutional affiliations.

