
Revisiting Multifactor Models of Dyslexia: Do They Fit Empirical Data and What Are Their Implications for Intervention?

Abstract
:1. Introduction
1.1. Single- and Multiple-Deficit Models of DD
1.2. Multiple-Deficit Models of DD as a Non-Unitary Concept
1.3. The Multifactor-Interactive Model (MFi-M) of DD
2. Materials and Methods
2.1. Participants
2.2. Materials
- Text reading: “Prove di Rapidità e Correttezza nella Lettura del gruppo MT” (“Test for Speed and Accuracy in Reading, developed by the MT group” [61,62]. This test assesses reading abilities for meaningful material. It provides separate scores for speed and accuracy. Texts increase in complexity with grade level. Norms are provided for each text. Validity and reliability for the MT text reading test are reported to be satisfactory without further specifications.
- Single word/nonword reading: “DDE-2: Batteria per la Valutazione della Dislessia e Disortografia Evolutiva-2” (Assessment Battery for Developmental Reading and Spelling Disorders-2; Refs. [63,64]). The battery assesses speed and accuracy (expressed in number of errors) in reading word lists (4 lists of 24 words) and nonword lists (3 lists of 16 nonwords) and provides grade norms from grade 2 of primary school to grade 3 of junior high school (corresponding to the 8th year of schooling). The DDE word and nonword reading test has an adequate reliability (mean test–retest coefficients are 0.77 for speed and 0.56 for accuracy).
- IQ tests: Cattell’s non-verbal, Culture Fair Test, Scale 2, Form A [65] was administered. The children whose scores were below 90 were further tested with the Wechsler Scale (the Italian versions of WISC-R [66] or WISC-III [67], depending on the year of testing), and non-verbal IQ was recorded. Only children whose non-verbal IQ was above 70 on the Wechsler scale were included in the database. For the purposes of the present study, IQ scores were converted into z-scores.
- Memory. “Test di Memoria e Apprendimento” (TEMA; Italian adaptation of TOMAL, Test of Memory and Learning; [68]) was used to assess short-term memory and working memory. Verbal short-term memory was assessed by means of immediate serial recall (span) of letters (forward letter span). Working memory was evaluated by backward recall of letters (backward letter span). The number of letters correctly recalled in the correct sequence was recorded. Age norms are provided. This test was administered to a total of 257 children.
- Rapid automatized naming: “Denominazione Rapida”—RAN [69]). Participants were shown 50 stimuli printed on paper, arranged in a 5 × 10 matrix, and were instructed to accurately name each stimulus as quickly as possible, in reading order (left to right, top to bottom). Two matrices were presented. One matrix contained color stimuli (squares: black, yellow, green, red and blue), another contained objects (figures: star, dog, pear, train and hand). The time needed to name all the elements of each matrix was measured by means of a stopwatch. Naming errors and omissions were also noted. Before the test, a practice trial was run with a smaller matrix (20 items). Two raw scores were recorded: speed, expressed in seconds, and accuracy, expressed in number of naming errors. Z-scores based on grade norms were calculated. This test was administered to a total of 55 children.
- Visual search. “Ricerca Visiva” (visual search—VS) [69] was used to assess speed and accuracy in visual search for familiar stimuli (figures, digits). Two matrices (10 rows of 5 stimuli each) for each kind of stimulus were presented and the child was requested to cancel one of the stimuli (the number “7” and the figure “star”) presented in the matrix as quickly and as accurately as possible. Two raw scores were recorded: speed, expressed in seconds, and accuracy, expressed in number of cancellation errors. Z-scores based on grade norms were calculated. This test was administered to a total of 55 children (the same who had undergone assessment with the RAN test).
- Phonological awareness: Two tests of phonemic awareness [70]. (i) Phonemic Elision: the test assesses the ability to recognize and isolate the phonemic constituents of 20 words (in this specific case, the initial constituents). The child was asked to delete the first two phonemes in the word read by the examiner and to report the resulting nonword. (ii) Phoneme Blending: this task assesses the capacity to derive a phonemic pattern from distinct phonemic units. The examiner presented each of 20 words letter by letter and the child was requested to identify and report the resulting word. For both tasks, the scores refer to the total number of errors, converted into z-scores. This test was administered to the total sample of 266 children.
2.3. Data Analysis
3. Results
4. Discussion
4.1. Theoretical Implications
4.2. Practical and Clinical Implications
4.3. Further Directions and Developments
5. Conclusions
Author Contributions
Funding
Institutional Review Board Statement
Informed Consent Statement
Data Availability Statement
Conflicts of Interest
Appendix A

References
- World Health Organization. International Statistical Classification of Diseases and Related Health Problems—10th Revision; World Health Organization: Geneva, Switzerland, 2011. [Google Scholar]
- Ring, J.; Black, J.L. The multiple deficit model of dyslexia: What does it mean for identification and intervention? Ann. Dyslexia 2018, 68, 104–125. [Google Scholar] [CrossRef]
- Ramus, F.; Rosen, S.; Dakin, S.C.; Day, B.L.; Castellote, J.M.; White, S.; Frith, U. Theories of developmental dyslexia: Insights from a multiple case study of dyslexic adults. Brain 2003, 126, 841–865. [Google Scholar] [CrossRef] [PubMed]
- Kibby, M.Y.; Marks, W.; Morgan, S.; Long, C.J. Specific Impairment in Developmental Reading Disabilities: A Working Memory Approach. J. Learn. Disabil. 2004, 37, 349–363. [Google Scholar] [CrossRef] [PubMed]
- Trecy, M.P.; Steve, M.; Martine, P. Impaired short-term memory for order in adults with dyslexia. Res. Dev. Disabil. 2013, 34, 2211–2223. [Google Scholar] [CrossRef] [PubMed]
- Jeffries, S.; Everatt, J. Working memory: Its role in dyslexia and other specific learning difficulties. Dyslexia 2004, 10, 196–214. [Google Scholar] [CrossRef]
- Menghini, D.; Carlesimo, G.A.; Marotta, L.; Finzi, A.; Vicari, S. Developmental dyslexia and explicit long-term memory. Dyslexia 2010, 16, 213–225. [Google Scholar] [CrossRef]
- Stein, J. The current status of the magnocellular theory of developmental dyslexia. Neuropsychologia 2019, 130, 66–77. [Google Scholar] [CrossRef]
- Wright, C.M.; Conlon, E.G. Auditory and Visual Processing in Children with Dyslexia. Dev. Neuropsychol. 2009, 34, 330–355. [Google Scholar] [CrossRef]
- Habib, M. The neurological basis of developmental dyslexia and related disorders: A reappraisal of the temporal hypothesis, twenty years on. Brain Sci. 2021, 11, 708. [Google Scholar] [CrossRef]
- Lobier, M.; Zoubrinetzky, R.; Valdois, S. The visual attention span deficit in dyslexia is visual and not verbal. Cortex 2012, 48, 768–773. [Google Scholar] [CrossRef]
- Facoetti, A.; Paganoni, P.; Lorusso, M.L. The spatial distribution of visual attention in developmental dyslexia. Exp. Brain Res. 2000, 132, 531–538. [Google Scholar] [CrossRef] [PubMed]
- Vidyasagar, T. Neural underpinnings of dyslexia as a disorder of visuo-spatial attention. Clin. Exp. Optom. 2004, 87, 4–10. [Google Scholar] [CrossRef] [PubMed]
- Vellutino, F.R.; Fletcher, J.M.; Snowling, M.J.; Scanlon, D.M. Specific reading disability (dyslexia): What have we learned in the past four decades? J. Child. Psychol. Psychiatry 2004, 45, 2–40. [Google Scholar] [CrossRef] [PubMed]
- Snowling, M.J. Dyslexia; Blackwell: Oxford, UK, 2000. [Google Scholar]
- Ziegler, J.C.; Goswami, U. Reading Acquisition, Developmental Dyslexia, and Skilled Reading Across Languages: A Psycholinguistic Grain Size Theory. Psychol. Bull. 2005, 131, 3–29. [Google Scholar] [CrossRef] [PubMed]
- Ramus, F.; White, S.; Frith, U. Weighing the evidence between competing theories of dyslexia. Dev. Sci. 2006, 9, 265–269. [Google Scholar] [CrossRef]
- Share, D.L. Common Misconceptions about the Phonological Deficit Theory of Dyslexia. Brain Sci. 2021, 11, 1510. [Google Scholar] [CrossRef]
- Snowling, M.J.; Hulme, C.; Nation, K. Defining and understanding dyslexia: Past, present and future. Oxf. Rev. Educ. 2020, 46, 501–513. [Google Scholar] [CrossRef]
- Melby-Lervåg, M.; Lyster, S.-A.H.; Hulme, C. Phonological skills and their role in learning to read: A meta-analytic review. Psychol. Bull. 2012, 138, 322–352. [Google Scholar] [CrossRef]
- Shaywitz, B.A.; Shaywitz, S.E.; Fullbright, R.K.; Skludarski, P.; Mencl, W.E.; Constable, R.T.; Pugh, K.R.; Holahan, J.M.; Marchione, K.E.; Fletcher, J.; et al. Neural systems for compensation and persistence: Young adult outcome of childhood reading disability. Soc. Biol. Psychiatry 2003, 54, 25–33. [Google Scholar] [CrossRef]
- Stein, J.; Walsh, V. To see but not to read; the magnocellular theory of dyslexia. Trends Neurosci. 1997, 20, 147–152. [Google Scholar] [CrossRef] [PubMed]
- Stein, J. Visual motion sensitivity and reading. Neuropsychologia 2003, 41, 1785–1793. [Google Scholar] [CrossRef] [PubMed]
- Badzakova-Trajkov, G.; Hamm, J.P.; Waldie, K.E. The effects of redundant stimuli on visuospatial processing in de-velopmental dyslexia. Neuropsychologia 2005, 43, 473–478. [Google Scholar] [CrossRef]
- Henderson, L.; Barca, L.; Ellis, A.W. Interhemispheric cooperation and non-cooperation during word recognition: Evidence for callosal transfer dysfunction in dyslexic adults. Brain Lang. 2007, 103, 276–291. [Google Scholar] [CrossRef]
- Monaghan, P.; Shillcock, R. Hemispheric dissociation and dyslexia in a computational model of reading. Brain Lang. 2008, 107, 185–193. [Google Scholar] [CrossRef] [PubMed]
- Korkmaz, H.A.; Ari, F.; Erdogan, B.D.; Kalaycıoğlu, C. Interhemispheric transfer time differs between fast and slow healthy adult readers. Neuropsychologia 2022, 169, 108205. [Google Scholar] [CrossRef] [PubMed]
- Bradshaw, A.; Bishop, D.; Woodhead, Z.V.J. Testing the interhemispheric deficit theory of dyslexia using the visual half-field technique. Q. J. Exp. Psychol. 2019, 73, 1004–1016. [Google Scholar] [CrossRef]
- Pennington, B.F. From single to multiple deficit models of developmental disorders. Cognition 2006, 101, 385–413. [Google Scholar] [CrossRef]
- McGrath, L.M.; Pennington, B.F.; Shanahan, M.A.; Santerre-Lemmon, L.E.; Barnard, H.D.; Willcutt, E.G.; DeFries, J.C.; Olson, R.K. A multiple deficit model of reading disability and attention-deficit/hyperactivity disorder: Searching for shared cognitive deficits. J. Child Psychol. Psychiatry 2011, 52, 547–557. [Google Scholar] [CrossRef]
- McGrath, L.M.; Peterson, R.L.; Pennington, B.F. The Multiple Deficit Model: Progress, Problems, and Prospects. Sci. Stud. Read. 2020, 24, 7–13. [Google Scholar] [CrossRef]
- Menghini, D.; Finzi, A.; Benassi, M.; Bolzani, R.; Facoetti, A.; Giovagnoli, S.; Ruffino, M.; Vicari, S. Different underlying neurocognitive deficits in developmental dyslexia: A comparative study. Neuropsychologia 2010, 48, 863–872. [Google Scholar] [CrossRef]
- Engelhardt, P.E. Developmental Dyslexia: Where Do We Go from Here? Brain Sci. 2020, 10, 151. [Google Scholar] [CrossRef] [PubMed]
- Moll, K.; Loff, A.; Snowling, M.J. Cognitive Endophenotypes of Dyslexia. Sci. Stud. Read. 2013, 17, 385–397. [Google Scholar] [CrossRef]
- Moll, K.; Snowling, M.J.; Hulme, C. Introduction to the Special Issue “Comorbidities between Reading Disorders and Other Developmental Disorders”. Sci. Stud. Read. 2020, 24, 1–6. [Google Scholar] [CrossRef]
- Ozernov-Palchik, O.; Yu, X.; Wang, Y.; Gaab, N. Lessons to be learned: How a comprehensive neurobiological framework of atypical reading development can inform educational practice. Curr. Opin. Behav. Sci. 2016, 10, 45–58. [Google Scholar] [CrossRef] [PubMed]
- Catts, H.W.; McIlraith, A.; Bridges, M.S.; Nielsen, D.C. Viewing a phonological deficit within a multifactorial model of dyslexia. Read. Writ. 2017, 30, 613–629. [Google Scholar] [CrossRef]
- Pennington, B.F.; Santerre-Lemmon, L.; Rosenberg, J.; MacDonald, B.; Boada, R.; Friend, A.; Leopold, D.R.; Samuelsson, S.; Byrne, B.; Willcutt, E.G.; et al. Individual prediction of dyslexia by single versus multiple deficit models. J. Abnorm. Psychol. 2012, 121, 212–224. [Google Scholar] [CrossRef]
- Strong, G.K.; Torgerson, C.J.; Torgerson, D.; Hulme, C. A systematic meta-analytic review of evidence for the effectiveness of the ‘Fast ForWord’ language intervention program. J. Child Psychol. Psychiatry 2011, 52, 224–235. [Google Scholar] [CrossRef]
- Galuschka, K.; Ise, E.; Krick, K.; Schulte-Körne, G. Effectiveness of Treatment Approaches for Children and Adolescents with Reading Disabilities: A Meta-Analysis of Randomized Controlled Trials. PLoS ONE 2014, 9, e89900. [Google Scholar] [CrossRef]
- Hall, C.; Dahl-Leonard, K.; Cho, E.; Solari, E.J.; Capin, P.; Conner, C.L.; Henry, A.R.; Cook, L.; Hayes, L.; Vargas, I.; et al. Forty Years of Reading Intervention Research for Elementary Students with or at Risk for Dyslexia: A Systematic Review and Meta-Analysis. Read. Res. Q. 2022. [Google Scholar] [CrossRef]
- Toffalini, E.; Giofrè, D.; Pastore, M.; Carretti, B.; Fraccadori, F.; Szűcs, D. Dyslexia treatment studies: A systematic review and suggestions on testing treatment efficacy with small effects and small samples. Behav. Res. Methods 2021, 53, 1954–1972. [Google Scholar] [CrossRef]
- Perdue, M.V.; Mahaffy, K.; Vlahcevic, K.; Wolfman, E.; Erbeli, F.; Richlan, F.; Landi, N. Reading intervention and neuroplasticity: A systematic review and meta-analysis of brain changes associated with reading intervention. Neurosci. Biobehav. Rev. 2022, 132, 465–494. [Google Scholar] [CrossRef]
- Heim, S.; Pape-Neumann, J.; van Ermingen-Marbach, M.; Brinkhaus, M.; Grande, M. Shared vs. specific brain activation changes in dyslexia after training of phonology, attention, or reading. Brain Struct. Funct. 2015, 220, 2191–2207. [Google Scholar] [CrossRef] [PubMed]
- Verwimp, C.; Tijms, J.; Snellings, P.; Haslbeck, J.M.B.; Wiers, R.W. A network approach to dyslexia: Mapping the reading network. In Development and Psychopathology; Cambridge University Press: Cambridge, UK, 2021; pp. 1–15. [Google Scholar] [CrossRef]
- Ramus, F.; Marshall, C.R.; Rosen, S.; van der Lely, H.K. Phonological deficits in specific language impairment and developmental dyslexia: Towards a multidimensional model. Brain 2013, 136, 630–645. [Google Scholar] [CrossRef] [PubMed]
- Catts, H.W.; Petscher, Y. A Cumulative Risk and Resilience Model of Dyslexia. J. Learn. Disabil. 2022, 55, 171–184. [Google Scholar] [CrossRef] [PubMed]
- Van Viersen, S.; De Bree, E.H.; Kroesbergen, E.H.; Slot, E.M.; De Jong, P.F. Risk and protective factors in gifted children with dyslexia. Ann. Dyslexia 2015, 65, 178–198. [Google Scholar] [CrossRef]
- Van Bergen, E.; De Jong, P.F.; Maassen, B.; van der Leij, A. The effect of parents’ literacy skills and children’s pre-literacy skills on the risk of dyslexia. J. Abnorm. Child Psychol. 2014, 42, 1187–1200. [Google Scholar] [CrossRef]
- Van Bergen, E.; van der Leij, A.; de Jong, P.F. The intergenerational multiple deficit model and the case of dyslexia. Front. Hum. Neurosci. 2014, 8, 346. Available online: https://www.frontiersin.org/articles/10.3389/fnhum.2014.00346 (accessed on 8 February 2023). [CrossRef]
- Boada, R.; Willcutt, E.G.; Pennington, B.F. Understanding the comorbidity between dyslexia and attention-deficit/hyperactivity disorder. Top. Lang. Disord. 2012, 32, 264–284. [Google Scholar] [CrossRef]
- Slot, E.M.; Van Viersen, S.; De Bree, E.H.; Kroesbergen, E.H. Shared and Unique Risk Factors Underlying Mathematical Disability and Reading and Spelling Disability. Front. Psychol. 2016, 7, 803. [Google Scholar] [CrossRef]
- Dębska, A.; Łuniewska, M.; Zubek, J.; Chyl, K.; Dynak, A.; Dzięgiel-Fivet, G.; Plewko, J.; Jednoróg, K.; Grabowska, A. The cognitive basis of dyslexia in school-aged children: A multiple case study in a transparent orthography. Dev. Sci. 2022, 25, e13173. [Google Scholar] [CrossRef]
- Coltheart, M.; Rastle, K.; Perry, C.; Langdon, R.; Ziegler, J. DRC: A dual route cascaded model of visual word recognition and reading aloud. Psychol. Rev. 2001, 108, 204–256. [Google Scholar] [CrossRef]
- Bouma, H. Visual recognition of isolated lower-case letters. Vis. Res. 1971, 11, 459–474. [Google Scholar] [CrossRef]
- Pelli, D.G.; Farell, B.; Moore, D.C. The remarkable inefficiency of word recognition. Nature 2003, 423, 752–756. [Google Scholar] [CrossRef]
- McClelland, J.L.; Rumelhart, D.E. An interactive activation model of context effects in letter perception: I. An account of basic findings. Psychol. Rev. 1981, 88, 375. [Google Scholar] [CrossRef]
- DeLong, K.A.; Troyer, M.; Kutas, M. Pre-Processing in Sentence Comprehension: Sensitivity to Likely Upcoming Meaning and Structure. Lang. Linguist. Compass 2014, 8, 631–645. [Google Scholar] [CrossRef] [PubMed]
- Smith, N.J.; Levy, R. The effect of word predictability on reading time is logarithmic. Cognition 2013, 128, 302–319. [Google Scholar] [CrossRef]
- Heim, S.; Tschierse, J.; Amunts, K.; Wilms, M.; Vossel, S.; Willmes, K.; Grabowska, A.; Huber, W. Cognitive subtypes of dyslexia. Acta Neurobiol. Exp. 2008, 68, 73. [Google Scholar]
- Cornoldi, C.; Colpo, G. Nuove Prove di Lettura MT [New MT Reading test]; Giunti O.S: Florence, SC, USA, 1998. [Google Scholar]
- Cornoldi, C.; Colpo, G.; Gruppo, M.T. Prove Oggettive MT di Lettura [MT Reading Tests]; Organizzazioni Speciali: Firenze, Italy, 2001. [Google Scholar]
- Sartori, G.; Job, R.; Tressoldi, P.E. Batteria per la Valutazione della Dislessia e della Disortografia Evolutiva; Organizzazioni Speciali: Firenze, Italy, 1995. [Google Scholar]
- Sartori, G.; Job, R.; Tressoldi, P.E. DDE-2: Batteria per la Valutazione della Dislessia e della Disortografia Evolutiva—2, Seconda Edizione [Battery for the assessment of developmental dyslexia and dysorthographia], 2nd ed.; Giunti, O.S., Ed.; Organizzazioni Speciali: Firenze, Italy, 2007. [Google Scholar]
- Cattell, R.B.; Cattell, A.K.S. Culture Fair: Una Piccola Batteria di Test per la Misura del Fattore g; Organizzazioni Speciali: Firenze, Italy, 1981. [Google Scholar]
- Wechsler, D. Scala di Intelligenza Wechsler per Bambini–Riveduta; Organizzazioni Speciali: Firenze, Italy, 1986. [Google Scholar]
- Orsini, A.; Picone, L. WISC-III: Wechsler Intelligence Scale for Children Adattamento Italiano; Giunti OS: Florence, Italy, 2006. [Google Scholar]
- Reynolds, C.R.; Bigler, E.D. Test of Memory and Learning (TOMAL); PRO-ED: Austin, TX, USA, 1994. [Google Scholar]
- De Luca, M.; Di Filippo, G.; Judica, A.; Spinelli, D.; Zoccolotti, P. Test di Denominazione Rapida e Ricerca Visiva di Colori, Figure e numeri; IRCCS Fondazione Santa Lucia: Roma, Italy, 2005. [Google Scholar]
- Cossu, G.; Shankweiler, D.; Liberman, I.Y.; Katz, L.; Tola, G. Awareness of phonological segments and reading ability in Italian children. Appl. Psycholinguist. 1988, 9, 1–16. [Google Scholar] [CrossRef]
- The Jamovi Project. Jamovi (Version 2.2) [Computer Software]. 2021. Available online: https://www.jamovi.org (accessed on 8 February 2023).
- Dmitrienko, A.; Bretz, F.; Westfall, P.H.; Troendle, J.; Wiens, B.L.; Tamhane, A.C.; Hsu, J.C. Multiple testing methodology. In Multiple Testing Problems in Pharmaceutical Statistics, 1st ed.; Dmitrienko, A., Tamhane, A., Bret, F.Z., Eds.; Chapman & Hall/CRC Biostatistics Series: Boca Raton, FL, USA, 2010; pp. 35–41. [Google Scholar]
- Dienes, Z. Using Bayes to get the most out of non-significant results. Front. Psychol. 2014, 5, 781. [Google Scholar] [CrossRef] [PubMed]
- Hoenig, J.M.; Heisey, D.M. The Abuse of Power. Am. Stat. 2001, 55, 19–24. [Google Scholar] [CrossRef]
- Wolf, M.; Bowers, P.G. The double-deficit hypothesis for the developmental dyslexias. J. Educ. Psychol. 1999, 91, 415. [Google Scholar] [CrossRef]
- White, S.; Milne, E.; Rosen, S.; Hansen, P.; Swettenham, J.; Frith, U.; Ramus, F. The role of sensorimotor impairments in dyslexia: A multiple case study of dyslexic children. Dev. Sci. 2006, 9, 237–255. [Google Scholar] [CrossRef] [PubMed]
- Robertson, J.; Bakker, D.J. The balance model of reading and dyslexia. In Dyslexia and Literacy: Theory and Practice; Reid, G., Wearmouth, V., Eds.; John Wiley & Sons: Chichester, UK, 2002; pp. 99–114. [Google Scholar]
- Bakker, D.J. Treatment of developmental dyslexia: A review. Pediatr. Rehabil. 2006, 9, 3–13. [Google Scholar] [CrossRef]
- Waldie, K.E.; Haigh, C.E.; Badzakova-Trajkov, G.; Buckley, J.; Kirk, I.J. Reading the Wrong Way with the Right Hemisphere. Brain Sci. 2013, 3, 1060–1075. [Google Scholar] [CrossRef]
- Waldie, K.E.; Mosley, J.L. Developmental trends in right hemispheric participation in reading. Neuropsychologia 2000, 38, 462–474. [Google Scholar] [CrossRef]
- Shaywitz, B.A.; Skudlarski, P.; Holahan, J.M.; Marchione, K.E.; Constable, R.T.; Fulbright, R.K.; Zelterman, D.; Lacadie, C.; Shaywitz, S.E. Age-related changes in reading systems of dyslexic children. Ann. Neurol. 2007, 61, 363–370. [Google Scholar] [CrossRef] [PubMed]
- Turkeltaub, P.E.; Gareau, L.; Flowers, D.L.; Zeffiro, T.A.; Eden, G.F. Development of neural mechanisms for reading. Nat. Neurosci. 2003, 6, 767–773. [Google Scholar] [CrossRef]
- Maisog, J.M.; Einbinder, E.R.; Flowers, D.L.; Turkeltaub, P.E.; Eden, G.F. A meta-analysis of functional neuroimaging studies of dyslexia. Ann. N. Y. Acad. Sci. 2008, 1145, 237–259. [Google Scholar] [CrossRef] [PubMed]
- Kershner, J.R. Neuroscience and education: Cerebral lateralization of networks and oscillations in dyslexia. Laterality 2020, 25, 109–125. [Google Scholar] [CrossRef]
- Robertson, J. Neuropsychological Intervention in Dyslexia: Two Studies on British Pupils. J. Learn. Disabil. 2000, 33, 137–148. [Google Scholar] [CrossRef]
- Goldstein, B.H.; Obrzut, J.E. Neuropsychological Treatment of Dyslexia in the Classroom Setting. J. Learn. Disabil. 2001, 34, 276–285. [Google Scholar] [CrossRef]
- Koen, B.J.; Hawkins, J.; Zhu, X.; Jansen, B.; Fan, W.; Johnson, S. The Location and Effects of Visual Hemisphere-Specific Stimulation on Reading Fluency in Children with the Characteristics of Dyslexia. J. Learn. Disabil. 2018, 51, 399–415. [Google Scholar] [CrossRef]
- Lorusso, M.L.; Facoetti, A.; Molteni, M. Hemispheric, attentional, and processing speed factors in the treatment of developmental dyslexia. Brain Cogn. 2004, 55, 341–348. [Google Scholar] [CrossRef] [PubMed]
- Lorusso, M.L.; Facoetti, A.; Paganoni, P.; Pezzani, M.; Molteni, M. Effects of visual hemisphere-specific stimulation versus reading-focused training in dyslexic children. Neuropsychol. Rehabil. 2006, 16, 194–212. [Google Scholar] [CrossRef]
- Lorusso, M.L.; Facoetti, A.; Bakker, D.J. Neuropsychological Treatment of Dyslexia: Does Type of Treatment Matter? J. Learn. Disabil. 2011, 44, 136–149. [Google Scholar] [CrossRef] [PubMed]
- Van Strien, J.W.; Bouma, A.; Bakker, D.J. Lexical decision performances in P-type dyslexic, L-type dyslexic and normal reading boys. J. Clin. Exp. Neuropsychol. 1993, 15, 516–524. [Google Scholar] [CrossRef] [PubMed]
- Licht, R. Differences in word recognition between P- and L- type reading disability. In The Balance Model of Dyslexia: Theoretical and Clinical Progress; Licht, R., Spyer, G., Eds.; Van Gorcum: Assen, NL, USA, 1994. [Google Scholar]
- Masutto, C.; Bravar, L.; Fabbro, F. Neurolinguistic Differentiation of Children with Subtypes of Dyslexia. J. Learn. Disabil. 1994, 27, 520–526. [Google Scholar] [CrossRef] [PubMed]
- Smit-Glaudé, S.W.D.; van Strien, J.W.; Licht, R.; Bakker, D.J. Neuropsychological intervention in kindergarten children with subtyped risks of reading retardation. Ann. Dyslexia 2005, 55, 217–245. [Google Scholar] [CrossRef]
- Van der Schoot, M.; Licht, R.; Horsley, T.M.; Sergeant, J.A. Inhibitory deficits in reading disability depend on subtype: Guessers but not spellers. Child Neuropsychol. 2000, 6, 297–312. [Google Scholar] [CrossRef]
- Van Der Schoot, M.; Licht, R.; Horsley, T.M.; Sergeant, J.A. Fronto-Central Dysfunctions in Reading Disability Depend on Subtype: Guessers but not Spellers. Dev. Neuropsychol. 2002, 22, 533–564. [Google Scholar] [CrossRef] [Green Version]
- Licht, R. Reading disability subtypes: Cognitive and electrophysiological differences. In Learning Disabilities; Bakker, D., Van der Vlugt, H., Eds.; Swets & Zeitlinger: Lisse, The Netherlands, 1989; Volume 1. [Google Scholar]
- Bakker, D.J.; Van Strien, J.W.; Licht, R.; Smit-Glaudé, S.W.D. Cognitive brain potentials in kindergarten children with subtyped risks of reading retardation. Ann. Dyslexia 2007, 57, 99–111. [Google Scholar] [CrossRef] [PubMed]
- Fabbro, F.; Pesenti, S.; Facoetti, A.; Bonanomi, M.; Libera, L.; Lorusso, M.L. Callosal Transfer in Different Subtypes of Developmental Dyslexia. Cortex 2001, 37, 65–73. [Google Scholar] [CrossRef] [PubMed]
- Pipe, M.E. Developmental changes in finger localization. Neuropsychologia 1991, 29, 339–342. [Google Scholar] [CrossRef]
- Daini, R.; De Fabritiis, P.; Ginocchio, C.; Lenti, C.; Lentini, C.M.; Marzorati, D.; Lorusso, M.L. Revisiting strepho-symbolie: The connection between interhemispheric transfer and developmental dyslexia. Brain Sci. 2018, 8, 67. [Google Scholar] [CrossRef] [PubMed]
- Van Strien, J.W. Neuropsychological profiles of P- and L-type dyslexia. In Child Neuropsychology: Reading Disability and More; Licht, R., Bouma, A., Slot, W., Koops, W., Eds.; Eburon: Delft, NL, USA, 1998. [Google Scholar]
- Shany, M.; Share, D.L. Subtypes of reading disability in a shallow orthography: A double dissociation between accuracy-disabled and rate-disabled readers of Hebrew. Ann. Dyslexia 2010, 61, 64–84. [Google Scholar] [CrossRef]
- Shany, M.; Breznitz, Z. Rate- and Accuracy-Disabled Subtype Profiles Among Adults with Dyslexia in the Hebrew Orthography. Dev. Neuropsychol. 2011, 36, 889–913. [Google Scholar] [CrossRef]
- Beidas, H.; Khateb, A.; Breznitz, Z. The cognitive profile of adult dyslexics and its relation to their reading abilities. Read. Writ. 2013, 26, 1487–1515. [Google Scholar] [CrossRef]
- Lorusso, M.L.; Facoetti, A.; Toraldo, A.; Molteni, M. Tachistoscopic treatment of dyslexia changes the distribution of visual–spatial attention. Brain Cogn. 2005, 57, 135–142. [Google Scholar] [CrossRef]
- Lorusso, M.L.; Borasio, F.; Molteni, M. Remote Neuropsychological Intervention for Developmental Dyslexia with the Tachidino Platform: No Reduction in Effectiveness for Older Nor for More Severely Impaired Children. Children 2022, 9, 71. [Google Scholar] [CrossRef]
- Sperling, A.J.; Lu, Z.-L.; Manis, F.R.; Seidenberg, M.S. Deficits in perceptual noise exclusion in developmental dyslexia. Nat. Neurosci. 2005, 8, 862–863. [Google Scholar] [CrossRef]
- Spinelli, D.; De Luca, M.; Judica, A.; Zoccolotti, P. Crowding Effects on Word Identification in Developmental Dyslexia. Cortex 2002, 38, 179–200. [Google Scholar] [CrossRef] [PubMed]
- Romani, C.; Tsouknida, E.; di Betta, A.M.; Olson, A. Reduced attentional capacity, but normal processing speed and shifting of attention in developmental dyslexia: Evidence from a serial task. Cortex 2011, 47, 715–733. [Google Scholar] [CrossRef] [PubMed]
- Facoetti, A.; Zorzi, M.; Cestnick, L.; Lorusso, M.L.; Molteni, M.; Paganoni, P.; Umiltà, C.; Mascetti, G.G. The relationship between visuo-spatial attention and nonword reading in developmental dyslexia. Cogn. Neuropsychol. 2006, 23, 841–855. [Google Scholar] [CrossRef] [PubMed]
- Gabrieli, J.D.; Norton, E.S. Reading Abilities: Importance of Visual-Spatial Attention. Curr. Biol. 2012, 22, R298–R299. [Google Scholar] [CrossRef]
- Valdois, S.; Reilhac, C.; Ginestet, E.; Bosse, M.L. Varieties of Cognitive Profiles in Poor Readers: Evidence for a VAS-Impaired Subtype. J. Learn. Disabil. 2020, 54, 221–233. [Google Scholar] [CrossRef]
- Ebrahimi, L.; Pouretemad, H.; Stein, J.; Alizadeh, E.; Khatibi, A. Enhanced reading abilities is modulated by faster visual spatial attention. Ann. Dyslexia 2022, 72, 125–146. [Google Scholar] [CrossRef]
- Rayner, K.; Well, A.D. Effects of contextual constraint on eye movements in reading: A further examination. Psychon. Bull. Rev. 1996, 3, 504–509. [Google Scholar] [CrossRef]
- Nagy, W.; Berninger, V.W.; Abbott, R.D. Contributions of morphology beyond phonology to literacy outcomes of upper elementary and middle-school students. J. Educ. Psychol. 2006, 98, 134–147. [Google Scholar] [CrossRef]
- Law, J.M.; Wouters, J.; Ghesquière, P. Morphological Awareness and Its Role in Compensation in Adults with Dyslexia. Dyslexia 2015, 21, 254–272. [Google Scholar] [CrossRef]
- Leong, C.K. Rapid processing of base and derived forms of words and grades 4, 5 and 6 children′s spelling. Read. Writ. 2000, 12, 277–302. [Google Scholar] [CrossRef]
- Leong, C.K. From ITPA Language Profiles to the Componential Analysis of Early Reading Processes. Int. J. Disabil. Dev. Educ. 2002, 49, 131–143. [Google Scholar] [CrossRef]
- Duncan, L.G.; Casalis, S.; Colé, P. Early metalinguistic awareness of derivational morphology: Observations from a comparison of English and French. Appl. Psycholinguist. 2009, 30, 405–440. [Google Scholar] [CrossRef]
- Cantiani, C.; Lorusso, M.L.; Perego, P.; Molteni, M.; Guasti, M.T. Developmental Dyslexia with and Without Language Impairment: ERPs Reveal Qualitative Differences in Morphosyntactic Processing. Dev. Neuropsychol. 2015, 40, 291–312. [Google Scholar] [CrossRef]
- Casalis, S.; Colé, P.; Sopo, D. Morphological awareness in developmental dyslexia. Ann. Dyslexia 2004, 54, 114–138. [Google Scholar] [CrossRef] [PubMed]
- Rispens, J.; Roeleven, S.; Koster, C. Sensitivity to subject–verb agreement in spoken language in children with de-velopmental dyslexia. J. Neurolinguistics 2004, 17, 333–347. [Google Scholar] [CrossRef]
- Cantiani, C.; Lorusso, M.L.; Guasti, M.T.; Sabisch, B.; Männel, C. Characterizing the morphosyntactic processing deficit and its relationship to phonology in developmental dyslexia. Neuropsychologia 2013, 51, 1595–1607. [Google Scholar] [CrossRef]
- Cantiani, C.; Lorusso, M.L.; Perego, P.; Molteni, M.; Guasti, M.T. Event-related potentials reveal anomalous mor-phosyntactic processing in developmental dyslexia. Appl. Psycholinguist. 2013, 34, 1135–1162. [Google Scholar] [CrossRef]
- Robertson, E.K.; Joanisse, M.F. Spoken sentence comprehension in children with dyslexia and language impairment: The roles of syntax and working memory. Appl. Psycholinguist. 2010, 31, 141–165. [Google Scholar] [CrossRef]
- Bishop, D.V.M.; Snowling, M.J. Developmental Dyslexia and Specific Language Impairment: Same or Different? Psychol. Bull. 2004, 130, 858–886. [Google Scholar] [CrossRef]
- Delage, H.; Durrleman, S. Developmental dyslexia and specific language impairment: Distinct syntactic profiles? Clin. Linguistics Phon. 2018, 32, 758–785. [Google Scholar] [CrossRef]
- Engelhardt, P.E.; Yuen, M.K.Y.; Kenning, E.A.; Filipovic, L. Are Linguistic Prediction Deficits Characteristic of Adults with Dyslexia? Brain Sci. 2021, 11, 59. [Google Scholar] [CrossRef]
- Huettig, F.; Brouwer, S. Delayed Anticipatory Spoken Language Processing in Adults with Dyslexia-Evidence from Eye-tracking. Dyslexia 2015, 21, 97–122. [Google Scholar] [CrossRef]
- Mani, N.; Huettig, F. Word reading skill predicts anticipation of upcoming spoken language input: A study of children developing proficiency in reading. J. Exp. Child Psychol. 2014, 126, 264–279. [Google Scholar] [CrossRef] [PubMed]
- Feng, X.; Altarelli, I.; Monzalvo, K.; Ding, G.; Ramus, F.; Shu, H.; Dehaene, S.; Meng, X.; Dehaene-Lambertz, G. A universal reading network and its modulation by writing system and reading ability in French and Chinese children. Elife 2020, 9, e54591. [Google Scholar] [CrossRef]
- Perfetti, C.A.; Harris, L.N. Universal Reading Processes Are Modulated by Language and Writing System. Lang. Learn. Dev. 2013, 9, 296–316. [Google Scholar] [CrossRef]
- Li, X.; Huang, L.; Yao, P.; Hyönä, J. Universal and specific reading mechanisms across different writing systems. Nat. Rev. Psychol. 2022, 1, 133–144. [Google Scholar] [CrossRef]
- Lee, J.W.; Wolters, A.; Kim, Y.-S.G. The Relations of Morphological Awareness with Language and Literacy Skills Vary Depending on Orthographic Depth and Nature of Morphological Awareness. Rev. Educ. Res. 2022. [Google Scholar] [CrossRef]
- Wimmer, H.; Mayringer, H.; Landerl, K. The double-deficit hypothesis and difficulties in learning to read a regular orthography. J. Educ. Psychol. 2000, 92, 668–680. [Google Scholar] [CrossRef]
- Borleffs, E.; Maassen, B.A.M.; Lyytinen, H.; Zwarts, F. Cracking the Code: The Impact of Orthographic Transparency and Morphological-Syllabic Complexity on Reading and Developmental Dyslexia. Front. Psychol. 2019, 9, 2534. [Google Scholar] [CrossRef]
- Frost, R. A universal approach to modeling visual word recognition and reading: Not only possible, but also inevitable. Behav. Brain Sci. 2012, 35, 310–329. [Google Scholar] [CrossRef] [Green Version]


| Interaction Predictor X OF Index | ||||
|---|---|---|---|---|
| Dependent Variable | Predictor | Estimate (SE) | t(51) | One-Tailed p |
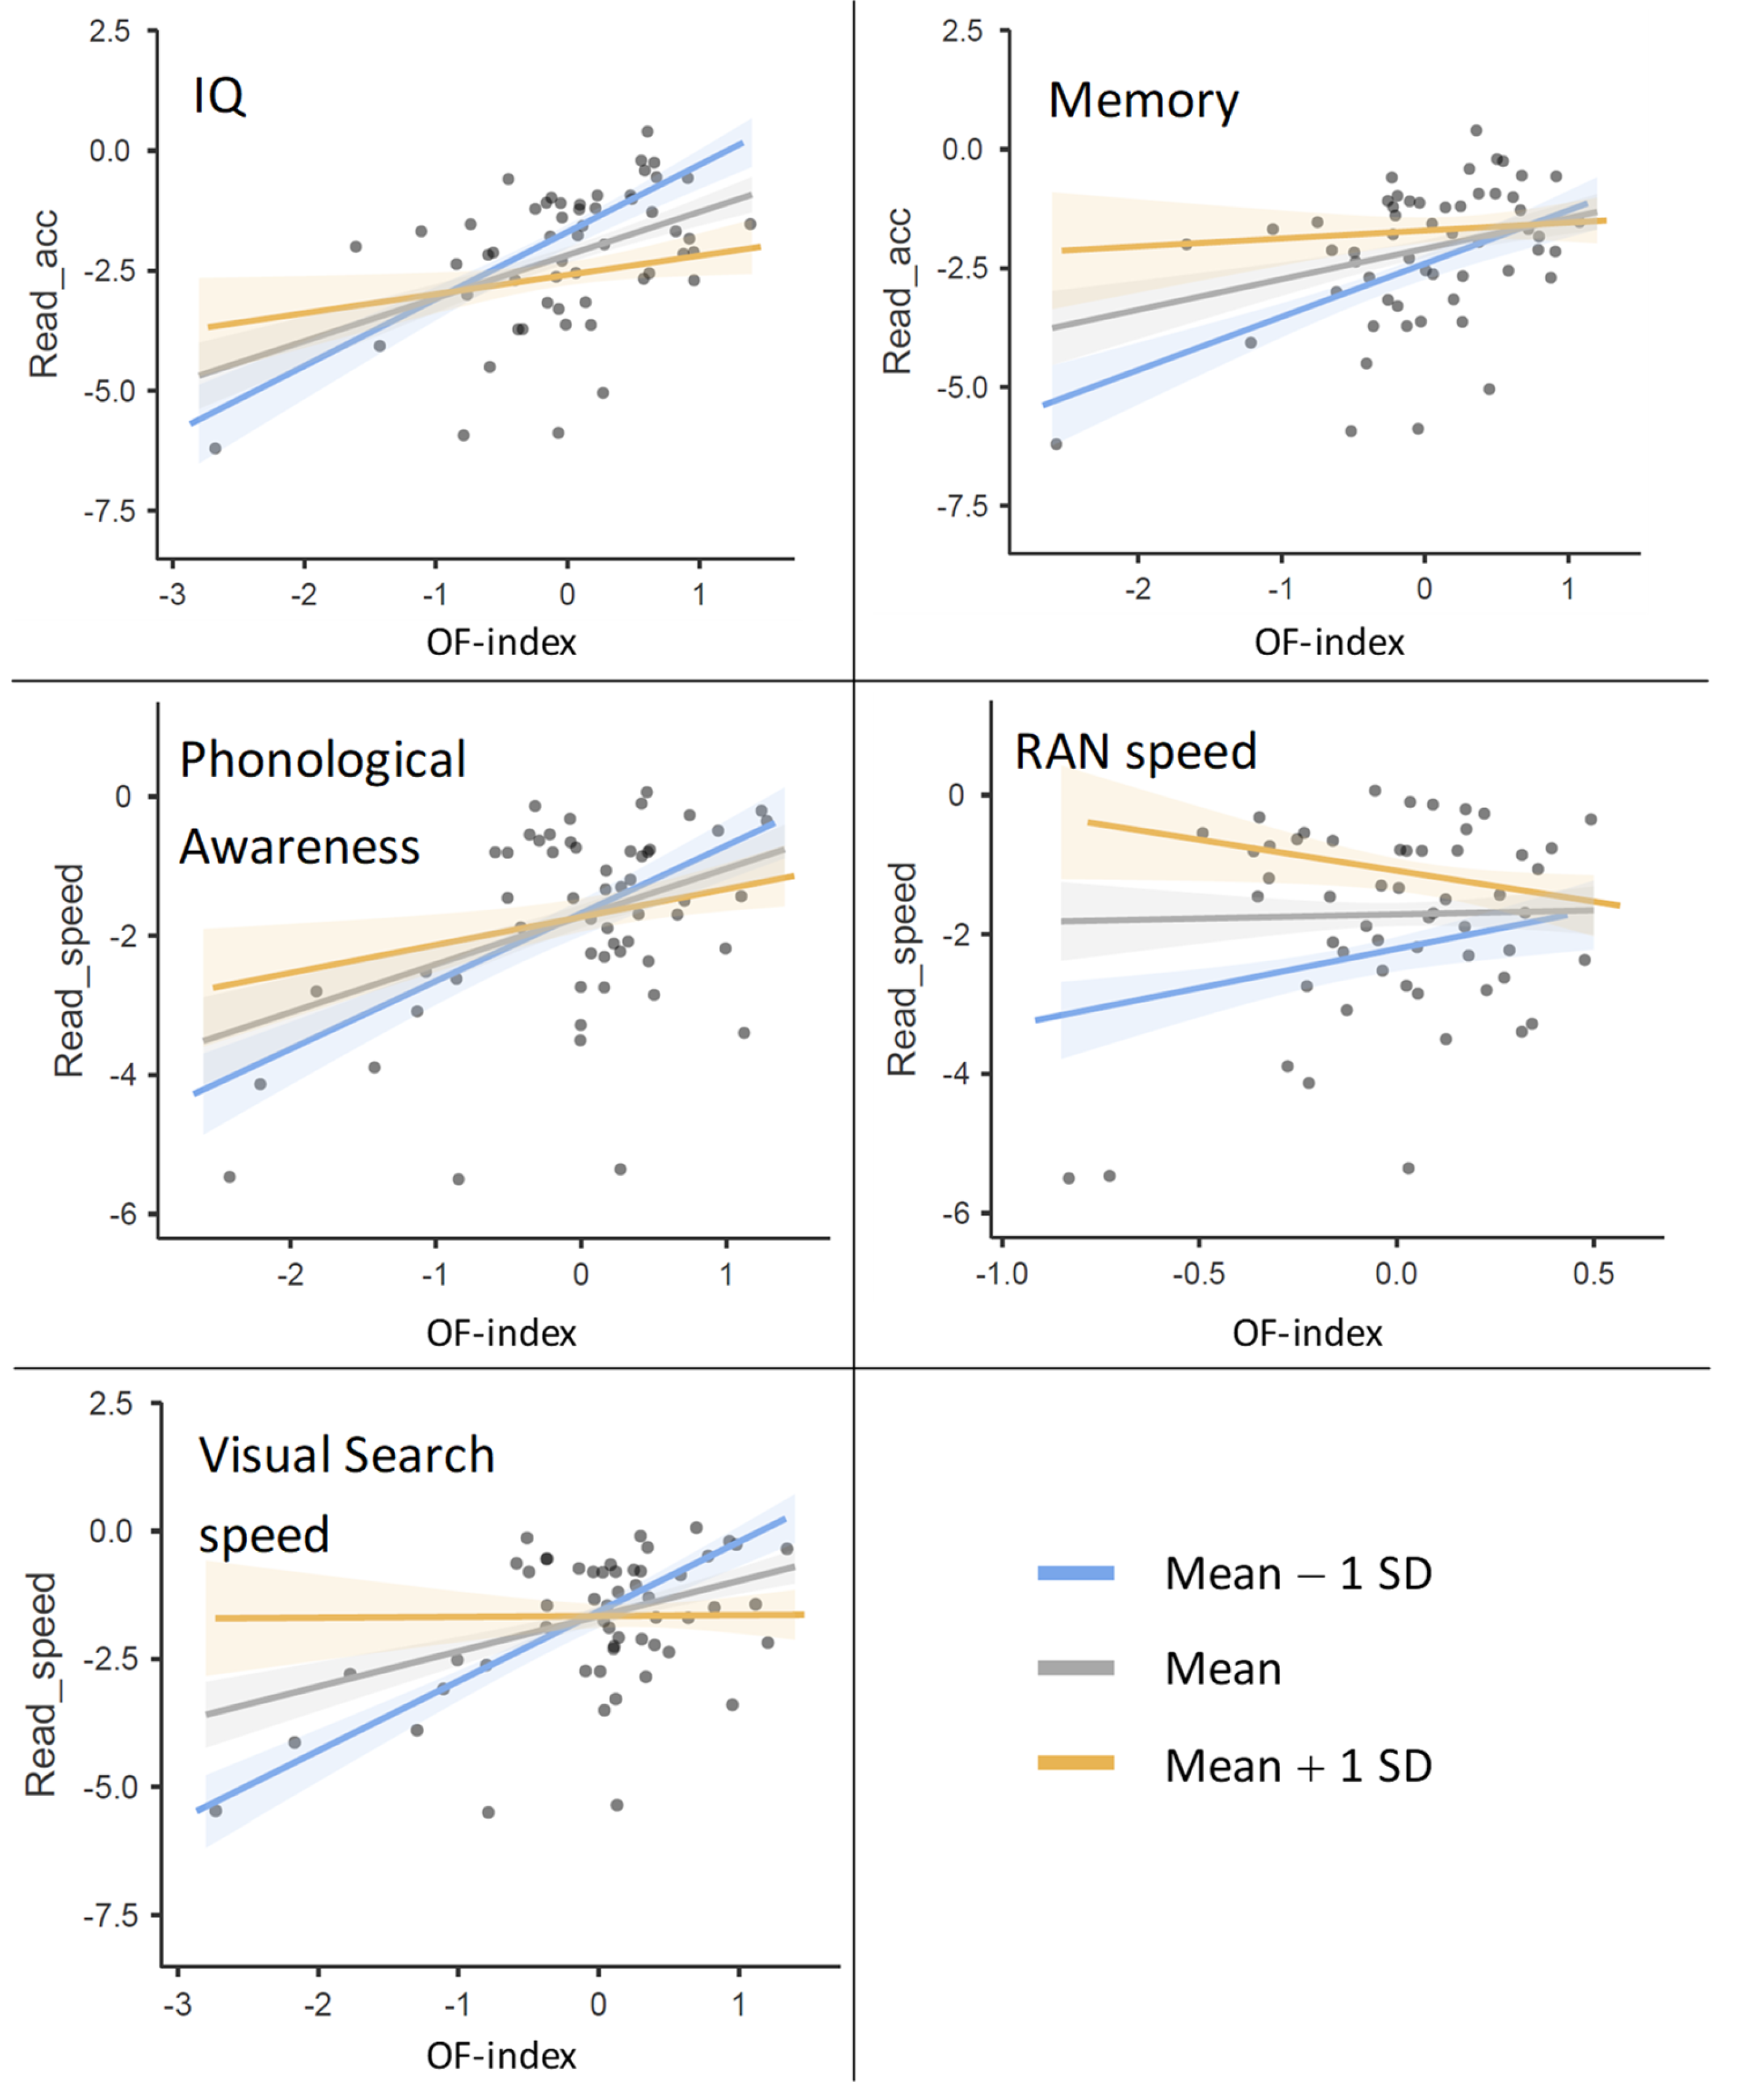
| Reading accuracy | IQ | −0.611 (0.277) | −2.21 | 0.016 |
| Memory | −1.068 (0.58) | −1.84 | 0.036 | |
| RAN speed | −0.277 (0.199) | −1.388 | 0.086 | |
| Visual search speed | −0.0832 (0.239) | −0.349 | 0.365 | |
| Phonological awareness | −0.13 (0.127) | −1.025 | 0.155 | |
| Reading speed | IQ | −0.293 (0.238) | −1.231 | 0.112 |
| Memory | −0.457 (0.49) | −0.931 | 0.178 | |
| RAN speed | −0.706 (0.332) | −2.13 | 0.019 | |
| Visual search speed | −0.5298 (0.184) | −2.882 | 0.003 | |
| Phonological awareness | −0.227 (0.116) | −1.965 | 0.028 | |
| Interaction Predictor × OF Index | ||||
|---|---|---|---|---|
| Dependent Variable | Predictor | Estimate (Adj. SE) | H1 Prior | BF10 |
| Reading accuracy | IQ | −0.611 (0.279) | [−0.57, 0] | 12.896 |
| Memory | −1.068 (0.584) | [−0.82, 0] | 7.612 | |
| RAN speed | −0.277 (0.201) | [−0.70, 0] | 1.705 | |
| Visual search speed | −0.0832 (0.241) | [−0.89, 0] | 0.457 | |
| Phonological awareness | −0.13 (0.128) | [−0.58, 0] | 0.783 | |
| Reading speed | IQ | −0.293 (0.24) | [−0.68, 0] | 1.658 |
| Memory | −0.457 (0.494) | [−0.78, 0] | 1.972 | |
| RAN speed | −0.706 (0.335) | [−0.97, 0] | 7.868 | |
| Visual search speed | −0.5298 (0.185) | [−0.93, 0] | 29.579 | |
| Phonological awareness | −0.227 (0.117) | [−0.50, 0] | 3.773 | |
Disclaimer/Publisher’s Note: The statements, opinions and data contained in all publications are solely those of the individual author(s) and contributor(s) and not of MDPI and/or the editor(s). MDPI and/or the editor(s) disclaim responsibility for any injury to people or property resulting from any ideas, methods, instructions or products referred to in the content. |
© 2023 by the authors. Licensee MDPI, Basel, Switzerland. This article is an open access article distributed under the terms and conditions of the Creative Commons Attribution (CC BY) license (https://creativecommons.org/licenses/by/4.0/).
Share and Cite
Lorusso, M.L.; Toraldo, A. Revisiting Multifactor Models of Dyslexia: Do They Fit Empirical Data and What Are Their Implications for Intervention? Brain Sci. 2023, 13, 328. https://doi.org/10.3390/brainsci13020328
Lorusso ML, Toraldo A. Revisiting Multifactor Models of Dyslexia: Do They Fit Empirical Data and What Are Their Implications for Intervention? Brain Sciences. 2023; 13(2):328. https://doi.org/10.3390/brainsci13020328
Chicago/Turabian StyleLorusso, Maria Luisa, and Alessio Toraldo. 2023. "Revisiting Multifactor Models of Dyslexia: Do They Fit Empirical Data and What Are Their Implications for Intervention?" Brain Sciences 13, no. 2: 328. https://doi.org/10.3390/brainsci13020328