
Source Localization of Audiovisual Multisensory Neural Generators in Young Adults with Attention-Deficit/Hyperactivity Disorder

 , ,
, , 
Abstract
:1. Introduction
2. Materials and Methods
2.1. Participants
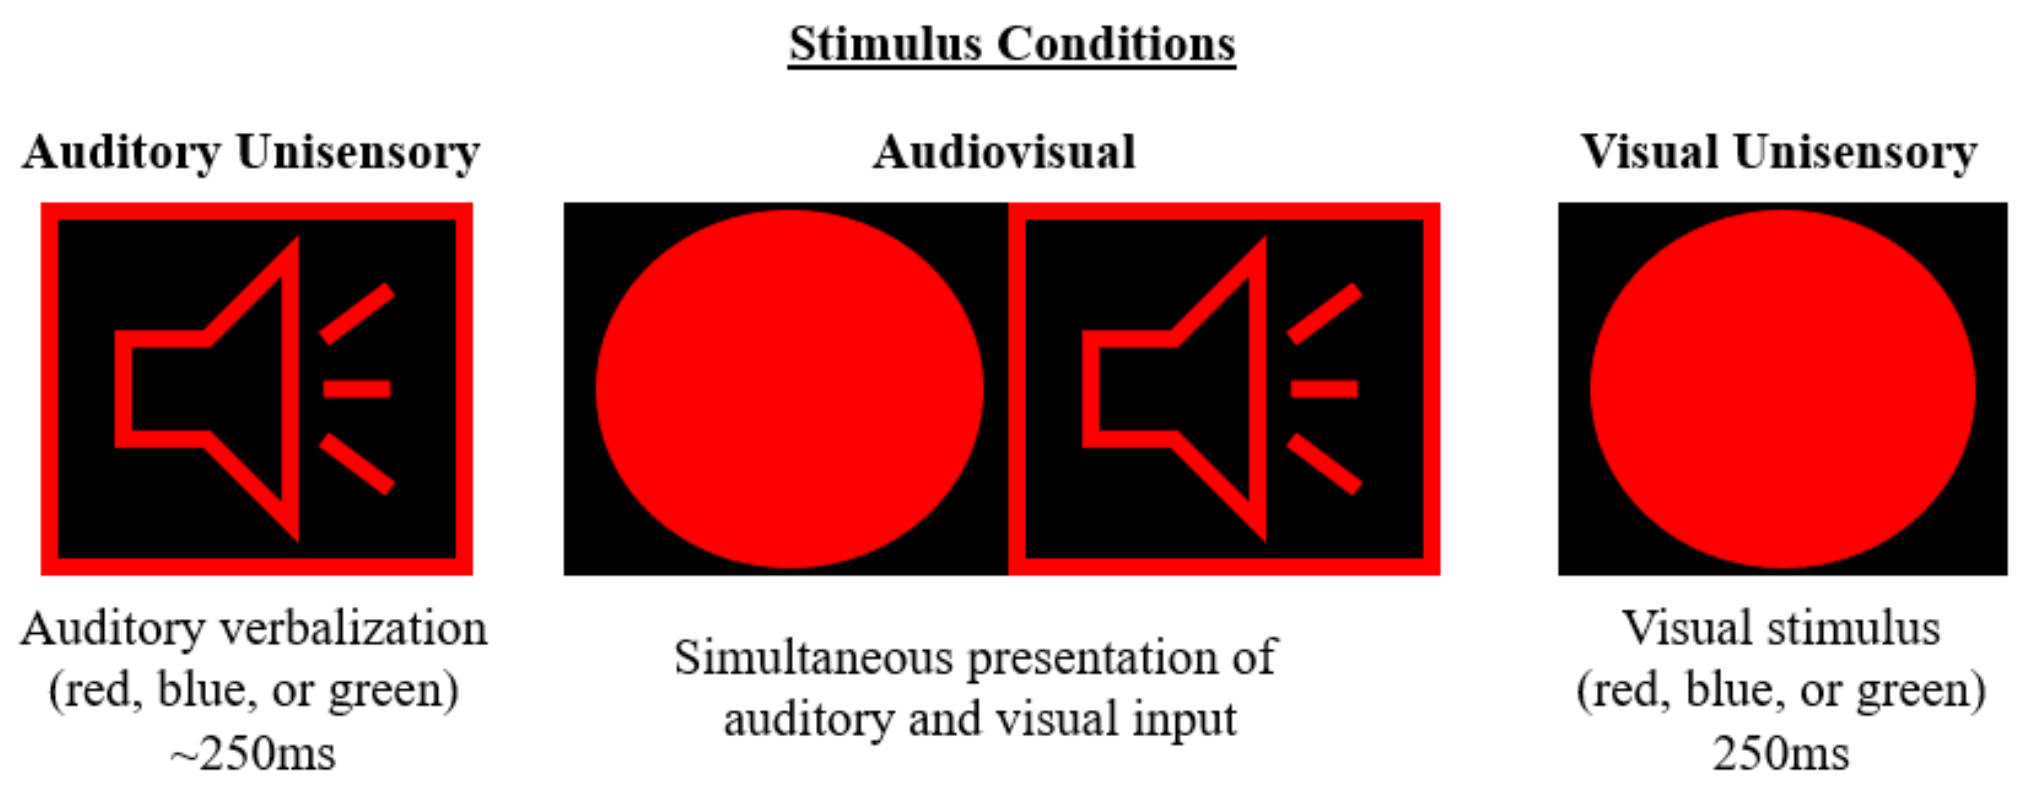
2.2. Auditory Alone
2.3. Visual Alone
2.4. Audiovisual Multisensory
2.5. Data Analysis
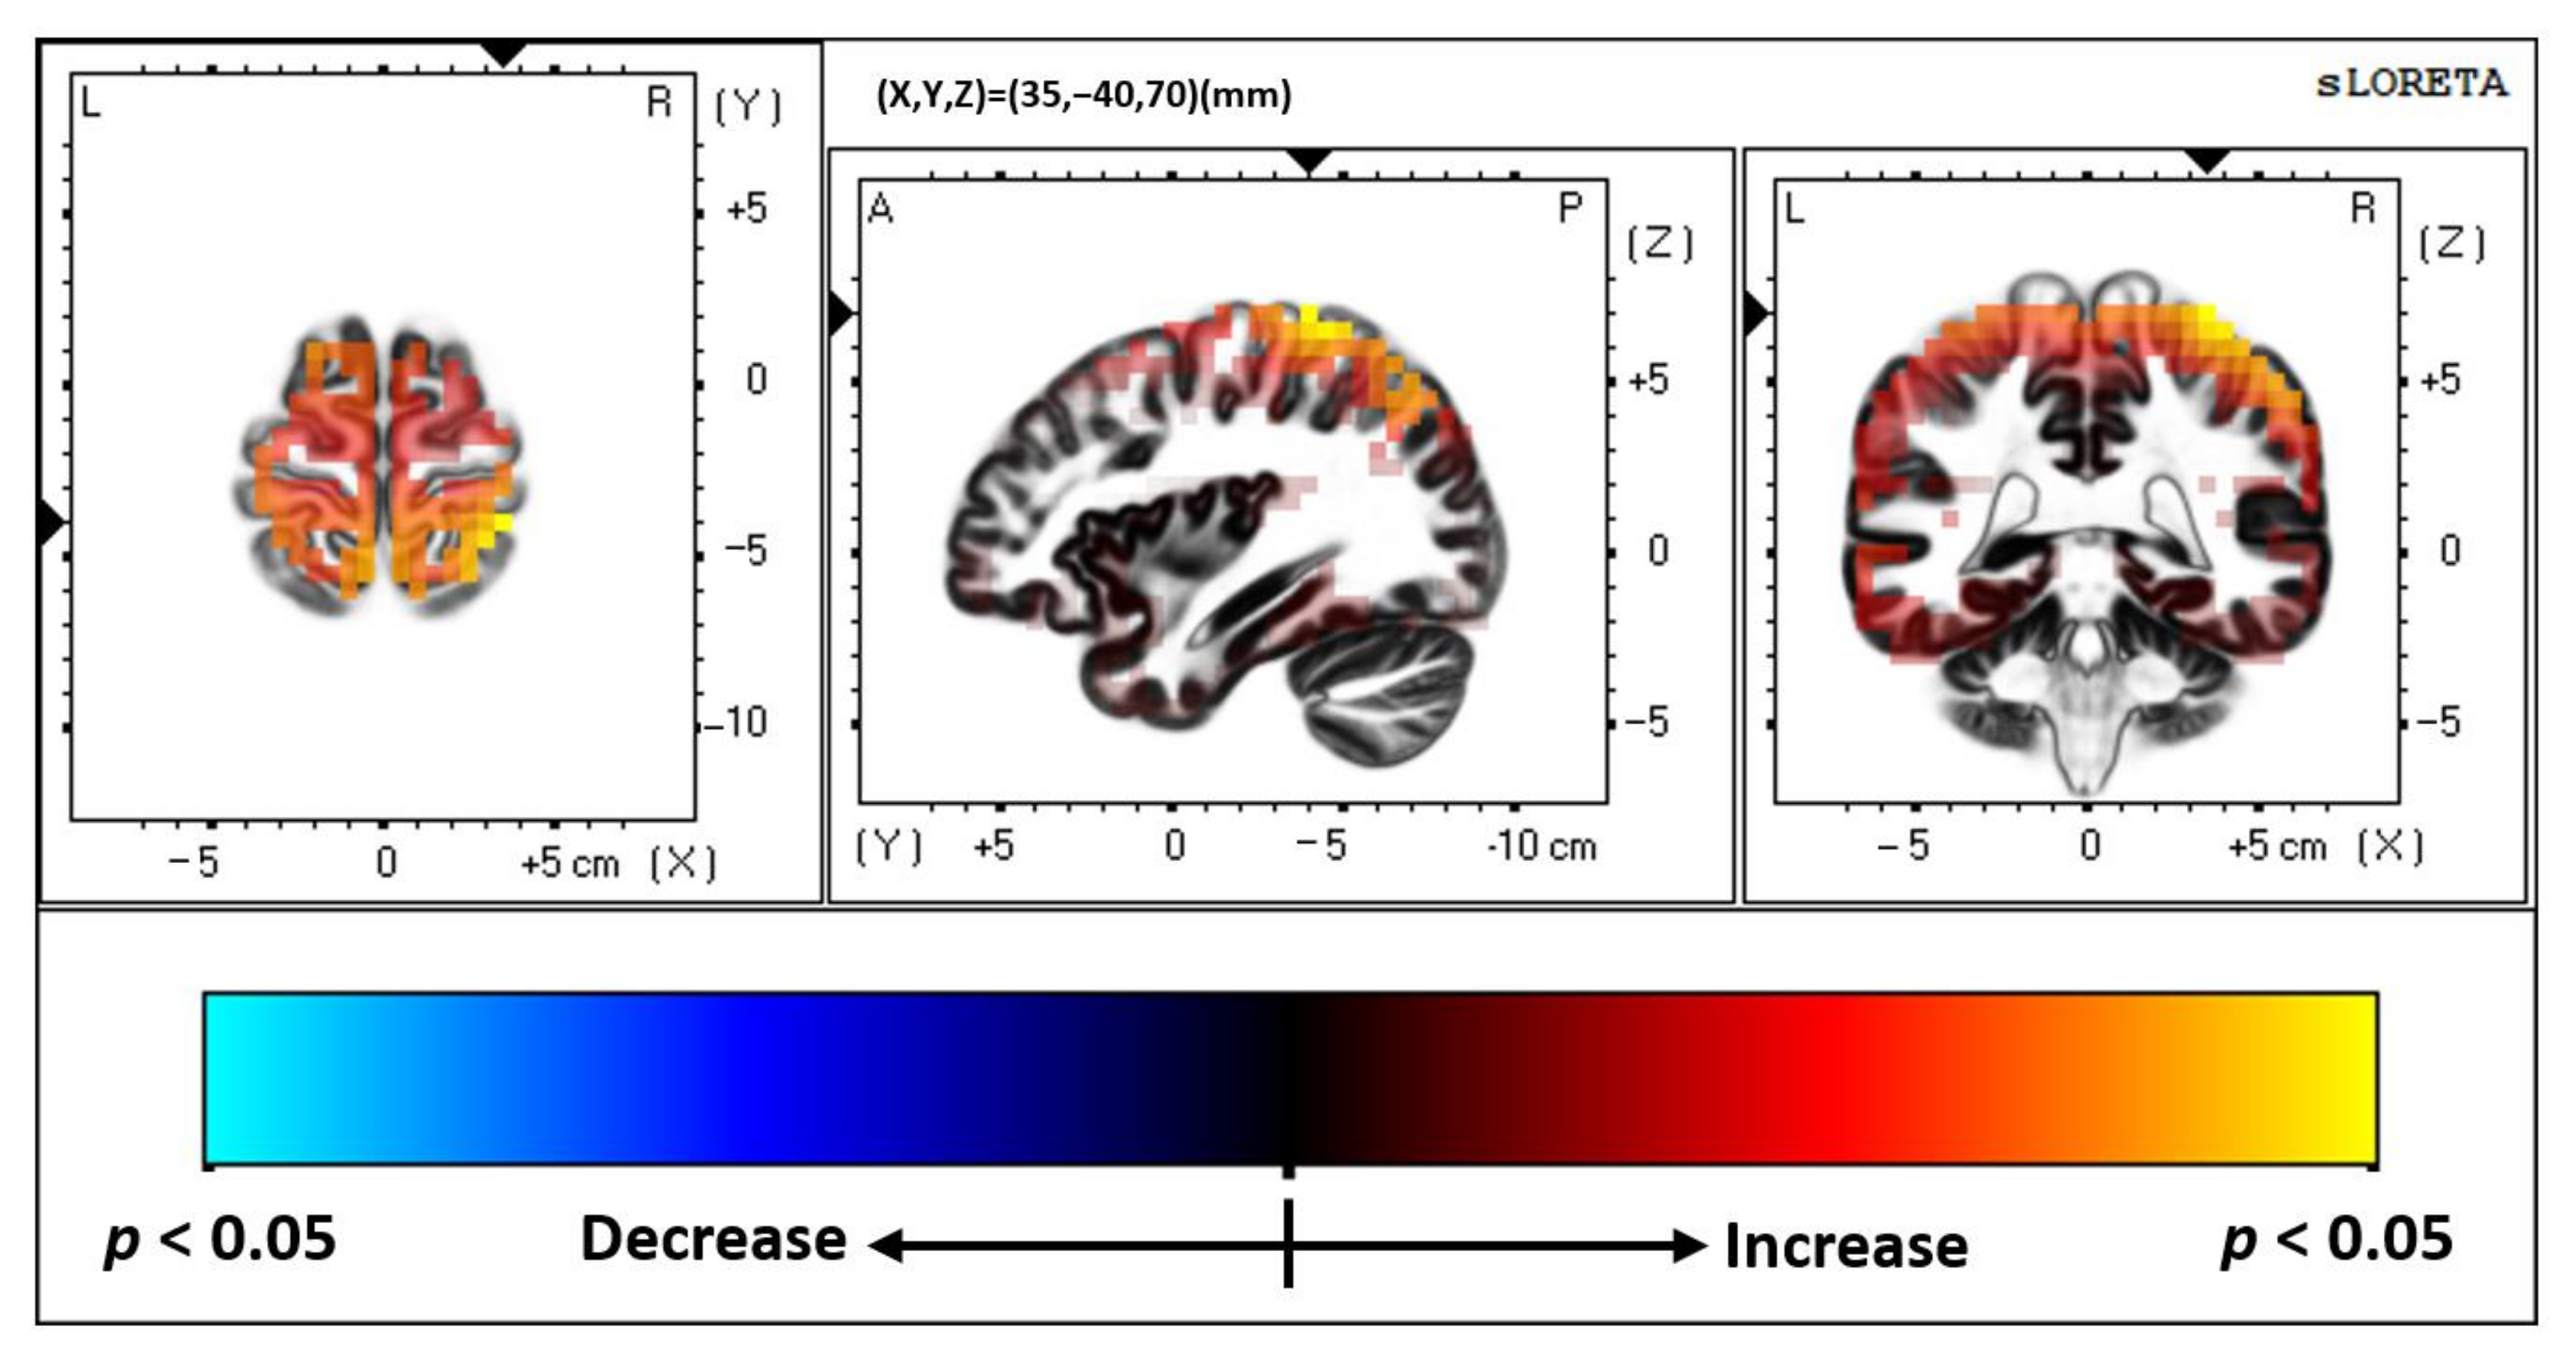
2.5.1. Source Localization—SLORETA Analysis
2.5.2. Time-Domain Statistical Analysis
3. Results
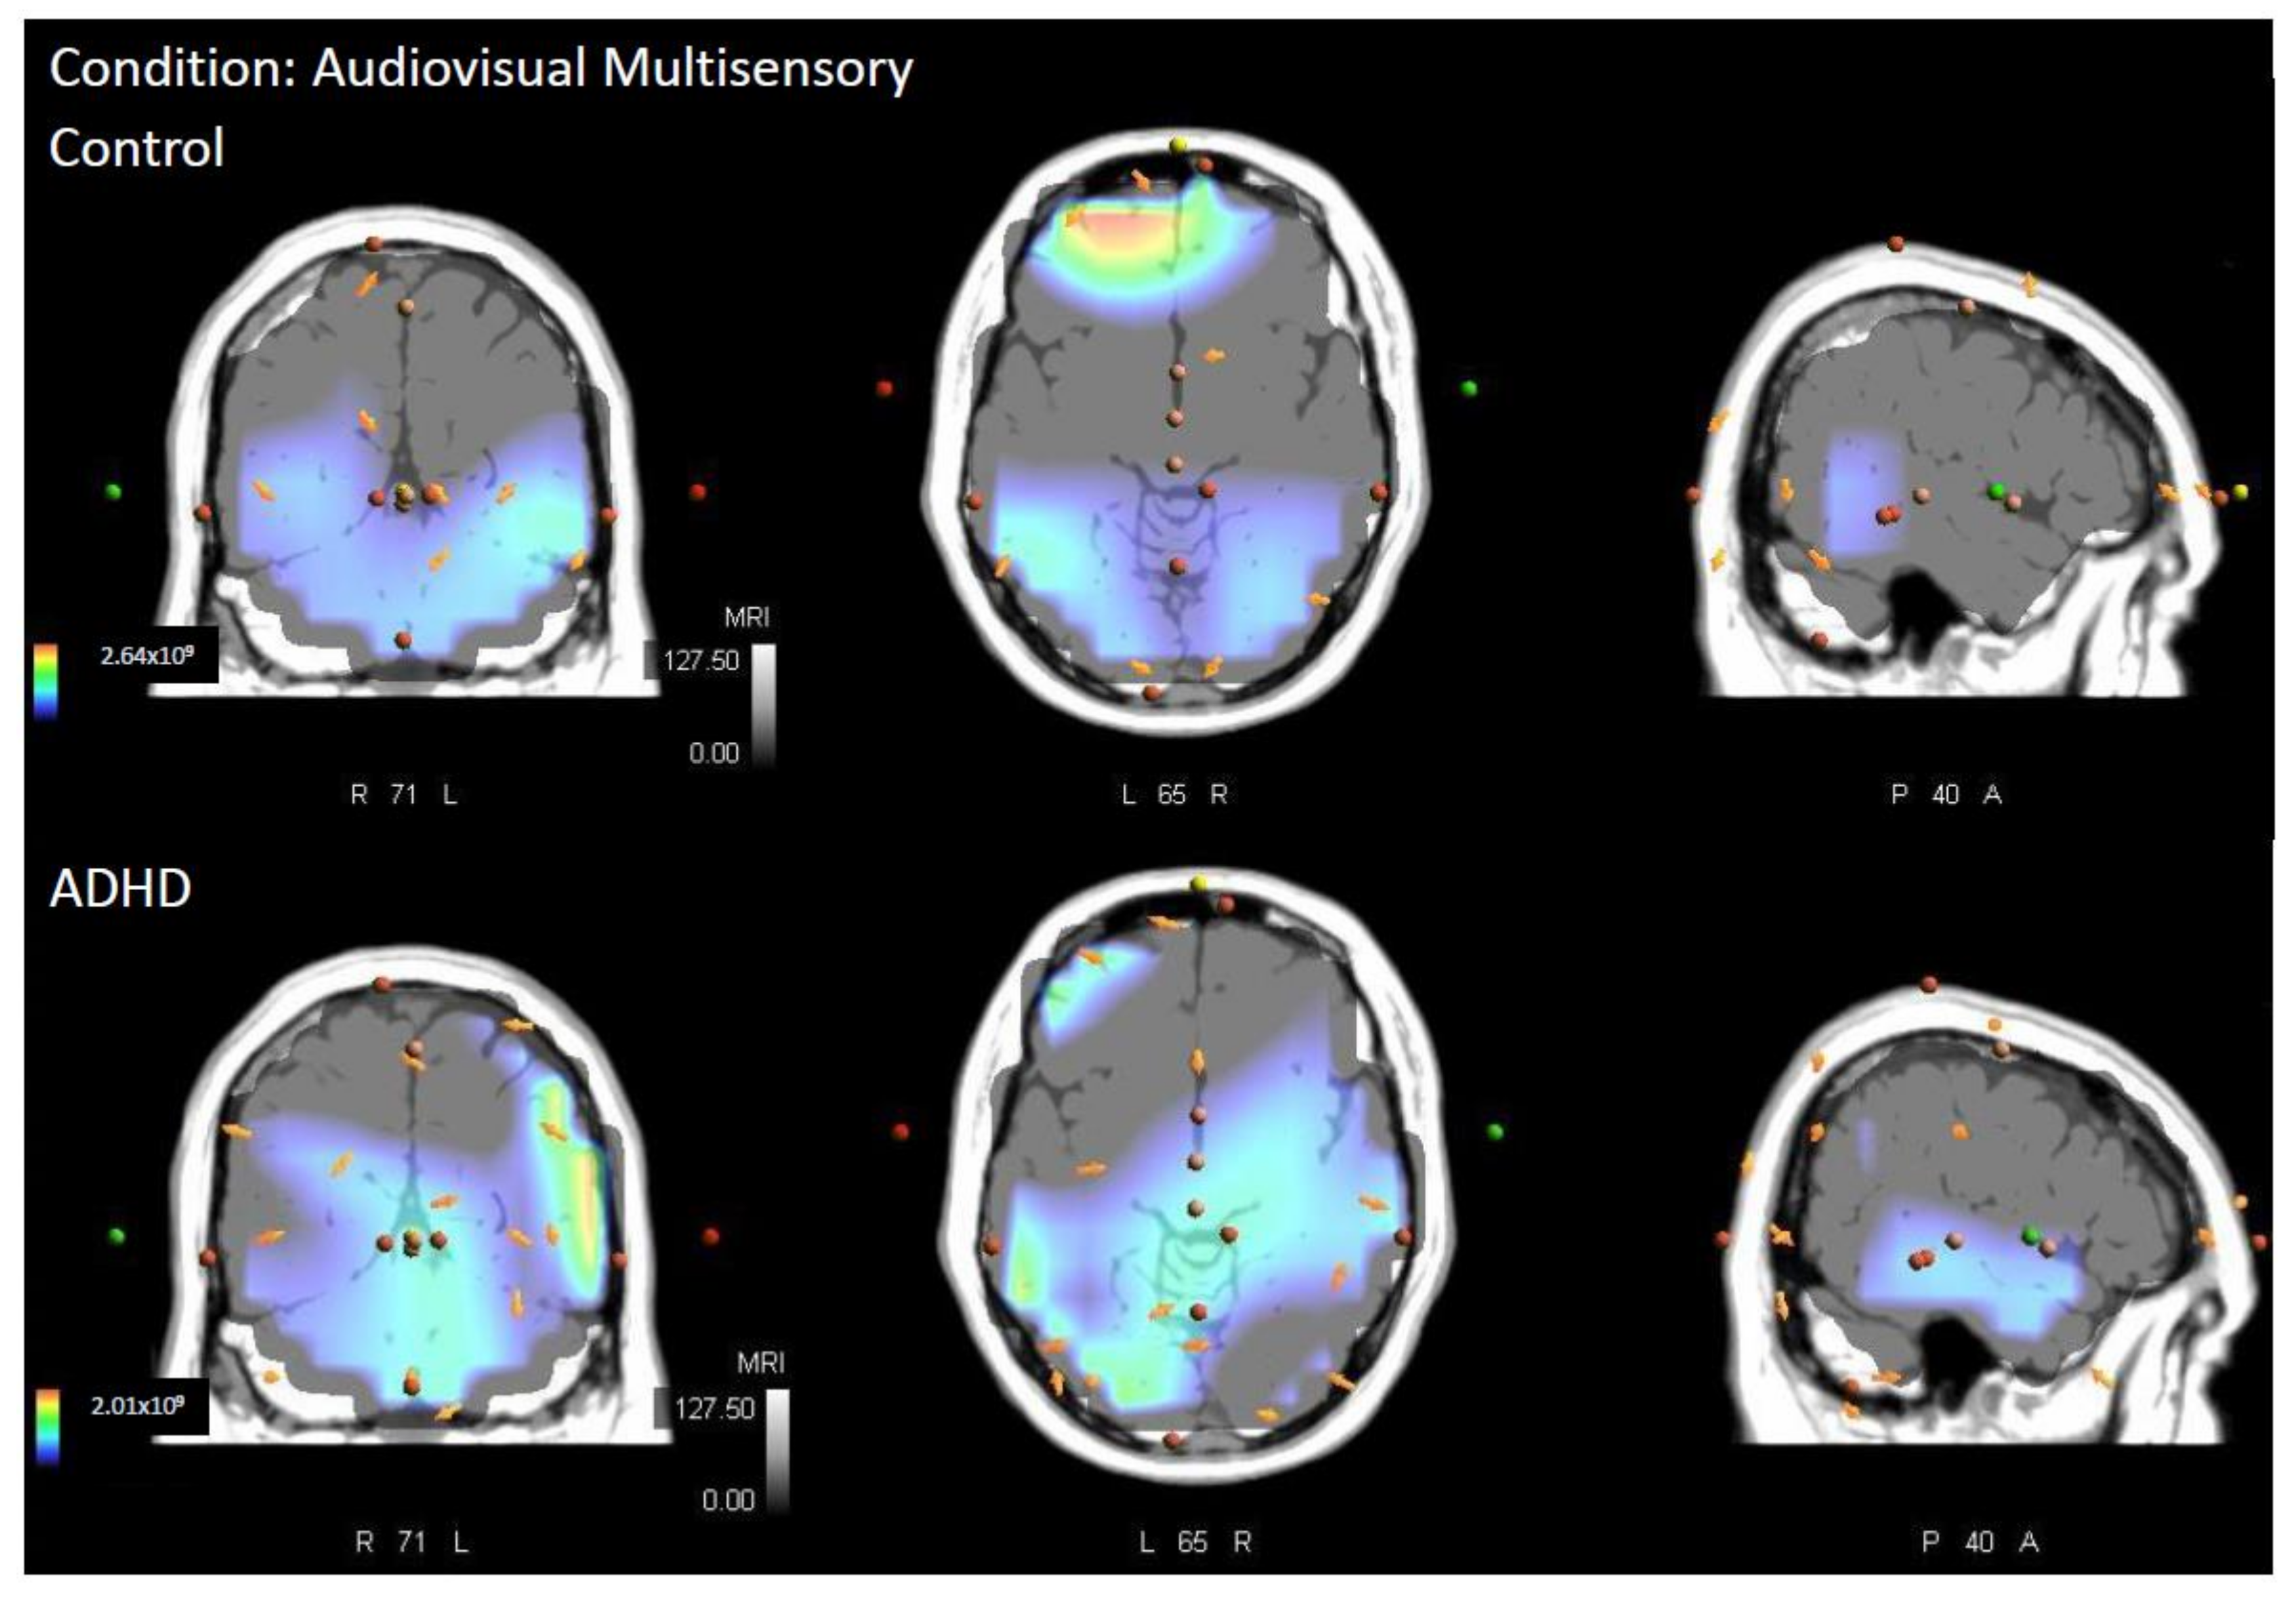
3.1. Multisensory
3.2. Visual Unisensory
3.3. Auditory Unisensory
4. Discussion
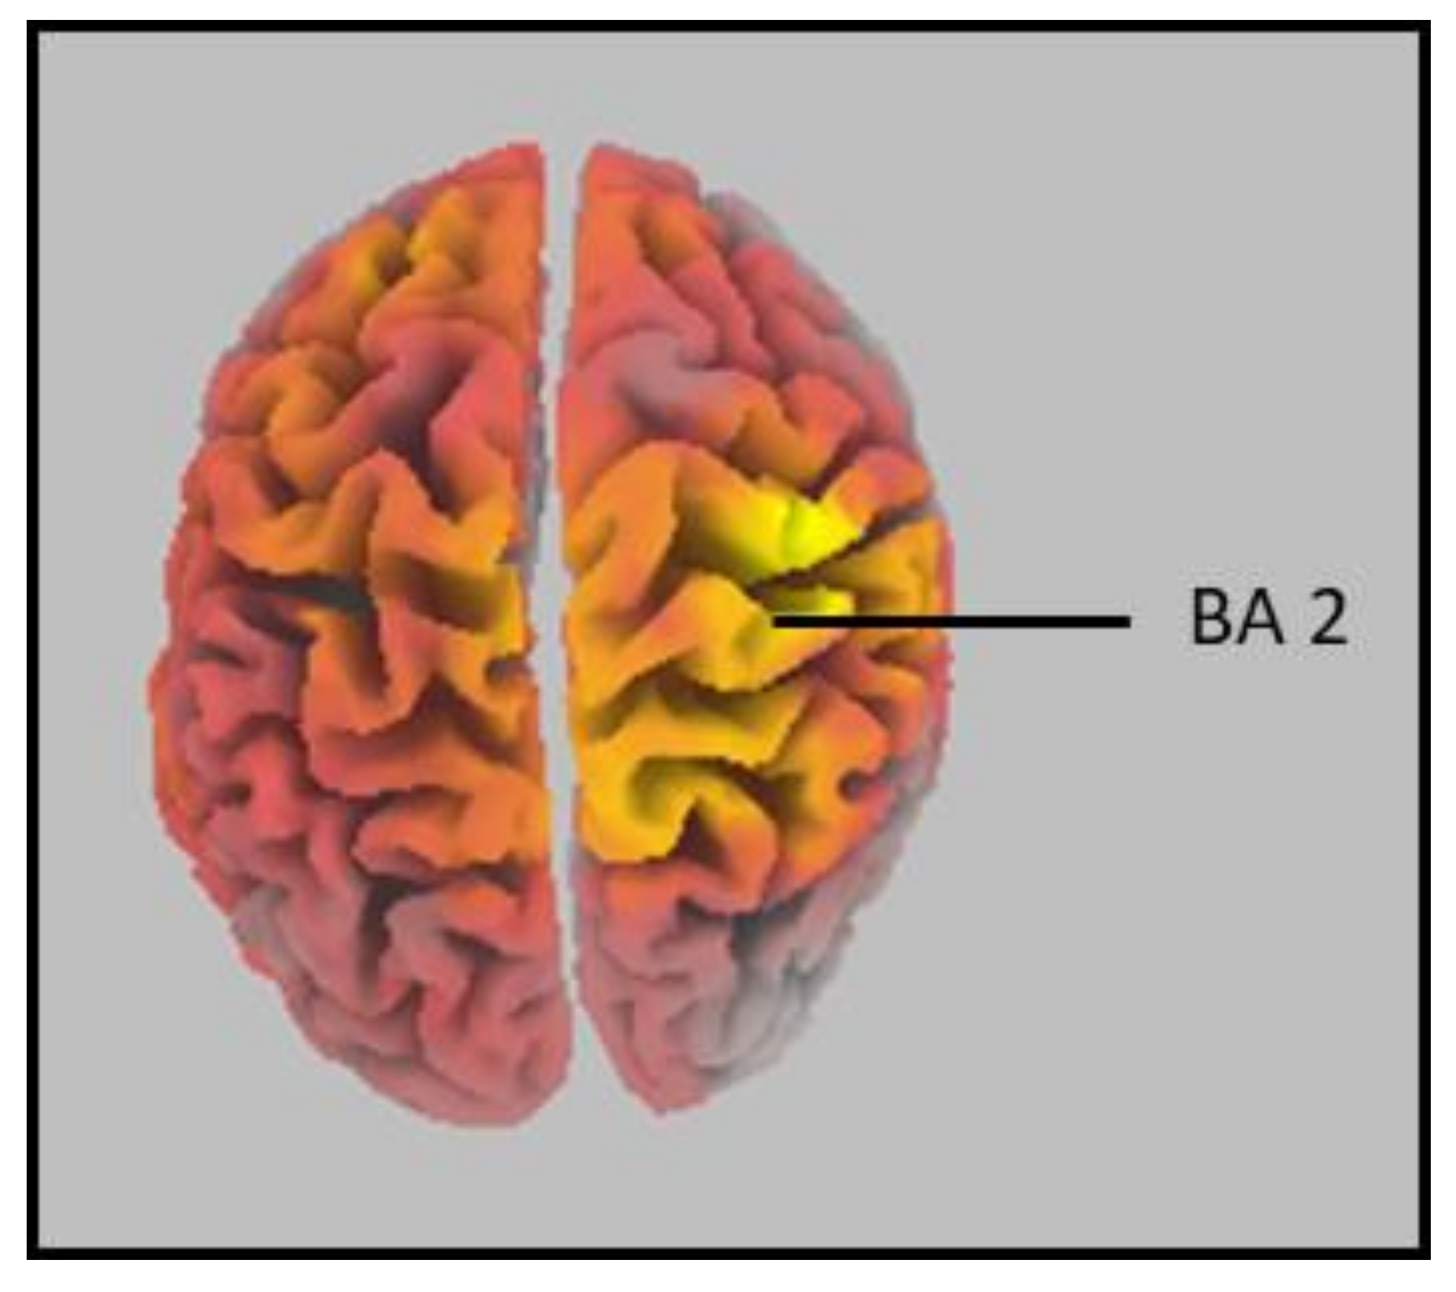
4.1. Brodmann Area (BA) 2
4.2. Parietal Lobe
4.3. Multisensory Processing
4.4. Limitations
5. Conclusions
Author Contributions
Funding
Institutional Review Board Statement
Informed Consent Statement
Data Availability Statement
Acknowledgments
Conflicts of Interest
References
- American Psychiatric Association. Diagnostic and Statistical Manual of Mental Disorders DSM-5; American Psychiatric Association: Washington, DC, USA, 2013; Volume 5. [Google Scholar]
- Visser, S.N.; Danielson, M.; Bitsko, R.H.; Holbrook, J.R.; Kogan, M.D.; Ghandour, R.M.; Perou, R.; Blumberg, S.J. Trends in the parent-report of health care provider-diagnosed and medicated attention-deficit/hyperactivity disorder: United States, 2003–2011. J. Am. Acad. Child Adolesc. Psychiatry 2014, 53, 34. [Google Scholar] [CrossRef] [PubMed] [Green Version]
- Faraone, S.; Biederman, J.; Mick, E. The age-dependent decline of attention deficit hyperactivity disorder: A meta-analysis of follow-up studies. Psychol. Med. 2006, 36, 159–165. [Google Scholar] [CrossRef] [PubMed]
- Brook, J.S.; Brook, D.W.; Zhang, C.; Seltzer, N.; Finch, S.J. Adolescent ADHD and adult physical and mental health, work performance, and financial stress. Pediatrics 2013, 131, 5–13. [Google Scholar] [CrossRef] [PubMed] [Green Version]
- Gentile, J.P.; Atiq, R.; Gillig, P.M. Adult ADHD: Diagnosis, differential diagnosis, and medication management. Psychiatry 2006, 3, 25. [Google Scholar]
- Castellanos, F.X.; Lee, P.P.; Sharp, W.; Jeffries, N.O.; Greenstein, D.K.; Clasen, L.S.; Blumenthal, J.D.; James, R.S.; Ebens, C.; Walter, J.M.; et al. Developmental trajectories of brain volume abnormalities in children and adolescents with attention-deficit/hyperactivity disorder. JAMA 2002, 288, 1740–1748. [Google Scholar] [CrossRef]
- Valera, E.M.; Faraone, S.; Murray, K.E.; Seidman, L.J. Meta-analysis of structural imaging findings in attention-deficit/hyperactivity disorder. Biol. Psychiatry 2007, 61, 1361–1369. [Google Scholar] [CrossRef]
- Duerden, E.G.; Tannock, R.; Dockstader, C. Altered cortical morphology in sensorimotor processing regions in adolescents and adults with attention-deficit/hyperactivity disorder. Brain Res. 2012, 1445, 82–91. [Google Scholar] [CrossRef]
- Proal, E.; Reiss, P.; Klein, R.G.; Mannuzza, S.; Gotimer, K.; Ramos-Olazagasti, M.A.; Lerch, J.P.; He, Y.; Zijdenbos, A.; Kelly, C.; et al. Brain gray matter deficits at 33-year follow-up in adults with attention-deficit/hyperactivity disorder established in childhood. Arch. Gen. Psychiatry 2011, 68, 1122–1134. [Google Scholar] [CrossRef] [Green Version]
- Makris, N.; Biederman, J.; Valera, E.M.; Bush, G.; Kaiser, J.; Kennedy, D.N.; Caviness, V.S.; Faraone, S.; Seidman, L.J. Cortical Thinning of the Attention and Executive Function Networks in Adults with Attention-Deficit/Hyperactivity Disorder. Cereb. Cortex 2007, 17, 1364–1375. [Google Scholar] [CrossRef] [Green Version]
- Sowell, E.R.; Thompson, P.; Welcome, S.E.; Henkenius, A.L.; Toga, A.W.; Peterson, B.S. Cortical abnormalities in children and adolescents with attention-deficit hyperactivity disorder. Lancet 2003, 362, 1699–1707. [Google Scholar] [CrossRef]
- Barkley, R.A. Behavioral inhibition, sustained attention, and executive functions: Constructing a unifying theory of ADHD. Psychol. Bull. 1997, 121, 65. [Google Scholar] [CrossRef] [Green Version]
- Seidman, L.J.; Valera, E.M.; Makris, N.; Monuteaux, M.C.; Boriel, D.L.; Kelkar, K.; Kennedy, D.N.; Caviness, V.S.; Bush, G.; Aleardi, M.; et al. Dorsolateral prefrontal and anterior cingulate cortex volumetric abnormalities in adults with attention-deficit/hyperactivity disorder identified by magnetic resonance imaging. Biol. Psychiatry 2006, 60, 1071–1080. [Google Scholar] [CrossRef]
- Renier, L.A.; Anurova, I.; De Volder, A.G.; Carlson, S.; VanMeter, J.; Rauschecker, J.P. Multisensory integration of sounds and vibrotactile stimuli in processing streams for “what” and “where”. J. Neurosci. 2009, 29, 10950–10960. [Google Scholar] [CrossRef]
- Dionne-Dostie, E.; Paquette, N.; Lassonde, M.; Gallagher, A. Multisensory integration and child neurodevelopment. Brain Sci. 2015, 5, 32–57. [Google Scholar] [CrossRef] [Green Version]
- Meredith, M.A.; Nemitz, J.W.; Stein, B.E. Determinants of multisensory integration in superior colliculus neurons. I. Temporal factors. J. Neurosci. 1987, 7, 3215–3229. [Google Scholar] [CrossRef] [Green Version]
- Laurienti, P.J.; Kraft, R.A.; Maldjian, J.A.; Burdette, J.H.; Wallace, M.T. Semantic congruence is a critical factor in multisensory behavioral performance. Exp. Brain Res. 2004, 158, 405–414. [Google Scholar] [CrossRef]
- Brandwein, A.B.; Foxe, J.J.; Russo, N.N.; Altschuler, T.S.; Gomes, H.; Molholm, S. The development of audiovisual multisensory integration across childhood and early adolescence: A high-density electrical mapping study. Cereb. Cortex 2011, 21, 1042–1055. [Google Scholar] [CrossRef]
- Brandwein, A.B.; Foxe, J.; Butler, J.; Frey, H.-P.; Bates, J.C.; Shulman, L.H.; Molholm, S. Neurophysiological Indices of Atypical Auditory Processing and Multisensory Integration are Associated with Symptom Severity in Autism. J. Autism Dev. Disord. 2015, 45, 230–244. [Google Scholar] [CrossRef]
- Brandwein, A.B.; Foxe, J.J.; Butler, J.S.; Russo, N.N.; Altschuler, T.S.; Gomes, H.; Molholm, S. The development of multisensory integration in high-functioning autism: High-density electrical mapping and psychophysical measures reveal impairments in the processing of audiovisual inputs. Cereb. Cortex 2013, 23, 1329–1341. [Google Scholar] [CrossRef]
- Stein, B.E.; Burr, D.; Constantinidis, C.; Laurienti, P.J.; Meredith, M.A.; Perrault, T.J., Jr.; Ramachandran, R.; Röder, B.; Rowland, B.; Sathian, K.; et al. Semantic confusion regarding the development of multisensory integration: A practical solution. Eur. J. Neurosci. 2010, 31, 1713–1720. [Google Scholar] [CrossRef]
- Schulze, M.; Lux, S.; Philipsen, A. Sensory processing in adult ADHD—A systematic review. Res. Sq. 2020. preprint. [Google Scholar] [CrossRef]
- Chmielewski, W.X.; Tiedt, A.; Bluschke, A.; Dippel, G.; Roessner, V.; Beste, C. Effects of multisensory stimuli on inhibitory control in adolescent ADHD: It is the content of information that matters. NeuroImage Clin. 2018, 19, 527–537. [Google Scholar] [CrossRef] [PubMed]
- Panagiotidi, M.; Overton, P.G.; Stafford, T. Multisensory integration and ADHD-like traits: Evidence for an abnormal temporal integration window in ADHD. Acta Psychol. 2017, 181, 10–17. [Google Scholar] [CrossRef] [PubMed]
- Schulze, M.; Aslan, B.; Stöcker, T.; Stirnberg, R.; Lux, S.; Philipsen, A. Disentangling early versus late audiovisual integration in adult ADHD: A combined behavioural and resting-state connectivity study. J. Psychiatry Neurosci. 2021, 46, E528–E537. [Google Scholar] [CrossRef]
- Schulze, M.; Aslan, B.; Jung, P.; Lux, S.; Philipsen, A. Robust perceptual-load-dependent audiovisual integration in adult ADHD. Eur. Arch. Psychiatry Clin. Neurosci. 2022, 1–9. [Google Scholar] [CrossRef]
- Janssen, T.W.; Heslenfeld, D.J.; Van Mourik, R.; Geladé, K.; Maras, A.; Oosterlaan, J. Alterations in the ventral attention network during the stop-signal task in children with ADHD: An event-related potential source imaging study. J. Atten. Disord. 2018, 22, 639–650. [Google Scholar] [CrossRef]
- Giard, M.H.; Peronnet, F. Auditory-visual integration during multimodal object recognition in humans: A behavioral and electrophysiological study. J. Cogn. Neurosci. 1999, 11, 473–490. [Google Scholar] [CrossRef]
- Fort, A.; Delpuech, C.; Pernier, J.; Giard, M.-H. Dynamics of cortico-subcortical cross-modal operations involved in audio-visual object detection in humans. Cereb. Cortex 2002, 12, 1031–1039. [Google Scholar] [CrossRef] [Green Version]
- Molholm, S.; Ritter, W.; Murray, M.M.; Javitt, D.C.; Schroeder, C.E.; Foxe, J.J. Multisensory auditory–visual interactions during early sensory processing in humans: A high-density electrical mapping study. Cogn. Brain Res. 2002, 14, 115–128. [Google Scholar] [CrossRef]
- McCracken, H.S.; Murphy, B.A.; Burkitt, J.J.; Glazebrook, C.M.; Yielder, P.C. Audiovisual Multisensory Processing in Young Adults With Attention-Deficit/Hyperactivity Disorder. Multisens. Res. 2020, 1, 1–25. [Google Scholar] [CrossRef]
- McCracken, H.S.; Murphy, B.A.; Glazebrook, C.M.; Burkitt, J.J.; Karellas, A.M.; Yielder, P.C. Audiovisual multisensory integration and evoked potentials in young adults with and without Attention-Deficit/Hyperactivity Disorder. Front. Hum. Neurosci. 2019, 13, 95. [Google Scholar] [CrossRef]
- Shams, L.; Kamitani, Y.; Thompson, S.; Shimojo, S. Sound alters visual evoked potentials in humans. Neuroreport 2001, 12, 3849–3852. [Google Scholar] [CrossRef]
- Calvert, G.A.; Bullmore, E.T.; Brammer, M.J.; Campbell, R.; Williams, S.C.R.; McGuire, P.K.; Woodruff, P.W.R.; Iversen, S.D.; David, A.S. Activation of auditory cortex during silent lipreading. Science 1997, 276, 593–596. [Google Scholar] [CrossRef] [Green Version]
- Thesen, T.; Vibell, J.F.; Calvert, G.A. Neuroimaging of multisensory processing in vision, audition, touch, and olfaction. Cogn. Processing 2004, 5, 84–93. [Google Scholar] [CrossRef]
- Duhamel, J.-R.; Colby, C.L.; Goldberg, M.E. Congruent representations of visual and somatosensory space in single neurons of monkey ventral intra-parietal cortex (area VIP). In Brain and Space; Paillard, J., Ed.; Oxford University Press: Oxford, UK, 1991. [Google Scholar]
- Bruce, C.; Desimone, R.; Gross, C.G. Visual properties of neurons in a polysensory area in superior temporal sulcus of the macaque. J. Neurophysiol. 1981, 46, 369–384. [Google Scholar] [CrossRef]
- Benevento, L.; Fallon, J.; Davis, B.; Rezak, M. Auditory-visual interaction in single cells in the cortex of the superior temporal sulcus and the orbital frontal cortex of the macaque monkey. Exp. Neurol. 1977, 57, 849–872. [Google Scholar] [CrossRef]
- Andersen, R.A.; Snyder, L.H.; Bradley, D.C.; Xing, J. Multimodal representation of space in the posterior parietal cortex and its use in planning movements. Annu. Rev. Neurosci. 1997, 20, 303–330. [Google Scholar] [CrossRef] [Green Version]
- MacSweeney, M.; Amaro, E.; Calvert, G.A.; Campbell, R.; David, A.S.; McGuire, P.; Williams, S.C.; Woll, B.; Brammer, M.J. Silent speechreading in the absence of scanner noise: An event-related fMRI study. Neuroreport 2000, 11, 1729–1733. [Google Scholar] [CrossRef]
- Calvert, G.; Hansen, P.C.; Iversen, S.D.; Brammer, M.J. Detection of audio-visual integration sites in humans by application of electrophysiological criteria to the BOLD effect. Neuroimage 2001, 14, 427–438. [Google Scholar] [CrossRef] [Green Version]
- Stevenson, R.A.; Ghose, D.; Fister, J.K.; Sarko, D.K.; Altieri, N.A.; Nidiffer, A.R.; Kurela, L.R.; Siemann, J.K.; James, T.W.; Wallace, M. Identifying and Quantifying Multisensory Integration: A Tutorial Review. Brain Topogr. 2014, 27, 707–730. [Google Scholar] [CrossRef]
- Pascual-Marqui, R.D. Standardized low-resolution brain electromagnetic tomography (sLORETA): Technical details. Methods Find Exp. Clin. Pharmacol. 2002, 24, 5–12. [Google Scholar]
- Dankner, Y.; Shalev, L.; Carrasco, M.; Yuval-Greenberg, S. Prestimulus Inhibition of Saccades in Adults With and Without Attention-Deficit/Hyperactivity Disorder as an Index of Temporal Expectations. Psychol. Sci. 2017, 28, 835–850. [Google Scholar] [CrossRef] [PubMed] [Green Version]
- Van de Glind, G.; van den Brink, W.; Koeter, M.W.J.; Carpentier, P.; van Emmerik-van Oortmerssen, K.; Kaye, S.; Skutle, A.; Bu, E.-T.H.; Franck, J.; Konstenius, M.; et al. Validity of the Adult ADHD Self-Report Scale (ASRS) as a screener for adult ADHD in treatment seeking substance use disorder patients. Drug Alcohol Depend. 2013, 132, 587–596. [Google Scholar] [CrossRef] [Green Version]
- Laurienti, P.J.; Burdette, J.H.; Maldjian, J.A.; Wallace, M.T. Enhanced multisensory integration in older adults. Neurobiol. Aging 2006, 27, 1155–1163. [Google Scholar] [CrossRef] [PubMed]
- Farid, B.; Yielder, P.; Holmes, M.; Haavik, H.; Murphy, B.A. Association of Subclinical Neck Pain With Altered Multisensory Integration at Baseline and 4-Week Follow-up Relative to Asymptomatic Controls. J. Manip. Physiol. Ther. 2018, 41, 81–91. [Google Scholar] [CrossRef]
- Karellas, A.M.; Yielder, P.; Burkitt, J.J.; McCracken, H.S.; Murphy, B.A. The Influence of Subclinical Neck Pain on Neurophysiological and Behavioral Measures of Multisensory Integration. Brain Sci. 2019, 9, 362. [Google Scholar] [CrossRef] [PubMed] [Green Version]
- Mulert, C.; Jäger, L.; Schmitt, R.; Bussfeld, P.; Pogarell, O.; Möller, H.-J.; Juckel, G.; Hegerl, U. Integration of fMRI and simultaneous EEG: Towards a comprehensive understanding of localization and time-course of brain activity in target detection. Neuroimage 2004, 22, 83–94. [Google Scholar] [CrossRef] [PubMed]
- Worrell, G.A.; Lagerlund, T.D.; Sharbrough, F.W.; Brinkmann, B.; Busacker, N.E.; Cicora, K.M.; O‘Brien, T. Localization of the epileptic focus by low-resolution electromagnetic tomography in patients with a lesion demonstrated by MRI. Brain Topogr. 2000, 12, 273–282. [Google Scholar] [CrossRef]
- Zumsteg, D.; Wennberg, R.A.; Treyer, V.; Buck, A.; Wieser, H.G. H215O or 13NH3 PET and electromagnetic tomography (LORETA) during partial status epilepticus. Neurology 2005, 65, 1657–1660. [Google Scholar] [CrossRef]
- Olbrich, S.; Mulert, C.; Karch, S.; Trenner, M.; Leicht, G.; Pogarell, O.; Hegerl, U. EEG-vigilance and BOLD effect during simultaneous EEG/fMRI measurement. Neuroimage 2009, 45, 319–332. [Google Scholar] [CrossRef]
- Nichols, T.E.; Holmes, A.P. Nonparametric permutation tests for functional neuroimaging: A primer with examples. Hum. Brain Mapp. 2002, 15, 1–25. [Google Scholar] [CrossRef] [Green Version]
- Navid, M.S.; Lelic, D.; Niazi, I.K.; Holt, K.; Mark, E.; Drewes, A.; Haavik, H. The effects of chiropractic spinal manipulation on central processing of tonic pain-a pilot study using standardized low-resolution brain electromagnetic tomography (sLORETA). Sci. Rep. 2019, 9, 6925. [Google Scholar] [CrossRef] [Green Version]
- Borich, M.; Brodie, S.; Gray, W.; Ionta, S.; Boyd, L. Understanding the role of the primary somatosensory cortex: Opportunities for rehabilitation. Neuropsychologia 2015, 79, 246–255. [Google Scholar] [CrossRef] [Green Version]
- Nolte, J. The Human Brain: An Introduction to Its Functional Anatomy; Elsevier: Philadelphia, PA, USA, 2008. [Google Scholar]
- Sur, M. Receptive fields of neurons in areas 3b and 1 of somatosensory cortex in monkeys. Brain Res. 1980, 198, 465–471. [Google Scholar] [CrossRef]
- Choi, M.-H.; Kim, H.-S.; Baek, J.-H.; Lee, J.-C.; Park, S.-J.; Jeong, U.-H.; Gim, S.-Y.; Kim, S.-P.; Lim, D.-W.; Chun, S.-C. Differences in activation area within Brodmann Area 2 caused by pressure stimuli on fingers and joints: In case of male subjects. Medicine 2015, 94, e1657. [Google Scholar] [CrossRef]
- Vibell, J.; Van Velzen, J.; Gillmeister, H.; Sel, A.; Haggarty, C.; Forster, B. Somatosensory Electroencephalography. In Somatosensory Research Methods; Neuromethods; Holmes, N., Ed.; Springer: Berlin/Heidelberg, Germany, in press.
- Michael-Titus, A.; Revest, P.; Shortland, P. The Nervous System (Second Edition)—4—THE SPINAL CORD; Churchill Livingstone: London, UK, 2010; pp. 59–78. [Google Scholar]
- Schneider, R.J.; Kulics, A.; Ducker, T.B. Proprioceptive pathways of the spinal cord. J. Neurol. Neurosurg. Psychiatry 1977, 40, 417–433. [Google Scholar] [CrossRef] [Green Version]
- Raju, H.; Tadi, P. Neuroanatomy, somatosensory cortex. In StatPearls [Internet]; StatPearls Publishing: Treasure Island, FL, USA, 2020. [Google Scholar]
- Brandeis, D.; van Leeuwen, T.; Rubia, K.; Vitacco, D.; Steger, J.; Pascual-Marqui, R.; Steinhausen, H.-C. Neuroelectric mapping reveals precursor of stop failures in children with attention deficits. Behav. Brain Res. 1998, 94, 111–125. [Google Scholar] [CrossRef]
- Vance, A.; Silk, T.; Casey, M.; Rinehart, N.; Bradshaw, J.L.; Bellgrove, M.; Cunnington, R. Right parietal dysfunction in children with attention deficit hyperactivity disorder, combined type: A functional MRI study. Mol. Psychiatry 2007, 12, 826–832. [Google Scholar] [CrossRef] [Green Version]
- Aman, C.J.; Roberts, R.J., Jr.; Pennington, B.F. A neuropsychological examination of the underlying deficit in attention deficit hyperactivity disorder: Frontal lobe versus right parietal lobe theories. Dev. Psychol. 1998, 34, 956. [Google Scholar] [CrossRef]
- Chan, E.; Mattingley, J.B.; Huang-Pollock, C.; English, T.; Hester, R.; Vance, A.; Bellgrove, M.A. Abnormal spatial asymmetry of selective attention in ADHD. J. Child Psychol. Psychiatry 2009, 50, 1064–1072. [Google Scholar] [CrossRef]
- Wolosin, S.M.; Richardson, M.E.; Hennessey, J.G.; Denckla, M.B.; Mostofsky, S.H. Abnormal cerebral cortex structure in children with ADHD. Hum. Brain Mapp. 2009, 30, 175–184. [Google Scholar] [CrossRef] [Green Version]
- Corbetta, M.; Miezin, F.M.; Shulman, G.L.; Petersen, S.E. A PET study of visuospatial attention. J. Neurosci. 1993, 13, 1202–1226. [Google Scholar] [CrossRef]
- Nobre, A.C.; Sebestyen, G.N.; Gitelman, D.; Mesulam, M.M.; Frackowiak, R.; Frith, C. Functional localization of the system for visuospatial attention using positron emission tomography. Brain A J. Neurol. 1997, 120, 515–533. [Google Scholar] [CrossRef] [Green Version]
- Gitelman, D.R.; Nobre, A.C.; Parrish, T.B.; LaBar, K.S.; Kim, Y.H.; Meyer, J.R.; Mesulam, M. A large-scale distributed network for covert spatial attention: Further anatomical delineation based on stringent behavioural and cognitive controls. Brain 1999, 122, 1093–1106. [Google Scholar] [CrossRef] [Green Version]
- Carter, C.S.; Krener, P.; Chaderjian, M.; Northcutt, C.; Wolfe, V. Asymmetrical visual-spatial attentional performance in ADHD: Evidence for a right hemispheric deficit. Biol. Psychiatry 1995, 37, 789–797. [Google Scholar] [CrossRef]
- Booth, J.R.; Burman, D.D.; Meyer, J.R.; Lei, Z.; Trommer, B.L.; Davenport, N.; Li, W.; Parrish, T.B.; Gitelman, D.; Mesulam, M.M. Larger deficits in brain networks for response inhibition than for visual selective attention in attention deficit hyperactivity disorder (ADHD). J. Child Psychol. Psychiatry 2005, 46, 94–111. [Google Scholar] [CrossRef] [PubMed]
- Driver, J.; Noesselt, T. Multisensory interplay reveals crossmodal influences on ‘sensory-specific’ brain regions, neural responses, and judgments. Neuron 2008, 57, 11–23. [Google Scholar] [CrossRef] [PubMed] [Green Version]
- Mostofsky, S.H.; Rimrodt, S.L.; Schafer, J.G.; Boyce, A.; Goldberg, M.C.; Pekar, J.; Denckla, M.B. Atypical motor and sensory cortex activation in attention-deficit/hyperactivity disorder: A functional magnetic resonance imaging study of simple sequential finger tapping. Biol. Psychiatry 2006, 59, 48–56. [Google Scholar] [CrossRef]
- Talsma, D.; Doty, T.J.; Woldorff, M.G. Selective attention and audiovisual integration: Is attending to both modalities a prerequisite for early integration? Cereb. Cortex 2007, 17, 679–690. [Google Scholar] [CrossRef] [Green Version]


Publisher’s Note: MDPI stays neutral with regard to jurisdictional claims in published maps and institutional affiliations. |
© 2022 by the authors. Licensee MDPI, Basel, Switzerland. This article is an open access article distributed under the terms and conditions of the Creative Commons Attribution (CC BY) license (https://creativecommons.org/licenses/by/4.0/).
Share and Cite
McCracken, H.S.; Murphy, B.A.; Ambalavanar, U.; Glazebrook, C.M.; Yielder, P.C. Source Localization of Audiovisual Multisensory Neural Generators in Young Adults with Attention-Deficit/Hyperactivity Disorder. Brain Sci. 2022, 12, 809. https://doi.org/10.3390/brainsci12060809
McCracken HS, Murphy BA, Ambalavanar U, Glazebrook CM, Yielder PC. Source Localization of Audiovisual Multisensory Neural Generators in Young Adults with Attention-Deficit/Hyperactivity Disorder. Brain Sciences. 2022; 12(6):809. https://doi.org/10.3390/brainsci12060809
Chicago/Turabian StyleMcCracken, Heather S., Bernadette A. Murphy, Ushani Ambalavanar, Cheryl M. Glazebrook, and Paul C. Yielder. 2022. "Source Localization of Audiovisual Multisensory Neural Generators in Young Adults with Attention-Deficit/Hyperactivity Disorder" Brain Sciences 12, no. 6: 809. https://doi.org/10.3390/brainsci12060809