1. Introduction
The recent environmental regulations require structures with lighter weight and improved performance. Steel is one of the most important structural materials worldwide, and therefore the developments in structural steel have a global industrial impact. When producing durable structures from the steel, weldability is an important material property because most constructions require welding in some point of the production chain. Recently, the weldability of a high strength steel (HSS) has been improved based on the ability to achieve high yield strength also with low carbon content. In addition, enlightened usage of micro-alloying elements helps improving properties, including the impact toughness, of the welded components [
1]. Still, the biggest challenge in welding of HSS is to maintain the good balance of strength and toughness after welding because the fusion welding induces high thermal gradients and severe microstructural changes in the weld zone.
From the beginning of 1990s, the weldability of structural steels with tensile strength of more than 780 MPa has been researched widely [
2]. One challenge is the excessive softening of the HAZ. Zhang et al. [
3] researched the microstructures and mechanical properties of weld-repaired HSLA steel. The hardness of the base material (BM) ranged between 224 and 264 HV, whereas the hardness of the softest zone of the heat affected zone (HAZ) was approximately 150 HV [
3], emphasizing a significant mismatch when comparing BM hardness to the minimum HAZ hardness. Depending on the composition and the initial microstructure of the material, different mechanisms can cause the softening. For example, Wang et al. [
4] studied the softening mechanisms during laser welding in dual-phase steels using Gleeble simulation. The peak temperatures reached in the softest HAZ were between Ac1 and Ac3 (730–870 °C in this case). Some softening occurred also in lower temperatures caused by the tempering of the martensite as the maximum temperature exceeded 250 °C [
4]. In multi-pass welding complex, an HAZ configuration occurs based on overlapping regions [
5]. Hence, intercritically reheated and tempered regions form and these regions may have completely different mechanical properties than unaltered HAZ regions. The softening can be reduced by inhibiting the excessive grain growth in the HAZ. It has been observed that grain coarsening and excessive softening in the heat-affected zone can be inhibited by the usage of micro-alloying elements like V, Nb or Ti and hence the weldability of HSS can be improved [
1]. Though the effect of these elements in preventing grain growth depends significantly on the local temperature history as, e.g., the TiN precipitates are stable even at temperatures approaching 1300 °C, whereas the amount of Nb as NbC precipitates undergoes dissolution above 1000 °C [
6,
7]. Nano-sized carbides in ferrite matrix formed by micro-alloying elements help avoiding excessive softening in the HAZ [
8]. Welding methods, in which the heat input is restricted, may result in improved weld properties as reported by Farrokhi et al. [
9]. Farrokhi et al. reported about fiber laser welding (10 kW) of direct quenched ultra-high strength steel (yield strength of 960 MPa). High quality welds were obtained with good impact toughness values up to −40 °C [
9]. The weld bead geometry and mechanical properties of the weld can also be improved by small modifications in the welding process, like utilizing activating fluxes during arc welding with solid wire. For example, Her-Yueh [
10] evaluated the effect of three different activating flux aided MIG/MAG (metal inert/active gas) on the weld joint characteristics for low carbon steel AISI 1020. The usage of the fluxes was beneficial for the mechanical properties of the weld and also angular distortion was reduced [
10].
In addition to the softening, the loss of toughness properties in HAZ is characteristic for the welds of high strength steels. Especially in quenched and tempered (Q&T), HSS brittle and hard domains can occur in the coarse grained HAZ (CGHAZ) [
11,
12]. The steels subjected to the thermomechanical control process (TMCP) and precipitation hardening and characterised by a high yield point as the S700MC are obtained through precipitation, solution, and strain hardening as well as by using grain-refinement-related processes. Górka [
13] studied the effect of micro-constituents responsible for the hardening of the S700MC steel, namely the Ti, Nb, N, and C. The hardening is primarily affected by (Ti,Nb)(C,N)-type dispersive precipitates sized from several nanometres to between ten and twenty nanometres. The fusion welding process such as MAG, considerably differs from the original TMCP conditions, leading to the reduction of plastic properties both in the HAZ and in the weld zone.
In comparison with the application of a single pass advanced welding solutions to modern TMCP HSS with a minimum yield strength of 700 MPa, as demonstrated by Sorger et al. [
14,
15] in the application of friction stir welding with faster welding speed conditions, or Górka et al. [
16] in the application of hybrid laser arc welding, the multi-pass fusion welding can induce excessive decrease of impact-toughness, eventually due to the intercritically reheated domains that are formed in the HAZ [
17,
18]. On this scope, Hu et al. [
19] observed that V-N micro-alloying improved the toughness of the ICCGHAZ (inter-critically reheated coarse grained heat affected zone) by decreasing the size of M/A (martensitic/austenitic) constituents and refining the ferrite forming on the prior austenite grain boundaries [
19]. Concerning the improvement of the impact toughness of the HAZ, Sung et al. [
20] reported that an increased amount of acicular ferrite in HAZ is beneficial for the impact toughness. Oxide inclusions in sufficient sizes acted as nucleation sites for acicular ferrite and thereby promoted the formation of it [
20]. It has also been proposed by Melloy et al. [
21] that boron in sufficient contents (less than 0.0025 wt.%) improves the impact toughness by promoting the formation of acicular ferrite and inhibiting the grain boundary ferrite formation [
21].
This work investigates the influence of four different heat inputs of MAG welds on the mechanical properties and inherent microstructure of three different modern HSS with minimum yield strength of 700 MPa.
2. Materials and Methods
The base materials used in this study comprised three different modern HSS produced by SSAB. The chemical composition of the S700MC-1 and the S690QL will be disclosed, but the S700MC-2 is a recent tentative development from the S700MC-1, and thus its chemical composition is confidential, although its carbon equivalent will be disclosed. Anyway, including this new steel in the research results emphasizes how small adjustments in the micro-alloying elements, which results in some important differences in mechanical performance. The S700MC-1 and S700MC-2 steels were produced by TMCP meeting the requirements set in the standard EN 10149-2 [
22]. The chemical composition of the S700MC-1 is [max. wt.%] 0.12 C; 0.25 Si; 2.1 Mn; 0.015 (min.) Al; 0.01 S; 0.02 P; 0.09 Nb; 0.15 Ti; 0.2 V (note: sum of Nb + Ti + V ≤ 0.22 wt.%). The carbon equivalent CEV (also named CE
IIW [
23]) of the S700MC-1 is CEV = 0.37. The S700MC-2 is known to be similar as in the S700MC-1, with small adjustments in contents of micro-alloying elements, namely with higher Cr, resulting in a CEV = 0.44. A third of the test materials was the S690QL with chemical composition [max. wt.%] 0.2 C; 0.6 Si; 1.6 Mn; 0.8 Cr; 0.01 S; 0.02 P; 2.0 Ni; 0.3 Cu; 0.7 Mo; and 0.005 B. The S690QL was produced by quenching and tempering (Q&T) method fulfilling the requirements in the standard EN 10025-6:2004 + A1 [
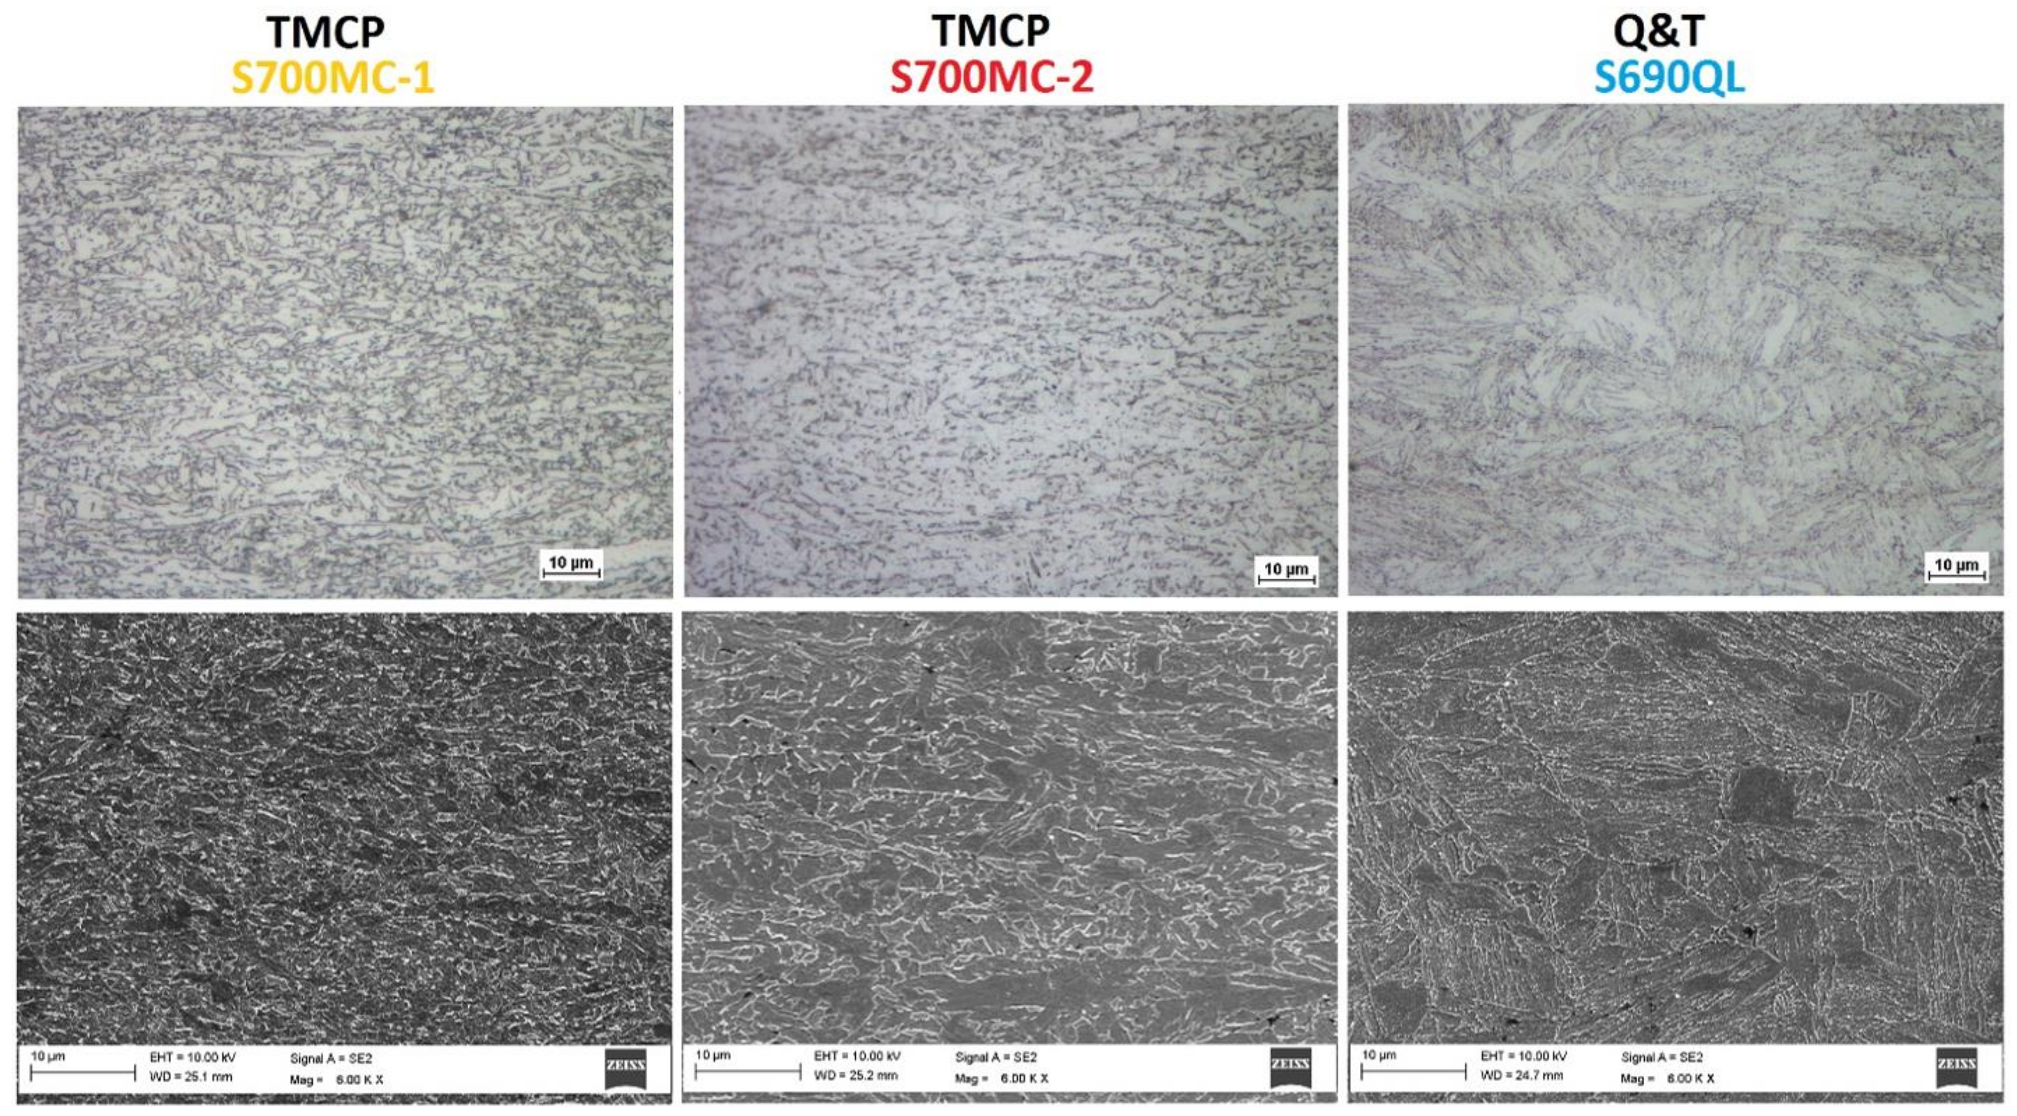
24]. The CEV of the S690QL is CEV = 0.42. The plate thickness of all base materials was 8 mm.
Figure 1 depicts the microstructure of the base materials.
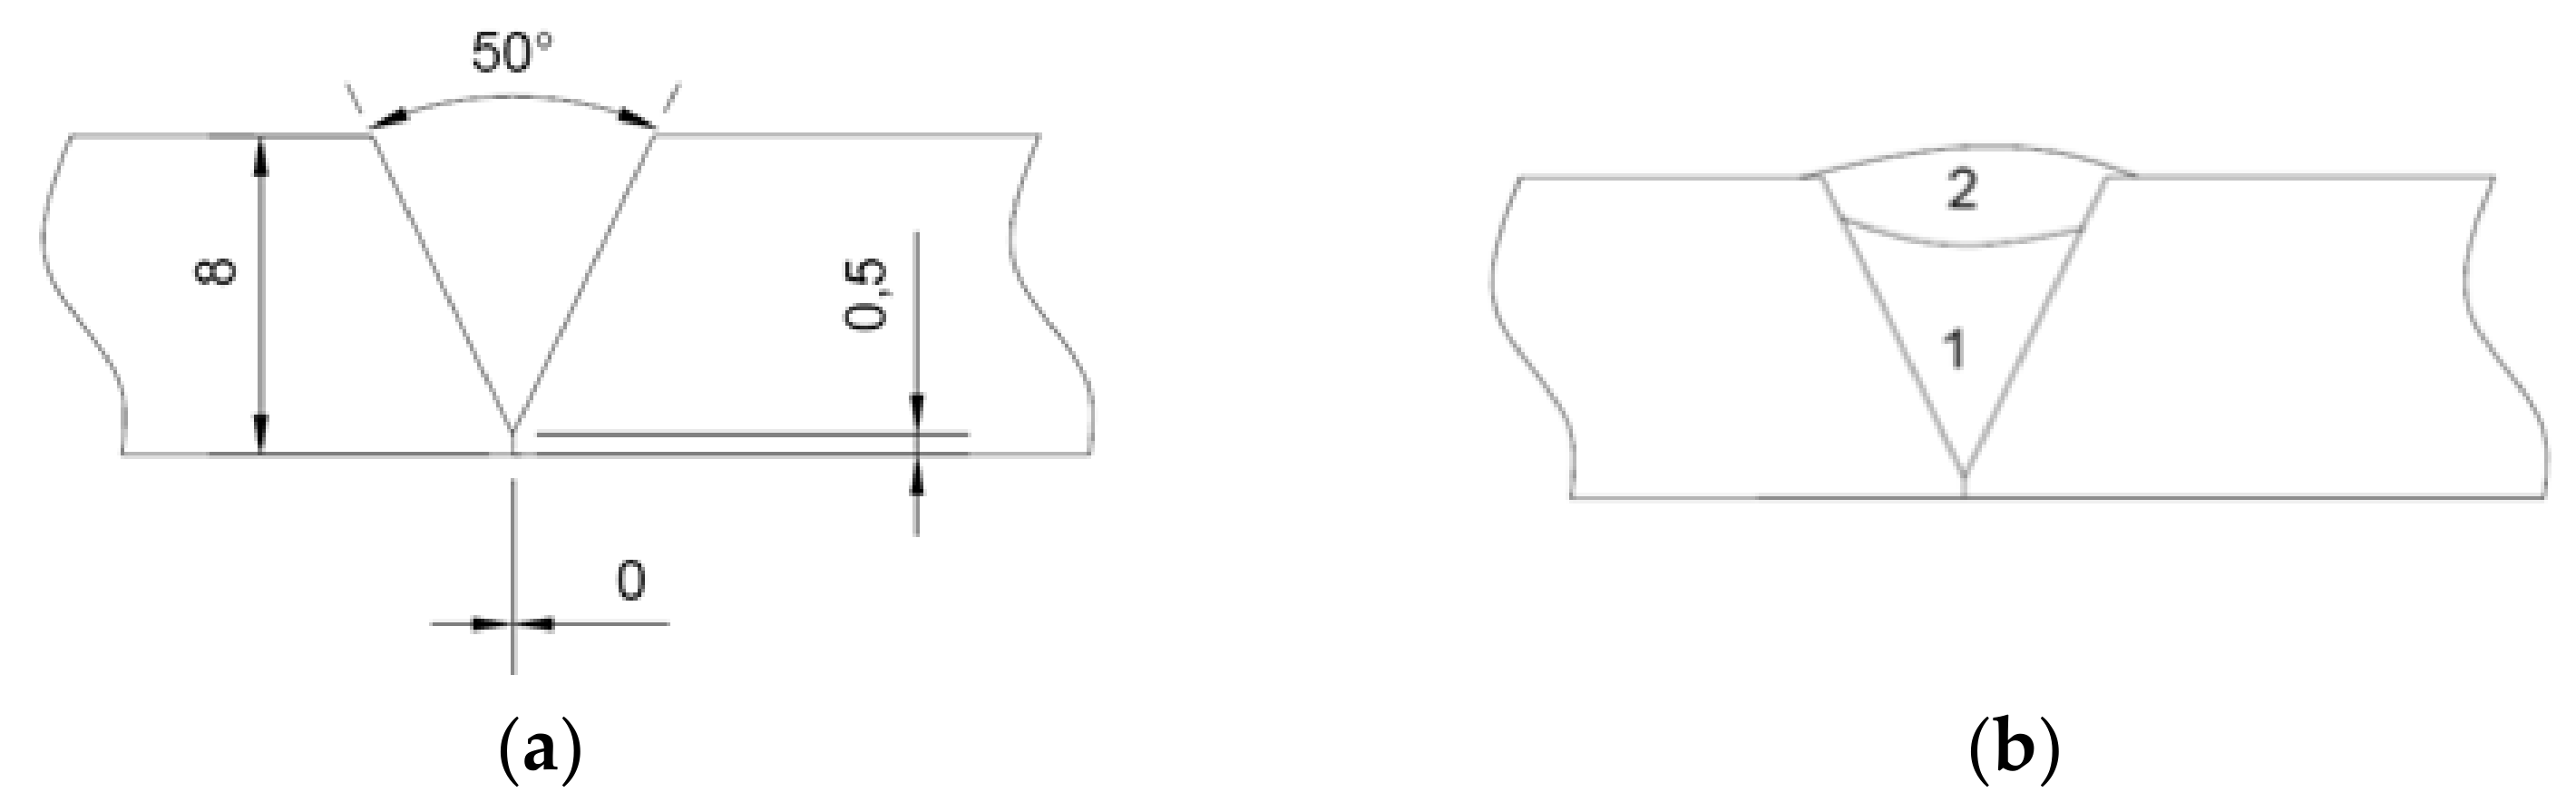
The base materials were welded using a Kemppi Promig 530 automatized system with matching 1 mm in diameter Böhler X 70-IG wire (EN ISO 16834-A: G 69 5 M Mn3Ni1CrMo). The shielding gas was MISON 8 (Ar + 8% CO
2 + 0.03% NO) with a flow of 19 L/min. The groove was V-shaped with 50° angle as shown in
Figure 2. Two weld passes were applied in flat welding position, with no backing bar. The weld bead length was 1000 mm deposited parallel to the final rolling direction, joining plates 200 mm wide, before welding. The stand-off distance was about 15 mm in all welds. The root pass was always made with the same heat input: 0.7 kJ/mm (I = 253 A DC+; V = 25.8 V; v = 560 mm/min). A second pass was made with four different values of heat inputs, namely: 0.7 kJ/mm (I = 268 A DC+; V = 27.8 V; v = 638 mm/min); 1.0 kJ/mm (I = 270 A DC+; V = 28.6 V; v = 463 mm/min); 1.2 kJ/mm (I = 269 A DC+; V = 29.0 V; v = 390 mm/min); and 1.4 kJ/mm (I = 271 A DC+; V = 29.0 V; v = 336 mm/min). The heat input is calculated according to EN ISO 1011-1 considering a thermal efficiency of 0.8 (MAG welding process). These four different heat input values resulted in four different cooling rates, expressed as t
8/5 [s] cooling times and estimated analytically based on three-dimensional heat conduction according to guidelines established in [
25]. The four different t
8/5 values obtained were: 5 s; 10 s; 15 s; and 20 s, respectively.
Figure 2 presents the joint design and welding sequence schematically.
Tensile tests were primarily implemented using an MTS 1200 kN testing machine. The preparation of the specimens followed the standard SFS-EN ISO 4136 [
26]. Gauge length L
0 of 70 mm was used. As the welding direction was parallel to the final rolling direction, tensile tests of the welds were carried out is transversal direction in relation to the rolling direction. Testing temperature was the ambient room temperature. The elongation results correspond to the elongation at break of the test specimen and it was measured as the ratio between changed length after breakage and the initial 70 mm distanced two marks equidistant from the centre of the weld. The yield tensile strength results correspond to the offset yield point with a 0.2% plastic strain.
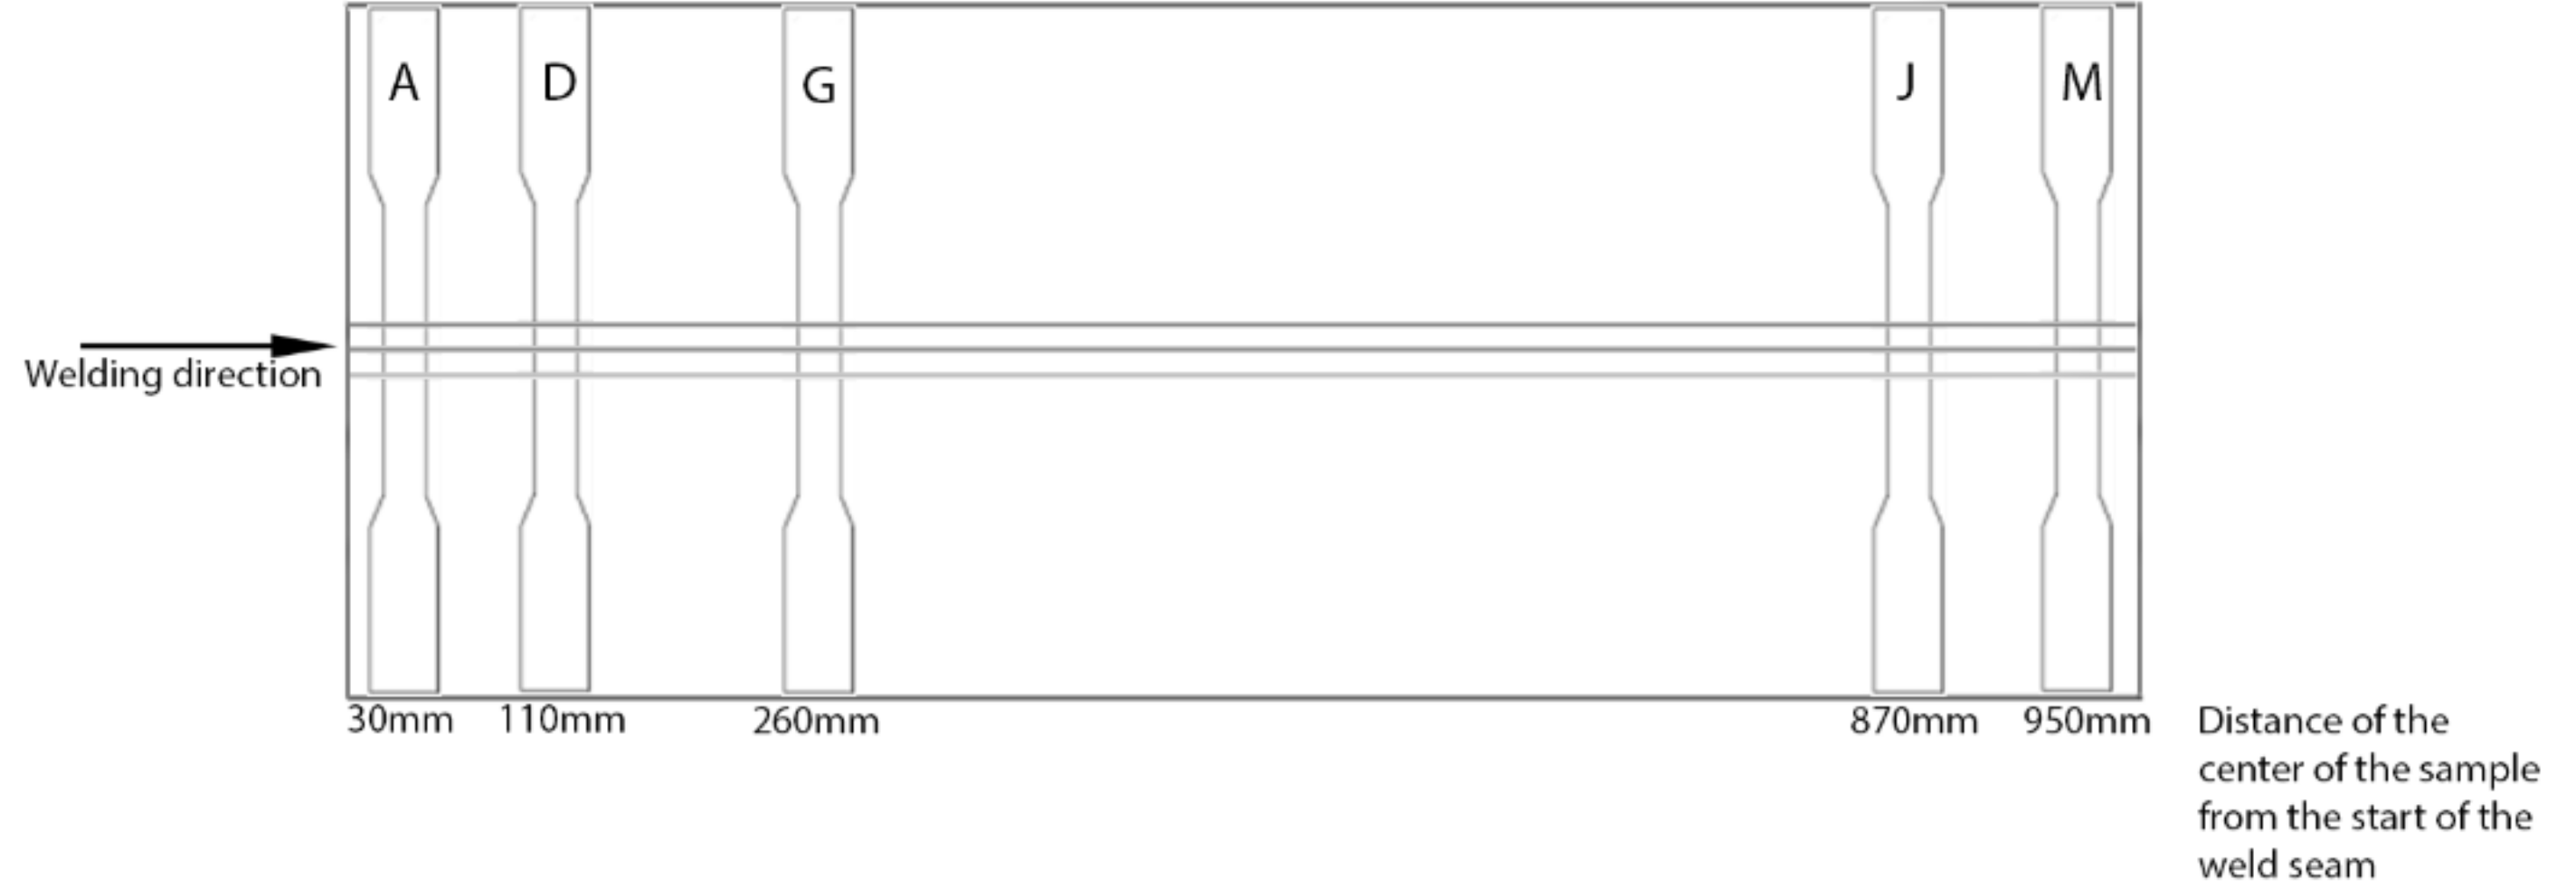
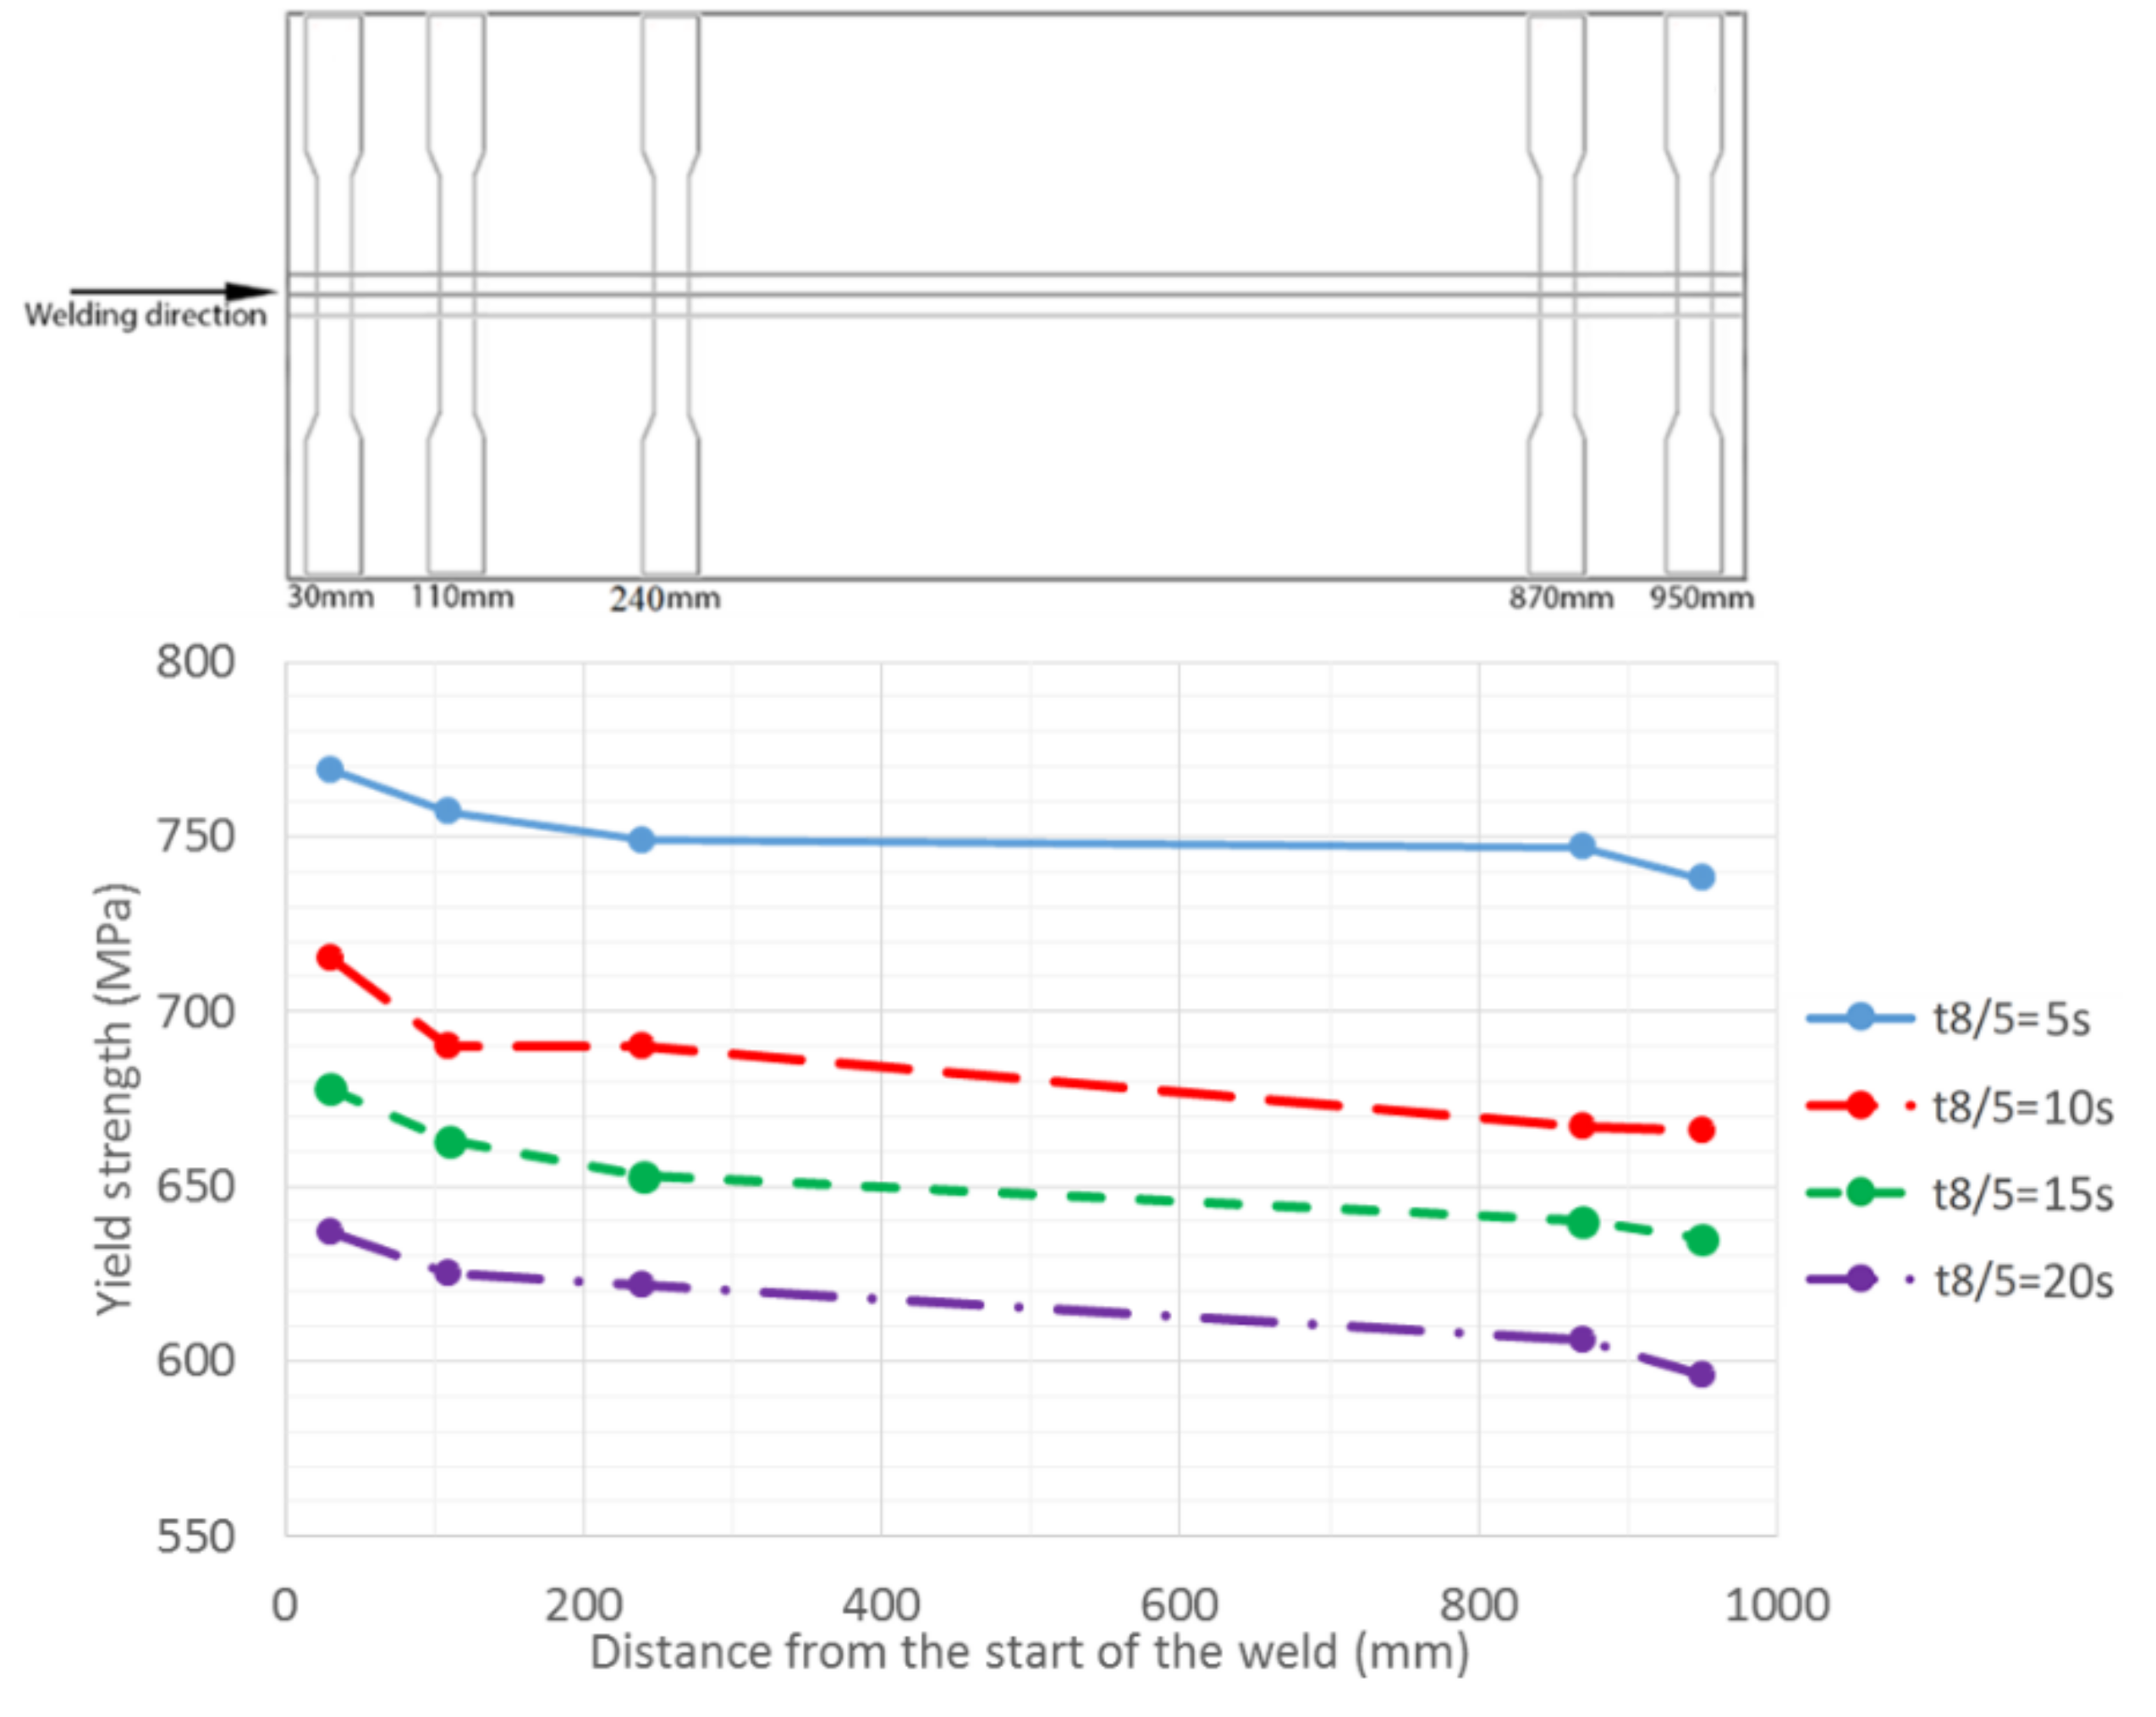
For the welds of the S700MC-1, extended tensile tests were implemented in specimens extracted in the locations represented in
Figure 3. The extended tests are mainly focused on the evaluation of the mechanical strength properties along the weld axis and general bending behaviour, depending on the welding conditions. Considering that all the welding technological parameters and procedures, component’s geometry, and material’s physical properties are similar, it is sufficient to use one of the three materials being investigated. The modern TMCP steel S700MC-1 was the one selected. These results from the extended tensile tests were made with digital image correlation (DIC) measurements, at the frequency of 2 Hz, using a Lavision Imager Pro X camera system. The strain and its localization were estimated by analyzing the images using DaVis software. The main objective of these extended tests was to assess the differences in strength values along the weld seam. Therefore, tensile test specimens were extracted from the welded plate focusing on the transient region of the start and end of the weld. One specimen was removed from the stationary middle region.
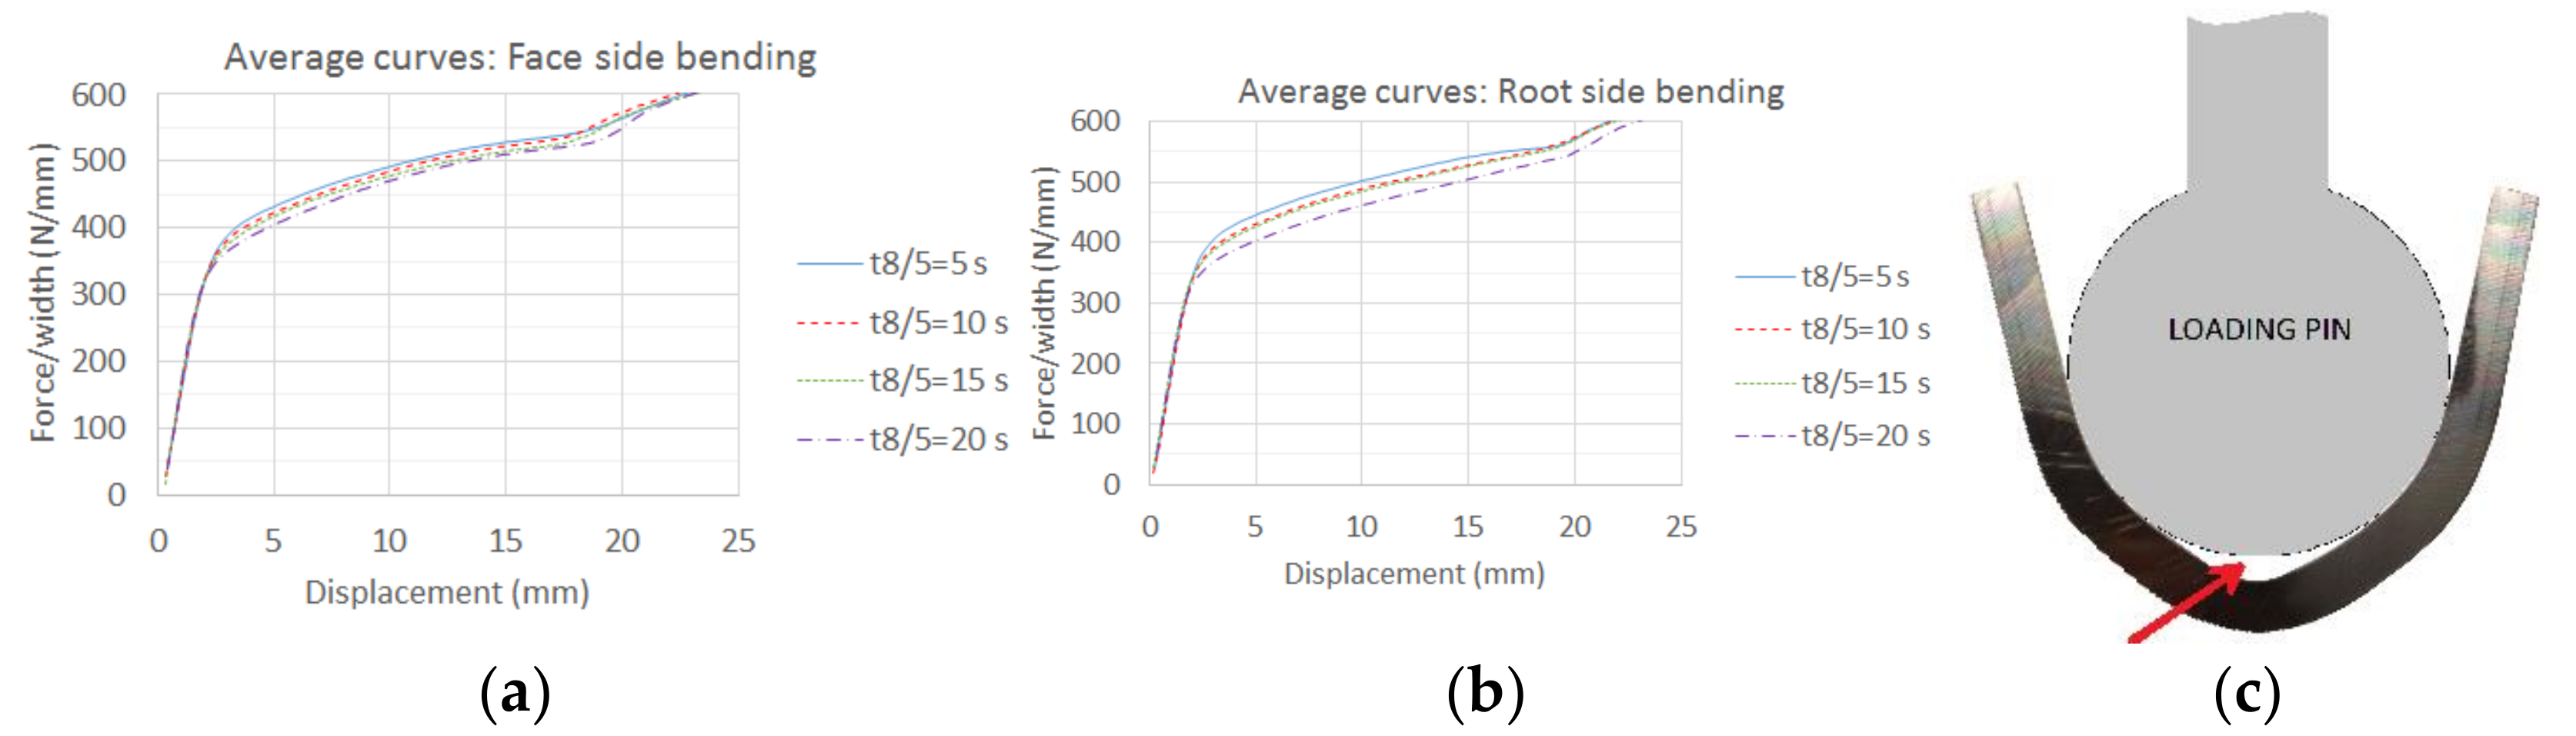
Three-point bending tests were implemented for the material S700MC-1 using an MTS 810 and following the ISO 5173:2009. All four different heat inputs were tested. The dimensions of specimens were 8 × 20 × 140 mm. The edges were rounded and reinforcements were removed by milling on both face and root sides avoiding reduction of plate thickness. The test set was made of one loading anvil and two supporting roller anvils, with 50 mm in diameter, and a support span between the center of the two supporting roller anvils of 122 mm. The velocity of loading anvil was held constant at 0.33 mm/s. Both face and root side bending tests were implemented.
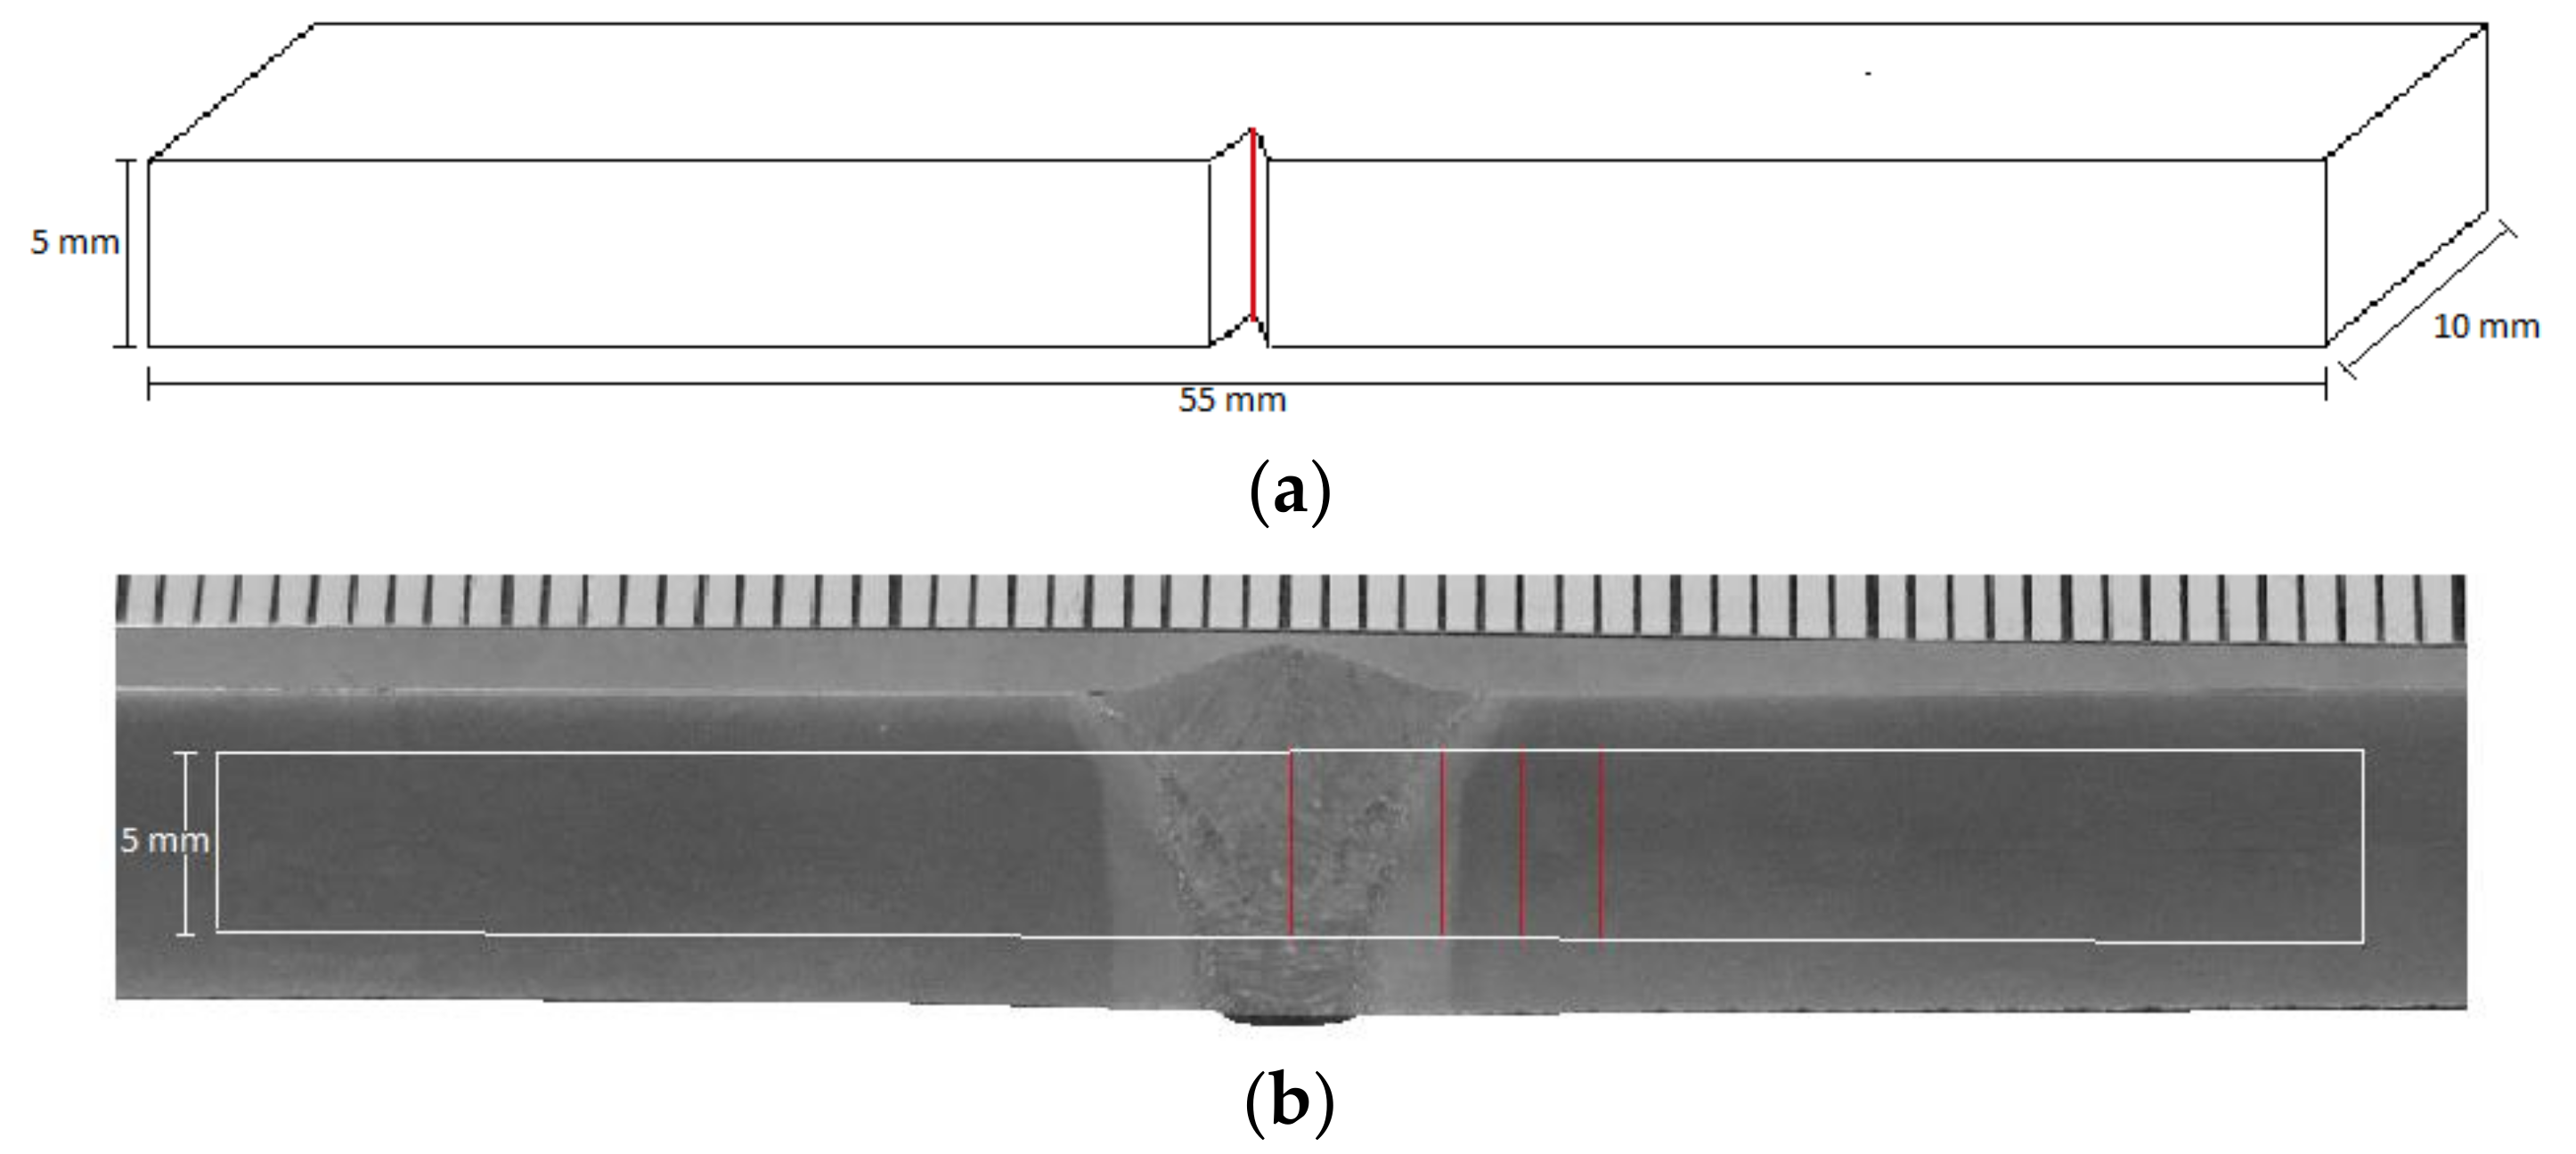
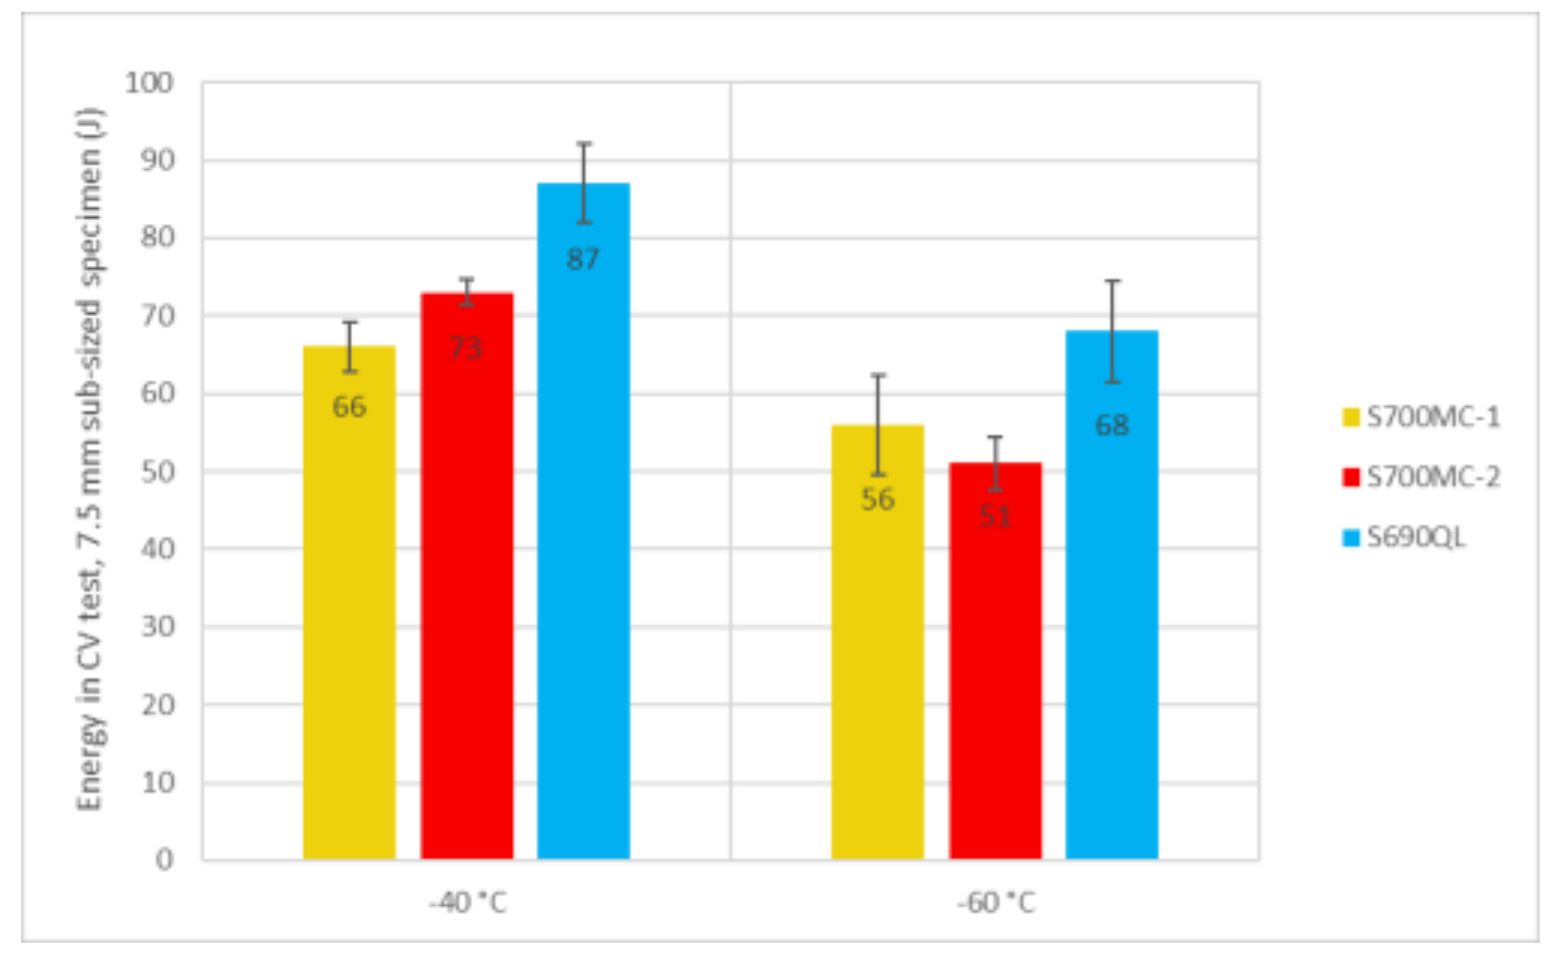
In this study, Charpy-V sub-sized specimens were used. The sub-sized specimens extracted from welds had a thickness of 5 mm (i.e., 5 × 10 × 55 mm). The sub-sized specimens from base material had a thickness of 7.5 mm (i.e., 7.5 × 10 × 55 mm) and were extracted transversally to the final rolling direction. To enable an equivalent analysis, the results obtained with the sub-sized specimens were corrected to the full-sized specimens (i.e., 10 × 10 × 55 mm) by multiplying the energy value by 3/2 in case of 5 mm thick, and by 6/5 in case of 7.5 mm thick sub-sized specimen, according to [
27]. The specimens were prepared according to the standard SFS-EN ISO 148-1 [
28]. The dimensions, the direction and the notch locations are illustrated in
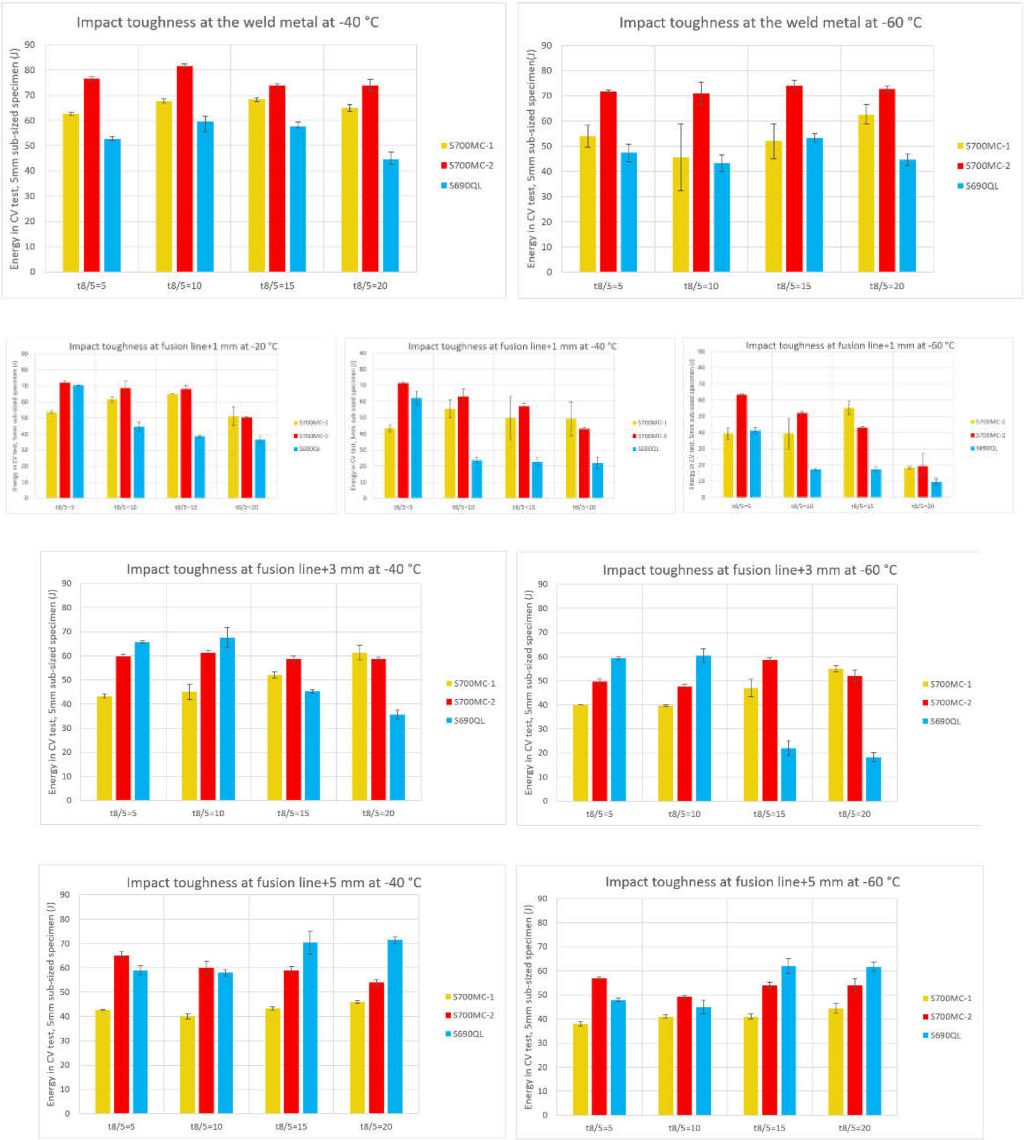
Figure 4. The notches were placed at the weld metal (WM), fusion line (FL) + 1 mm, FL + 3 mm and FL + 5 mm. The specimens having the notch at the FL + 1 mm were tested at −20, –40 and −60 °C. Specimens having the notch at WM, FL + 3 mm and FL + 5 mm were tested only at −40 and −60 °C.
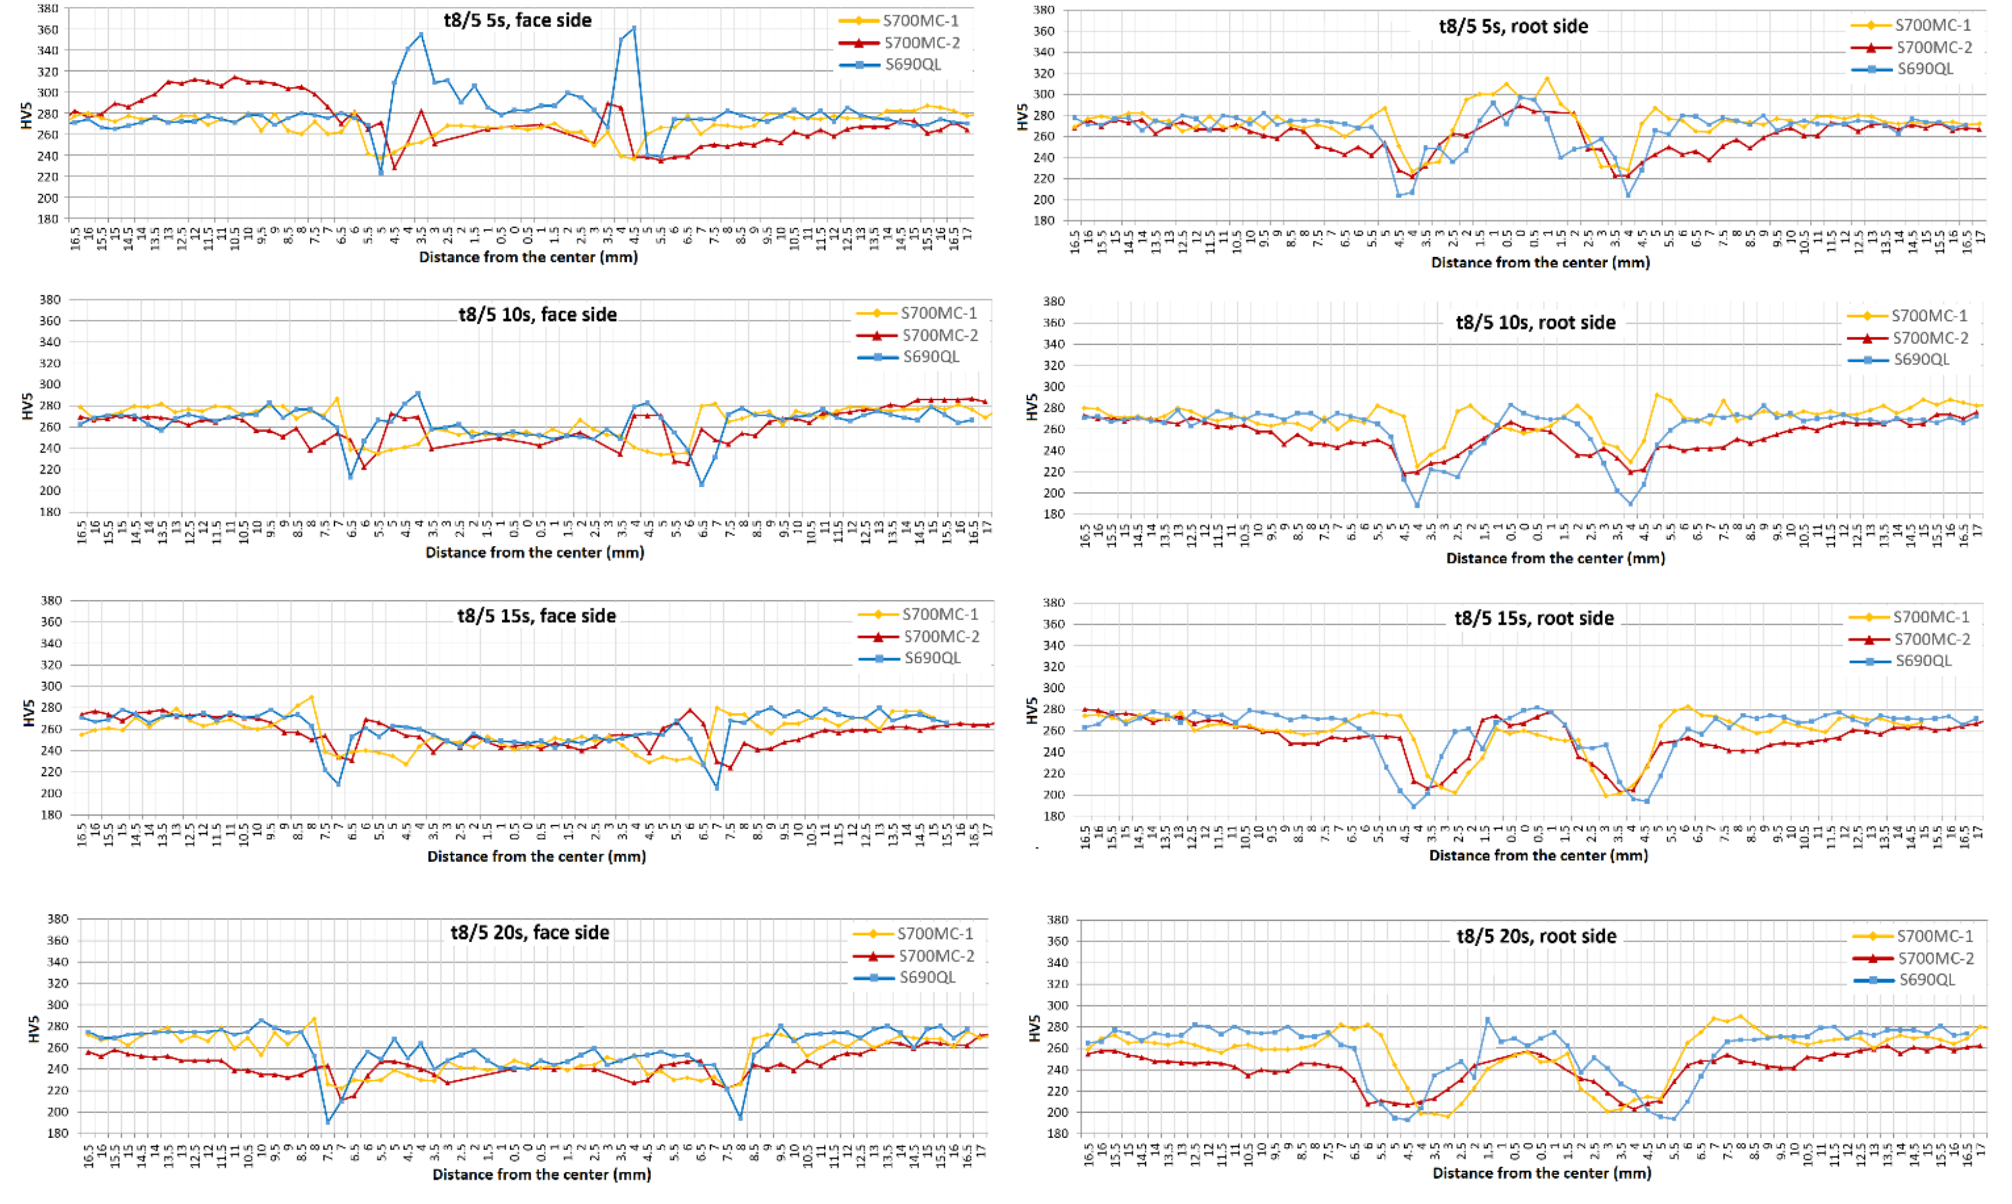
Hardness profiles were determined using the Vickers hardness test, HV5. Face side and root side hardness profiles were measured separately, so that the distance from the face side measuring line to the top of the plate was 1.5 mm and, respectively, the distance from the root side measuring line to the bottom of the plate was 1.5 mm. Distances between the points were 0.5 mm.
For the microstructural analysis, the samples were polished and etched. For the etching, 2% Nital was used, which consists of 2% nitric acid HNO3 and 98% ethanol C2H5OH. The microstructure was analyzed with a Zeiss Ultra 55 scanning electron microscope (SEM).
3. Results and Discussion
3.1. Tensile Tests
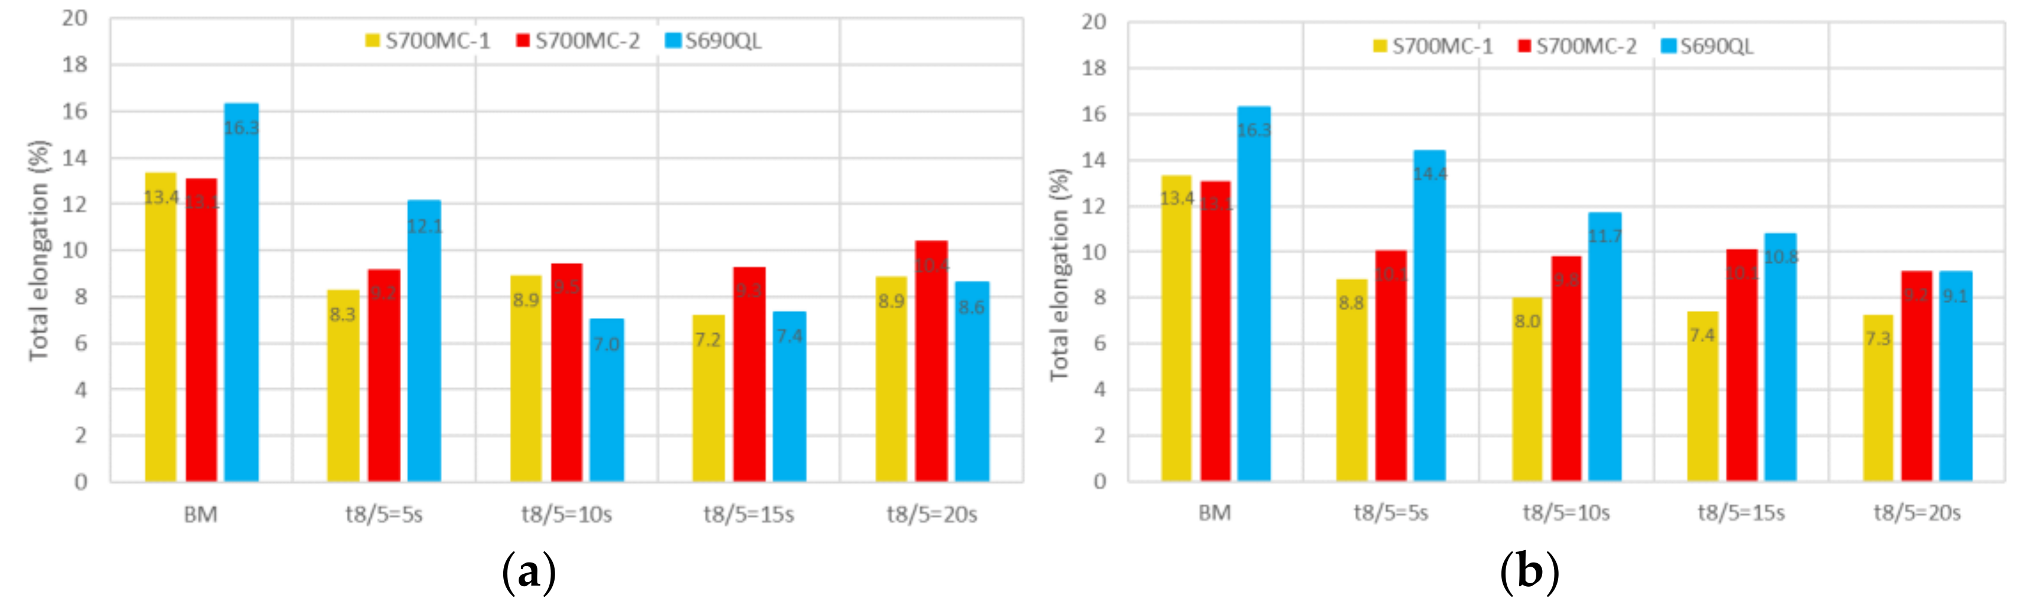
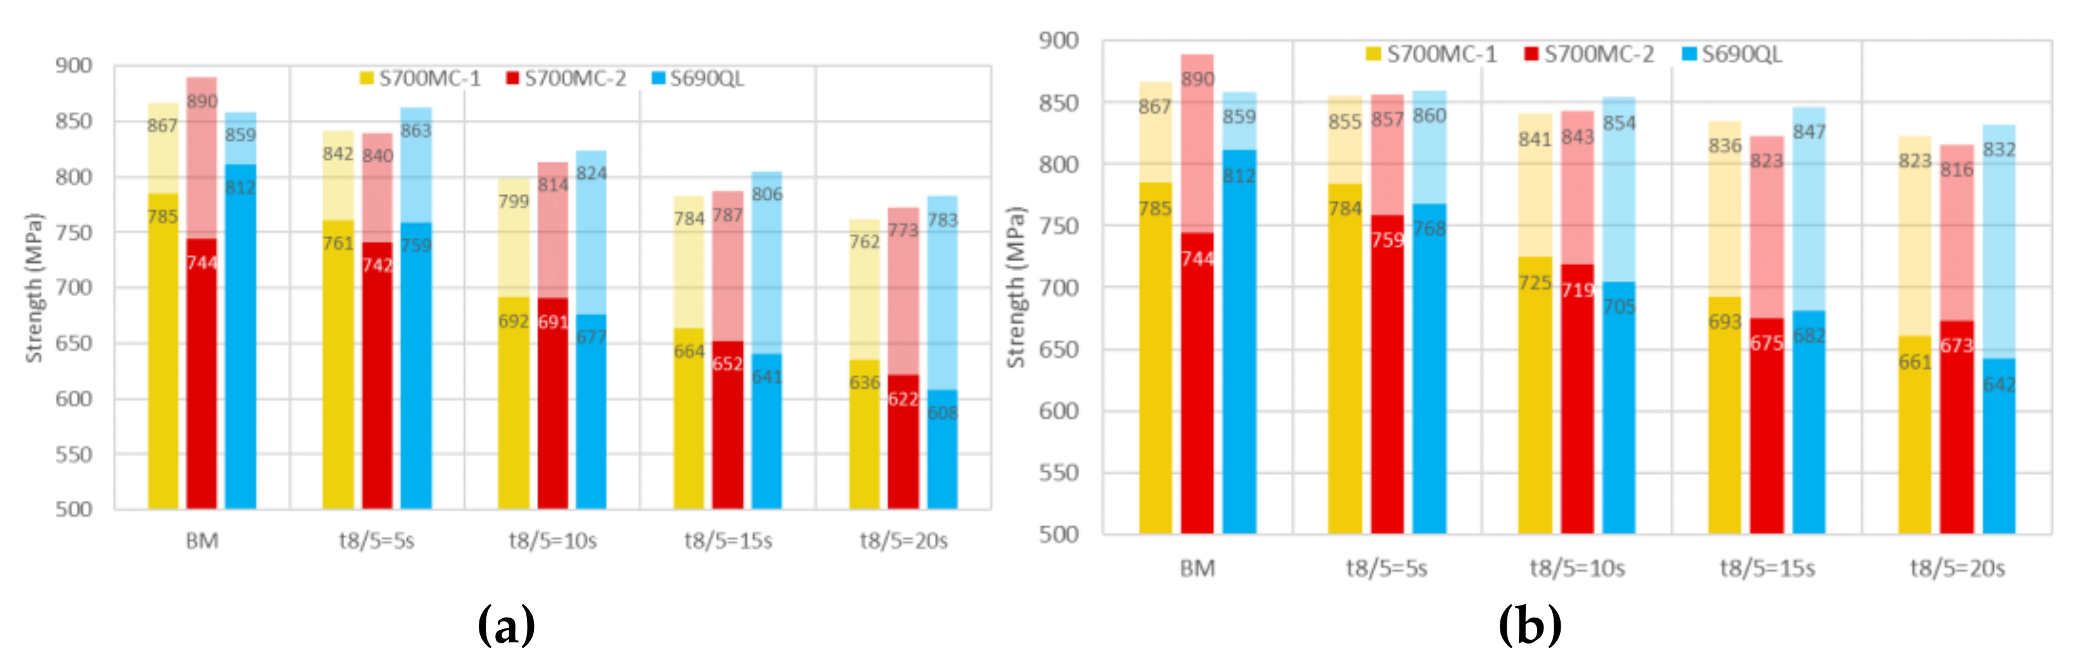
Figure 5 and
Figure 6 present the tensile test results for all base materials. In
Figure 5, elongations are given and, in
Figure 6, strength values are presented. The results are presented for specimens in as-welded (with reinforcement) and in machined condition (with flat surface of weld seam). In
Figure 6, both yield and ultimate tensile strength are given so that the solid bar represents yield strength and the transparent bar represents ultimate tensile strength. For efficiency of the analysis of the results, base material values are also included in the figures.
According to
Figure 5, the total elongation of S690QL is 16.3%, whereas the total elongations of base materials of TMCP (MC) steels are 13.4 and 13.1%. With the lowest heat input, S690QL has as well the longest elongations with differences of 3–4% (machined) and 4–6% (with reinforcement) compared to the TMCP steels. The welding decreases the elongation of all materials, but the elongation of S690QL is more affected by increasing heat input than the elongation of TMCP steels. In S690QL with machined specimens, the elongation reaches the minimum value of 7.0% for the weld t
8/5 = 10 s. In reinforced specimens of S690QL, there is a decreasing trend in elongations of the welds among increasing heat input from the value 14.4% (t
8/5 = 5 s) to 9.1% (t
8/5 = 20 s). However, with reinforcement, S690QL shows the highest elongations even though the elongation is clearly reduced by increasing heat input and therefore, with high heat input, the elongation of S700MC-2 with the value 9.2% is very similar to the value of S690QL (9.1%). With machined weld specimens, the S700MC-2 exhibits the highest elongations (9.3–10.4%), except with the lowest heat input (9.2%). The elongations of S700MC-1 are at all points about 1–2% lower than the elongations of S700MC-2. The reason for the higher drop of elongation of the machined specimens from the S690QL is related with higher strain localization in zones adjacent to the coarse gain zones because less weld metal exists to distribute the deformation energy.
Figure 6 reveals that the yield strength is more affected by the welding heat input than the ultimate tensile strength. The highest yield strength in the base material is measured at the S690QL, which is 812 MPa. Therefore, after welding, the relative decrease in yield strength in S690QL is bigger than in TMCP steels and the same trend can be seen with the machined specimens as well as with the reinforced specimens. When considering the tensile strength, an opposite behavior can be observed. Initially, S690QL has the lowest tensile strength (859 MPa), but, in the welded specimens, the tensile strength is higher than in other materials (Rm of high heat input welds: 783 MPa machined, 832 MPa in as-welded condition). When comparing the TMCP steels with each other, the yield strength of S700MC-1 base material is about 40 MPa higher than in S700MC-2. In that sense, the yield strength of S700MC-2 is maintained better after welding than in S700MC-1 because the strength of the high heat input weld of S700MC-2 is only 14 MPa lower than the S700MC-1 when machined specimens are compared. When considering specimens in as-welded conditions, the yield strength of the high heat input weld of S700MC-2 is 12 MPa higher than the yield strength of S700MC-1. By contrast, the tensile strength of S700MC-2 is initially 23 MPa higher than in S700MC-1. In that regard, S700MC-1 retains the tensile strength better than S700MC-2.
The general trend of the results for both strength and elongation is related with critical microstructural changes induced by the combination of: (i) the cooling rates in the recrystallized zones, affecting the grain size and formation of metallurgic phases; with (ii) the period above critical temperatures where dissolution and precipitation of carbides and nitrites will occur, depending on the composition. If strength is provided by coarse strong phases with precipitates, the elongation is mostly controlled by strain localization phenomena, in zones of high strength gradients. Details on the microstructural evolutions will be presented later in this paper.
3.2. Extended Tensile Tests
Extended tensile tests were conducted only for the modern S700MC-1. The aim of these tests was to define how the properties change along the weld line and the results are established in
Figure 7. Specimens with reinforcements were used.
Figure 7 shows a clear decreasing trend in the yield strength as the distance from the start of the weld increases. The decrease is more pronounced at both ends of the plate and in the stationary zone only a small decrease can be observed. The difference in yield strength between the both ends is 31–49 MPa. This trend can be observed in all heat inputs and the magnitude of the differences is approximately the same regardless of the heat input. The main factor driving these results may be the different thermal field and boundary conditions along the weld. The 8 mm plate thickness plays an important role in the transport of the heat energy via thermal conduction, and providing relevant heat capacity. At the start of the weld, a large volume of the plates is cold and higher cooling rate exists. As the weld seam reaches near the end of the plate, there is a saturation of the heat capacity and thus cooling rates are reduced. These results emphasize that, even though t
8/5 cooling time is commonly used to predict and control the properties of the HAZ in welds, this assumption is only valid for the stationary period of the weld cycle. Thus, the t
8/5 cooling time is not a correct value for controlling the quality of the HAZ at the start and end zones of long welds, and for welds with short length.
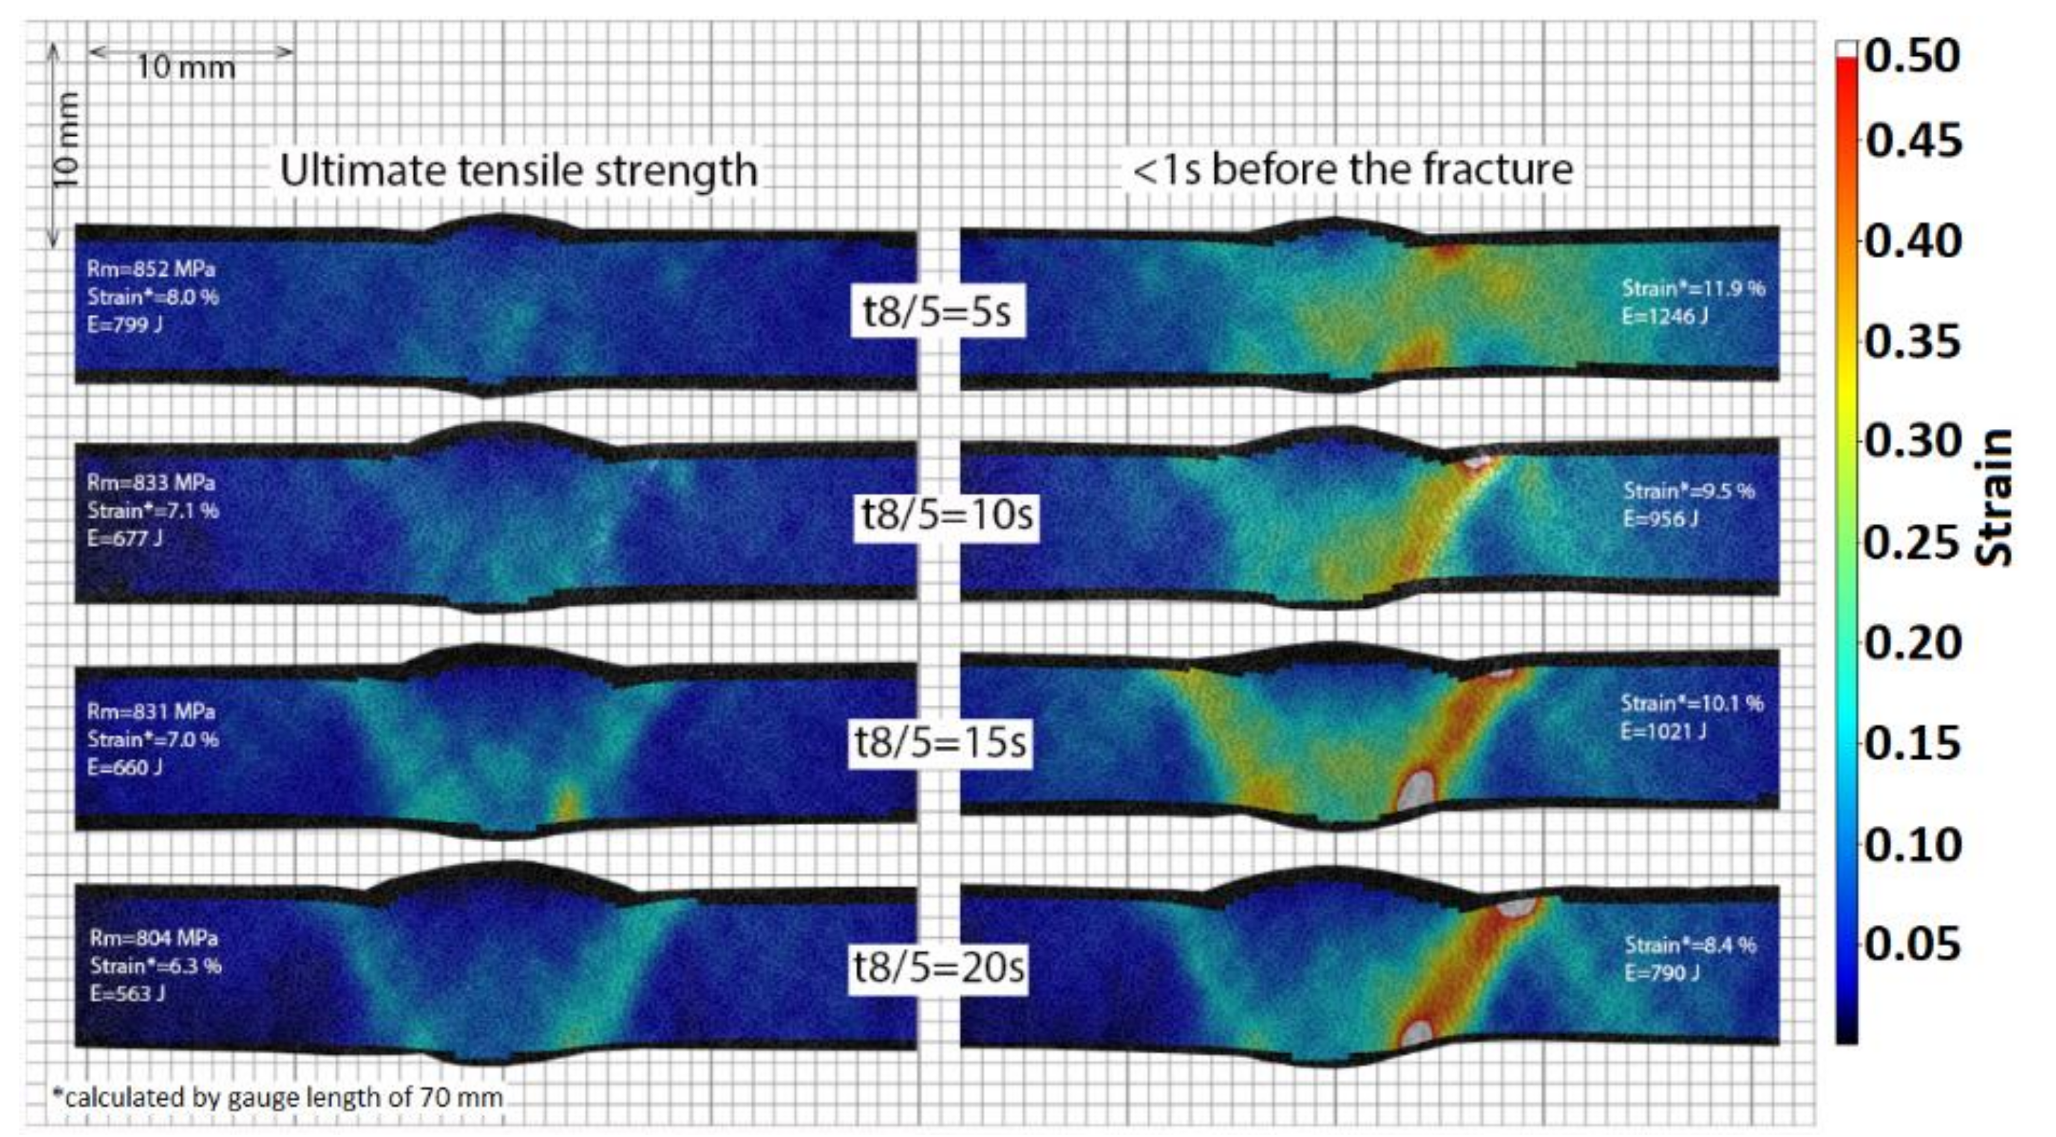
With DIC measurements, localization of the strain was analyzed. A summary of DIC results is presented in
Figure 8. The specimens used in DIC measurements were removed from the stationary zone and at the same location along the weld line with each other. The images have been taken at two points for each heat input, namely at the ultimate tensile stress and at the point just before the fracture. By increasing heat input, the localization in the softest domain of the HAZ is clear. In addition, the total absorbed energy decreases by increasing heat input because of the higher strain localization associated with the higher strength undermatch in the HAZ.
3.3. Bending Tests
During the bending, the middle part of the test specimen detached from the loading anvil as pointed by an arrow in
Figure 9. Practically, this means that, at the point of the detachment, 3-point bending changed to 4-point bending and because of round shaped loading anvil, the distance between the two loading points did not remain constant. The transformation from the 3-point bending to the 4-point bending can be seen as a clear change in the slope of the curves at the displacement of around 20 mm in
Figure 9. At the domain of 3-point bending, the load needed for the deformation decreases by increasing the heat input. According to the results, the differences between the heat inputs are more pronounced in bending tests, where the tensile stress is applied to the root side. This means that the strength at the root side is more sensitive to the increasing heat input. When considering the domain of 4-point bending, no clear correlation between the load and the heat input can be found, probably because the zones, where most of the deformation occurs, are outside from the HAZ at the domain of 4-point bending.
3.4. Impact Toughness Tests
The Charpy-V impact toughness results for the base materials are presented in
Figure 10.
Figure 11 represents the test results of the welded specimens of all three materials. The S700MC-2 has the highest impact toughness energies, when considering the impact toughness at the weld metal. Since the weld metal and welding procedure is the same for all of the welds, the compositional changes in weld metal chemistry by dilution have influence on weld metal impact toughness. Typical dilution in MIG/MAG welding process in butt weld is 20–40% depending on welding parameters and procedures [
29]. However, all measured values at the weld metal exceeds the 31 J limit. The limit of 31 J can be considered as a requirement for the impact toughness energies for 5 mm specimens, based on requirements for ultra-high strength steel grade NV x690 according to DNV offshore standard, where x is a capital letter corresponding to a specified impact toughness test temperature, e.g., NV F690 at −60 °C [
30]. The most significant differences between the materials occur by the notch locations of FL + 1 mm. Generally, at the FL + 1 mm, the material S700MC-2 has the highest absorbed energies, even though the energies are evidently sensitive to the heat input. At the FL + 1 mm, the impact toughness of the Q&T S690QL is comparable to the TMCP steels only with the lowest heat input and with higher heat inputs, the impact energies of S690QL drop severely compared to the other steels. It is notable that, at location FL + 3 mm, the impact toughness energies of TMCP steels are at a good level in every measurement, whereas the impact toughness of quenched and tempered S690QL is reduced when higher heat inputs are used. This is significant in results at −60 °C because, with higher heat inputs, the impact energy of S690QL does not fulfil the requirement of 31 J. With lower heat inputs, the energies of S690QL are higher than in the case of MC steels. At FL + 5 mm, the energies of TMCP steels are similar to those measured at FL + 3 mm. However, with high heat inputs, some reduction in impact toughness of S700MC-1 can be observed compared to the results at FL + 3 mm, whereas S690QL with higher heat inputs has a reduced impact toughness at the location of FL + 3 mm; with higher heat inputs at FL + 5 mm, the impact toughness is significantly improved.
3.5. Hardness Tests
The complete hardness profiles of all three materials are established in
Figure 12.
Based on comparison of these hardness profiles, the following observation can be made:
The domains of the lowest hardness values are located approximately similarly by all materials, when comparing the same heat input.
At the coarse grained zone, increased hardness can be observed in S700MC-2 (maximum hardness of about 290 HV5) and especially in quenched and tempered S690QL with high cooling rates (maximum hardness of about 360 HV5). Hardness peaks are clearly visible in the profiles of the face side and are located similarly in both steels. Hardness of these domains decrease by increasing heat input. On the root side, no excessive hardness peaks occur, due to tempering effect of the second pass [
31]. However, in S690QL, some hardening can be noted at the coarse-grained zone also at the root side.
S700MC-1 exhibits increased hardness domain next to the softest region, when moving further from the weld (tempered zone). The effect is visible on both face and root side and the maximum hardness is about 280–290 HV5. This behavior is not pronounced in S700MC-2 and in S690QL.
Generally, the root side is more critical in terms of softening because both of the passes affect the microstructure in a cumulative effect.
According to the hardness profiles, quenched and tempered S690QL is more prone to the softening than the two other materials. At the face side, the softening of the S690QL is more sensitive to the heat input compared to two other materials. At the root side, the minimum hardness value of the S690QL is affected considerably even when welding with the lowest heat input. Considering the effect of the second weld pass on the first, these hardness results are in line with the results presented by Lazić et al. [
32], where this decrease can be explained by carbon diffusion and transformation of martensite into a phase with lower strength and higher plasticity. On the other hand, the differences in minimum hardness values between the different materials dissipate by increasing heat input. According to the data hardness profiles, it can be concluded that the material S700MC-2 has the lowest tendency for extensive softening at the HAZ among these three materials.
3.6. Microstructural Analysis
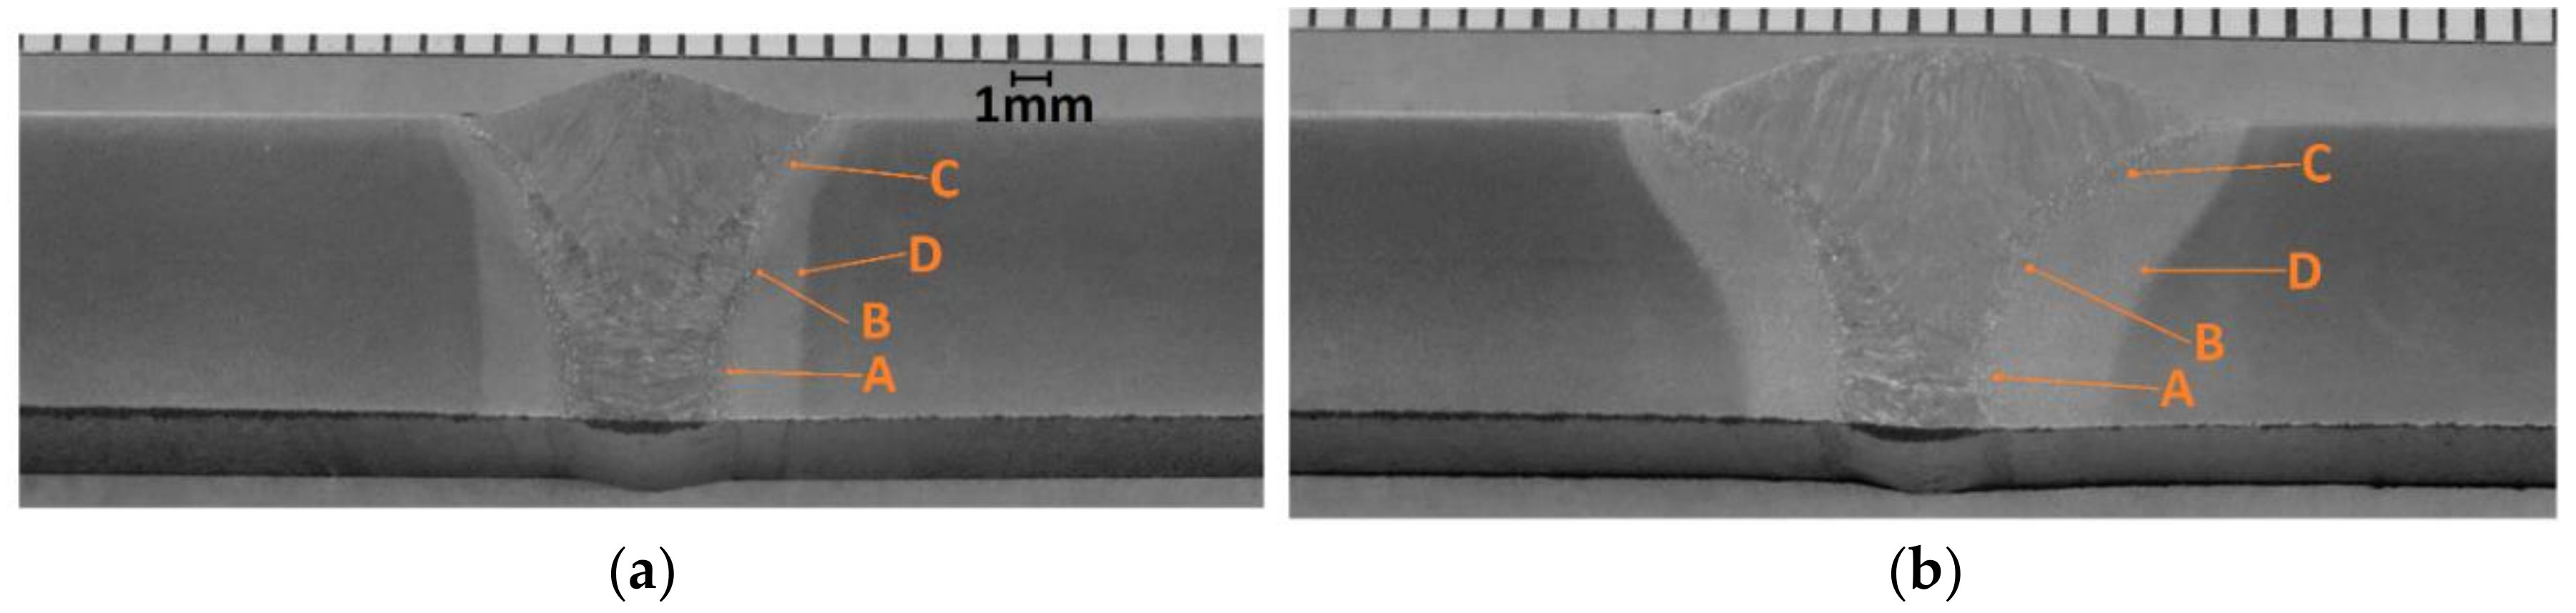
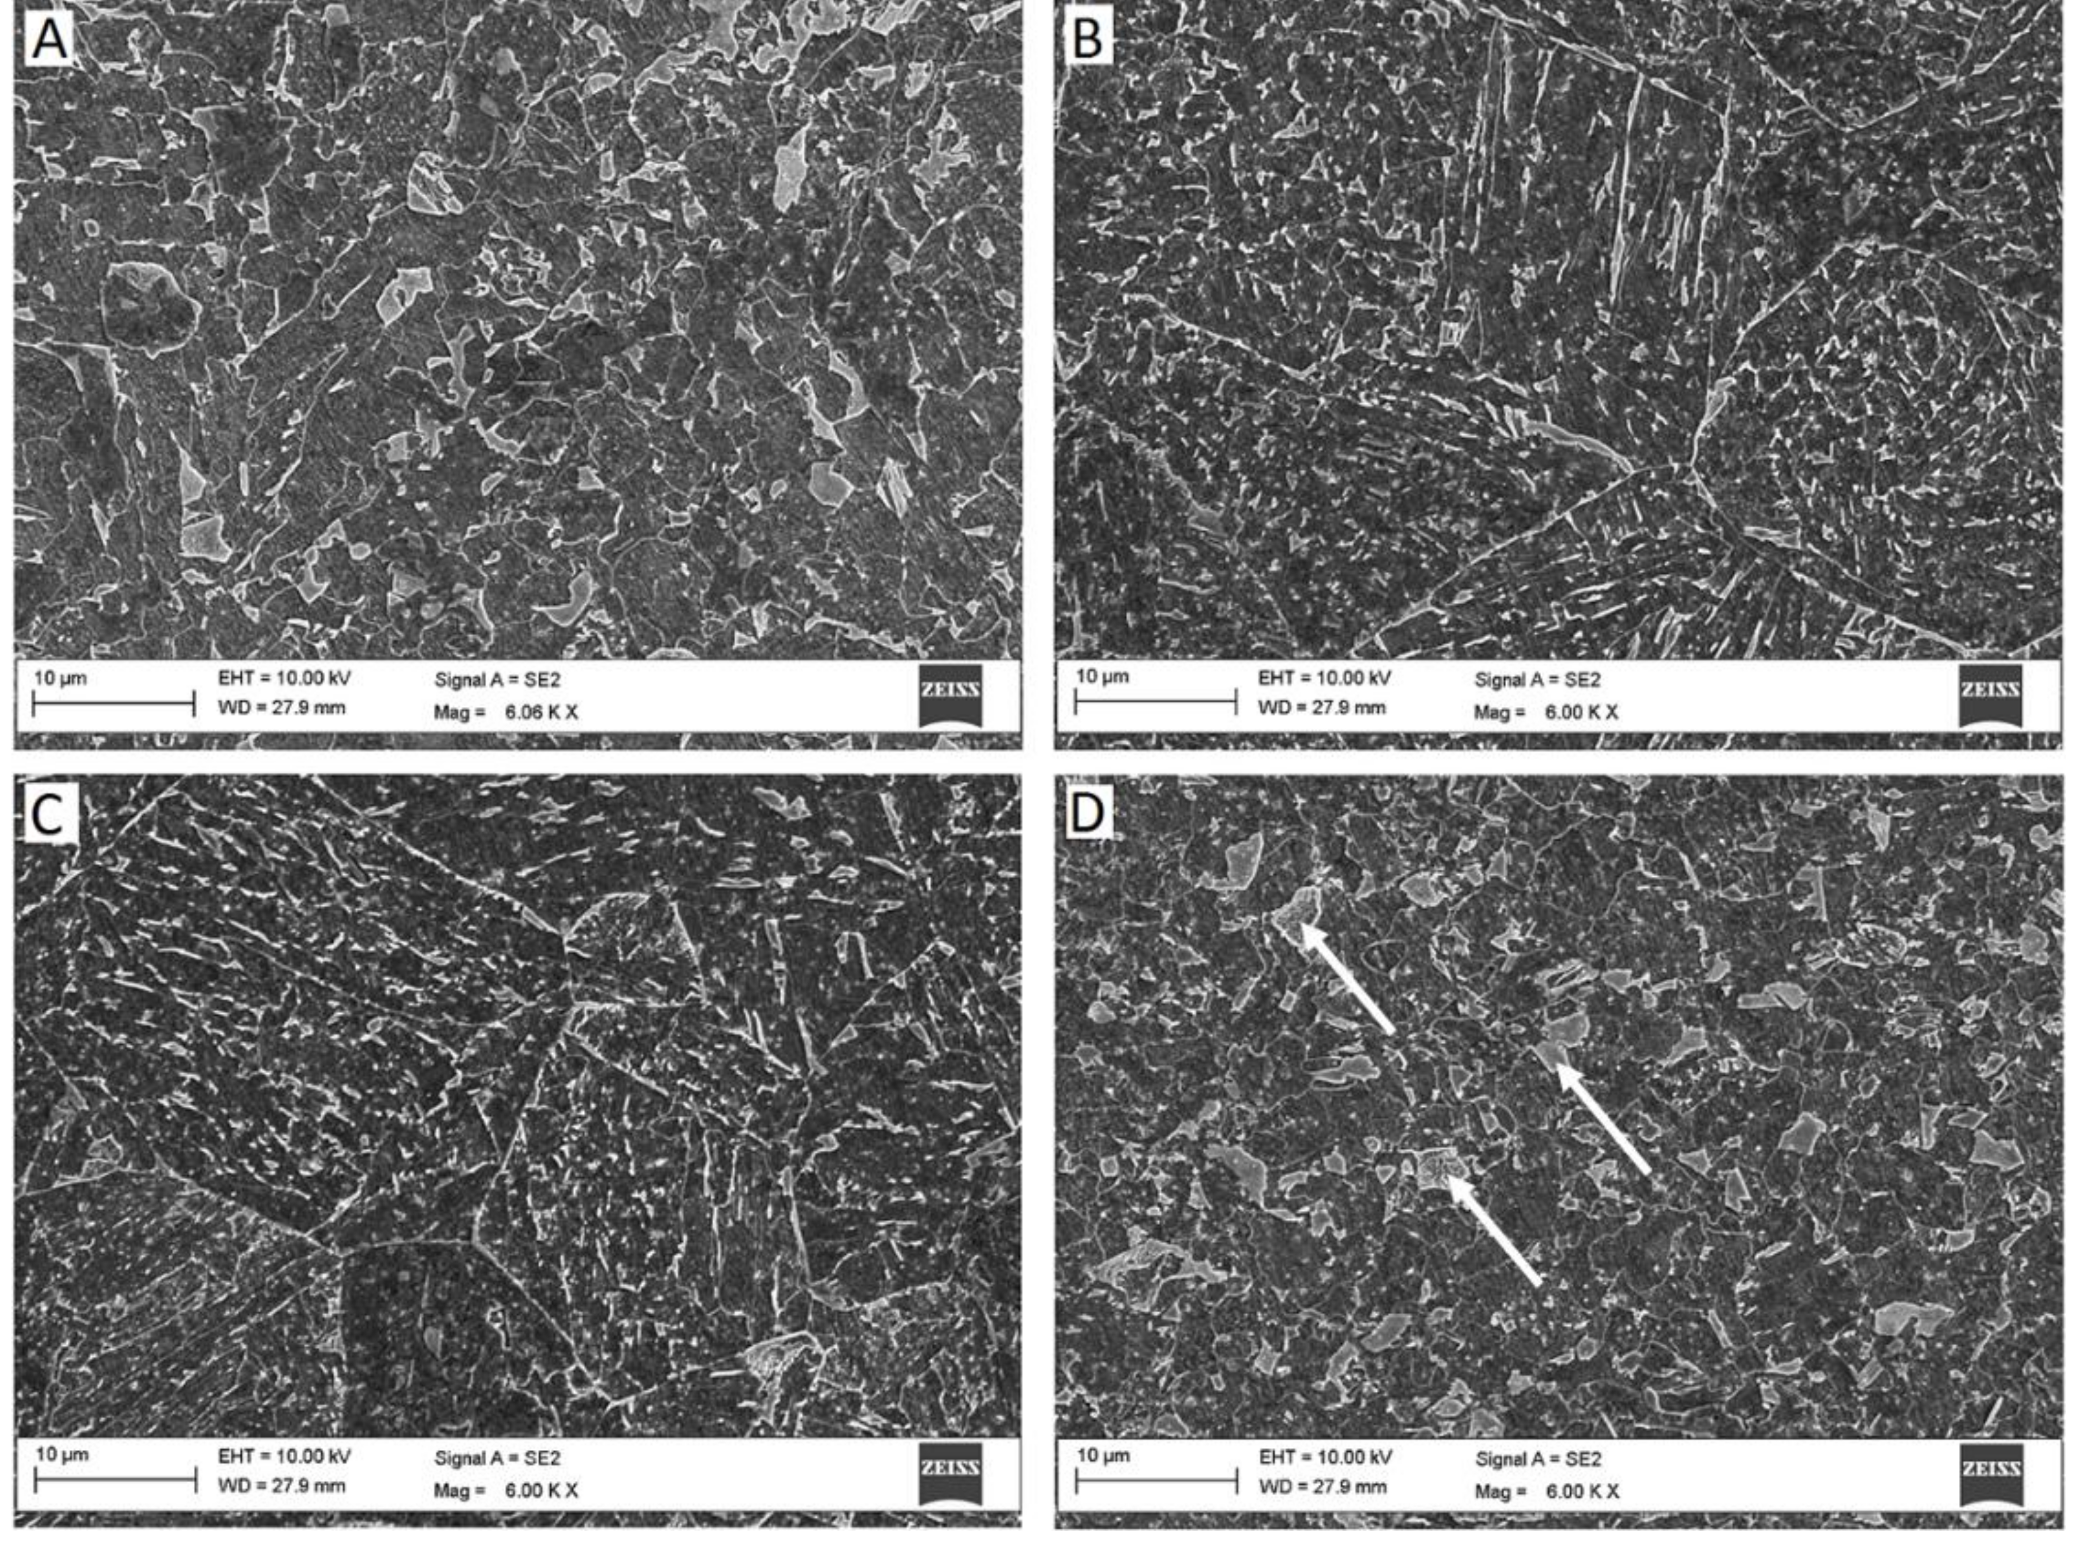
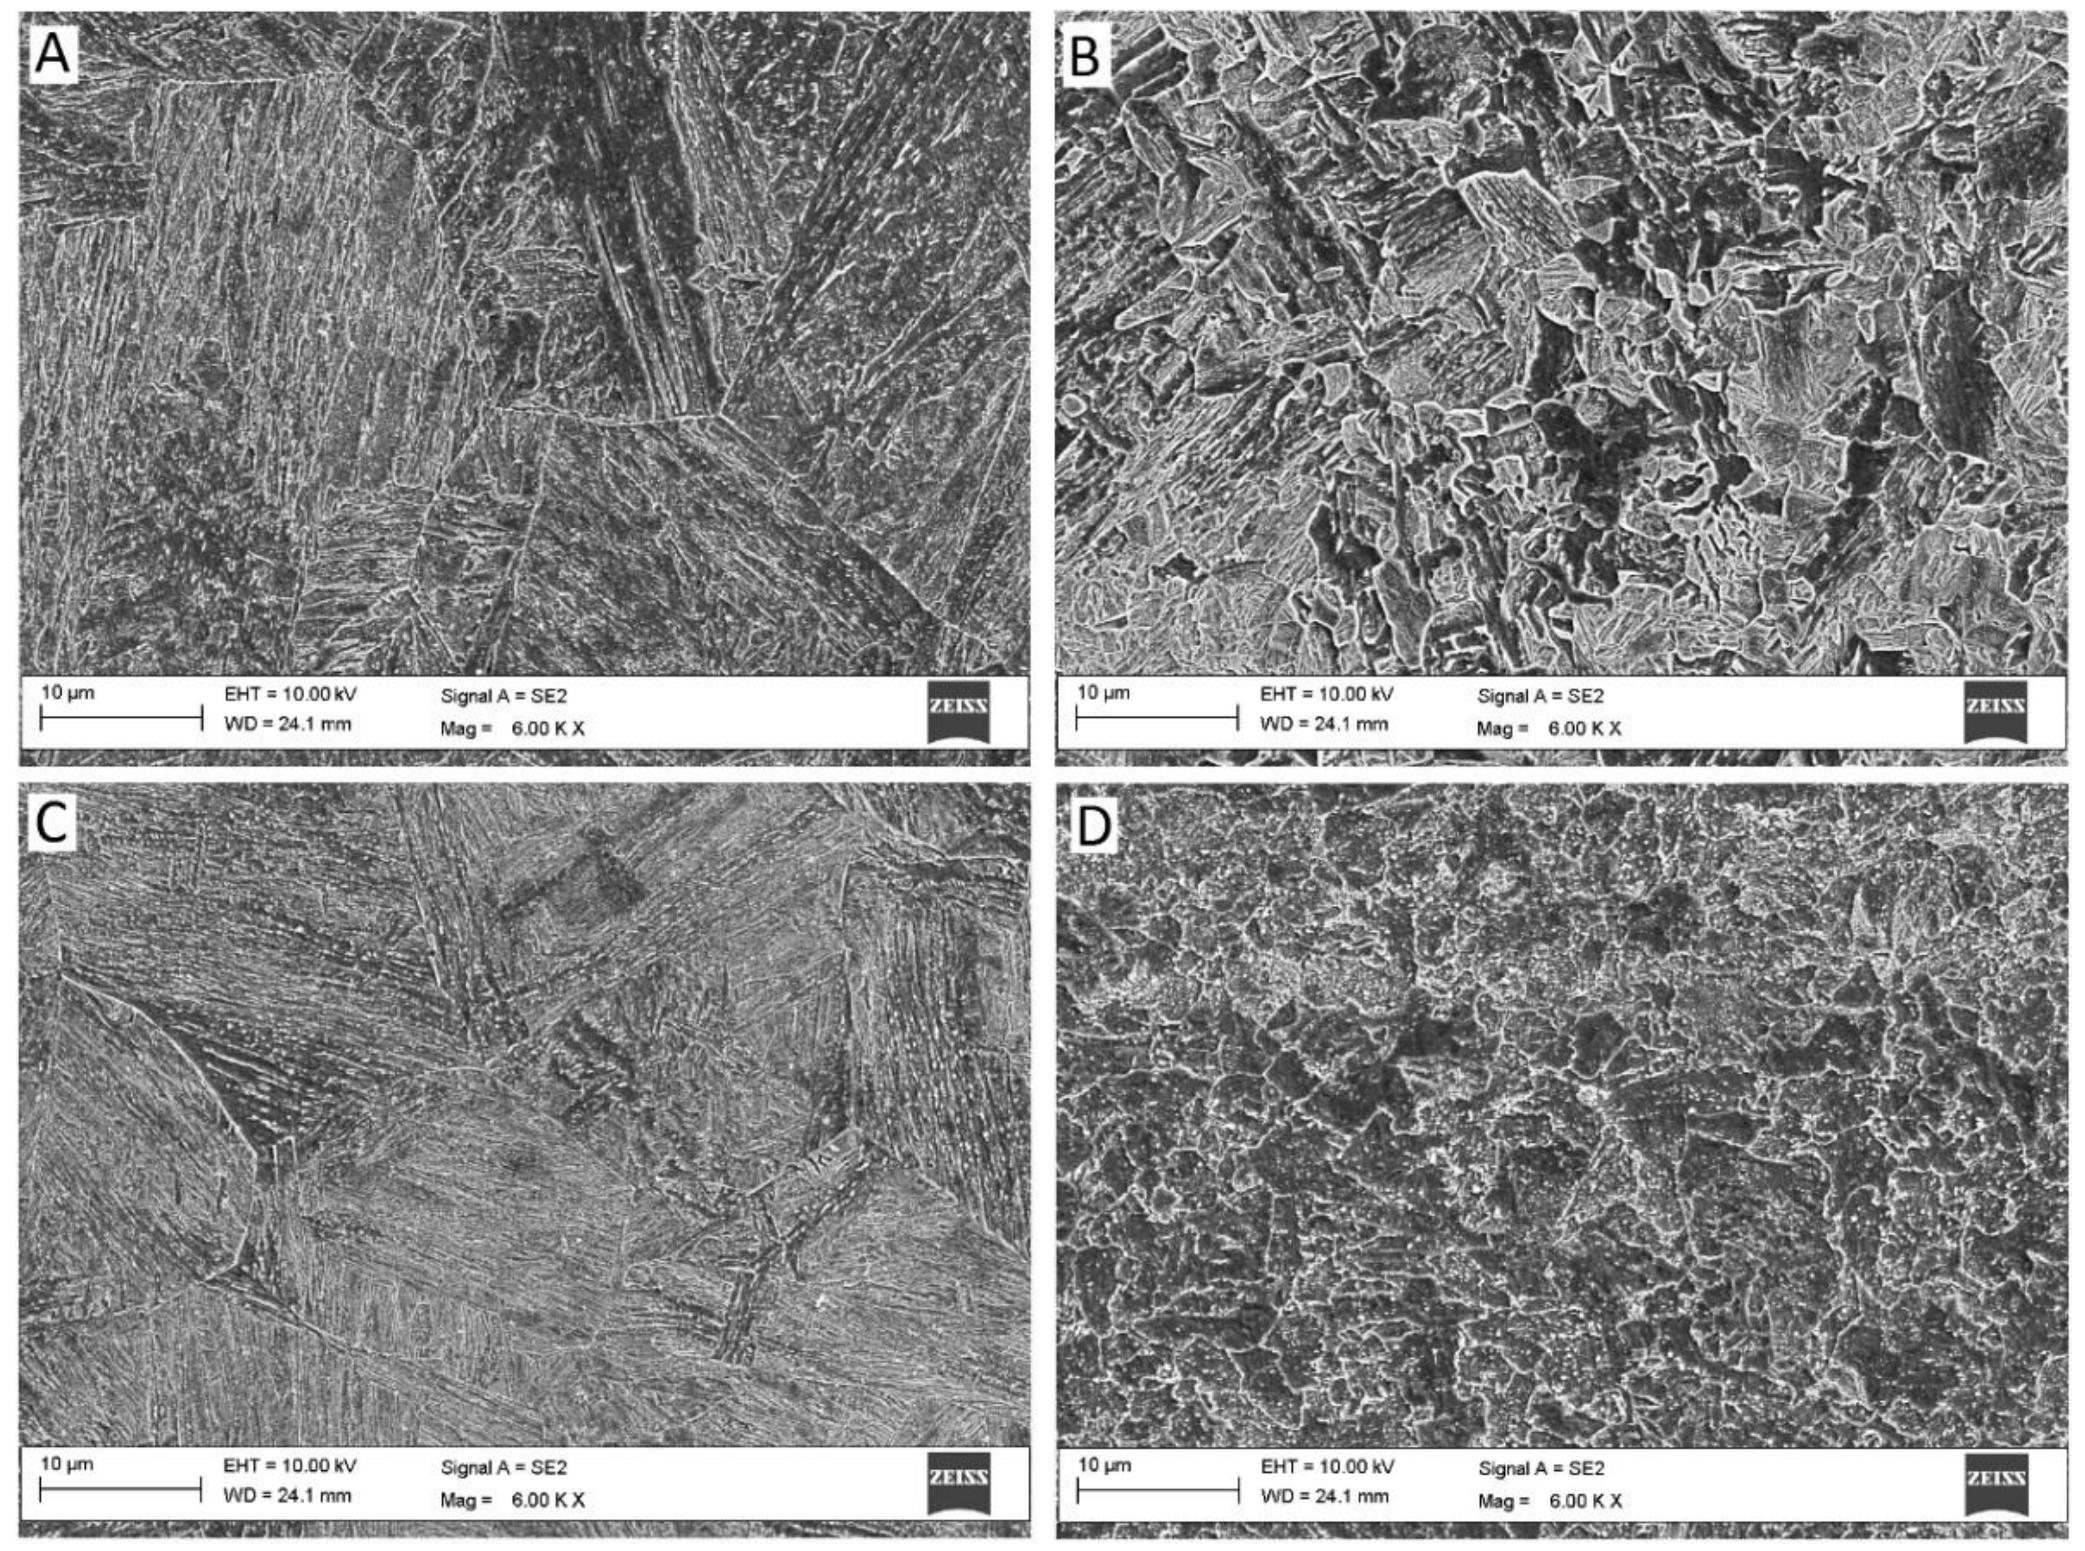
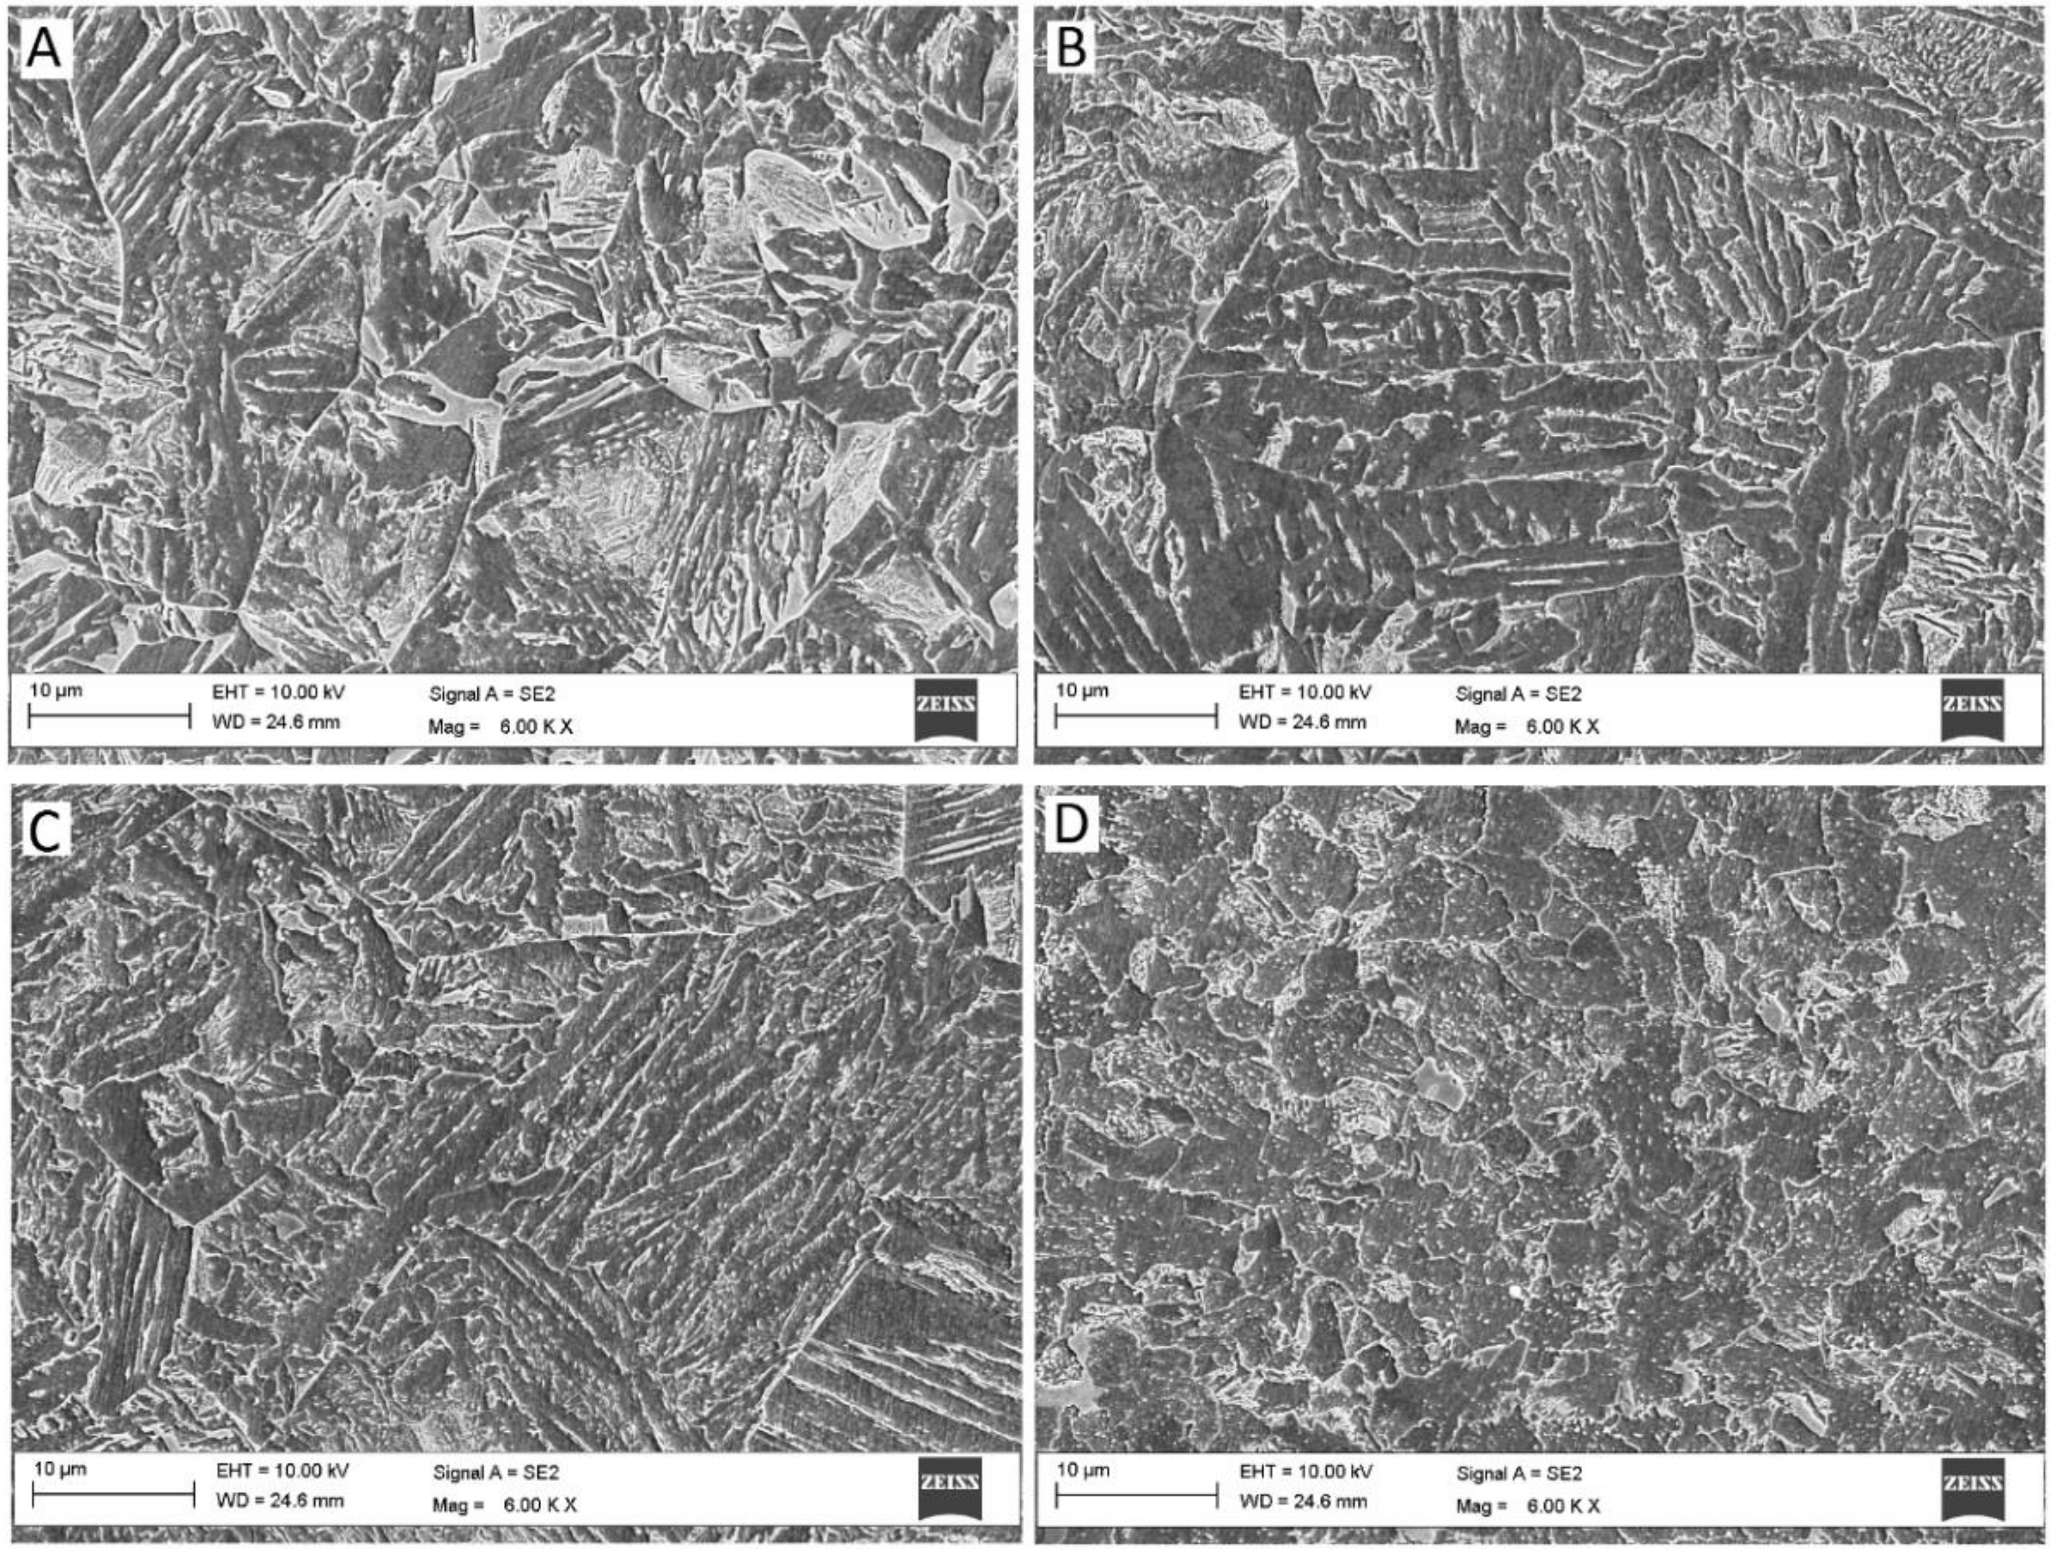
SEM-images were taken from the different zones at the HAZ as presented in
Figure 13. For each material, specimens with the lowest (t
8/5 = 5 s) and the highest (t
8/5 = 20 s) heat inputs were analyzed.
The location A, B and C represent the CGHAZ at the root side, at the center, and at the face side of the plate and they are located at about 0.5 mm from the fusion line. Face/root side location is defined at about 1.5 mm from the top/bottom surface. Location D represents a recrystallized zone at the center of the plate, which is located at about 1.5 mm from the fusion line in low heat input weld (t
8/5 = 5 s) and in high heat input weld (t
8/5 = 20 s) about 2.5 mm from the fusion line. The images of all three materials of these locations for the heat inputs t
8/5 = 5 s and t
8/5 = 20 s are presented in
Figure 14,
Figure 15,
Figure 16,
Figure 17,
Figure 18 and
Figure 19.
According to
Figure 14,
Figure 15,
Figure 16,
Figure 17,
Figure 18 and
Figure 19, all three materials present a somewhat different microstructural behaviour. A brief comparison and overview about the essential observations from each material based on the previous SEM images are presented below:
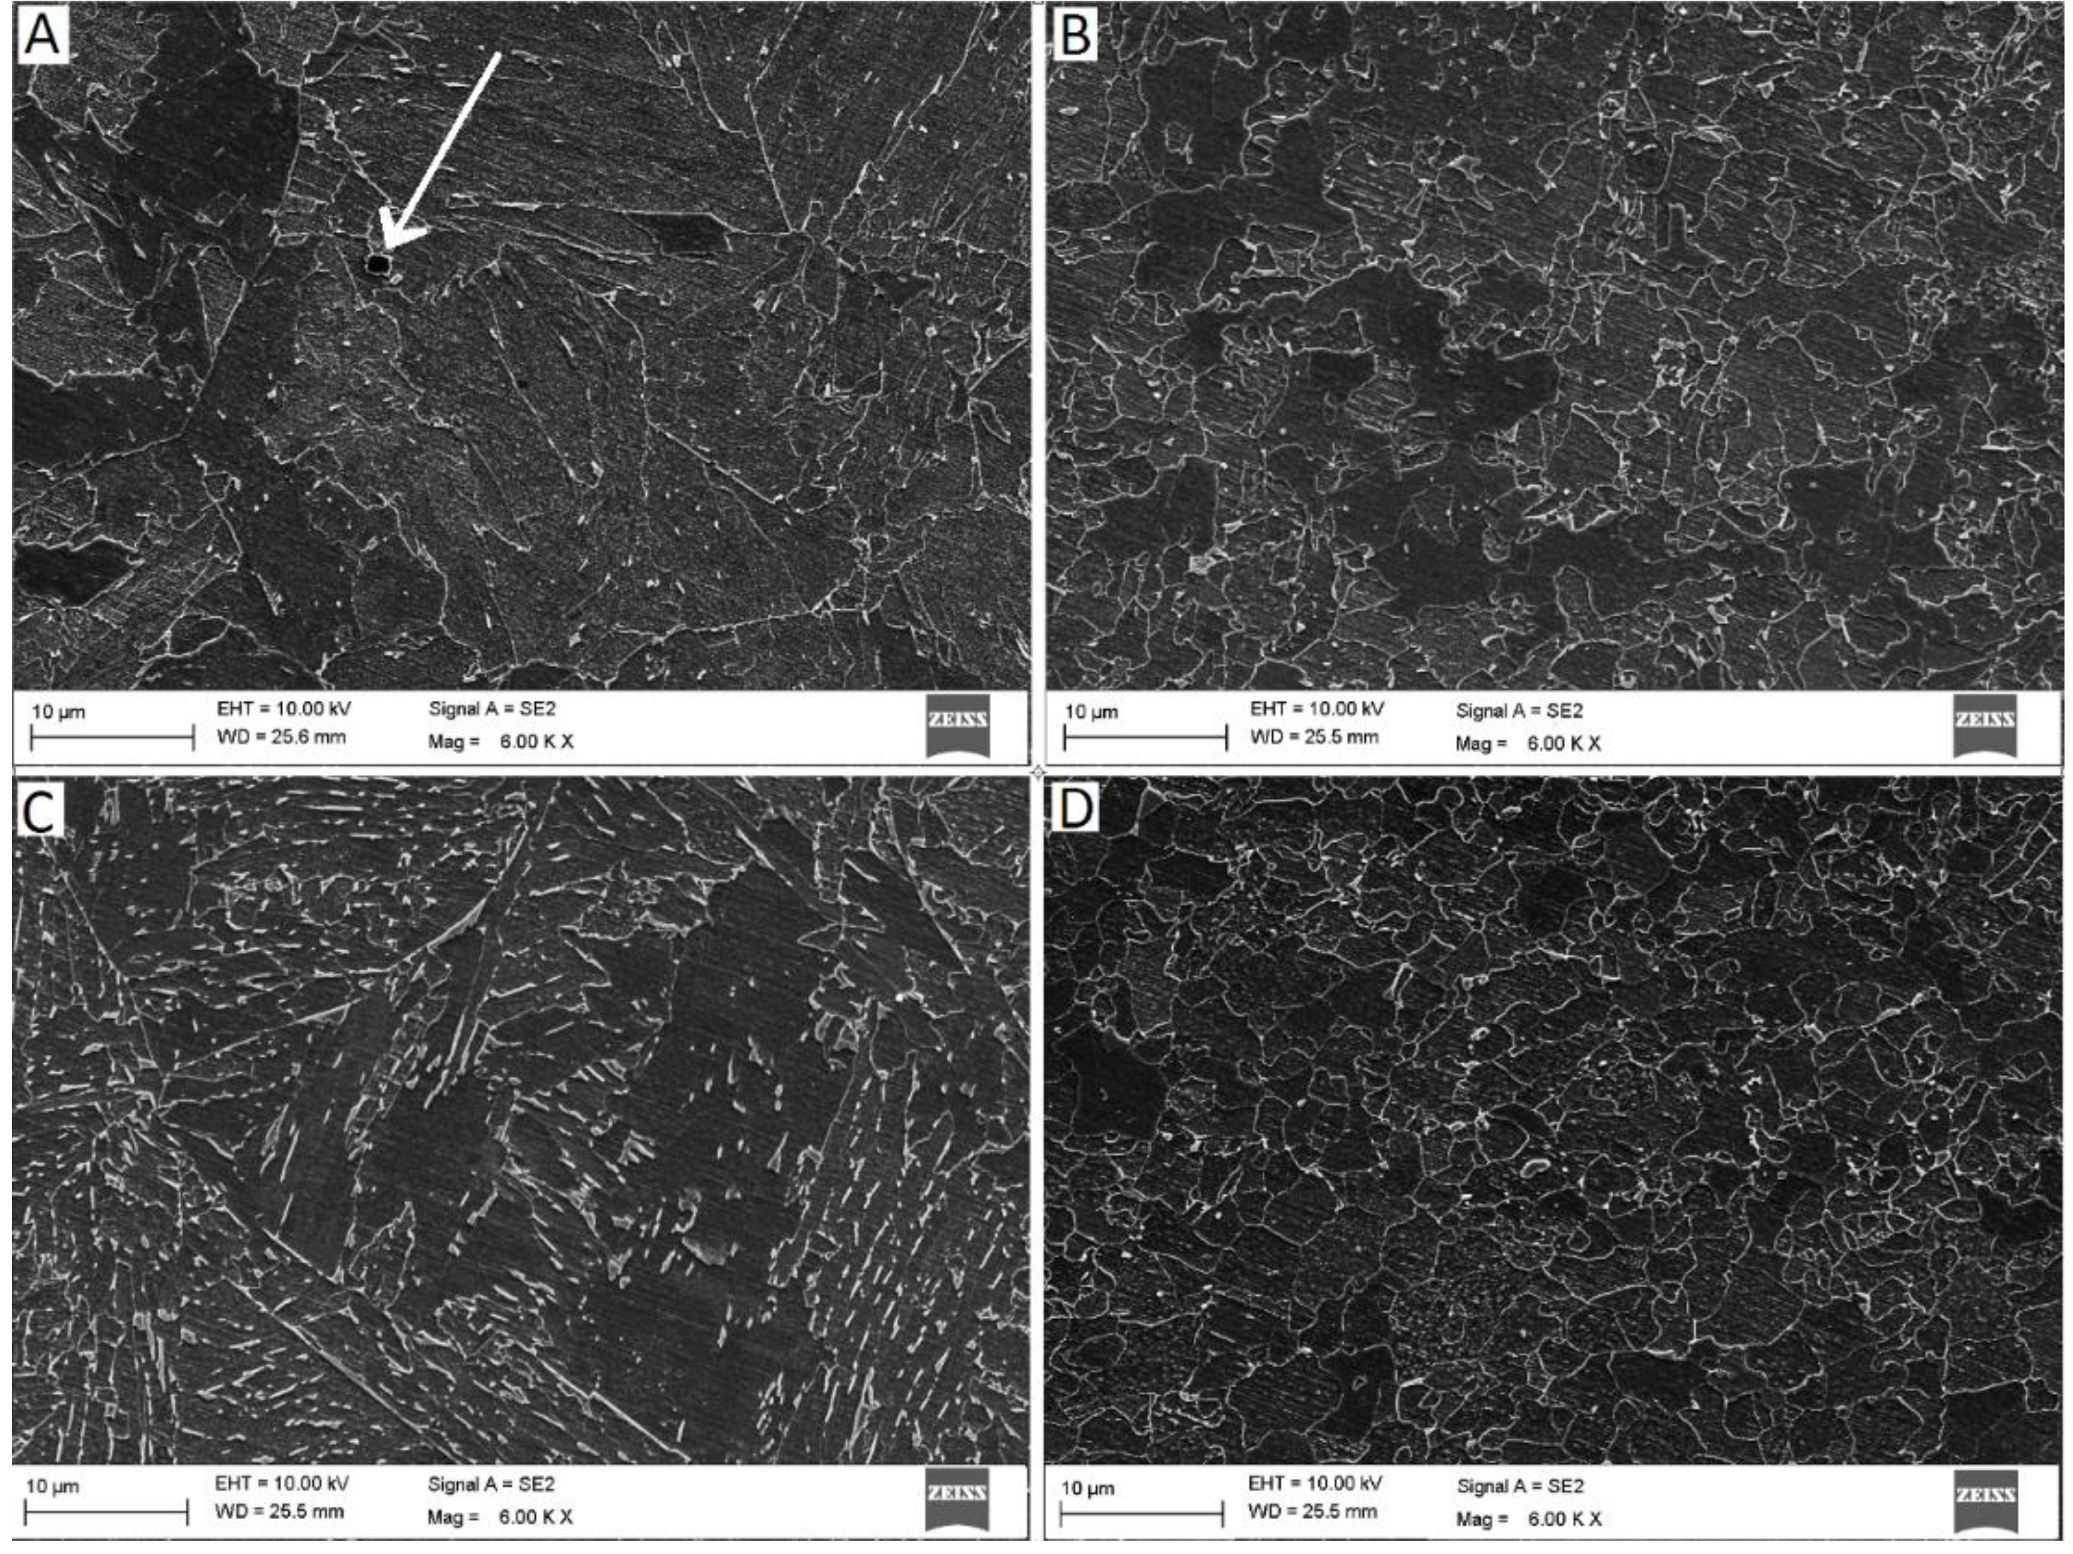
S700MC-1 has the lowest tendency to form martensitic/bainitic phases. Only in location C, with low heat input (high cooling rate), structure consisting of laths can be observed. In location A (and less but also in B), there is a reheated effect of the second weld pass over the first weld pass. In S700MC-1 with high heat input, significant grain coarsening can be observed, also at the location D, deteriorating the mechanical properties. Titanium nitrides in sizes of a few micrometers are commonly found in S700MC-1 because of the higher titanium content than in the other materials. Although not experimentally confirmed, in
Figure 15 (position A), an arrow was positioned to identify possible titanium nitride (TiN). The dissolution temperature of titanium nitrides is high and therefore they can be found also in the vicinity of the weld. Because of a sharp-edged form, mechanical properties like fatigue behavior or impact toughness can be impaired by TiN:s as reported by Spriestersbach et al. [
33].
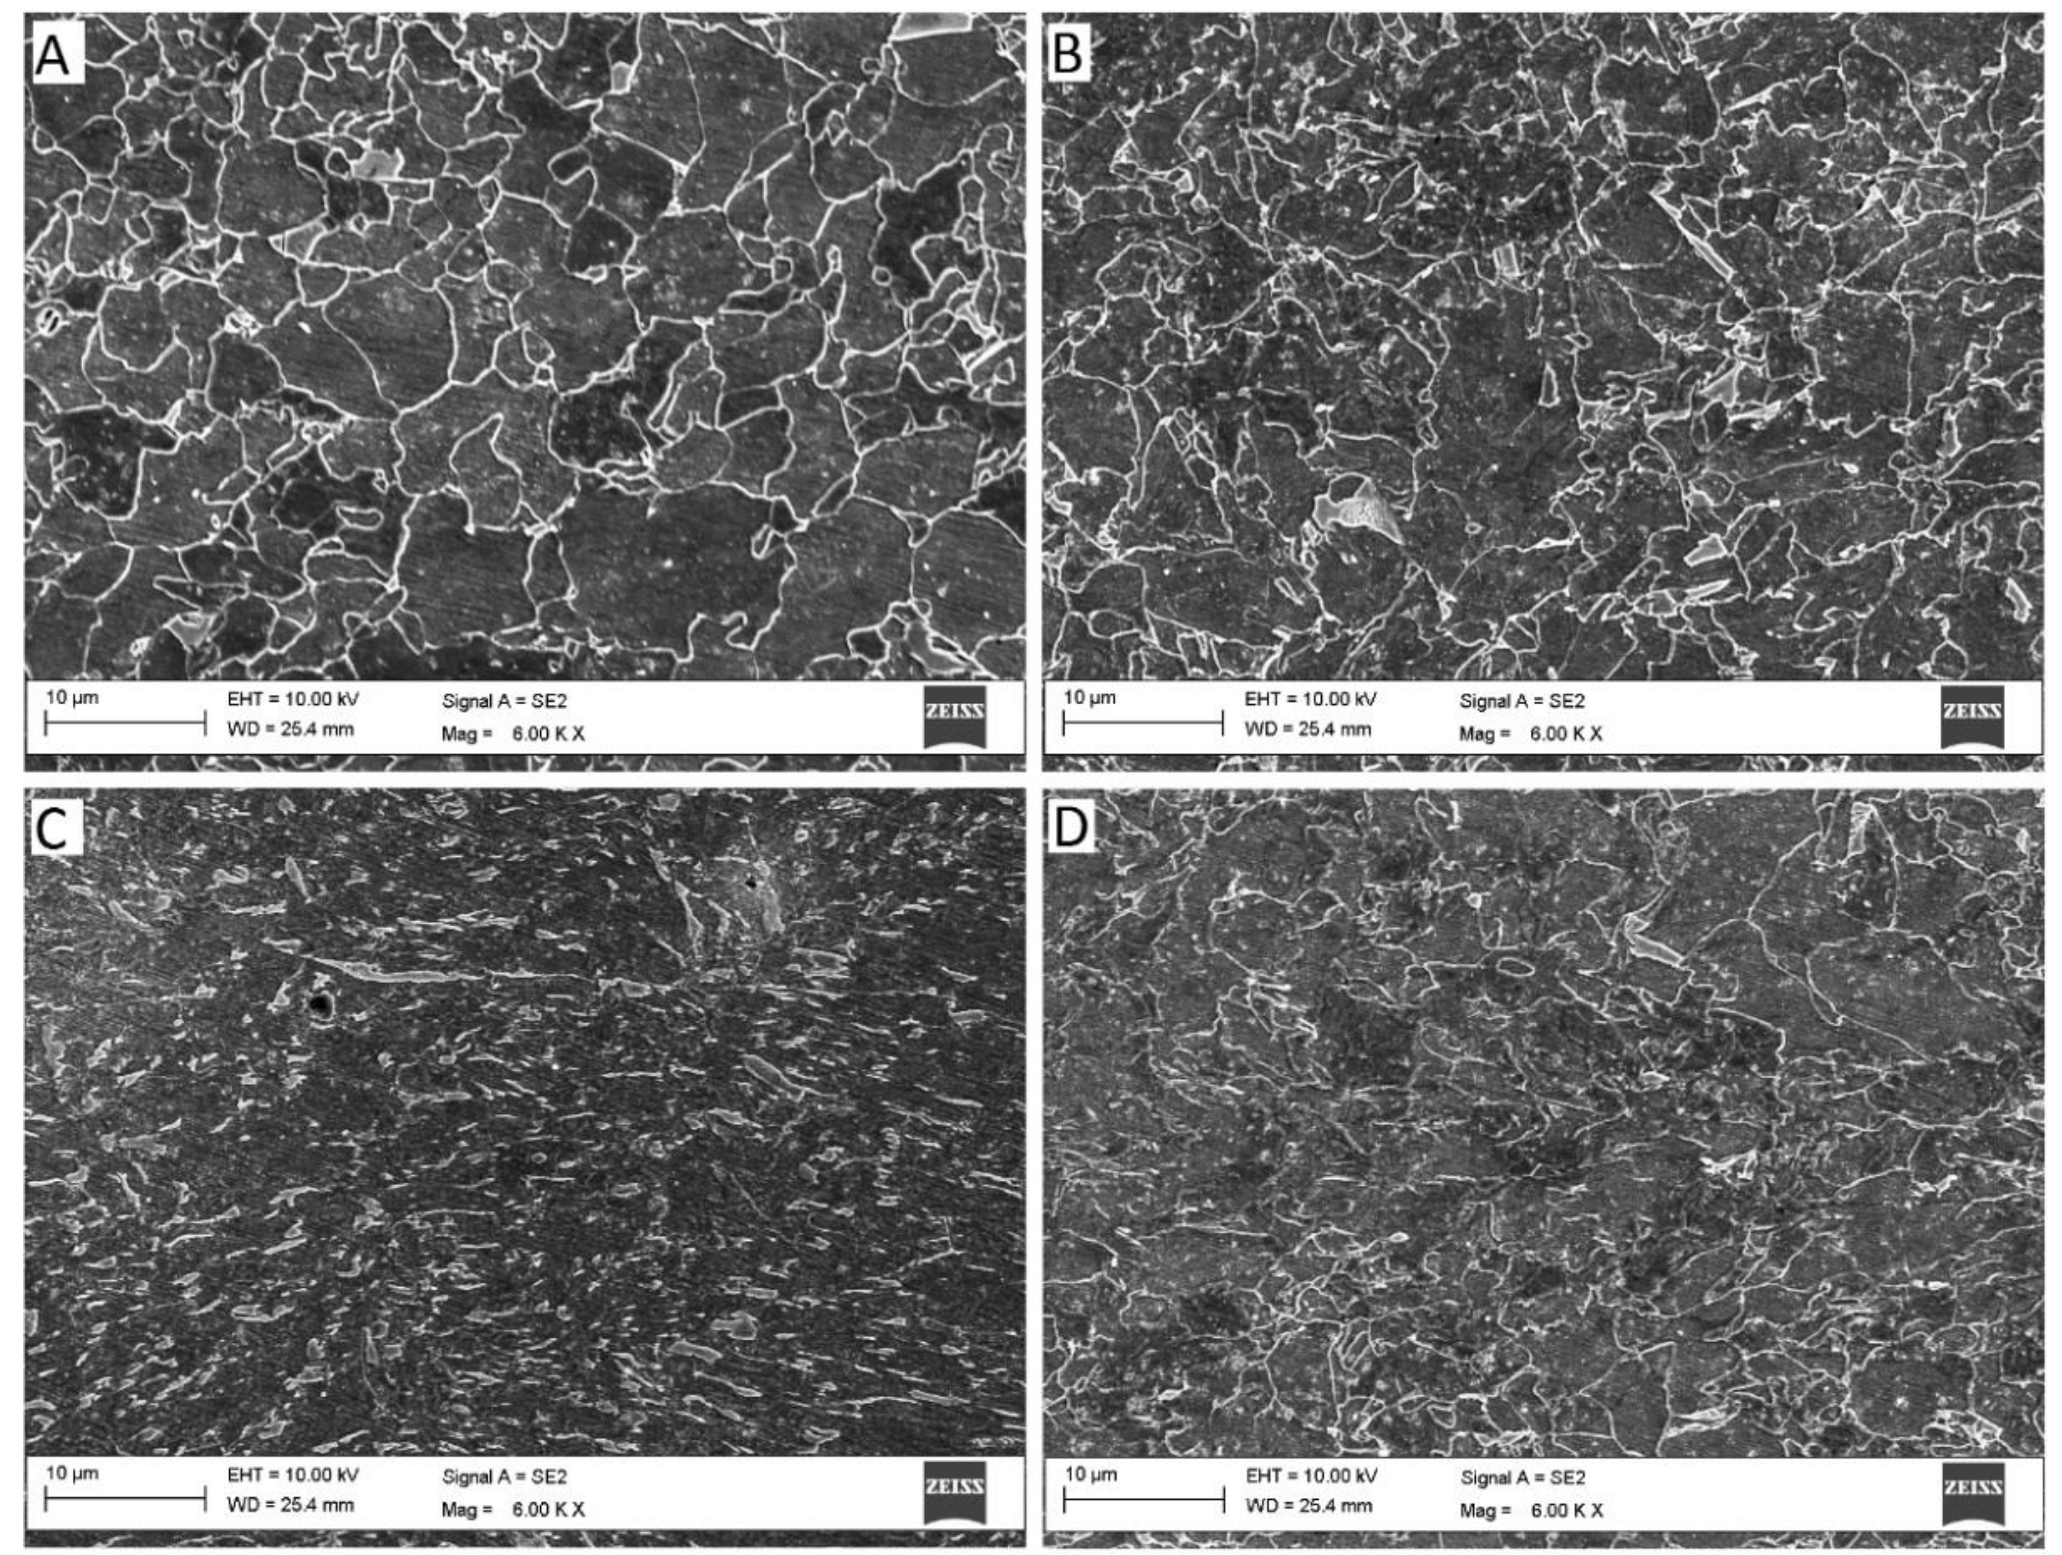
S700MC-2 have showed significantly higher tendency to form hard phases at the HAZ compared to S700MC-1. Also with high heat input at locations B and C, bainitic structure can be seen. In addition, the tendency to form islands of a second phase is considerably higher than in S700MC-1 as emphasized by the arrows in (position D) of
Figure 16 and
Figure 17. With higher heat input, the size of these islands increases clearly, which can be the reason for clear decrease in measured impact toughness values among increasing heat input, noticed at the FL + 1 mm.
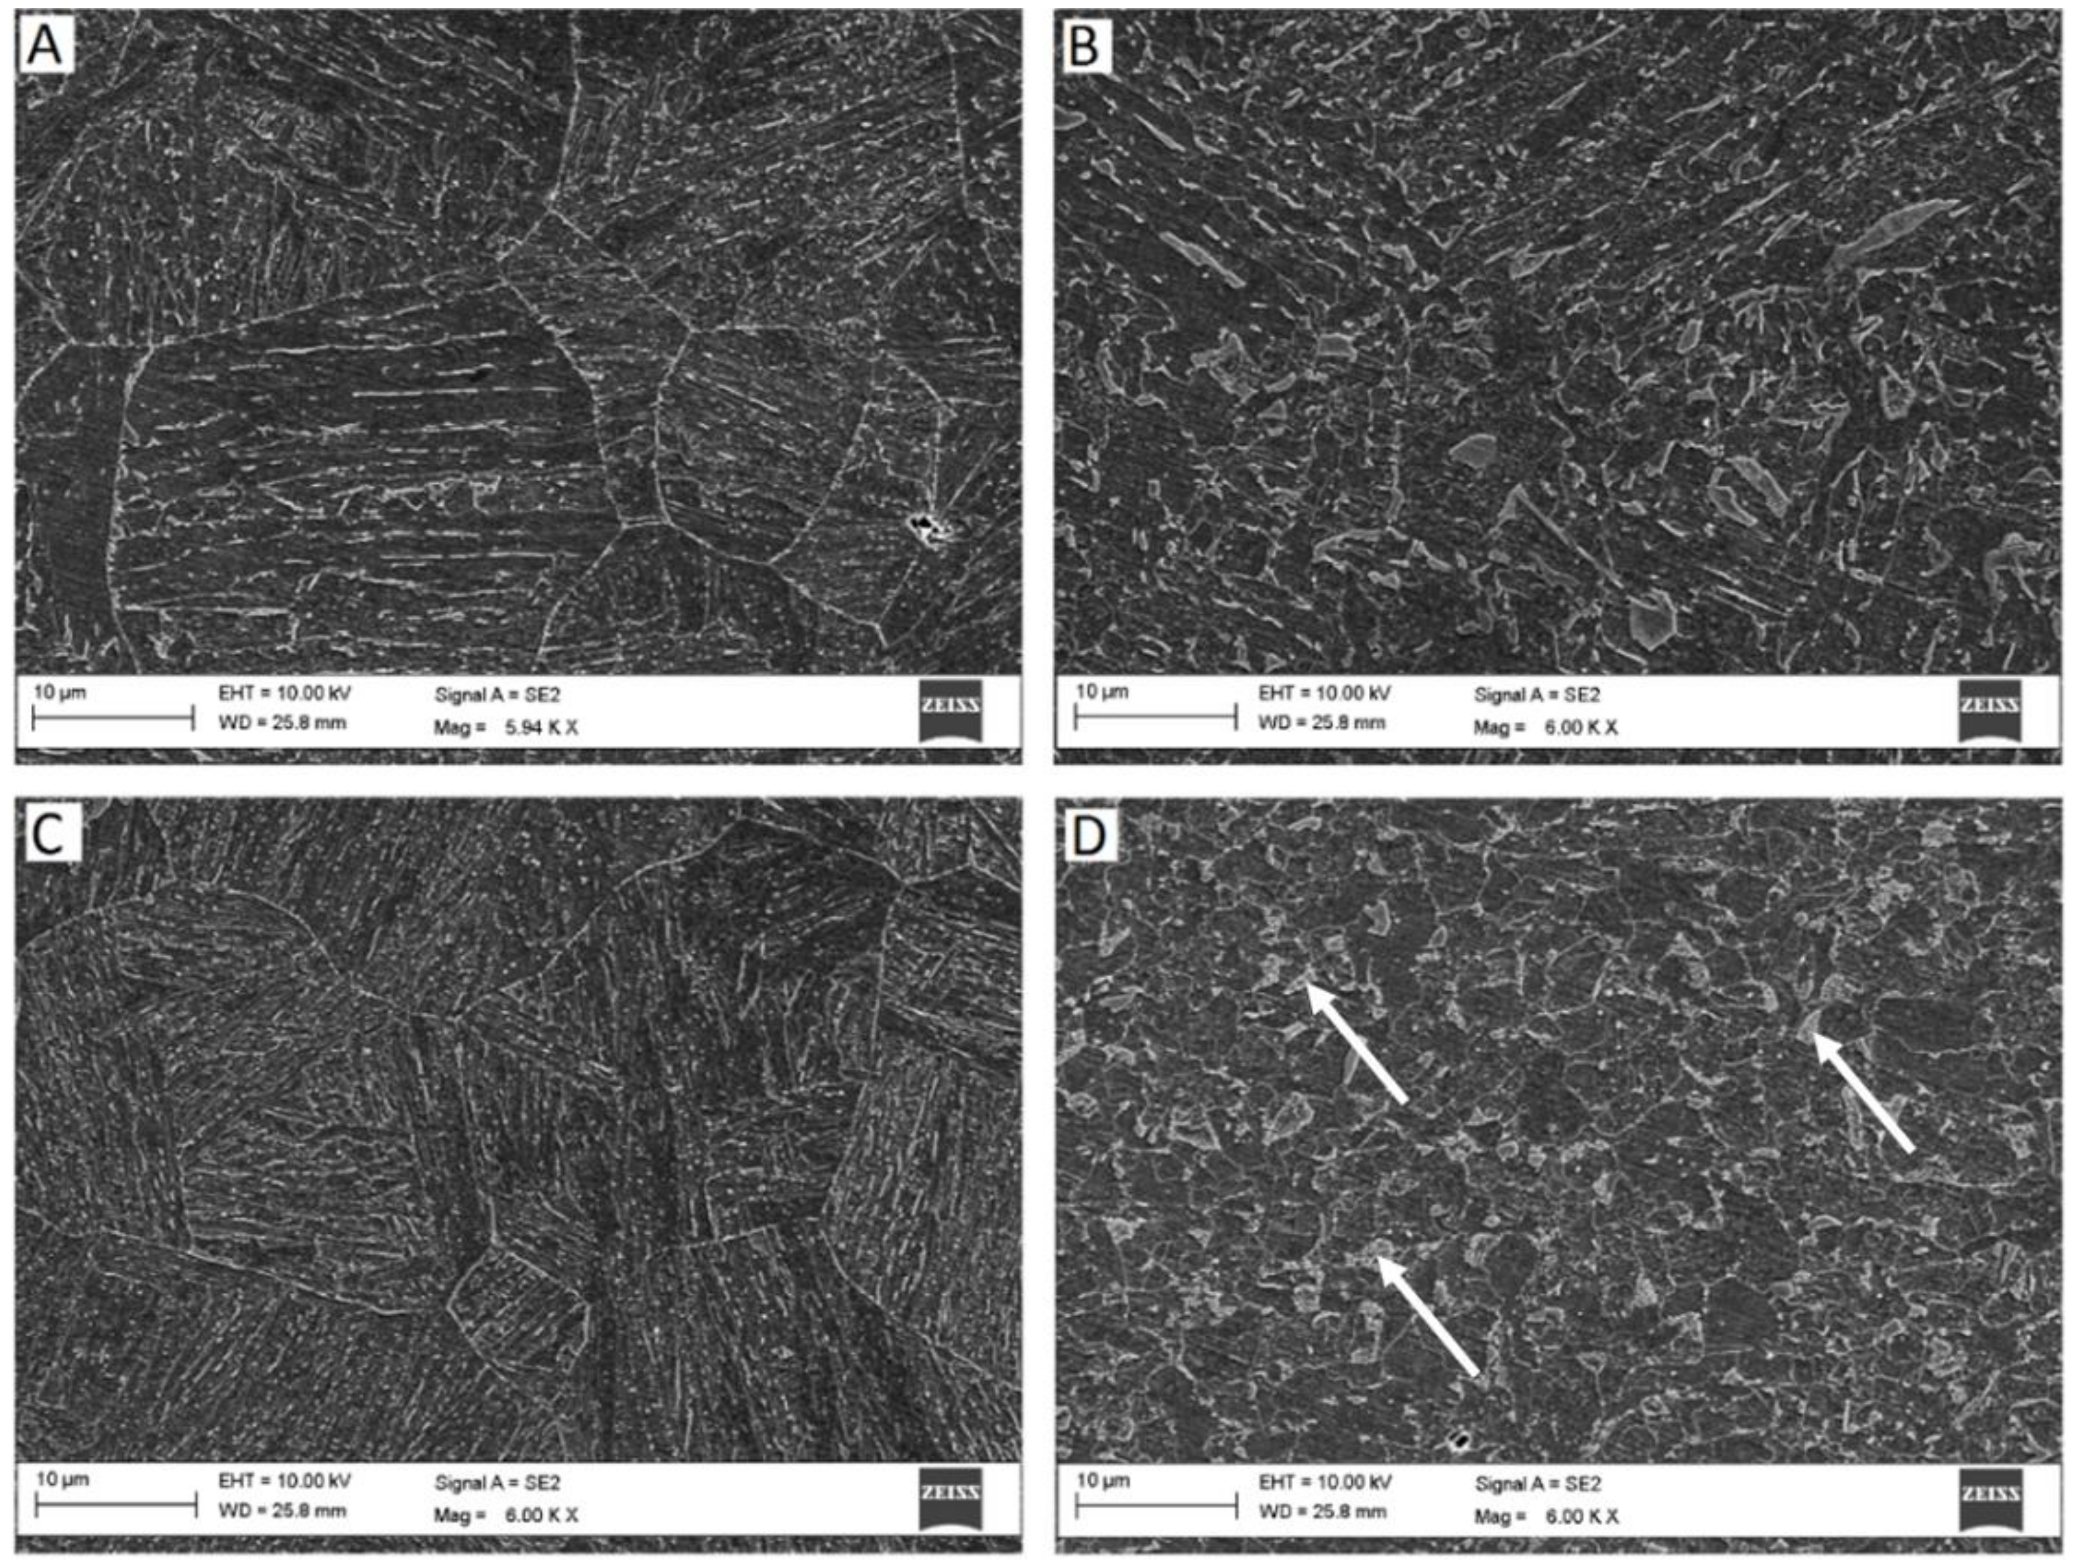
The influence of higher carbon content of S690QL can be seen in the images. The material tends to form martensite when cooling rate is high. In addition, coarse and brittle bainitic structures can be observed at the coarse grained zones of high heat input weld.
Figure 20 depicts with high magnification a detail of the location D where plenty of carbides can be seen. These carbides are organized in clusters and aligned in rows that eventually have been grain boundaries who moved away during the local thermal cycle. These carbide concentrations and coarse bainitic structures at the HAZ explain the low measured impact toughness values of the S690QL. This observation is in line with the study of Junru et al. [
34], which dealt with the influence of the carbides on tempered martensite embrittlement.
When considering the relation between microstructures and Charpy-V impact toughness tests results, it has to be noted that, in the welds considered in this work, the HAZ was narrower at the root side of the weld than at the face side. This complicates the analysis of the results of the impact toughness tests because the notch was placed perpendicularly to the plate and therefore there was always a microstructural gradient along the notch. The closer the notch was to the weld, the more pronounced the gradient is. For example, in the specimen having a notch at the location FL + 1 mm, one end of the notch can touch the weld metal and the other end is at the recrystallized zone.
As a final remark, complementing the main scope of this research, the application of Post weld heat treatment (PWHT) and optimized weld design and procedure specifications are solutions to minimize residual stresses and stress intensity factors for all these steels, but mostly the S690QL. For the thickness and weld conditions employed in this research, the TMCP steels may allow cost advantages against the Q&T steels. However, despite the S690QL higher HAZ embrittlement sensitivity, when compared with the TMCP steels, the S690QL is still a steel of great interest for mechanical construction.


