Article

Correlation of Microstructure and Mechanical Properties of Metal Big Area Additive Manufacturing

Oak Ridge National Laboratory, Oak Ridge, TN 37831, USA
*
Author to whom correspondence should be addressed.
Appl. Sci. 2019, 9(4), 787; https://doi.org/10.3390/app9040787
Submission received: 11 January 2019 / Revised: 14 February 2019 / Accepted: 19 February 2019 / Published: 23 February 2019
(This article belongs to the Special Issue Welding of Steels)

Abstract

:
Metal Big Area Additive Manufacturing (MBAAM) is a novel wire-arc additive manufacturing method that uses a correction-based approach developed at the Oak Ridge National Laboratory (ORNL). This approach is an integrated software method that minimizes the dynamic nature of welding and compensates for build height. The MBAAM process is used to fabricate simple geometry thin walled specimens, using a C-Mn steel weld wire, to investigate the scatter in mechanical properties and correlate them to the underlying microstructure. The uni-axial tensile tests show isotropic tensile and yield properties with respect to building directions, although some scatter in elongation is observed. Large scatter is observed in the Charpy Impact tests. The microstructure characterization reveals mostly homogenous ferrite grains with some pearlite, except for some changes in morphology and grain size at the interface between the build and the base plate. The measured properties and microstructure are compared with the toughness and strength values reported in the literature, and a hypothesis is developed to rationalize the differences. Overall, the MBAAM process creates stable, isotropic, and weld-like mechanical properties in the deposit, while achieving a precise geometry obtained through a real-time feedback sensing, closed loop control system.

1. Introduction

Additive manufacturing (AM) is changing the way industry produces components beyond simple geometrical models and prototypes [1,2]. Each AM technique has rapidly been developed for a variety of industrial applications and to address challenges brought about by subtractive (e.g., machining) processes. For example, metal powder bed fusion has been developed for rapid part manufacturing with specific intricacies, such as internal cooling channels [3,4,5], and specialized alloys, such as high temperature resistant Ni based super alloys [6,7,8]. Directed energy deposition is used for larger parts or repair, due to its flexibility and scalability in parts with large section thickness and moderate geometrical complexity [9,10,11,12].
More recently, wire-arc AM has shown promise for large parts, such as tooling dies, and vehicle and aerospace components [2,13,14]. Metals such as Ti-6Al-4V and Aluminum have recently been investigated for aerospace applications, but steels have only recently become of interest [15]. Unlike other metal AM processes, the wire arc process offers readily available feedstock, high throughput, and uses commercial off the shelf hardware components, resulting in favorable economics [16].
A novel wire-arc AM system, Metal Big Area Additive Manufacturing (MBAAM), was developed at the Oak Ridge National Laboratory. This system uses a correction-based approach, where integrated software, in conjunction with a traditional wire feed welding robot, is used to minimize the dynamic nature of welding and compensate for build height. The MBAAM process is comparable with traditional robotic gas tungsten arc welding or gas metal arc welding (GTAW and GMAW, respectively). However, there are some differences between MBAAM and welding. One of the major differences is related to the use of the Oak Ridge National Laboratory (ORNL) developed closed loop control system, to ensure geometrical conformity (e.g., layer height).
In the wire-arc AM process, similar to GMAW, the liquid pool and deposition layer heights depend on many factors like wire composition, wire diameter, wire feed rate, robot motion speed, ambient temperature, shielding gas, shielding nozzle, nozzle condition, gas flow, power, type of deposition/welding mode, part geometry, slicing path, slicing strategy, inter-pass temperature, and many others. For a stable welding process with well controlled joint geometries (e.g., T and butt joints), where the deposition height is constant throughout the build, a smart-closed loop control system may not be necessary. However, due to the dynamic nature of welding with wide ranging geometries, a closed loop system maintains a constant height of the deposit layer and preserves the geometric characteristic of the bead. Frequent starting and stopping, typified in industrial welds, leads to a large scatter in properties [17]. We also hypothesize that the “print by wire” control in this work substantially reduces the frequency of interruption, resulting in predictable, consistent, thermal conditions experienced by large areas of the build.
In all AM techniques, studies have been conducted on correlating the microstructure to the mechanical properties. Although each AM technique has been rapidly developing over the past decade, material challenges are still present. The overall material challenges in the MBAAM process are expected to be like those reported in welding. These challenges range from local defects, such as gas porosities, lack of fusion, scatter in macro- and microstructure, and consequently, scatter in static and dynamic mechanical properties. The layer-wise deposition leads to continuous and varying numbers of thermal cycles, and, consequently, leads to microstructural heterogeneity and scatter in mechanical properties. These repeated thermal cycles with different heating rates, peak temperatures, and cooling rates causes a composite type microstructure [18,19,20]. The composite microstructure in steels is the result of liquid to solid and solid to liquid transformations, as well as solid-state phase transformations on heating (alpha ferrite to austenite and austenite to delta-ferrite) and cooling (austenite to grain boundary ferrite, Widmanstätten ferrite, acicular ferrite, bainite, and martensite). Solidification involves the epitaxial growth of cellular/columnar delta ferrite grains from the fusion boundary, due to the high thermal gradients involved in welding. The delta ferrite grains have their <001> crystallographic directions oriented to the direction of maximum heat flow. Upon cooling, the delta ferrite (body centered cubic (BCC)) transforms to austenite (face centered cubic (FCC)). Austenite then decomposes to several allotropes of BCC ferrite depending on the local cooling rates. The transformation temperatures for the major constituents during the cooling of C-Mn steels are outlined by Choi and Hill [21] and discussed in welding textbooks.
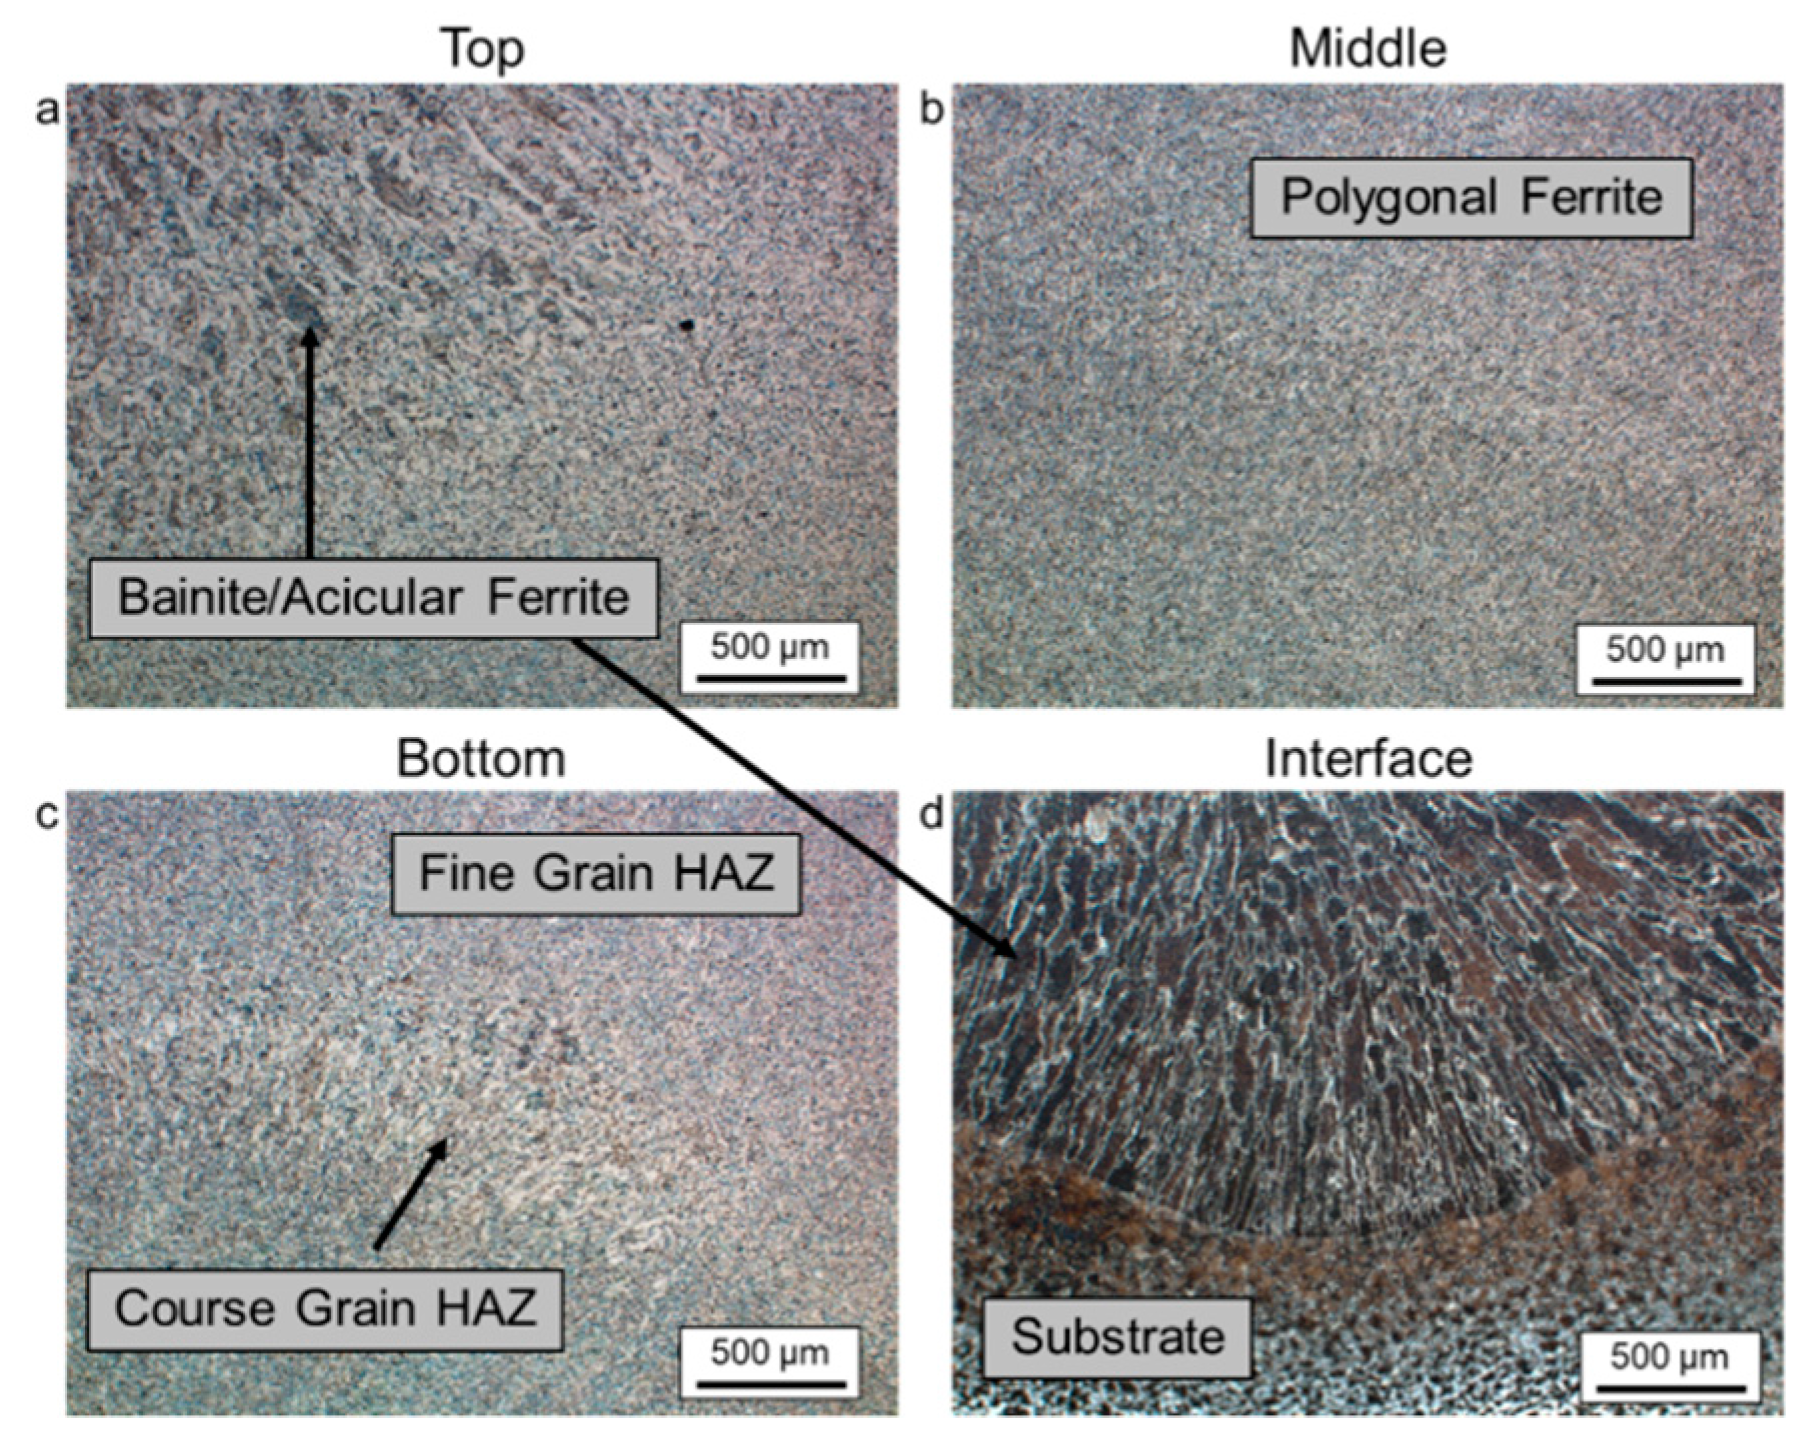
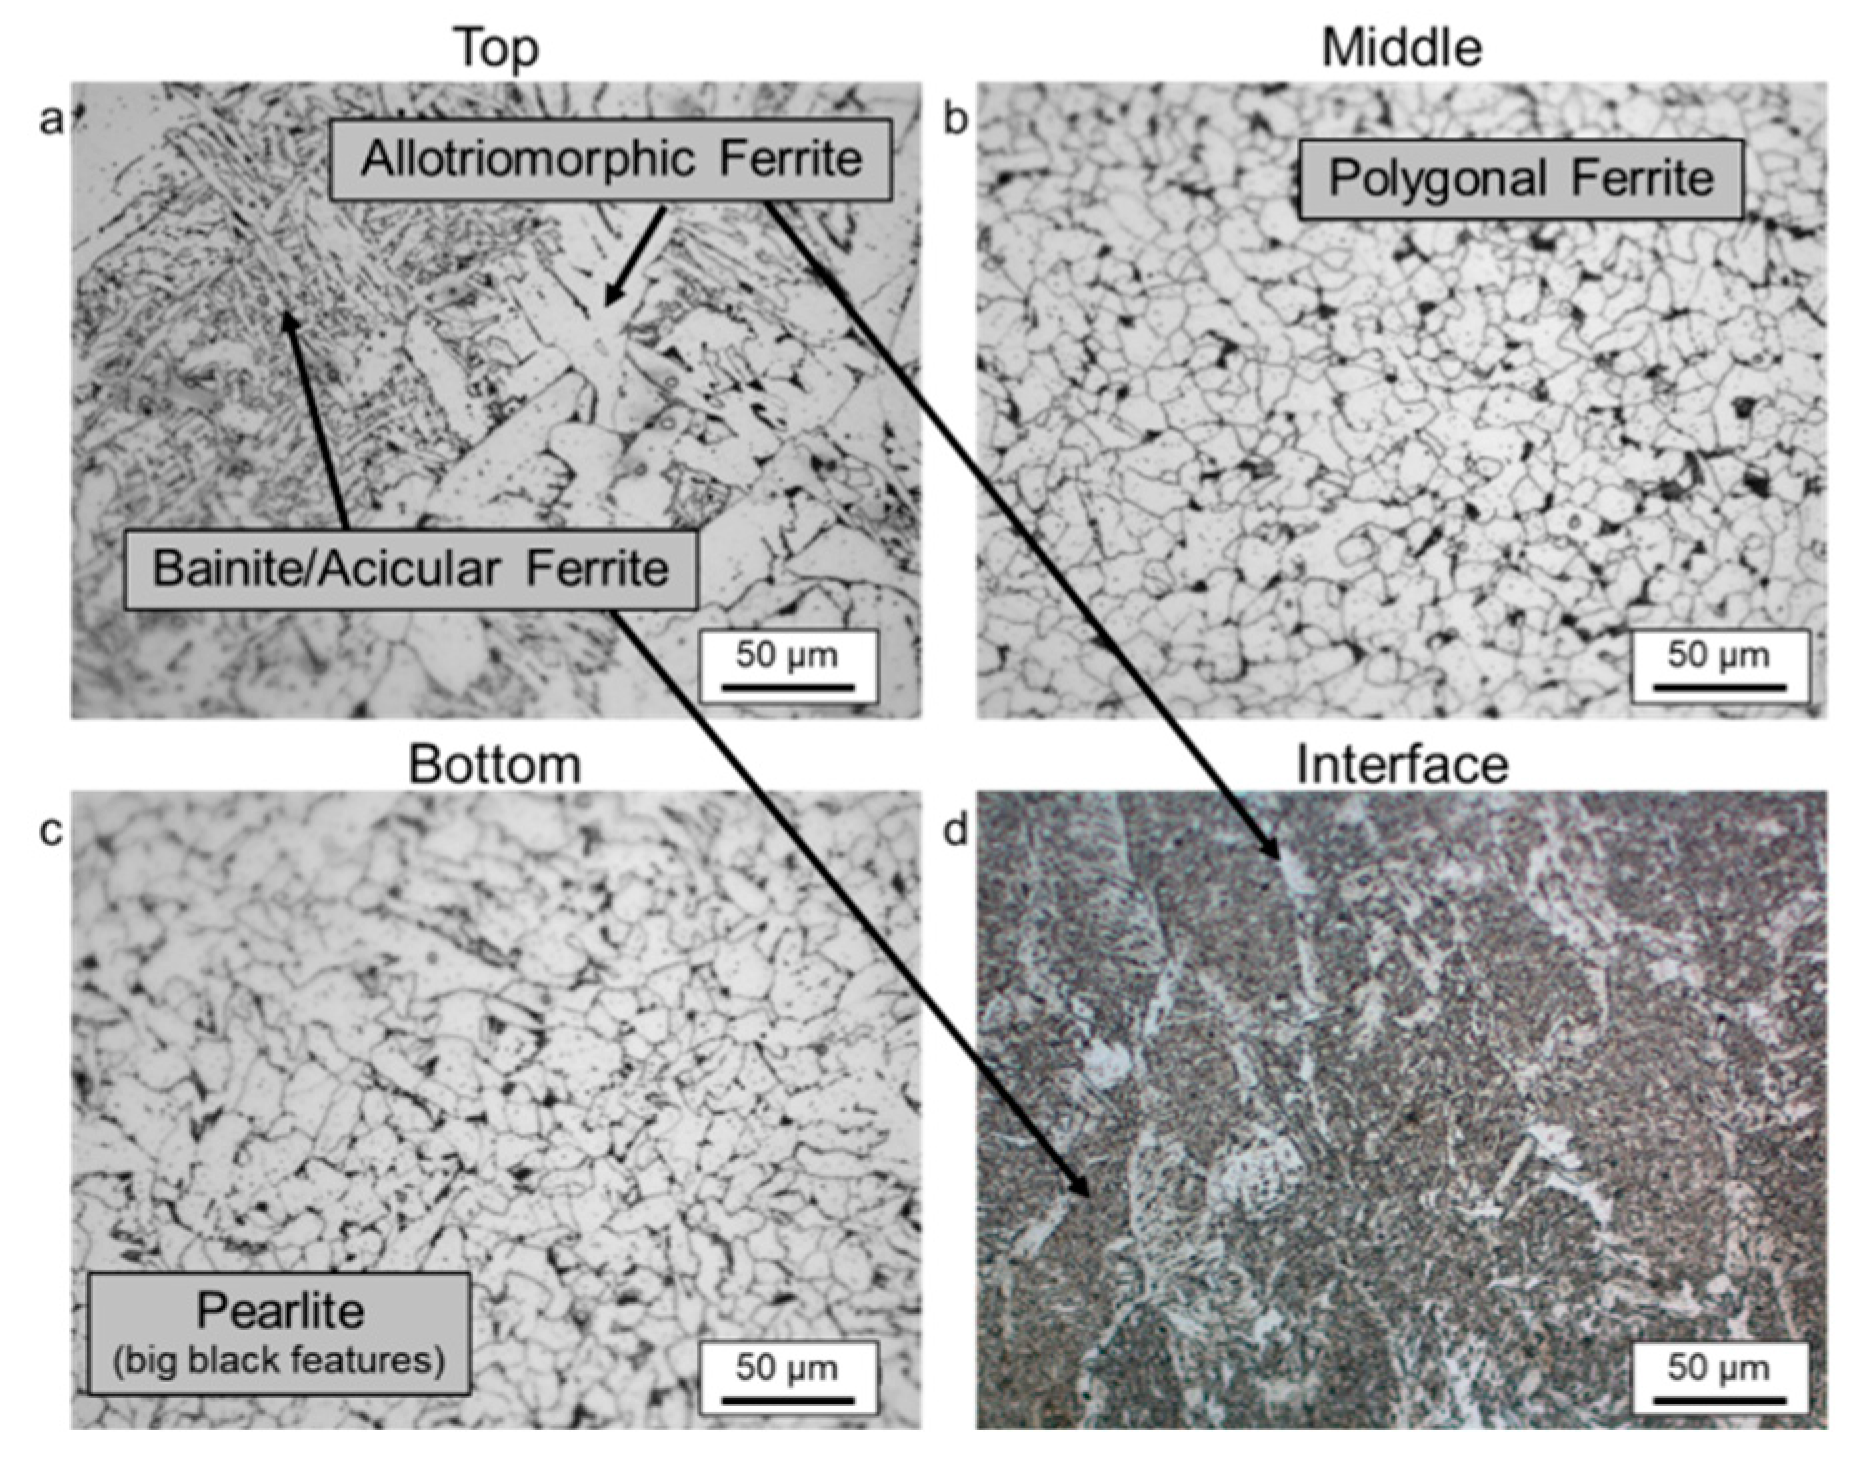
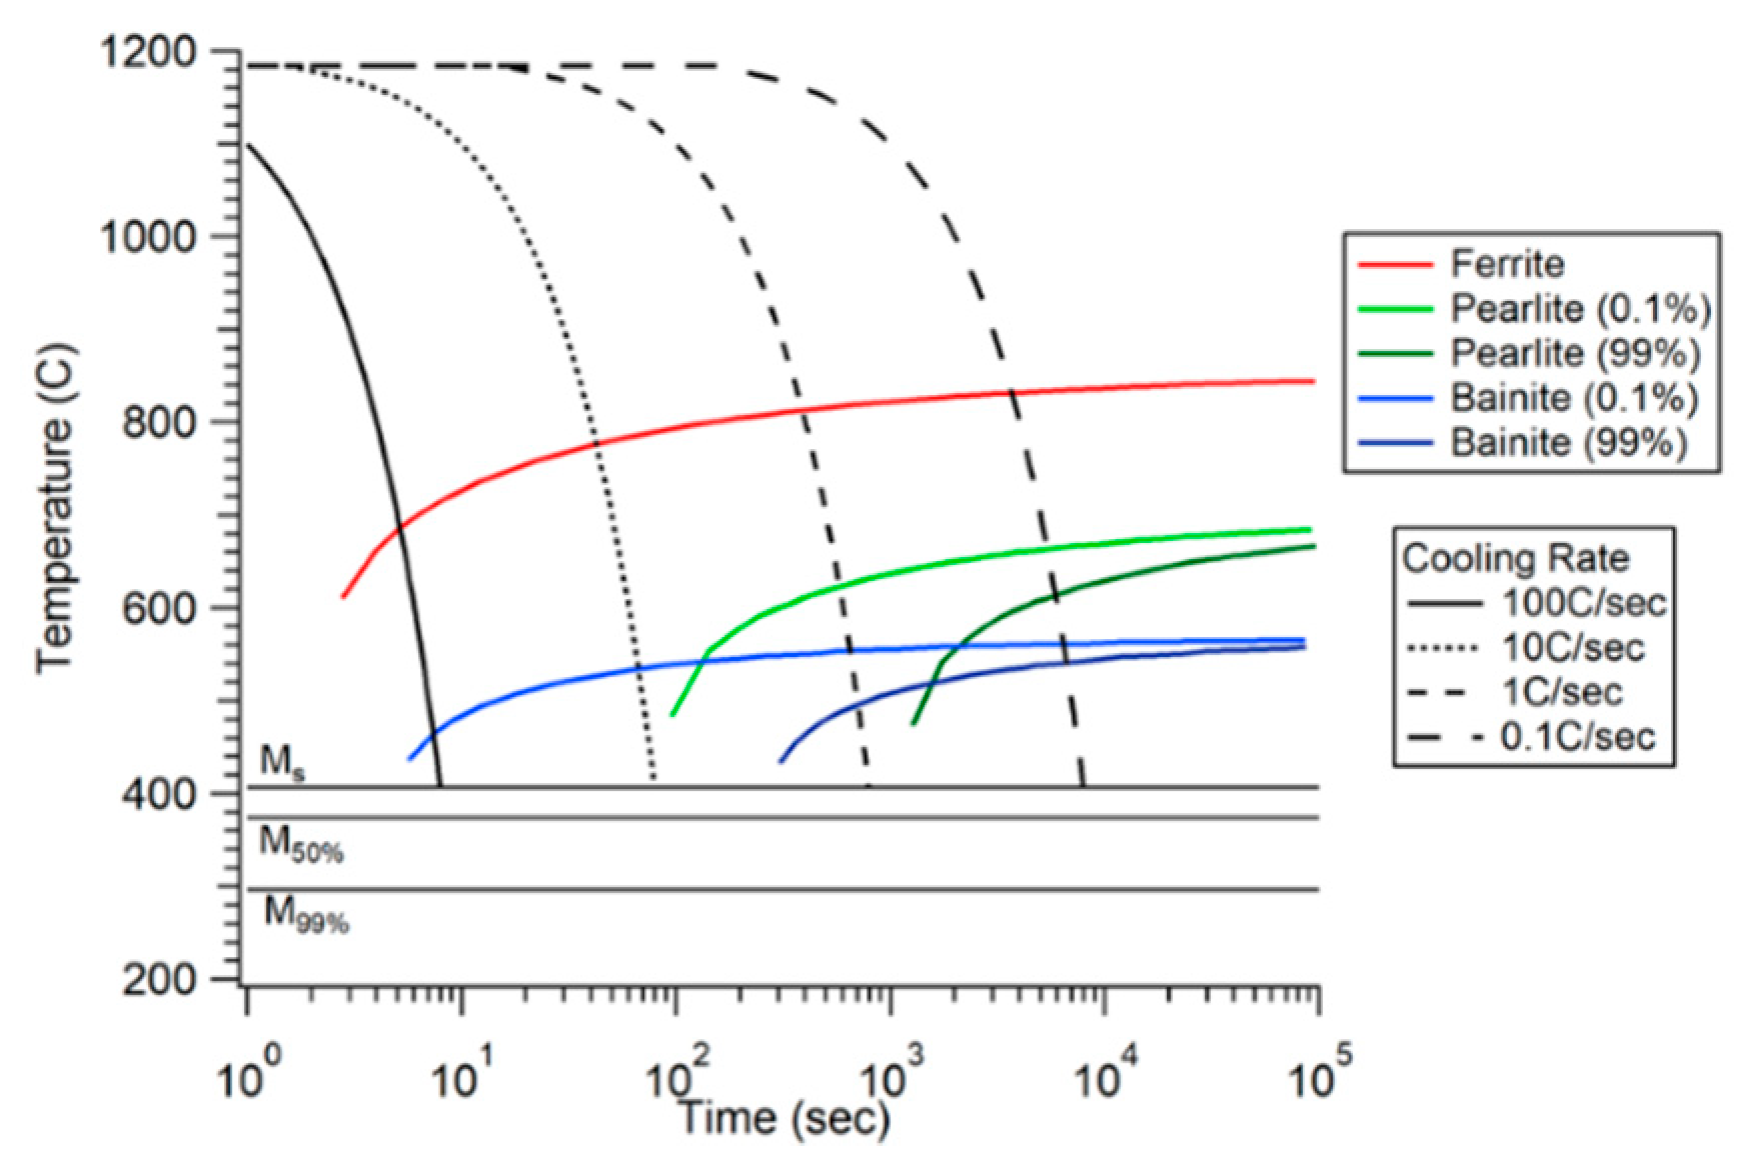
  • Grain boundary nucleated primary ferrite forms between 800 °C and 650 °C at the prior austenite grain boundaries when cooling is moderate.
  • Ferrite side plates (or often referred as Widmanstätten ferrite) form between 750 °C and 650 °C at the prior austenite grain boundaries when cooling rates increase.
  • Fine-grained acicular ferrite forms below approximately 650 °C within the prior austenite grains
  • A lath structure with a significant dislocation substructure forms below 500 °C; this structure is hypothesized to be Bainite when cooling rates are fast (>50 °C/s)
  • In highly alloyed steels, cooling below 400 °C often leads to a martensitic microstructure.
Upon heating above the Ac1, these transformation products start to re-transform back into FCC austenite. This cyclic transformation may lead to a microstructure with local brittle zones (a mixture of a martensite-austenite-carbide microstructure, also referred as an MA constituent) and may contribute to the scatter in the impact toughness data. Scatter in weld metal toughness of low carbon steel multi-pass welds have been well documented [17,22,23,24]. In multi-pass welds, constituents, such as upper-bainite and martensite islands, increase the probability of cleavage fracture. On the other hand, microstructural constituents, such as acicular ferrite, lead to superior impact toughness of low carbon welds [25,26,27].
The focus of this research is to evaluate the mechanical properties of MBAAM manufactured parts and to rationalize the properties with microstructure characterization. The walls built in this study represent the simplest possible geometry that is representative of a larger range of useful geometries. The mechanical properties of different MBAAM geometries will be expectedly different due to cooling rate sensitives and specific geometric aspects. It is important for the future progress of large-scale additive manufacturing to understand how geometrical features affect the properties.

2. Methods

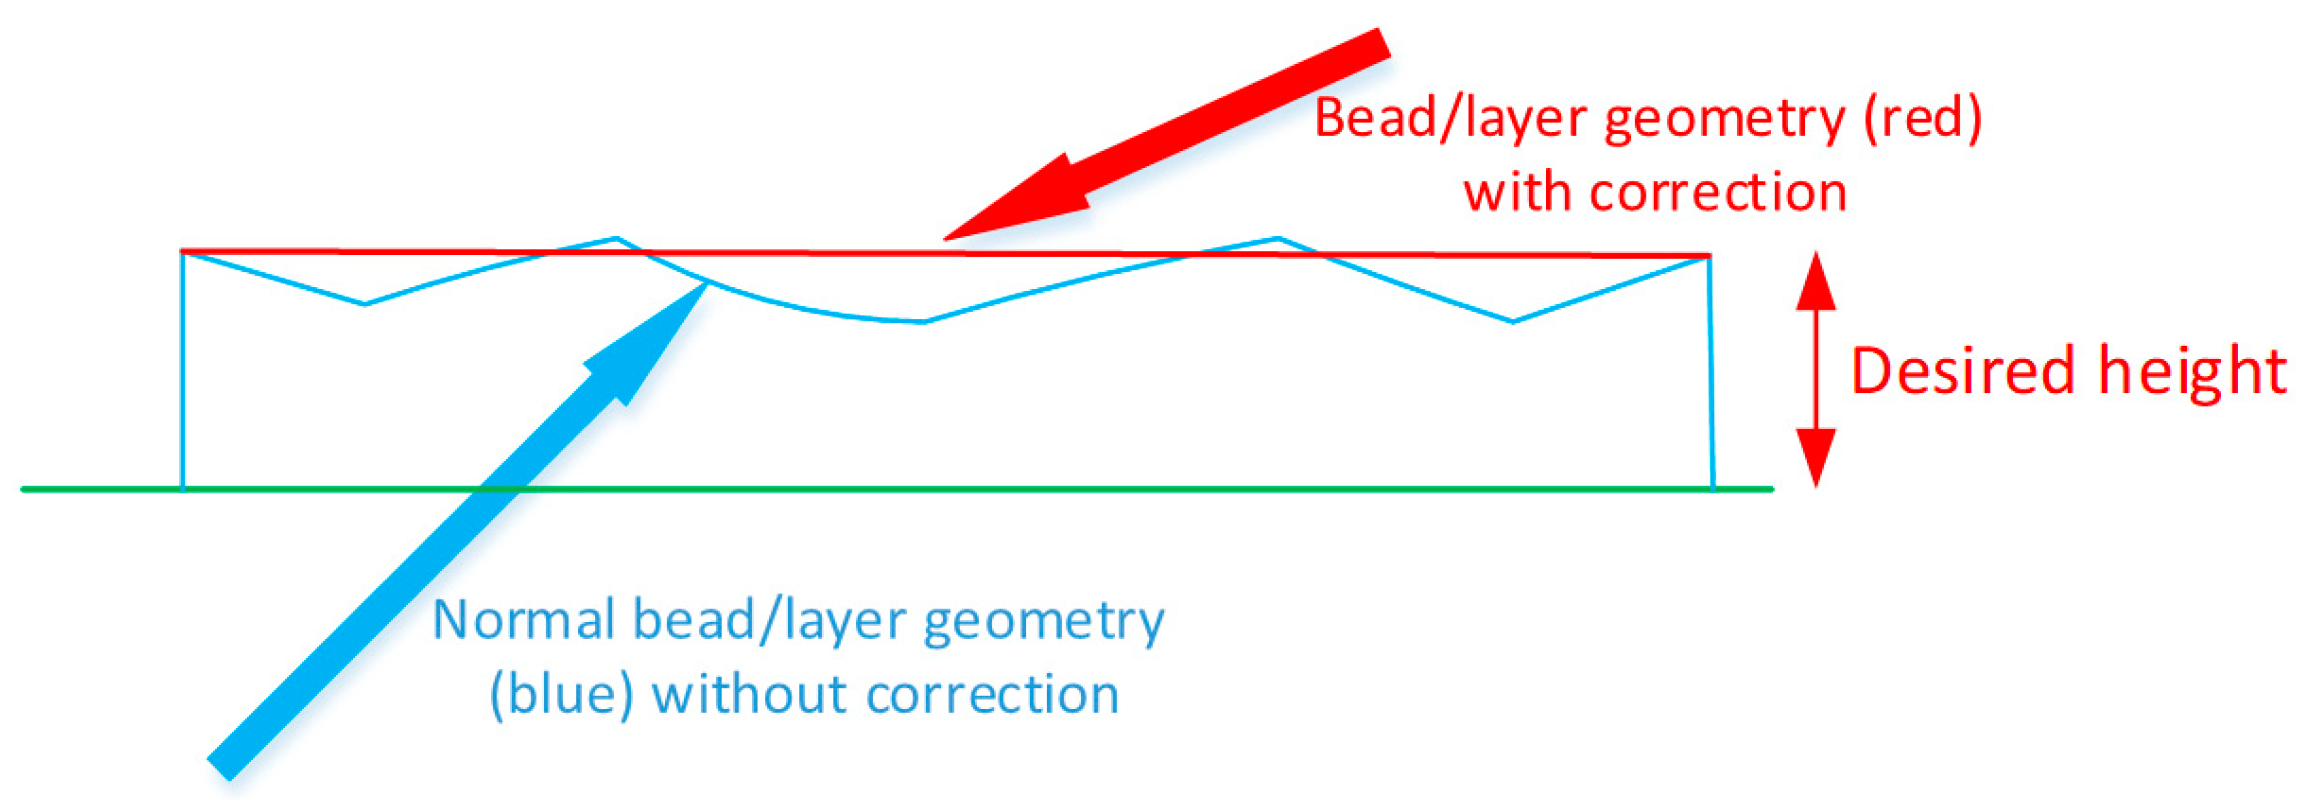
2.1. Compensation Based Controls Approach

The ORNL closed loop control methodology is based on a compensation-based approach to combat the dynamic nature of welding and provide uniform flat beads and layers of a desired height. The system is equipped with three different control strategies. The first strategy aids in facilitating the part location, the second strategy retains the optimal stand-off distance, and the third strategy is a feedback loop that adjusts deposition rate.
Since GMAW is sensitive to the wire-workpiece distance, or standoff, it is critical to start the arc at the optimal vertical distance. To accomplish this first control strategy, the robot arm positions the welding head over the build zone and slowly lowers the weld head down until the welders’ electronics can sense and establish a low current short duration arc between the wire stick-out and the workpiece. The wire stick-out is a constant in the control of the initiation of each weld pass. After the short time arc positioning sequence, the vertical distance of the weld head is recorded in the G-code software. The weld head retracts, and, on the next approach, the deposition arc is established.
The second control strategy retains the optimal standoff distance over the whole deposition path. The deposition amperage variations are monitored by the welding system, and the robot control system automatically adjusts standoff based on the variations. This amperage signal is used to calculate the actual distance to the part. The controller adjusts the desired path in the vertical direction in real time to retain an optimal standoff distance based on current feedback. The two strategies combined still do not guarantee bead flatness or precision.
The third control strategy is used to actively sense the feedback signal from the welding system and adjust the linear deposition rate (wire feed rate, kg per unit length). By doing so, the regions that are overbuilding receive less material, while depressed regions receive more, resulting in a flat uniform surface at the desired height. Figure 1 is a pictorial representation of the compensation-based approach using the three control strategies. The blue line represents the resulting geometry from uncompensated welds, showing the dynamic nature of welding that produces a rough surface. The red line represents the resulting geometry from the compensation-based approach in which the weld layer height remains constant and uniform. Figure 2 shows two walls built using an industrial welding robot the ORNL MBAAM closed loop control system [28]. Figure 2b shows a wall built without using the compensation-based approach and shows the rough, nonuniform layer height, as well as weld pool flow, off the sides of the wall. Figure 2c shows a wall that was built using the compensation-based approach. Here, each layer is flat and uniform, with a reduced surface roughness. The compensation-based approach exhibits a uniform build quality.

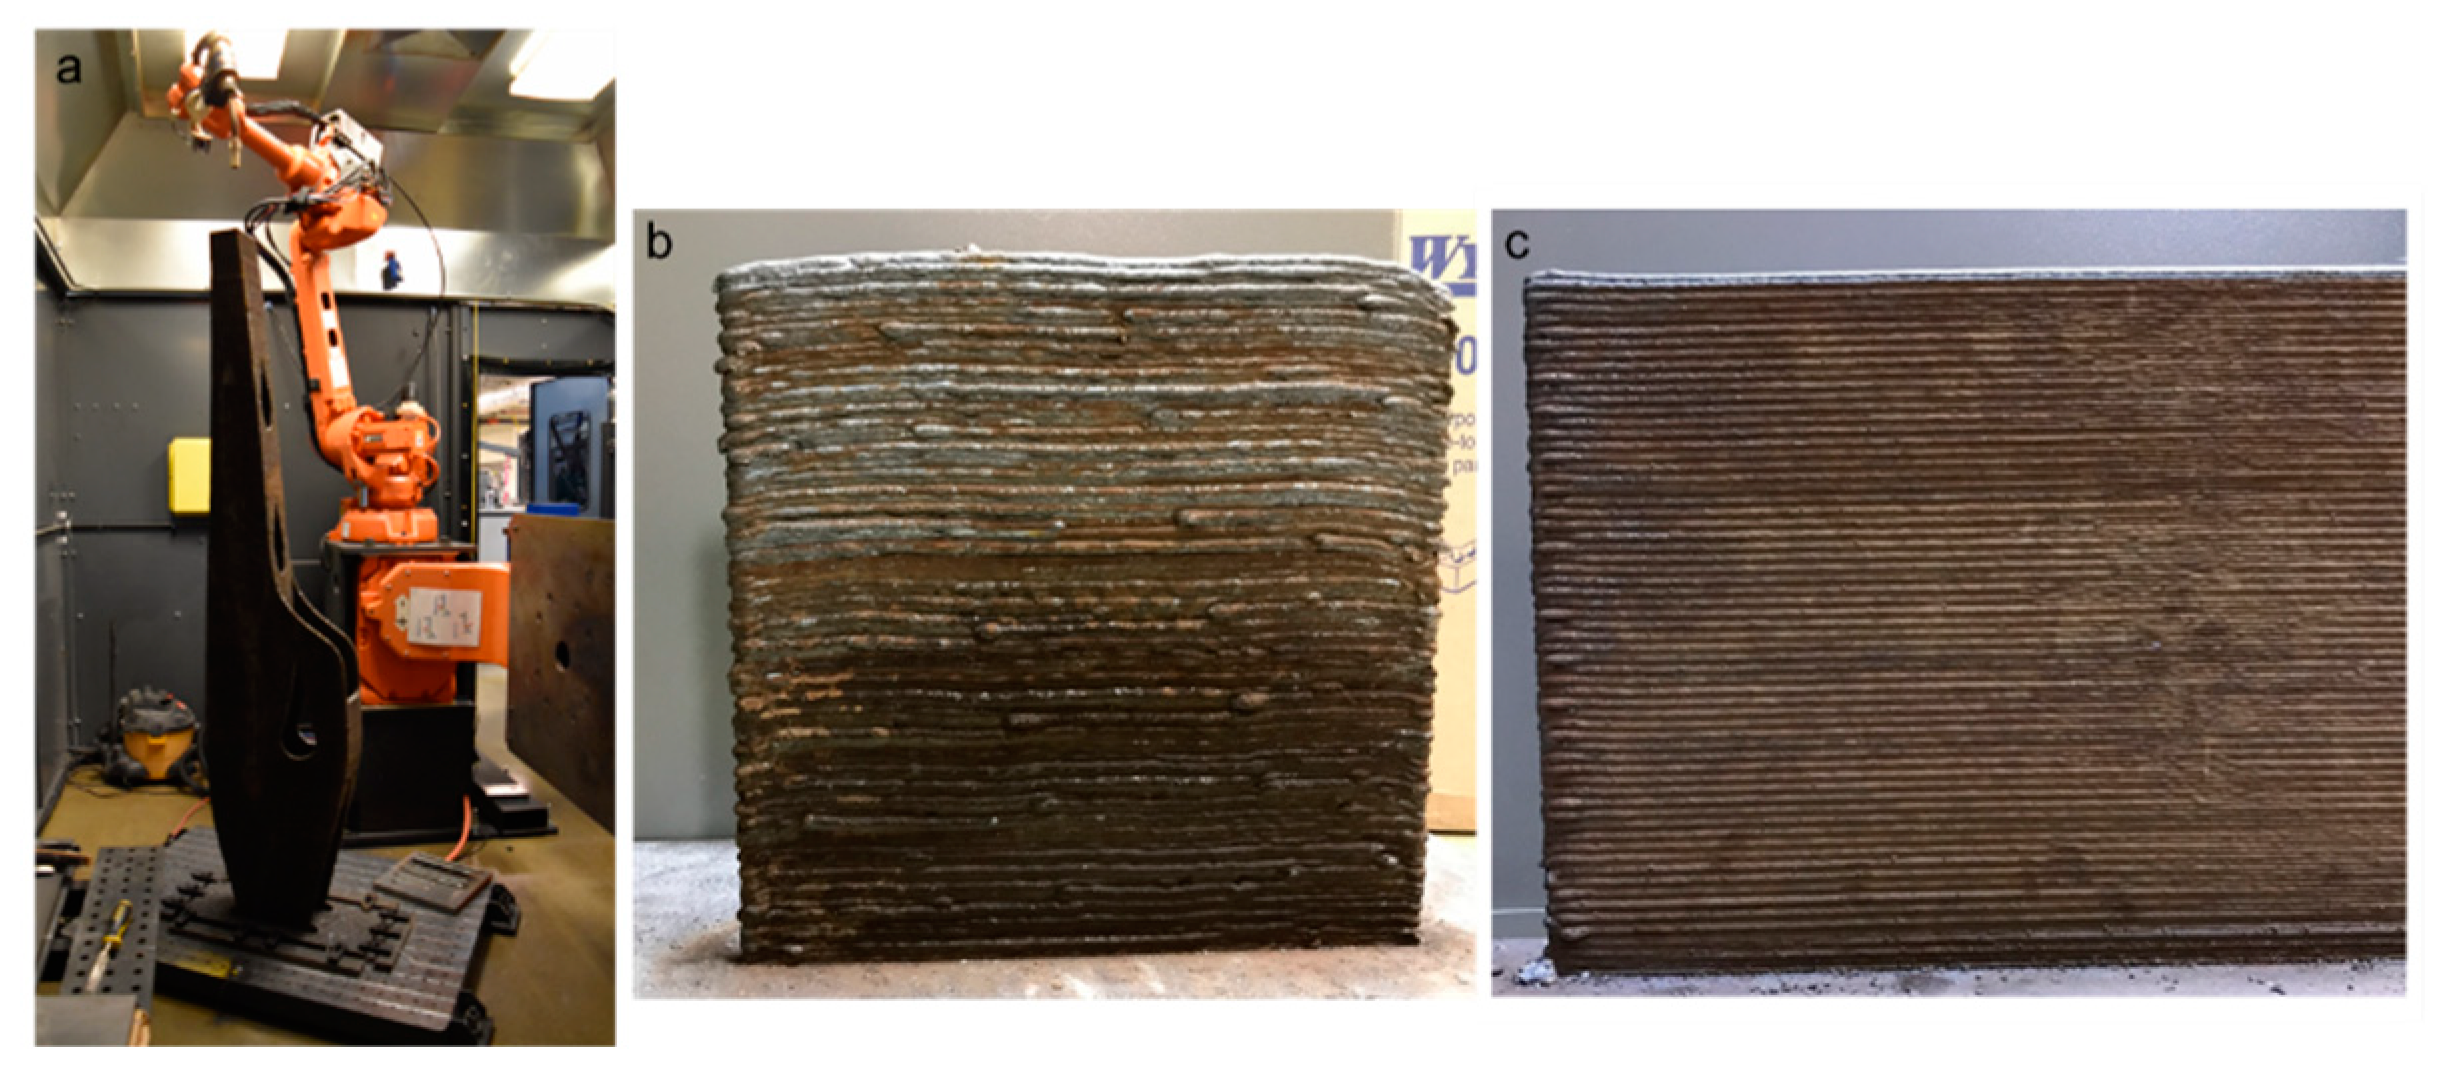
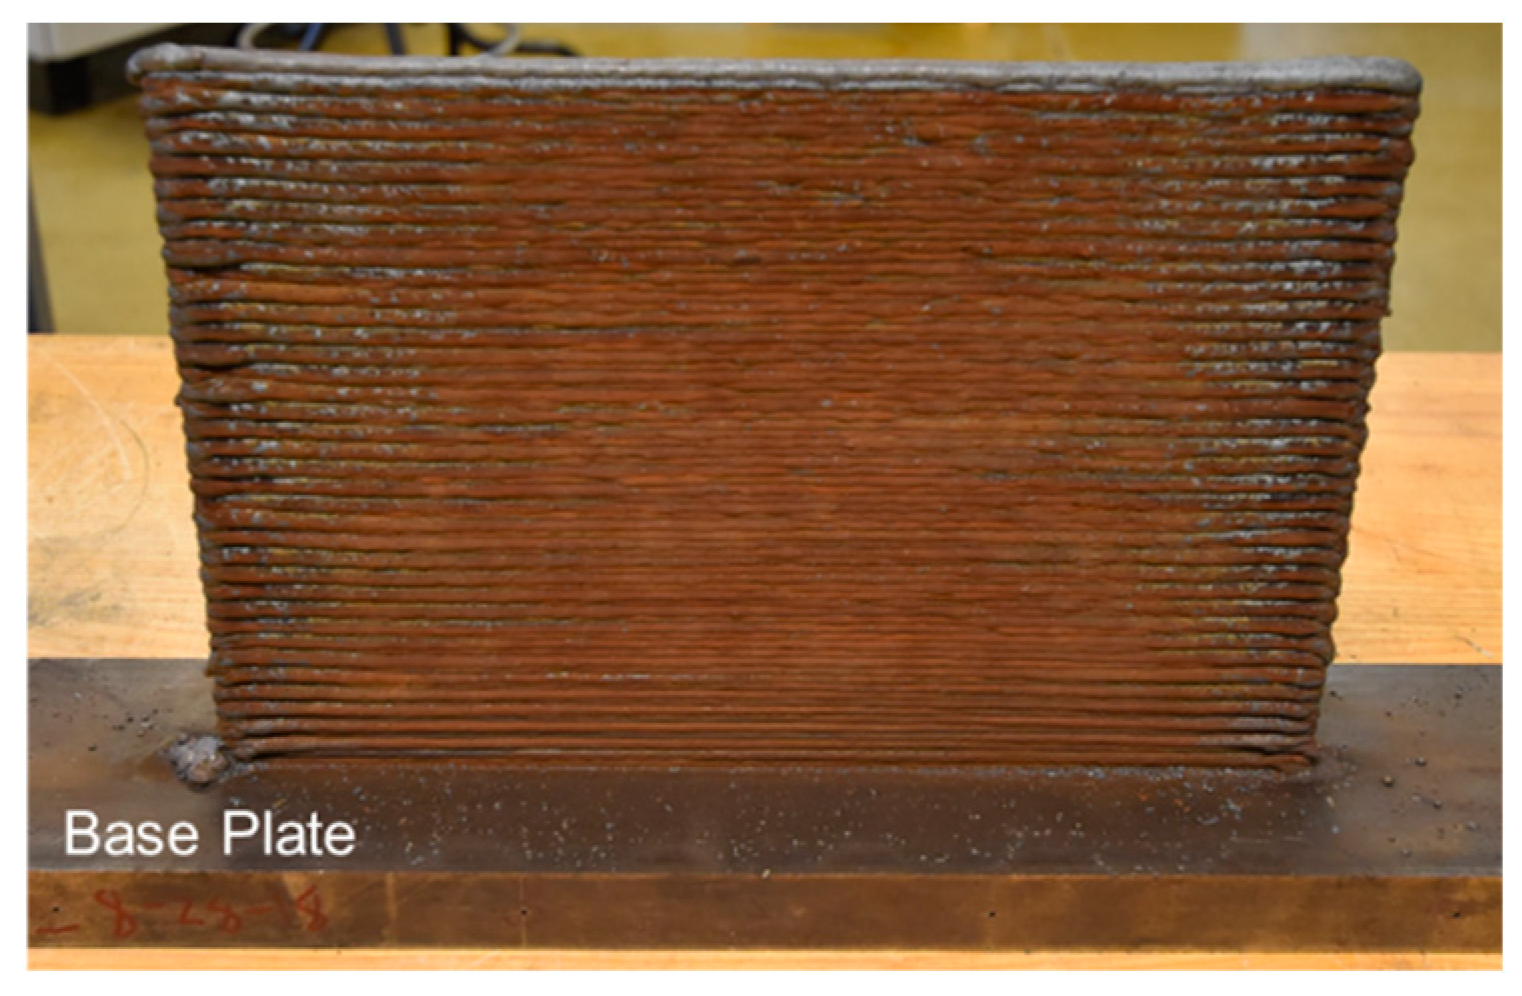
2.2. Metal Big Area Additive Manufacturing Process

Two MBAAM builds were printed using a 6 degree of freedom (DOF) ABB IRB-2600 robot with a 1.85 m arm reach, (see Figure 2a). The MBAAM process utilized GMAW to build two vertical walls, (Figure 3 shows an example of an MBAAM wall with the base plate), using a Lincoln Electric Power Wave ® R500 power source with an advanced module for STT (Surface Tension Transfer®). The filler wire used for printing the walls was SuperArc® L-59®, an ER70S-6 welding wire (0.09C, 1.5Mn, 0.85Si, Bal Fe, in wt%). AISI 1018 (0.18C, 8Mn, Bal Fe, in wt%) was used as the base plate. One build, for tensile testing and microscopy, measured 572 mm tall by 470 mm long, and the other build, for Charpy impact toughness, measured 305 mm tall by 362 mm long. Both walls were built using two parallel beads with a 4.5 mm center to center spacing. The total resulting thickness of both builds was 12 mm. The bead height was around 2.3 mm and the total number of layers for each wall was 245 and 130 mm, respectively. The welding parameters in the first few layers were altered to account for a cold starting temperature of the base plate: 164 A, 15.7 V, a travel speed of 254 mm per minute, and an initial wire feed rate of 5.08 m per minute. The remainder of the build used 160 A, 15.7 V, a travel speed of 406 mm per minute, and the same wire feed rate. 95% Argon- 5% CO2 was the cover gas.

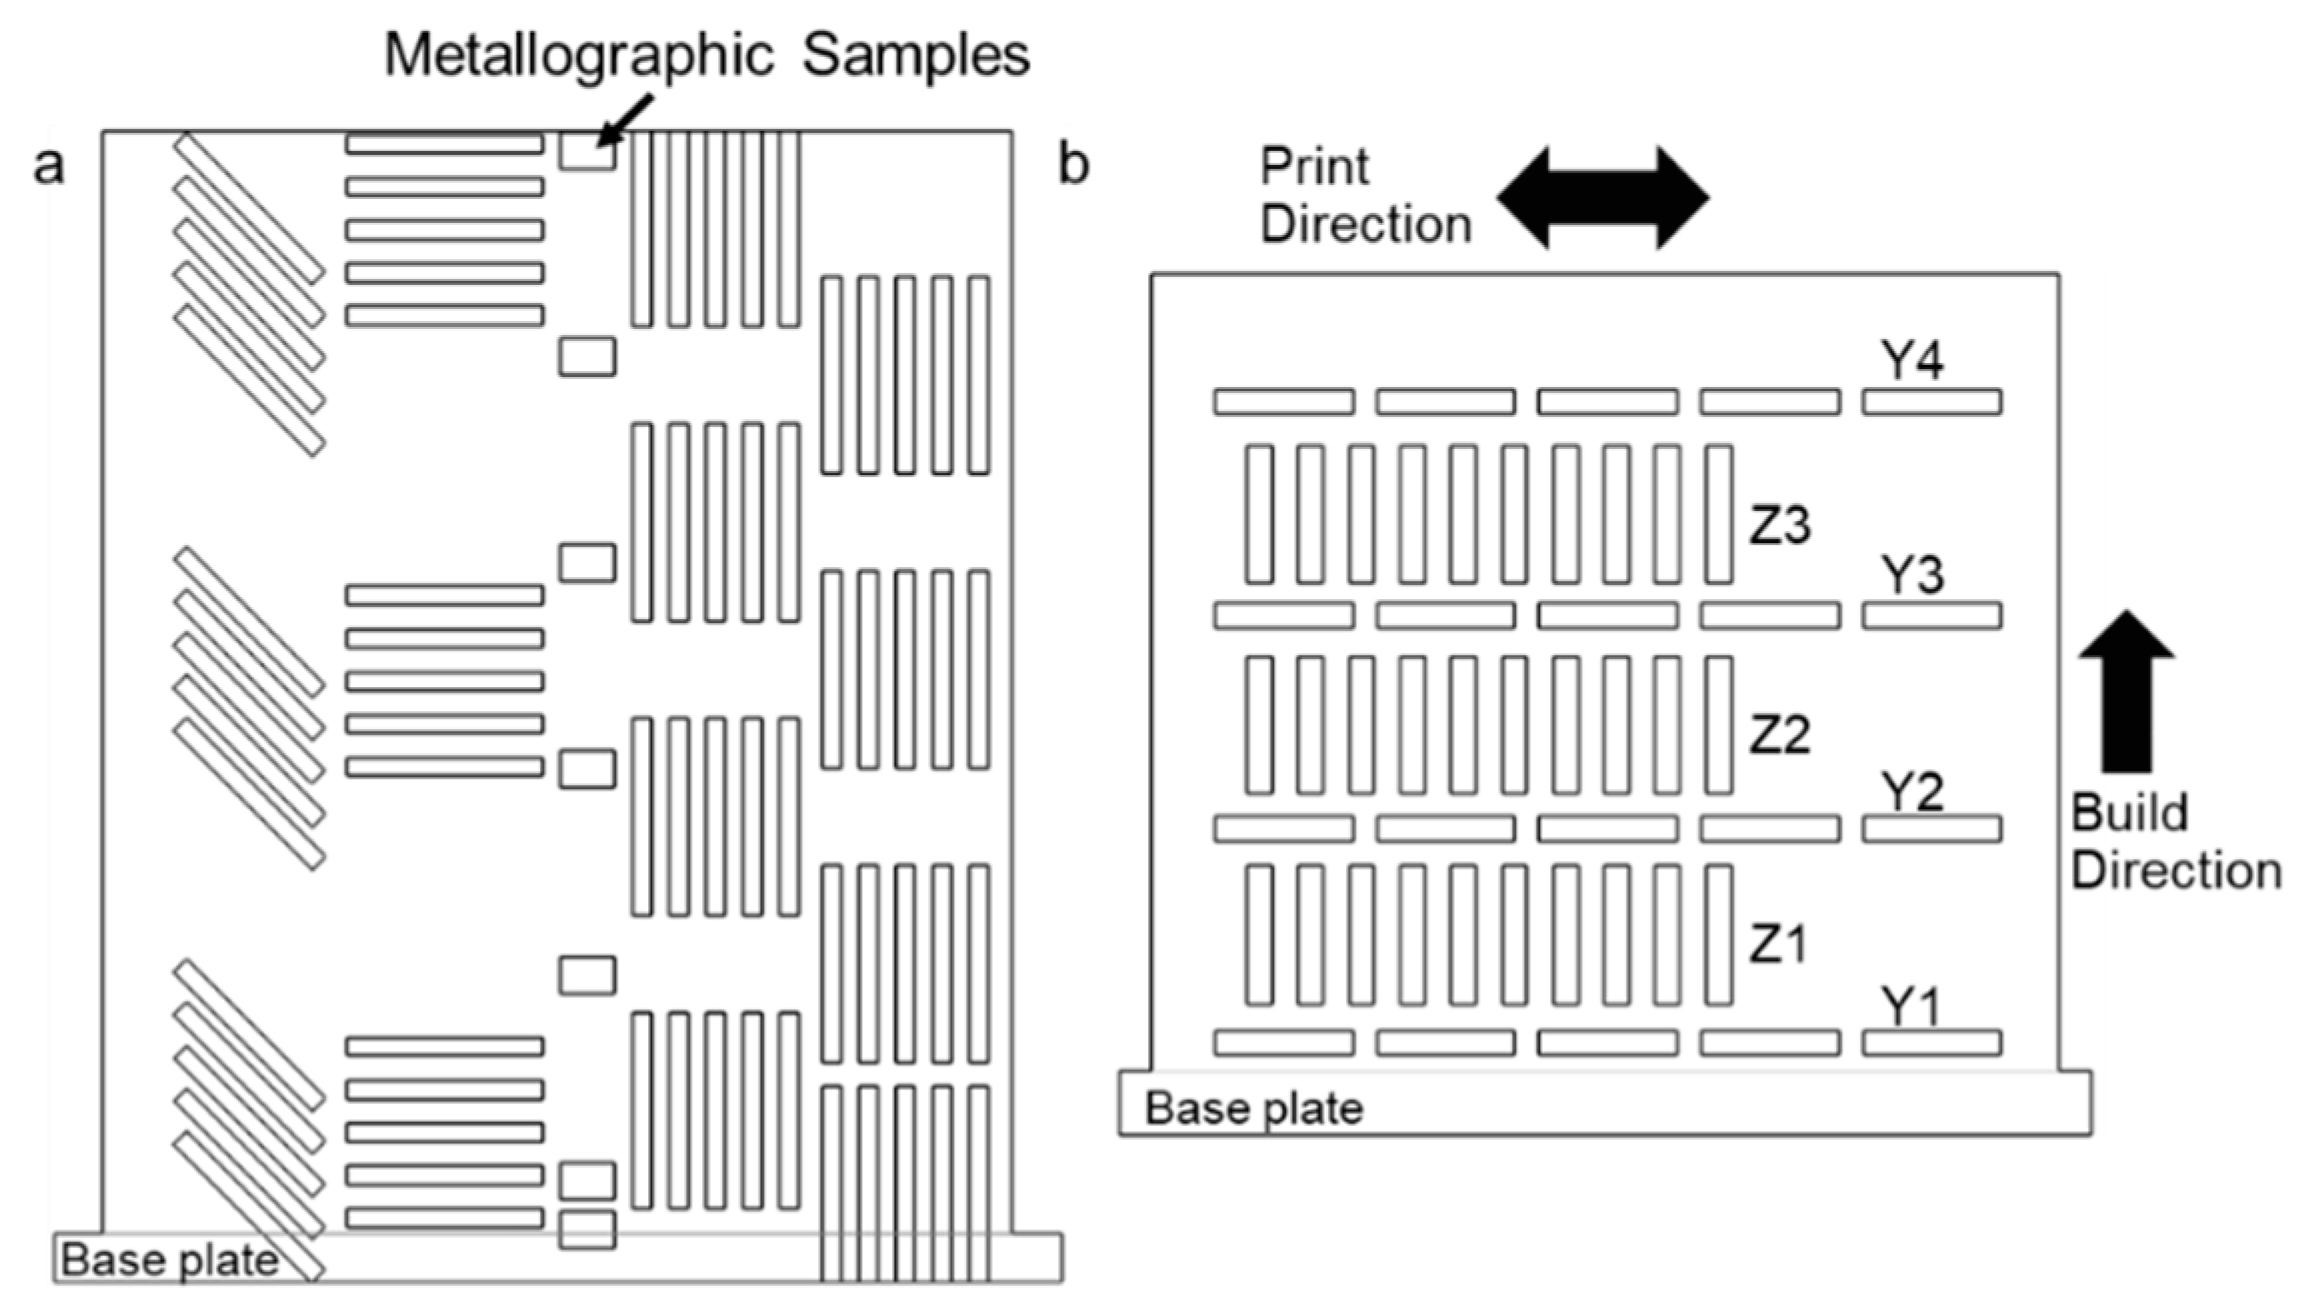
2.3. Mechanical Testing

After printing, the walls were machined for either tensile testing, Charpy impact toughness testing, or metallography. The tensile and impact specimens were machined according to ASTM standards [29,30] and taken from three orientations, i.e., with the long axis’ parallel, 45°, and perpendicular to the build direction. Three sets of three specimens were machined for the perpendicular and 45° orientations, i.e., three specimens at the bottom, middle, and top of the build. The parallel orientation had eight sets, numbered 1–8, of three samples. The center of sample set 1 contained the interface between the build and the base plate (note that this is the only interface that will be referenced in the research). The center of sample set 2 was 63.5 mm from the interface. The subsequent parallel samples were taken from the build height at a center to center distance of 63.5 mm (see Figure 4a). The tensile tests were conducted on a 111 kN capacity MTS SHM-07, 4 pillar tensile frame. All the samples were tested at room temperature using a strain rate of 0.076 s−1.
The Charpy specimens were machined, from two orientations, with the long axis parallel to the build direction (Z) and the long axis perpendicular to the build direction (Y). Three sets of samples were machined in the parallel directions (Z1, Z2, Z3) and four sets of samples were machined in the perpendicular direction (Y1, Y2, Y3, Y4). The first perpendicular samples were machined 12.7 mm from the interface and the subsequent samples alternated directions up the build height (see Figure 4b). The Charpy specimens were tested on a Tinius Olsen Charpy Impact Machine with 407 J capacity. Samples were tested at temperatures of −80 °C, −60 °C, −40 °C, −20 °C, and 25 °C (room temperature).

2.4. Microstructural Characterization

Samples for microstructural examination were machined at seven locations parallel to the build direction in the wall where the tensile specimens were machined (see Figure 4a). The samples were mounted in phenolic resin and prepared using standard metallographic techniques. Hardness mapping was conducted after a polish of 1 μm and was conducted on a Leco LM100AT microhardness machine. A final polish was achieved with a 6 h interval using 0.05 μm colloidal silica on a Buehler Vibromet II®. For the microstructural investigation, the samples were etched with 2% Nital. Optical imaging was conducted using a Zeiss Axioscope 5 light optical microscope. Scanning Electron Microscopy (SEM) of the microstructure and fracture surfaces was conducted using a JEOL 6500 FEG-SEM at 20 kV equipped with EDAX Electron Back Scatter Diffraction (EBSD).

3. Results

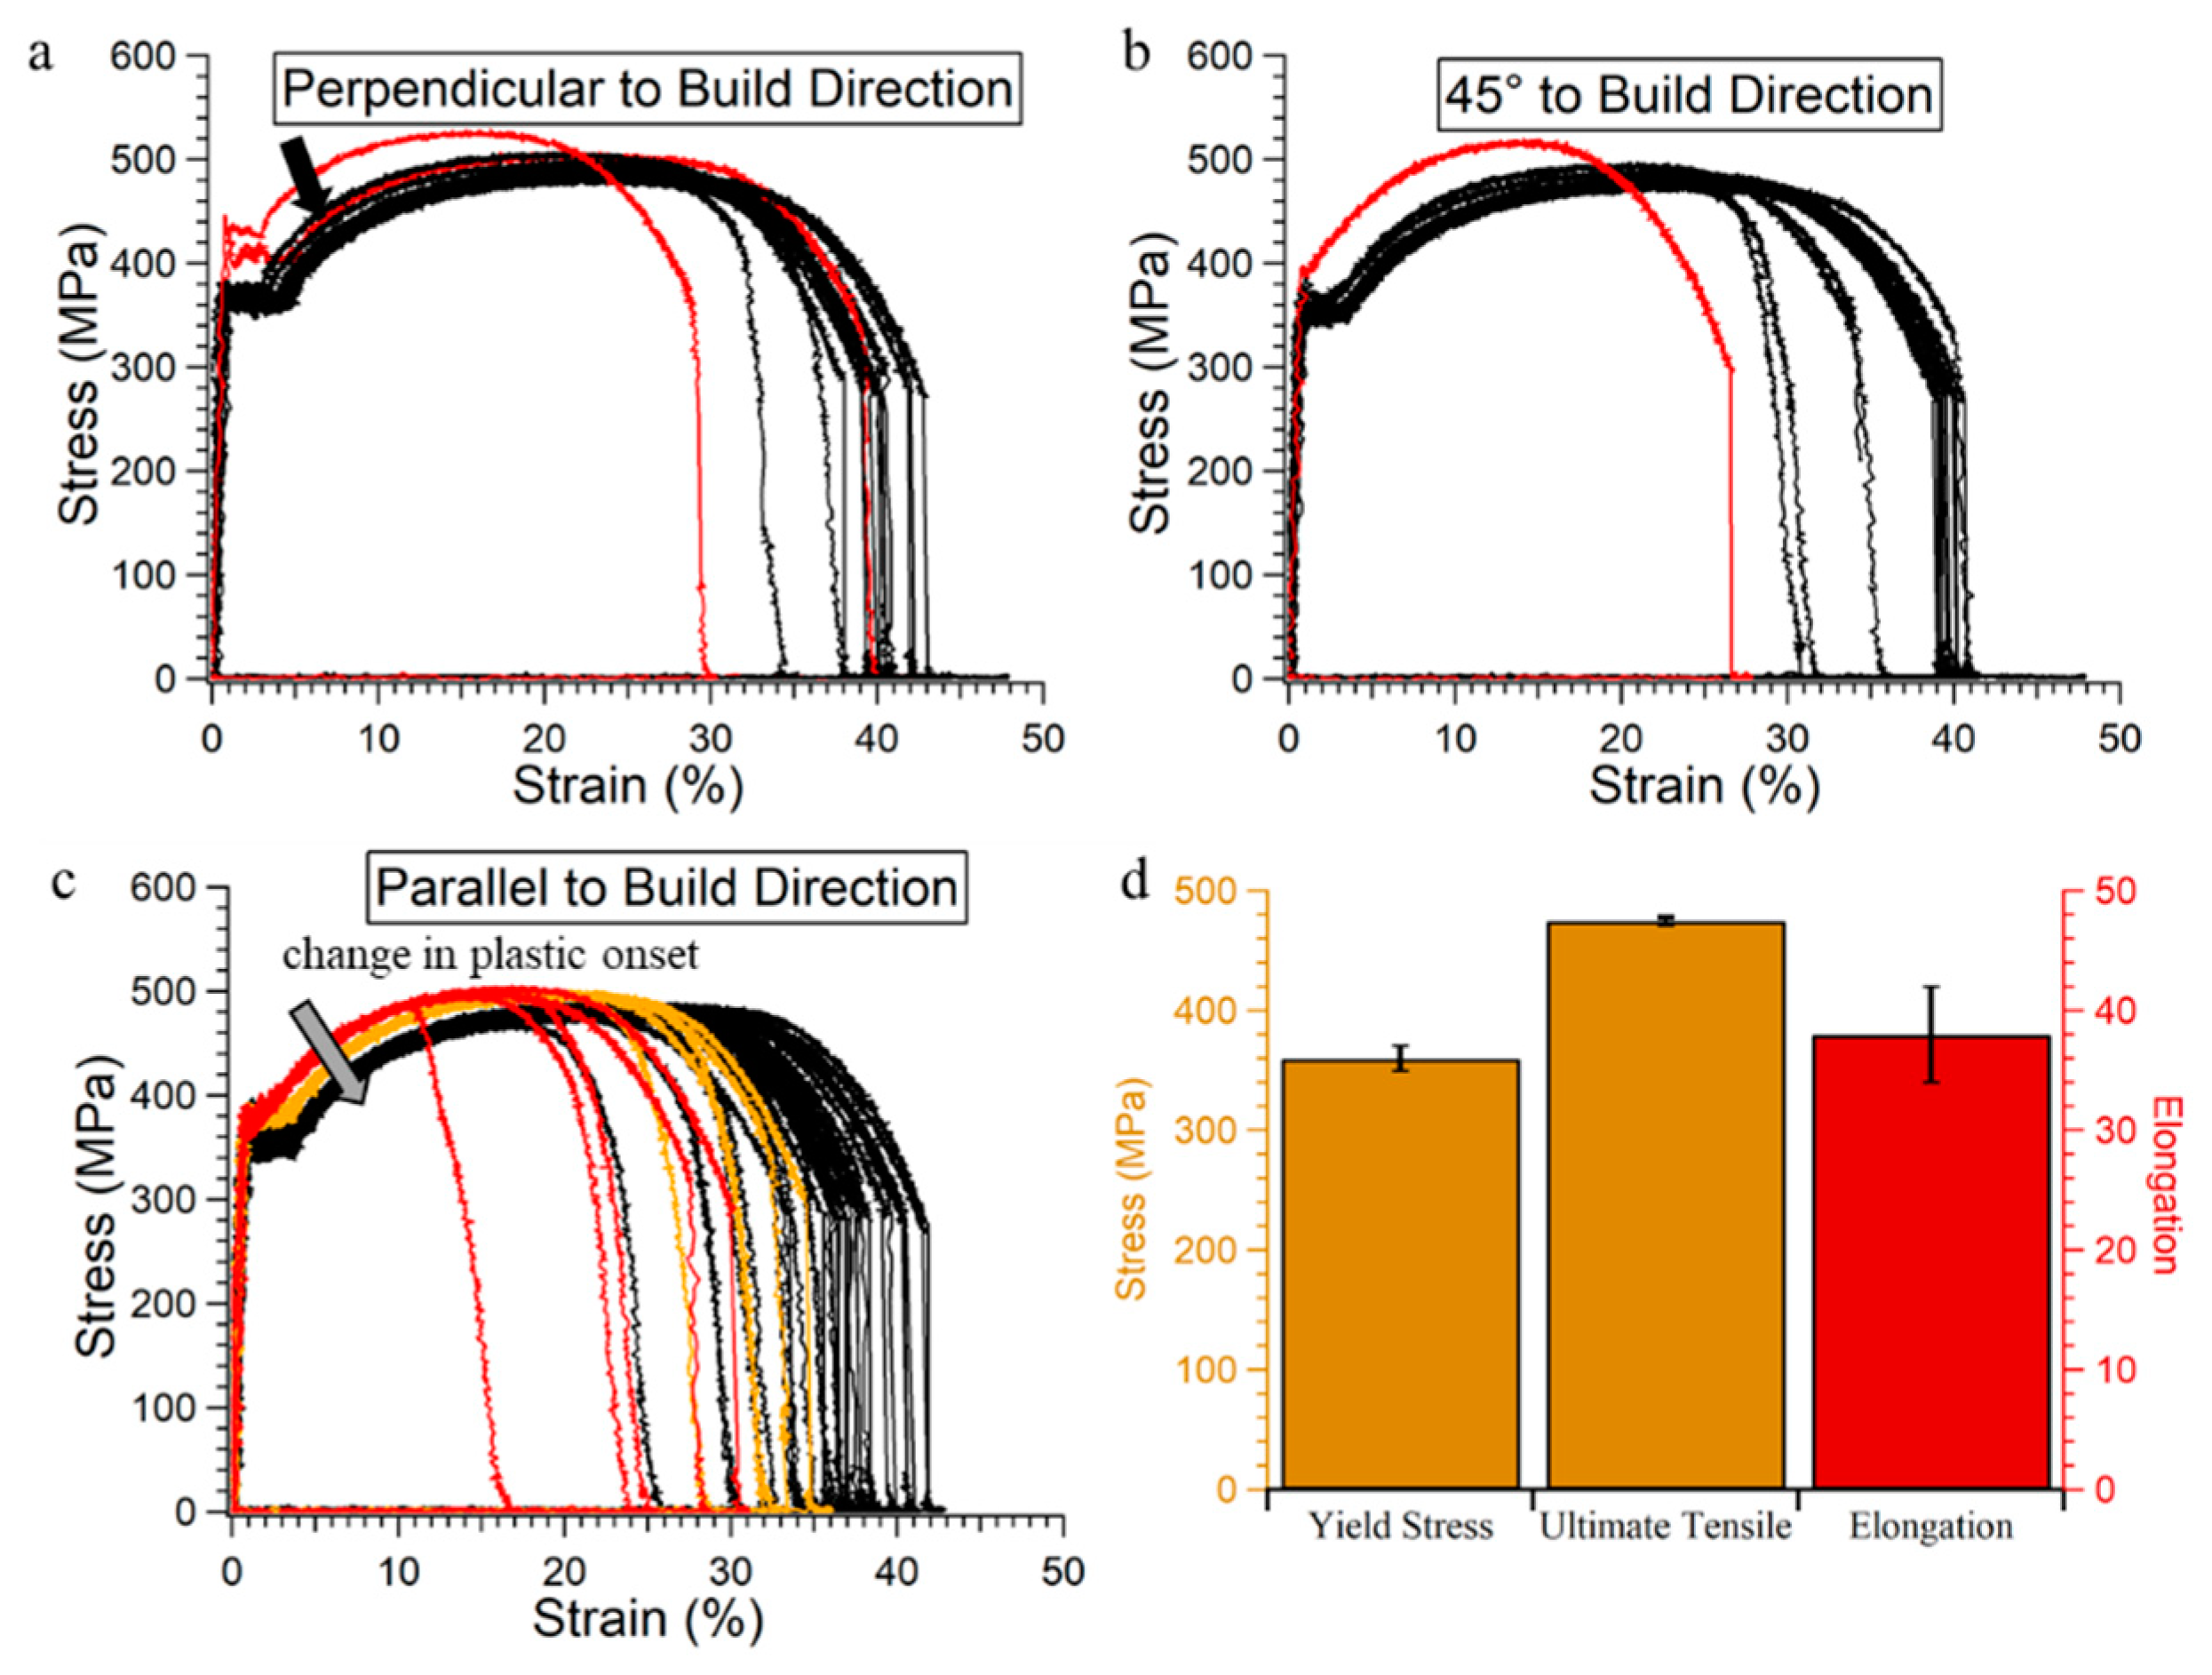
3.1. Tensile Testing

For deployment of AM, it is necessary to make sure that a build meets or exceeds the material performance necessary for the intended application. Here, SuperArc® L-59®, equivalent to ER70S-6, is utilized and conforms to AWS A5.18/A5.18M specifications [31]. However, due to differences in cooling rates and geometrical challenges, traditional comparisons to welding and standards may not yet apply to MBAAM and large-scale additive manufacturing. Figure 5 shows the tensile stress-strain curves for three different orientations with reference to the build direction: perpendicular (90°), 45°, and parallel (0°) to the build direction. The samples from the interface region of the build have the highest yield point (approximately 420 MPa, with red and orange curves). This region (bottom 50 mm) is generally removed and discarded and is not typically associated with a structural component. The yield point drops to an average of 360 ± 7 MPa (black curves) in the remainder of the build for all orientations.
The heat transfer in the walls manufactured by MBAAM differs from standard multipass welding butt joints (i.e., all weld metal testing) and can result in lower yield strengths when compared to traditional welding. The heat transfer in traditional multipass welding consists of 3D conduction through the work piece and radiation, generally resulting in fast cooling rates. The heat transfer in this thin wall build is dominantly just radiative, which can result in relatively slower cooling rates. This difference highlights the variation in MBAAM versus traditional multipass welding and shows that alloy development and new standards may be required for MBAAM construction methods.
Most of the tensile curves show the well-known yield point phenomenon that is usually observed in annealed low carbon steel. Previous studies, where samples were fabricated using TIG welding, also showed similar discontinuous yielding [24]. In these samples, uniform plastic deformation began roughly at 5% strain. Near the build plate, however, the yield point phenomenon was reduced in magnitude, i.e., uniform plastic deformation began at approximately 0.5% to 1% strain. The arrows denote the change in uniform plastic deformation in the tensile specimens as we move in the Z direction. This difference can be rationalized with the microstructure characterization.
The ultimate tensile strength (UTS) is the largest in the samples extracted from the interface region (red and orange curves) of the build (525 MPa) compared to other samples. The UTS dropped to an average of 475 ± 4 MPa (black curves) in the samples from rest of the build. The elongation at fracture of all the orientations, except one sample that contained a discontinuity (i.e., a lack of fusion), ranged from 25% to 42%. Similar trends are seen with increasing build height. The lowest elongations to fracture are at the interface region of the build. However, for most of the build, the elongation to failure ranged from 34% to 42%. For the main body of the build, the curves exhibited fairly isotropic yield and tensile strength properties (black curves) with respect to the build direction. There was some scatter in the elongation at failure. This semi-isotropic behavior shows that the MBAAM method can generate reliable and consistent mechanical properties once a quasi-steady state thermal condition (a migrating thermal transient up the build) is achieved.

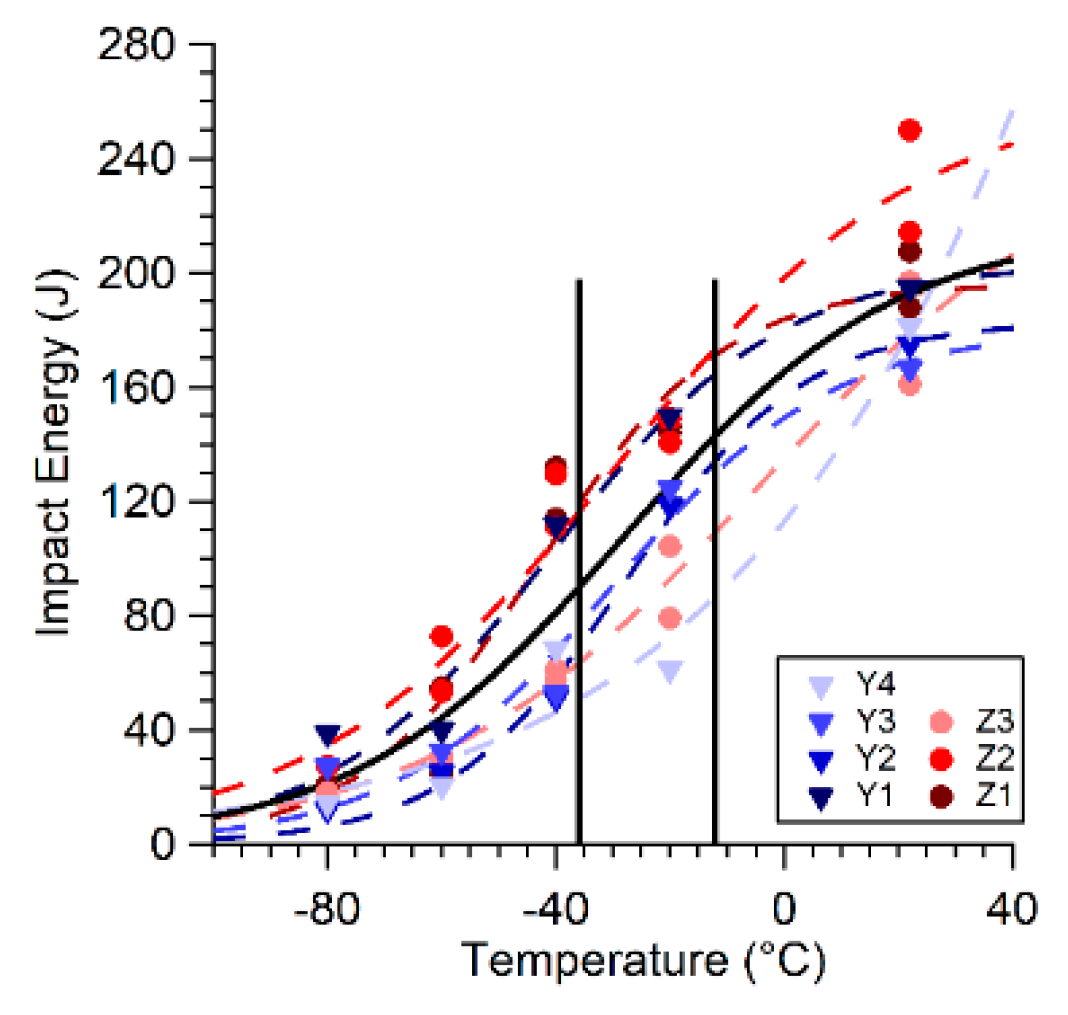
3.2. Charpy Impact Toughness

Impact toughness is an important dynamic property for structural materials. However, the impact toughness of carbon steel built by the wire-arc AM techniques is not known. The results of Charpy V-notch impact testing of the MBAAM builds is depicted in Figure 6. The samples with the long axis parallel to the build direction are labelled Z1, Z2, and Z3, where Z1 is near the bottom of the build, and Z3 is at the top of the build. The samples with the long axis perpendicular to the build direction are labelled Y1, Y2, Y3, and Y4, where Y1 is nearest the interface and increases with build height (see Figure 4). The solid black curve shows the curve fitting of all the samples representing the entire build and shows the Ductile to Brittle Transition Temperature (DBTT) to be approximately −25 °C. The DBTT was determined at the temperature intersection of the midpoint between the upper and lower impact energy shelf. The upper impact energy shelf is approximately 200 J and the lower impact energy shelf is approximately 20 J. The colored dashed lines represent the curves fit to data from specific locations, i.e., Z1, Z2, etc. The results show that the DBTT increases with build height from −36 °C in the bottom of the build to −17 °C in the upper build (denoted with the vertical black lines). Although there is a general scatter of the data points over the entire build, each individual location, i.e., bottom, middle, or top, maintains a lower amount of scatter. Figure 7 shows the fractography of the samples from the top and bottom of the build after testing at −20 °C in the Z direction. The fracture surfaces exhibit a mixture of cleavage and ductile regions. The regions of cleavage fracture are marked by flat surfaces (white arrow) and the ductile regions are marked by dimple features caused by micro void coalescence (black arrow). Micro cracks can also be observed in both samples. The fractography examination is consistent from sample to sample with no discernible difference between samples. However, the lack of differences is not surprising because the difference in impact energy from the top and bottom is small (a maximum range of 90 J) when compared to literature values (ranges larger than 200 J) [17].

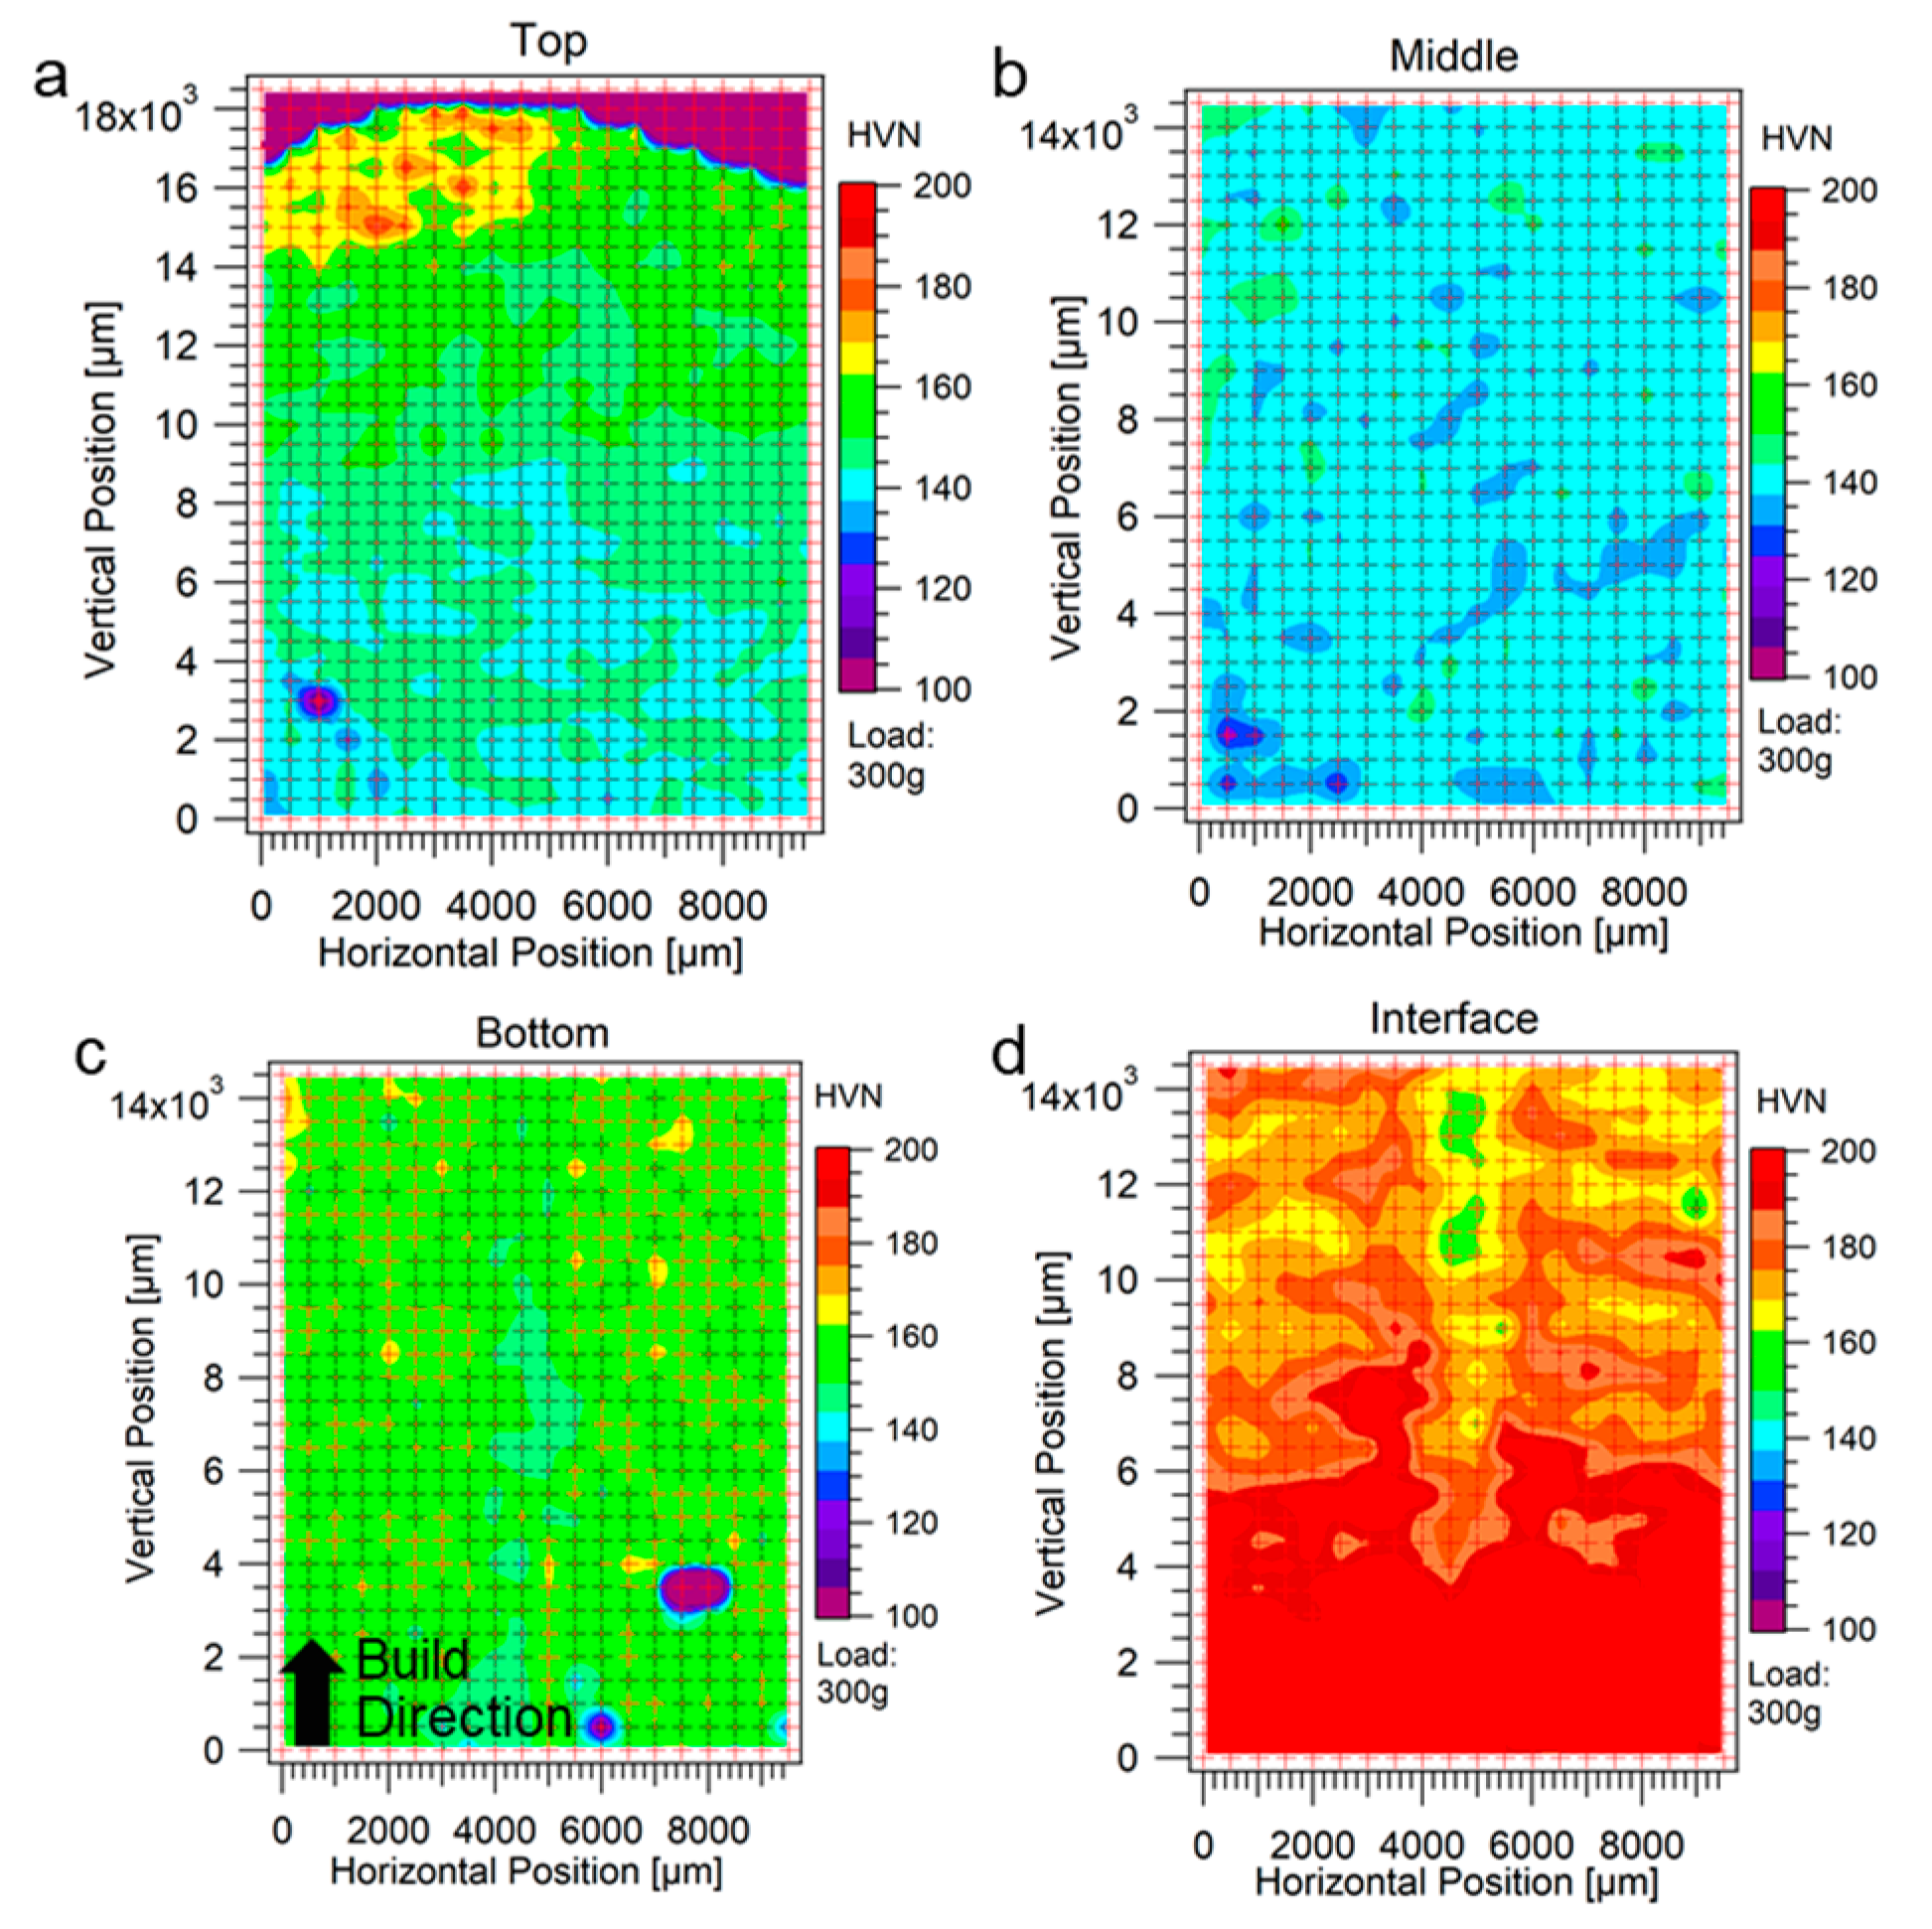
3.3. Hardness Mapping

Hardness mapping can be used to illustrate the homogeneity/heterogeneity of the microstructure, which in turn correlates to the ultimate tensile strength. Figure 8 shows the hardness maps from four locations along the build height, with approximately 700–760 indents at a spacing of 500 μm. Starting from the bottom of the build, the solid red region in Figure 8d contains the base material, AISI 1018 steel, (saturated red color because the hardness value is greater than 200 Vickers (HVN)) and the beginning of the build. (Note that Figure 8a–d all have the same color scale in order to provide consistency in all images; however this forces the base material region to saturate on the color scale.) The rest of Figure 8d shows that hardness values decrease along the vertical position. The two individual and parallel weld beads can be observed with a line of softer regions between the beads. Figure 8c shows the bottom or a build height of 25 mm to 100 mm from the interface. Here, there is high homogeneity of the hardness, except for two discontinuities (purple), with an average hardness of approximately 150 HVN. The map labelled “Middle” in Figure 8b represents the majority of the build and also represents the region of quasi-steady state heat flow. There is hardness homogeneity in this region, but the average hardness drops from 150 HVN to approximately 140 HVN. The “Top” region in Figure 8a shows the last few layers of the build. At the bottom of Figure 8a, the 140 HVN region, which is consistent with the majority of the build, can be observed as it transitions to approximately 175 HVN near the last layers. There is also the presence of discontinuities marked by the exceptionally low hardness points in these last layers. This change in hardness from the interface region to the top of the build can be rationalized with the characterization of the microstructure.

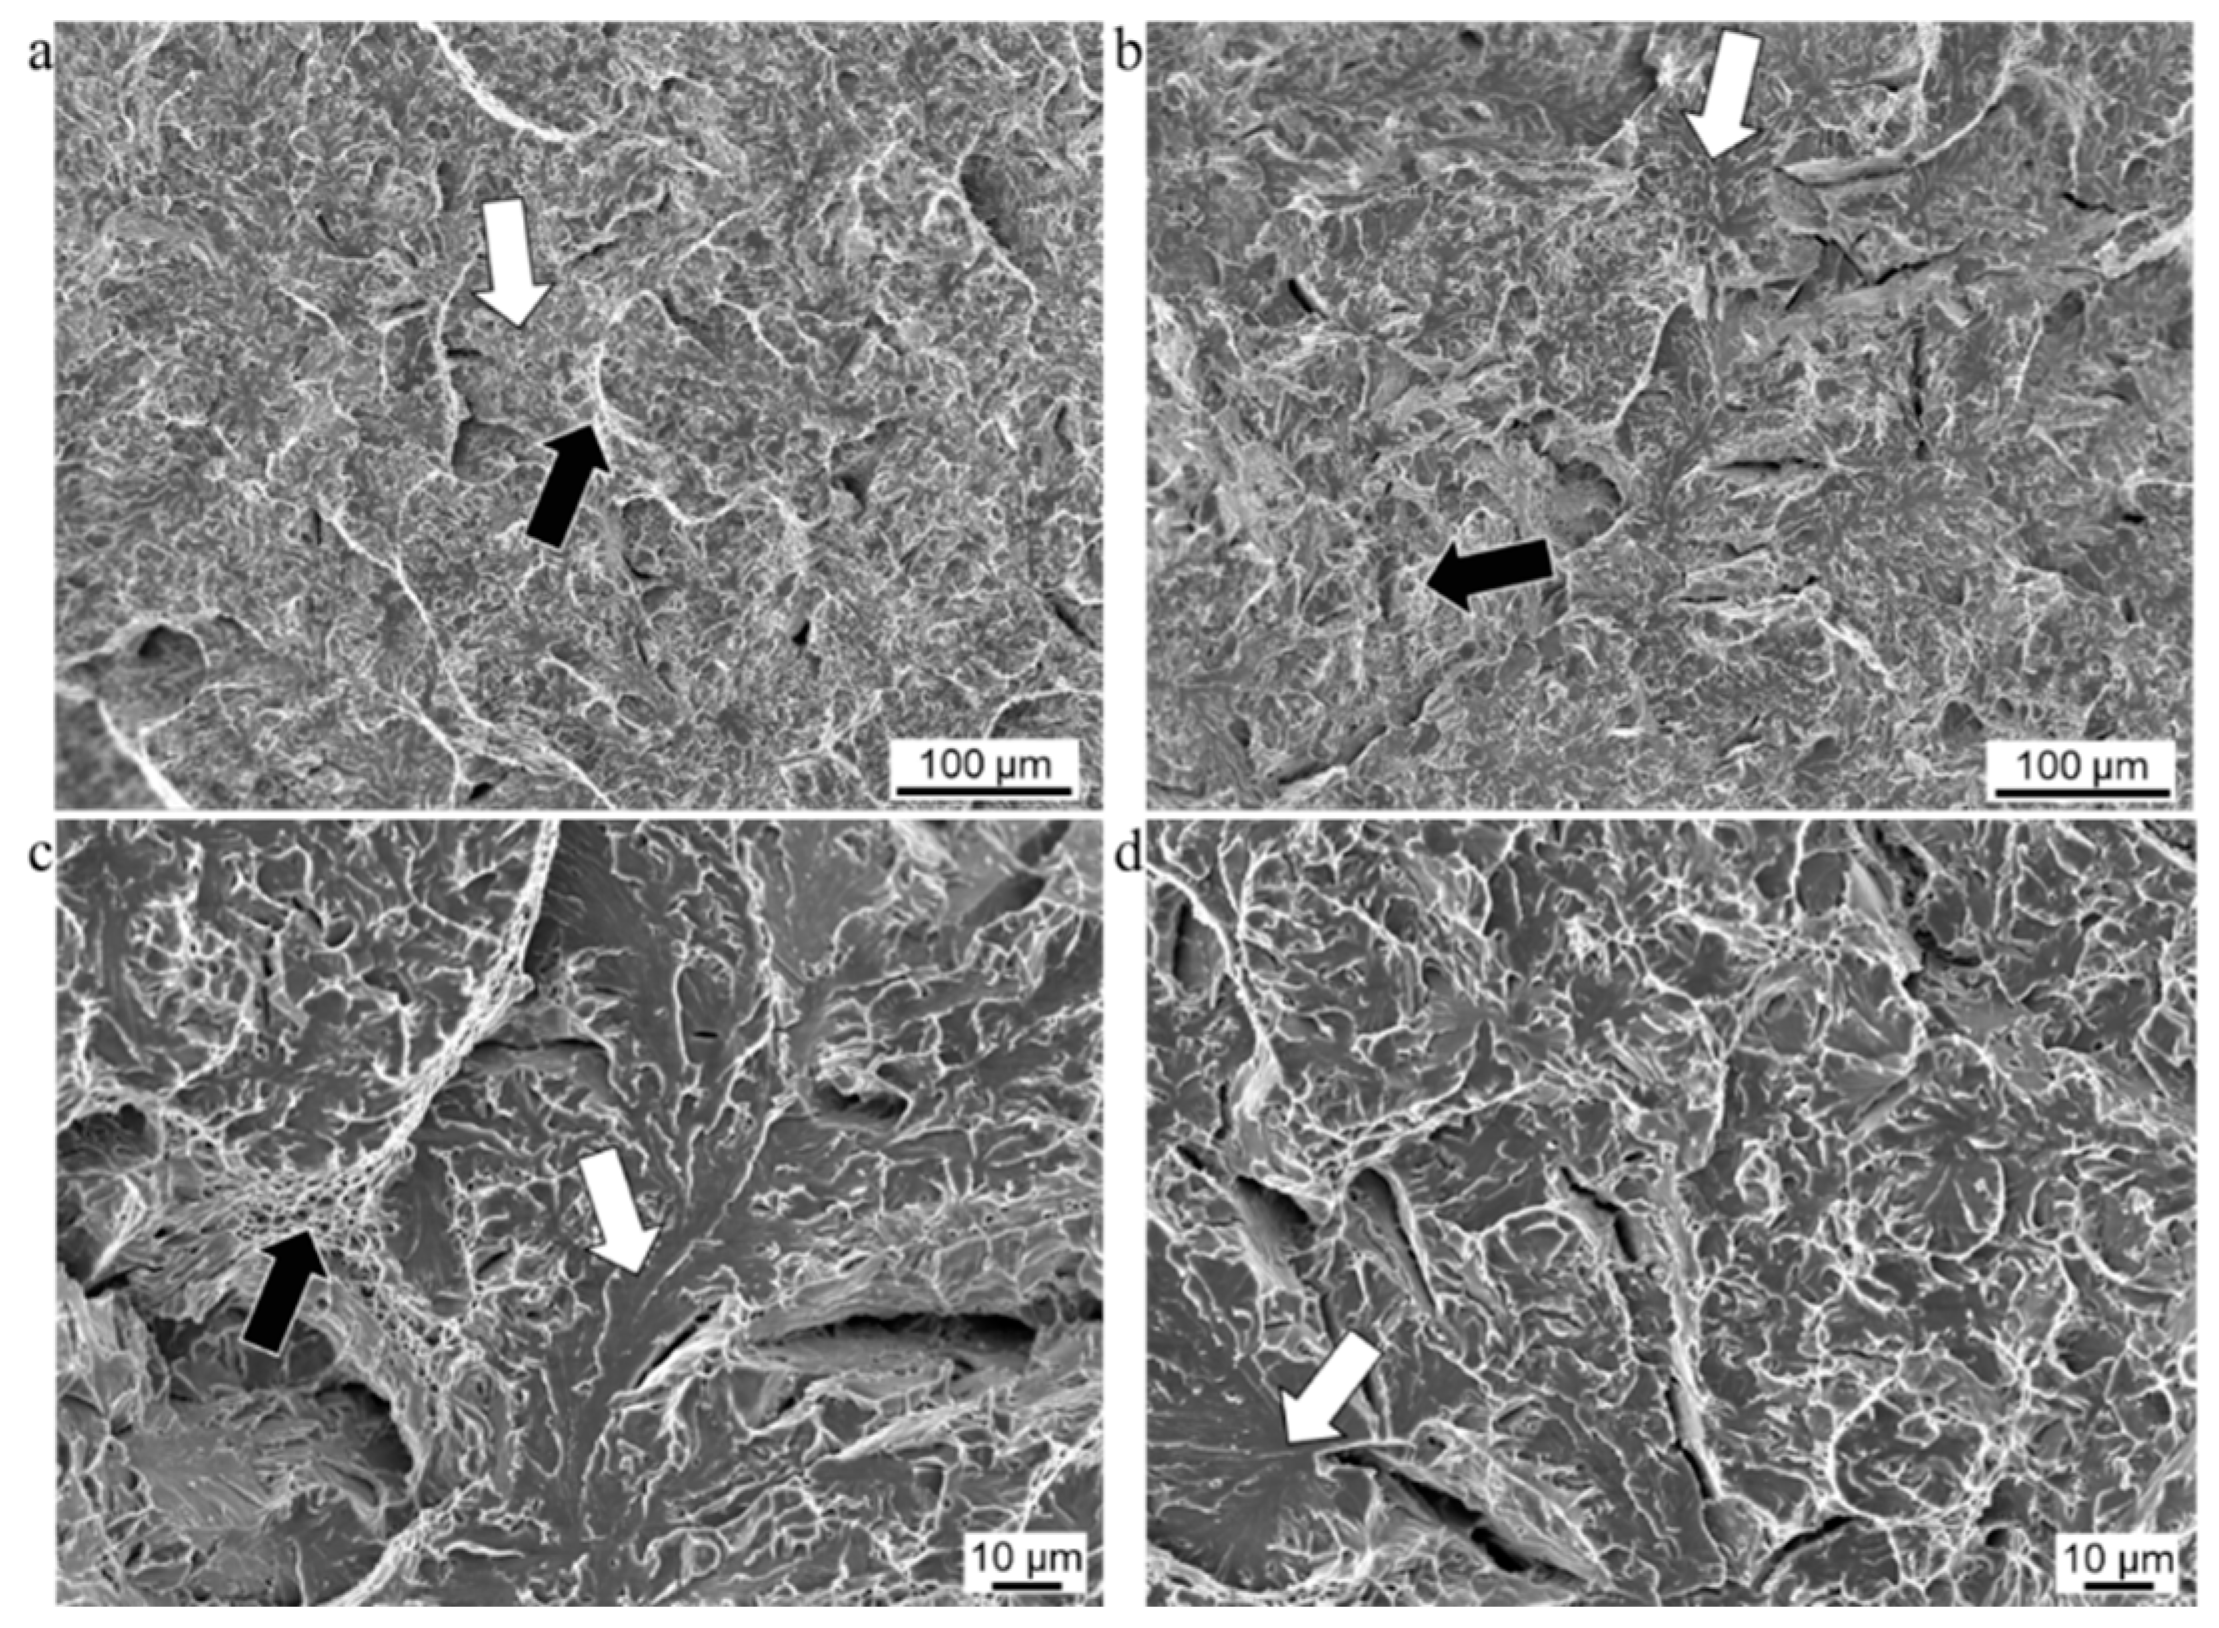
3.4. Microstructure Characterization

Figure 9 shows the microstructure at four locations in the build height and Figure 10 shows high magnification images of the same regions. Starting from Figure 9d, or the bottom of the build, the fusion line between one of the weld beads and the substrate can be observed. After the fusion line, a traditional columnar microstructure (denoted by the direction/morphology of the grain boundary allotriomorphic ferrite), consisting of a mixture of acicular ferrite, bainite, and allotriomorphic ferrite, is present. The average width of the columnar structure of grain boundary allotriomorphic ferrite, representing the prior austinite grain boundaries, is approximately 50 μm. The dark regions of Figure 9d are acicular ferrite and bainite, and the white regions are allotriomorphic ferrite that was transformed along the prior austenite grain boundaries. The region of the build that is in the region of 25 mm to 100 mm from the interface region is represented in Figure 9c. Here, alternating patterns of coarse- and fine-grained austenite heat affected zones (HAZs) are observed. The coarse grain HAZ in this region contains coarse allotriomorphic ferrite and small amounts of acicular ferrite and bainite [32]. The fine grain HAZ contains mostly refined polygonal ferrite, with some pearlite on triple points of grains. The pearlite can be seen in Figure 10b,c as the larger black features. The ferrite grain size in this region is approximately 10 μm to 15 μm. Most of the build fabricated under the quasi-steady state heat flow conditions is shown by Figure 9b and Figure 10b. The major phase represented here is polygonal ferrite a small volume fraction of pearlite. This region has a more homogenous microstructure than the bottom of the build, which is noted by the absence of the alternating coarse- and fine-grained HAZs. This is due to a high interpass temperature (approximately 400 °C) and lower subsequent interpass cooling rates (estimated to be between 1 °C/s and 5 °C/s from thermal imaging and past experiments [24]), resulting in a more uniform grain structure. The average ferrite grain size from the middle of the build is approximately 15 μm to 20 μm. The last layers of the build are shown in Figure 9a. Here, a homogeneous region of 20 μm polygonal ferrite transitions to a mixed microstructure in the last layer deposited. The last layer consists of the traditional mixture of acicular ferrite, bainite, and allotriomorphic ferrite. This mixture is similar to the first few layers of the build. However, the microstructure is less refined than the interface region seen in Figure 10.

4. Discussion

Overall, the mechanical properties of the MBAAM deposited wall are similar to the weld metal described in the literature. There is low scatter in the yield and tensile strength data, although a few stress-strain curves show abnormal behavior with reference to total elongation. Interestingly, the scatter in the impact toughness correlates to specific locations in the build height. The mechanical properties are important, but it is necessary to understand these properties in relation to the microstructure, in order to optimize the quality of MBAAM’s printed parts.

4.1. Correlation of Tensile Properties to the Microstructure

The tensile properties of the build manufactured by MBAAM shows fairly uniform and isotropic properties with respect to build height. The isotropy implies that the microstructure should also be fairly homogeneous in these tensile samples. The homogeneity is found to indeed be the case for most of the build. The microstructure shown in Figure 9b,c represents the majority of the build volume, not including the interface region and the last deposition layers. Otherwise, the microstructure is consistent. The main microstructural constituent is polygonal ferrite with some pearlite (5% to 7%). This suggests complete reheating of the deposits by the subsequent passes and may also indicate that there is annealing of the reheated regions. The difference in the thermal profile of the MBAAM builds from traditional welding is most likely the reason for differences in the MBAAM results. The fraction of as-welded and reheated regions in traditional butt welds should be significantly different than MBAAM. This difference can be observed from the as-deposited region in the top passes, as the region has not gone through reheating cycles. The microstructural homogeneity observed throughout the build provides the uniform tensile properties. However, there are some outliers in the tensile curves. There is a single curve from the perpendicular and 45° orientations with a higher yield stress and lower ductility. These tensile bars were intentionally cut in such a way that the gauge section contained the interface region between the base plate to regions that were built in the quasi-steady state conditions. From the parallel build orientation, there are two sets of samples, 1 and 2, which were cut from this same interface region. The higher yield stress and lower ductility from this sample can be rationalized by the presence of the mixed microstructure shown in Figure 9d and Figure 10d. The literature has shown that a mixture of acicular ferrite and bainite can raise the yield stress and decrease ductility of a weldment by the Hall Petch relationship [27,33,34,35]. The reason for the mixed microstructure in this region is mostly likely due to carbon uptake from the base metal from the AISI 1018 base plate. Furthermore, other factors, such as differences in thermal cycles and localized changes in heat input at this location, may also lead to the formation of the mixed microstructure. In traditional GMA welding, under weaving conditions, mixed microstructures are often observed close to the interface locations [36]. In most of the build, the lower yield strength can be rationalized by the evolution of the microstructure, which is in turn relates to the heat transfer characteristics of the wall. The build-substrate interface region has a higher thermal mass, due to the presence of a substrate, and the initial passes occur on a room temperature substrate. Here, the post-pass cooling rates are more typical of traditional butt welds (>10 °C/s). The mixed microstructure from the base plate interface region, transitions to polygonal ferrite at larger heights because of the repeated thermal cycles that occur during the build [18]. Due to the thermal characteristics of the build leading to slow cooling rates, the grain size of the polygonal ferrite is larger than the fine-grained acicular ferrite observed in traditional weldments [18,20,21]. Figure 11 shows the Continuous Cooling Transformation (CCT) diagram for the ER70s-6 nominal composition with a 0.1 wt% °C and a starting austenite grain size of 50 μm. The CCT diagram is useful for predicting or rationalizing the existing microstructure. The cooling rates in most of the build may be close to 1 °C/sec. The cooling rate is estimated using previous analytical calculations based on wall thickness [24]. Obtaining accurate thermal profiles of welds should be addressed in future efforts. The cooling rate by thermal imaging is challenging due to saturation of the camera as the arc passes in front of the camera, along with emissivity transients and others. The diagram shows that mainly ferrite and pearlite should be the dominant phases. As Tweed and Knott have shown, with repeated thermal cycles and a HAZ peak temperature of 900 °C, the microstructure should be ferrite and pearlite [18]. Within the wall, with continued building, the 900 °C isotherm will move up the wall, slow the cooling rate, and produce the observed polygonal ferrite and pearlite microstructure. The larger grain size of polygonal ferrite is expected to reduce the yield strength; this hypothesis is confirmed by the tensile curves of the middle section. The total elongation can also be rationalized with microstructural features. As mentioned above, the mixed microstructure produces a higher yield strength but lower ductility. Although the polygonal ferrite produces a lower yield strength, the ductility increases as expected. The yield strength, UTS, and total elongation are consistent between samples and different orientations. This consistency shows the isotropic nature, with respect to build height and the consistent properties of the MBAAM built walls.

4.2. Correlation of Charpy Impact Toughness to the Microstructure

The Charpy impact toughness tests did show some scatter. At each testing temperature there was a range of impact energies, with the −20 °C test temperature having the largest scatter [37]. As discussed in Section 3.2, the scatter in the data tends to show lower toughness with increases in build height. The microstructure can also be used here to rationalize the impact test results. At the bottom of the build there is a quick transition from a mixed microstructure of bainite/acicular ferrite and from allotriomorphic ferrite to a fine grain polygonal ferrite region. This transition is represented by the samples from Y1 and Z1. These microstructural features are shown to improve the toughness in C-Mn steel weldments [17,20,27,33,38]. Therefore, it should be expected that these samples maintain a higher toughness. Furthermore, by increasing build height, the toughness decreases. The polygonal ferrite grain size increases with build height, and, therefore, the toughness should decrease as illustrated in Figure 6. Although it should be noted that even though the −20 °C test results highlight this trend, all the other testing temperature results were closer with regards to scatter (less than 80 J separation). Therefore, it should be concluded that the −20 °C data scatter was due to sampling. Next, comparing the amount of scatter observed to literature values, the MBAAM built wall had a lower degree of scatter compared to a range of over 250 J [17,22], even though the −20 °C test temperature resulted in the largest scatter. This scatter is expected because traditional multipass weldments contain several different HAZ’s including coarse grain, fine grain, inter-critically reheated coarse and fine grain HAZ. Since the builds are thin walls the thermal cycles continually reheat the same material in a vertical progression as the wall is built, i.e., each location in the middle of the build height generally receives the same thermal cycles that can make microstructural changes. This repeated cyclical behavior produces a more homogeneous microstructure of polygonal ferrite, leading to a relatively low scatter in toughness compared to the literature [17,22]. A previous study by Sridharan et.al on C-Mn steel fabricated using GTAW based additive manufacturing processes showed a strong dependence of build orientation on scatter [24]. Significant scatter in the toughness was found to be due to the presence MA constituents in certain build geometries (thick walls). However, the previous study has shown that for thin walls, the cooling rate is adequate to suppress the formation of MA constituents [24]. Therefore, the nature of the thermal cycles should eliminate the formation of local brittle zones of martensite/austenite (MA) constituents, which lead to low toughness and high scatter, observed in multipass weldments [39,40]. The microstructural characterization did not show the presence of MA constituents. Reheating to the inter-critical phase field caused the nucleation of small austenite regions on grain boundaries and high carbon rich regions, such as pearlite. Upon rapid cooling, these austenite regions transformed into MA constituents, but the slow cooling rates observed here do not allow the MA to form instead ferrite and pearlite [41].
Svensson and Gretoft, investigated the microstructure and toughness of C-Mn weldments [20]. The resultant values of toughness of the MBAAM build compare well with the impact toughness found in the literature for comparable chemical compositions, even though the microstructure does not consist of the desired acicular ferrite typically observed in weldments [18,32,33].

5. Summary

Large scale additive manufacturing is an emerging avenue for low-volume production of large-scale metallic components. In this research, two thin walls (12 mm thick) of mild steel were fabricated using the MBAAM process, applied by a gas metal arc welding robot using an ER70S-6 filler wire. Real time feedback correction was used to maintain build quality. This compensation-based approach provided a high-quality uniform build. Tensile tests on bars machined from the build revealed some differences in yield point (an average of 375 MPa with peaks at 420 MPa) and some scatter in total elongation (25% to 42%). The interface region between the base plate and vertical wall contained a mixed microstructure of allotriomorphic ferrite, with a mixture of acicular ferrite and pearlite in the center of prior austenite grains. Most of the build consisted of polygonal ferrite and pearlite. This microstructural evolution can be described by the local thermal history of a thin wall build. There was some scatter in tensile elongation due to discontinuities in the deposit and small microstructural heterogeneities. Microhardness testing showed the heterogenous nature of the interface region between the base plate and the vertical wall, but importantly, most of the build had a uniform hardness. The bottom of the build was comparatively hard, whereas the middle was softer. However, discontinuities—local soft spots that can be attributable to traditional deposition defects—were observed. While the mechanical property data scatter correlated with build height, the local scatter remained low. The scatter in impact toughness and resultant values compare well with literature. The printed walls represent the basic building blocks of structural parts being manufactured with the MBAAM system and thus their properties are expected to hold for complex geometries. Overall, the MBAAM process created a deposit with stable and isotropic mechanical properties, combined with a precisely controlled process with geometrical stability, obtained through a smart real-time feedback sensing closed loop control system.

Author Contributions

Conceptualization, B.S. and N.S.; Creation of Experimental Builds, C.M.; Methodology, Data Collection, Analysis, and Resources B.S.; Writing—Original Draft Preparation, B.S.; Writing—Review & Editing, All Authors; Visualization, B.S.; Supervision, A.N.; Project Administration, M.W.N.; Funding Acquisition, A.N., and M.W.N. This manuscript has been authored [or, co-authored] by UT-Battelle, LLC, under contract DE-AC05-00OR22725 with the US Department of Energy (DOE). The US government retains and the publisher, by accepting the article for publication, acknowledges that the US government retains a nonexclusive, paid-up, irrevocable, worldwide license to publish or reproduce the published form of this manuscript, or allow others to do so, for US government purposes. DOE will provide public access to these results of federally sponsored research in accordance with the DOE Public Access Plan (http://energy.gov/downloads/doe-public-access-plan).

Funding

This research was funded by the US Department of Energy (DOE) Advanced Manufacturing Office (AMO).

Acknowledgments

The Authors would like to thank Alex Plotkowski and Tom Muth at the Oak Ridge National Laboratory for their comments on this manuscript. The authors would also like to acknowledge the support of collaborating partners Lincoln Electric and Wolf Robotics on this project. This research is sponsored by the US Department of Energy, Office of Energy Efficiency and Renewable Energy, Advanced Manufacturing Office, under Contract DE-AC05-00OR22725 with UT-Battelle, LLC.

Conflicts of Interest

The authors declare no conflict of interest.

References

  1. Gu, D.; Meiners, W.; Wissenbach, K.; Poprawe, R. Laser additive manufacturing of metallic components: Materials, processes and mechanisms. Int. Mater. Rev. 2012, 57, 133–164. [Google Scholar] [CrossRef]
  2. Ding, D.; Pan, Z.; Cuiuri, D.; Li, H. Wire-feed additive manufacturing of metal components: Technologies, developments and future interests. Int. J. Adv. Manuf. Technol. 2015, 81, 465–481. [Google Scholar] [CrossRef]
  3. Lewandowski, J.J.; Seifi, M. Metal additive manufacturing: A review of mechanical properties. Annu. Rev. Mater. Res. 2016, 46, 151–186. [Google Scholar] [CrossRef]
  4. Murr, L.E.; Gaytan, S.M.; Ramirez, D.A.; Martinez, E.; Hernandez, J.; Amato, K.N.; Shindo, P.W.; Medina, F.R.; Wicker, R.B. Metal fabrication by additive manufacturing using laser and electron beam melting technologies. J. Mater. Sci. Technol. 2012, 28, 1–14. [Google Scholar] [CrossRef]
  5. Bhavar, V.; Kattire, P.; Patil, V.; Khot, S.; Gujar, K.; Singh, R. A review on powder bed fusion technology of metal additive manufacturing. In Proceedings of the 4th International Conference and Exhibition on Additive Manufacturing Technologies-AM-2014, Bangalore, India, 1–2 September 2014; pp. 1–2. [Google Scholar]
  6. Baufeld, B.; Van der Biest, O.; Gault, R. Additive manufacturing of Ti–6Al–4V components by shaped metal deposition: Microstructure and mechanical properties. Mater. Des. 2010, 31, S106–S111. [Google Scholar] [CrossRef]
  7. Dehoff, R.; Kirka, M.; Sames, W.; Bilheux, H.; Tremsin, A.; Lowe, L.; Babu, S. Site specific control of crystallographic grain orientation through electron beam additive manufacturing. Mater. Sci. Technol. 2015, 31, 931–938. [Google Scholar] [CrossRef]
  8. Kirka, M.; Unocic, K.; Raghavan, N.; Medina, F.; Dehoff, R.; Babu, S. Microstructure development in electron beam-melted Inconel 718 and associated tensile properties. JOM 2016, 68, 1012–1020. [Google Scholar] [CrossRef]
  9. Frazier, W.E. Metal additive manufacturing: A review. J. Mater. Eng. Perform. 2014, 23, 1917–1928. [Google Scholar] [CrossRef]
  10. Mudge, R.P.; Wald, N.R. Laser engineered net shaping advances additive manufacturing and repair. Weld. J. 2007, 86, 44. [Google Scholar]
  11. Sahasrabudhe, H.; Harrison, R.; Carpenter, C.; Bandyopadhyay, A. Stainless steel to titanium bimetallic structure using LENS™. Addit. Manuf. 2015, 5, 1–8. [Google Scholar] [CrossRef]
  12. Babu, S.S.; Love, L.; Dehoff, R.; Peter, W.; Watkins, T.R.; Pannala, S. Additive manufacturing of materials: Opportunities and challenges. MRS Bull. 2015, 40, 1154–1161. [Google Scholar] [CrossRef] [Green Version]
  13. Ding, J.; Colegrove, P.; Mehnen, J.; Ganguly, S.; Almeida, P.S.; Wang, F.; Williams, S. Thermo-mechanical analysis of wire and arc additive layer manufacturing process on large multi-layer parts. Comput. Mater. Sci. 2011, 50, 3315–3322. [Google Scholar] [CrossRef]
  14. Ding, D.; Pan, Z.; Cuiuri, D.; Li, H. A multi-bead overlapping model for robotic wire and arc additive manufacturing (WAAM). Robot. Comput.-Integr. Manuf. 2015, 31, 101–110. [Google Scholar] [CrossRef] [Green Version]
  15. Williams, S.W.; Martina, F.; Addison, A.C.; Ding, J.; Pardal, G.; Colegrove, P. Wire+ arc additive manufacturing. Mater. Sci. Technol. 2016, 32, 641–647. [Google Scholar] [CrossRef]
  16. Nycz, A.; Adediran, A.; Noakes, M.W.; Love, L.J. Large scale metal additive techniques review. In Proceedings of the 27th Annual International Solid Freeform Fabrication Symposium 2016—An Additive Manufacturing Conference, Austin, TX, USA, 8–10 August 2016. [Google Scholar]
  17. Quintana, M.A.; Babu, S.S.; Major, J.; Dallam, C.; James, M. Weld Metal Toughness: Sources of Variation. In Proceedings of the 2010 8th International Pipeline Conference, Calgary, AB, Canada, 27 September–1 October 2010; pp. 599–608. [Google Scholar] [CrossRef]
  18. Tweed, J.H.; Knott, J.F. Effect of reheating on microstructure and toughness of C–Mn weld metal. Met. Sci. 1983, 17, 45–54. [Google Scholar] [CrossRef]
  19. Davis, C.L.; King, J.E. Cleavage initiation in the intercritically reheated coarse-grained heat-affected zone: Part I. Fractographic evidence. Metall. Mater. Trans. A 1994, 25, 563–573. [Google Scholar] [CrossRef]
  20. Svensson, L.; Gretoft, B. Microstructure and impact toughness of C–Mn weld metals. Weld. J. 1990, 69, 454. [Google Scholar]
  21. Choi, C.; Hill, D. A study of microstructural progression in as-deposited weld metal. Weld. J. 1978, 57, 232. [Google Scholar]
  22. Song, H.Y.; Evans, G.M.; Babu, S.S. Effect of microstructural heterogeneities on scatter of toughness in multi-pass weld metal of C–Mn steels. Sci. Technol. Weld. Join. 2014, 19, 376–384. [Google Scholar] [CrossRef]
  23. Murugananth, M.; Babu, S.S.; David, S.A. Optimization of shielded metal arc weld metal composition for Charpy toughness. Weld. J. 2004, 83, 267–276. [Google Scholar]
  24. Sridharan, N.; Noakes, M.W.; Nycz, A.; Love, L.J.; Dehoff, R.R.; Babu, S.S. On the toughness scatter in low alloy C-Mn steel samples fabricated using wire arc additive manufacturing. Mater. Sci. Eng. A 2018, 713, 18–27. [Google Scholar] [CrossRef]
  25. Grong, O.; Matlock, D.K. Microstructural development in mild and low-alloy steel weld metals. Int. Met. Rev. 1986, 31, 27–48. [Google Scholar] [CrossRef]
  26. Babu, S.S. In pursuit of optimum welding system design for steels. Sci. Technol. Weld. Join. 2011, 16, 306–312. [Google Scholar] [CrossRef]
  27. Babu, S.S.; Bhadeshia, H.K.D.H. Transition from bainite to acicular ferrite in reheated Fe–Cr–C weld deposits. Mater. Sci. Technol. 1990, 6, 1005–1020. [Google Scholar] [CrossRef]
  28. Nycz, A.; Noakes, M.W.; Richardson, B.; Messing, A.; Post, B.; Paul, J.; Flamm, J.; Love, L. Challenges in making complex metal large-scale parts for additive manufacturing: A case study based on the additive manufacturing excavator. In Proceedings of the 28th Annual International Solid Freeform Fabrication Symposium—An Additive Manufacturing Conference 2017, Austin, TX, USA, 7–9 August 2017. [Google Scholar]
  29. ASTM. E8/E8M-16a Standard Test Methods for Tension Testing of Metallic Materials; ASTM: West Conshohocken, PA, USA, 2016. [Google Scholar] [CrossRef]
  30. ASTM. E23-09: Standard Test Method for Notched Bar Impact Testing of Metallic Materials; ASTM: West Conshohocken, PA, USA, 2009. [Google Scholar]
  31. Specification for Carbon Steel Electrodes and Rods for Gas Shielded Arc Welding; AWS A5.18/A5.18M; American Welding Society: Miami, FL, USA, 2005.
  32. Bhadeshia, H.; Svensson, L.-E.; Gretoft, B. A model for the development of microstructure in low-alloy steel (Fe-Mn-Si-C) weld deposits. Acta Metall. Mater. 1985, 33, 1271–1283. [Google Scholar] [CrossRef]
  33. Babu, S.S. The mechanism of acicular ferrite in weld deposits. Curr. Opin. Solid State Mater. Sci. 2004, 8, 267–278. [Google Scholar] [CrossRef]
  34. Gourgues, A.F.; Flower, H.M.; Lindley, T.C. Electron backscattering diffraction study of acicular ferrite, bainite, and martensite steel microstructures. Mater. Sci. Technol. 2000, 16, 26–40. [Google Scholar] [CrossRef]
  35. Dieter, G.E.; Bacon, D.J. Mechanical Metallurgy; McGraw-Hill: New York, NY, USA, 1986; Volume 3. [Google Scholar]
  36. Siewert, T.; Trevisan, R.; Purtscher, P. The Effect of Electrode Weave Procedure on HY-80 GMA Welds. Weld. J. 1987, 66, 203. [Google Scholar]
  37. Sugden, A.; Bhadeshia, H. Microstructural entropy and the scatter in toughness. Recent Trends Weld. Sci. Technol. 1989, 745–748. Available online: https://www.phase-trans.msm.cam.ac.uk/2002/microstructural.entropy.pdf (accessed on 22 February 2019).
  38. Babu, S.S.; Bhadeshia, H.K.D.H. Mechanism of the Transition from Bainite to Acicular Ferrite. Mater. Trans. JIM 1991, 32, 679–688. [Google Scholar] [CrossRef] [Green Version]
  39. Kim, B.C.; Lee, S.; Kim, N.J.; Lee, D.Y. Microstructure and local brittle zone phenomena in high-strength low-alloy steel welds. Metall. Trans. A 1991, 22, 139–149. [Google Scholar] [CrossRef]
  40. Akselsen, O.; Grong, Ø.; Solberg, J. Structure–property relationships in intercritical heat affected zone of low-carbon microalloyed steels. Mater. Sci. Technol. 1987, 3, 649–655. [Google Scholar] [CrossRef]
  41. Davis, C.L.; King, J.E. Effect of cooling rate on intercritically reheated microstructure and toughness in high strength low alloy steel. Mater. Sci. Technol. 1993, 9, 8–15. [Google Scholar] [CrossRef]
Figure 1. Compensation effect on bead/layer roughness.
Applsci 09 00787 g001
Figure 2. (a) Metal Big Area Additive Manufacturing (MBAAM) system with a printed excavator arm. (b) Build without the compensation-based approach. (c) Build with the compensation-based approach.
Applsci 09 00787 g002
Figure 3. One of the MBAAM manufactured test walls.
Applsci 09 00787 g003
Figure 4. Pictorial representation of the (a) metallographic, tensile (572 mm tall by 470 mm long) and (b) Charpy v-notch specimens (305 mm tall by 362 mm long).
Applsci 09 00787 g004
Figure 5. Stress versus strain curves (a) perpendicular to build direction, (b) 45° to build direction, (c) parallel to build direction, and (d) graphical representation of yield and ultimate tensile stress and elongation averages with the standard deviation of results (the elongation average does not account for the red/orange curves from the interface).
Applsci 09 00787 g005
Figure 6. Charpy v-notch impact toughness curves. The figure shows a Ductile to Brittle Transition Temperature (DBTT) increase from −36 °C to −17 °C with build height.
Applsci 09 00787 g006
Figure 7. Fractography of samples fractured at −20 °C from the top of the build (a) and the bottom of the build (b). High magnification images (c) and (d) from the top and bottom of the build respectively. White arrows indicate regions of cleavage, and the black arrows indicate regions of ductile failure.
Applsci 09 00787 g007
Figure 8. Hardness maps from different locations in the build height. (a) The last layer, top. (b) The middle of the build. (c)Bottom of the build. (d) interface between base plate and beginning of the build. Images show the Z–Y plane (thickness) of the build.
Applsci 09 00787 g008
Figure 9. Microstructure from different locations in the build height. (a) The last layer, top. (b) The middle of the build. (c) Bottom of the build. (d) Interface between base plate and beginning of the build.
Applsci 09 00787 g009
Figure 10. High magnification micrographs from different locations in the build height. (a) The last layer, top. (b) The middle of the build. (c) Bottom of the build. (d) Interface region between base plate and beginning of the build.
Applsci 09 00787 g010
Figure 11. Continuous Cooling Transformation (CCT) diagrams for 0.1 wt% C. The CCT diagram is used to understand the evolution of the microstructure on cooling from face centered cubic (FCC) austenite. Drawn using the thermodynamic software JMatPro®.
Applsci 09 00787 g011

