Comparison of Diverse Dust Control Products in Wind-Induced Dust Emission from Unpaved Roads

Department of Geography and Environmental Development, Ben Gurion University, Beersheba 8410501, Israel
Appl. Sci. 2019, 9(23), 5204; https://doi.org/10.3390/app9235204
Submission received: 15 November 2019
/
Revised: 24 November 2019
/
Accepted: 27 November 2019
/
Published: 29 November 2019
(This article belongs to the Special Issue Soil Erosion: Dust Control and Sand Stabilization)
Abstract
:Surfaces of unpaved roads are subjected to dust PM10 (particulate matter < 10 µm) emission by wind process regardless of vehicles (wheels) transport. However, there is little quantitative information on wind-induced dust emission from unpaved roads and the efficiency of diverse dust control products. The study aimed to fill this clear applied scientific gap using wind-tunnel experiments under laboratory and field conditions. The wind-tunnel complies with aerodynamics requirements and is adjusted to dynamic similitude by appropriately scaling all variables that affect dust transport. The results of the control sample (no-treatment) clearly show that dust emission by wind from unpaved road could be a substantial contribution to mass transfer and air pollution, and thus should be considered. Diverse dust control products of synthetic and organic polymers (Lignin, Resin, Bitumen, PVA, Brine) were tested. In the first stage, the products were tested under controlled-laboratory conditions. The results enabled quantitative assessment of the product efficacy in wind erosion without the impact of vehicle transport. In the second stage, the products were tested in field experiment in an active quarry, in which the products were applied on plots along the road. The field experiment was conducted after transportation of the quarry-haul trucks in two time points: several days after the application, and several weeks after the application. The results show that in most of the plots the dust emission increases with the wind velocity. PM10 fluxes from the road surface in each plot were calculated to determine the effectiveness of the dust control products. Some products significantly reduced dust emission from quarry roads, especially when using the Hydrous magnesium chloride (Brine). Additional experiments revealed that such Brine can be applied with reduced amounts and still keeping on low emission.
1. Introduction
Dust emission has significant implications on the earth’s systems including atmosphere [1], marine ecosystems [2], and terrestrial ecosystems [3]. Moreover, dust emission is significant for air pollution and human health. The atmospheric PM pollution can increase high above the standard values of air quality [4,5]. During dust storms, average daily PM10 concentrations can be about 40 times higher than the guideline of WHO (World Health Organization) with PM10 concentration of >2000 µg m−3. The impact of dust-PM10 on public health is related to asthma in children [6], cardiovascular morbidity [7], and more. In recent years, there is an increasing interest in quantifying PM emission from dust sources due to anthropogenic activities from environmental quality and human health perspectives.
Anthropogenic activities in soils such as quarrying, mining, and off-road vehicles traveling, are major concern for dust emission by wind. The U.S. Environmental Protection Agency (EPA) published a Compilation of Air Pollutant Emission Factors (AP-42) with reference to dust emission in unpaved roads because of vehicle travels [8]. In unpaved roads, dust is released by direct uplift because of the contact between the wheels and the surface, and indirect uplift is caused by turbulence generated by the vehicle [9]. An experimental study showed a linear relationship between unpaved road dust PM10 emissions and vehicle speed by testing re-entrained aerosol kinetic emissions from roads [10]. The PM10 entrained into the atmosphere and transported over relevant distances should be calculated based on the fluxes of dust emissions [11]. A numerical model was formulated using dust emission parametrizations to present the atmospheric PM dispersion from unpaved roads [12].
Regardless of the dust emission by vehicle travels, unpaved roads are subjected to dust emission by wind process, and overall these could be a substantial contribution to mass transfer and air pollution. Dust emission by wind depends on the surface characteristics to determine the threshold of wind velocity that will initiate the transport of soil particles [13,14]. The fine-dust particles are usually held in soil aggregates and thereby are not available for direct lifting at low wind velocities. In this case the emission of the fine particles may be enabled by higher shear velocity or by saltation of sand particles and/or aggregates [15,16]. The soil aggregates can breakdown to release dust particles either by self-saltating or by the impact of other saltators [13,14]. Vehicles on unpaved roads alter the surface properties and may amplify dust emission by wind. Pulverization of the top layer by the tires facilitates the emission as it breaks soil aggregates [17]. The disintegration of the soil increases the amount of fine particles in the surface (dust-sized particles) that are subjected to direct lifting at lower wind velocities [14] with expected higher dust fluxes to the atmosphere.
Dust emission can be reduced by using dust control products. Such products are based mainly on synthetic or natural polymers, which applied by wetting the soil surfaces with the products. Note that this application refers to “dust control” in this study rather than “soil stabilization” that is typically associated with application of mixing (and packing) the soil layers with products to improve engineering properties. A wide range of dust control products have been tested for dust emission by vehicles traveling in unpaved roads [18,19]. There is lack of fundamental research examining the efficiency of diverse products in suppression of dust emission by wind. This study aimed to fill this gap by targeted wind tunnel experiments under laboratory and field conditions.
2. Materials and Methods
2.1. Laboratory Experiment
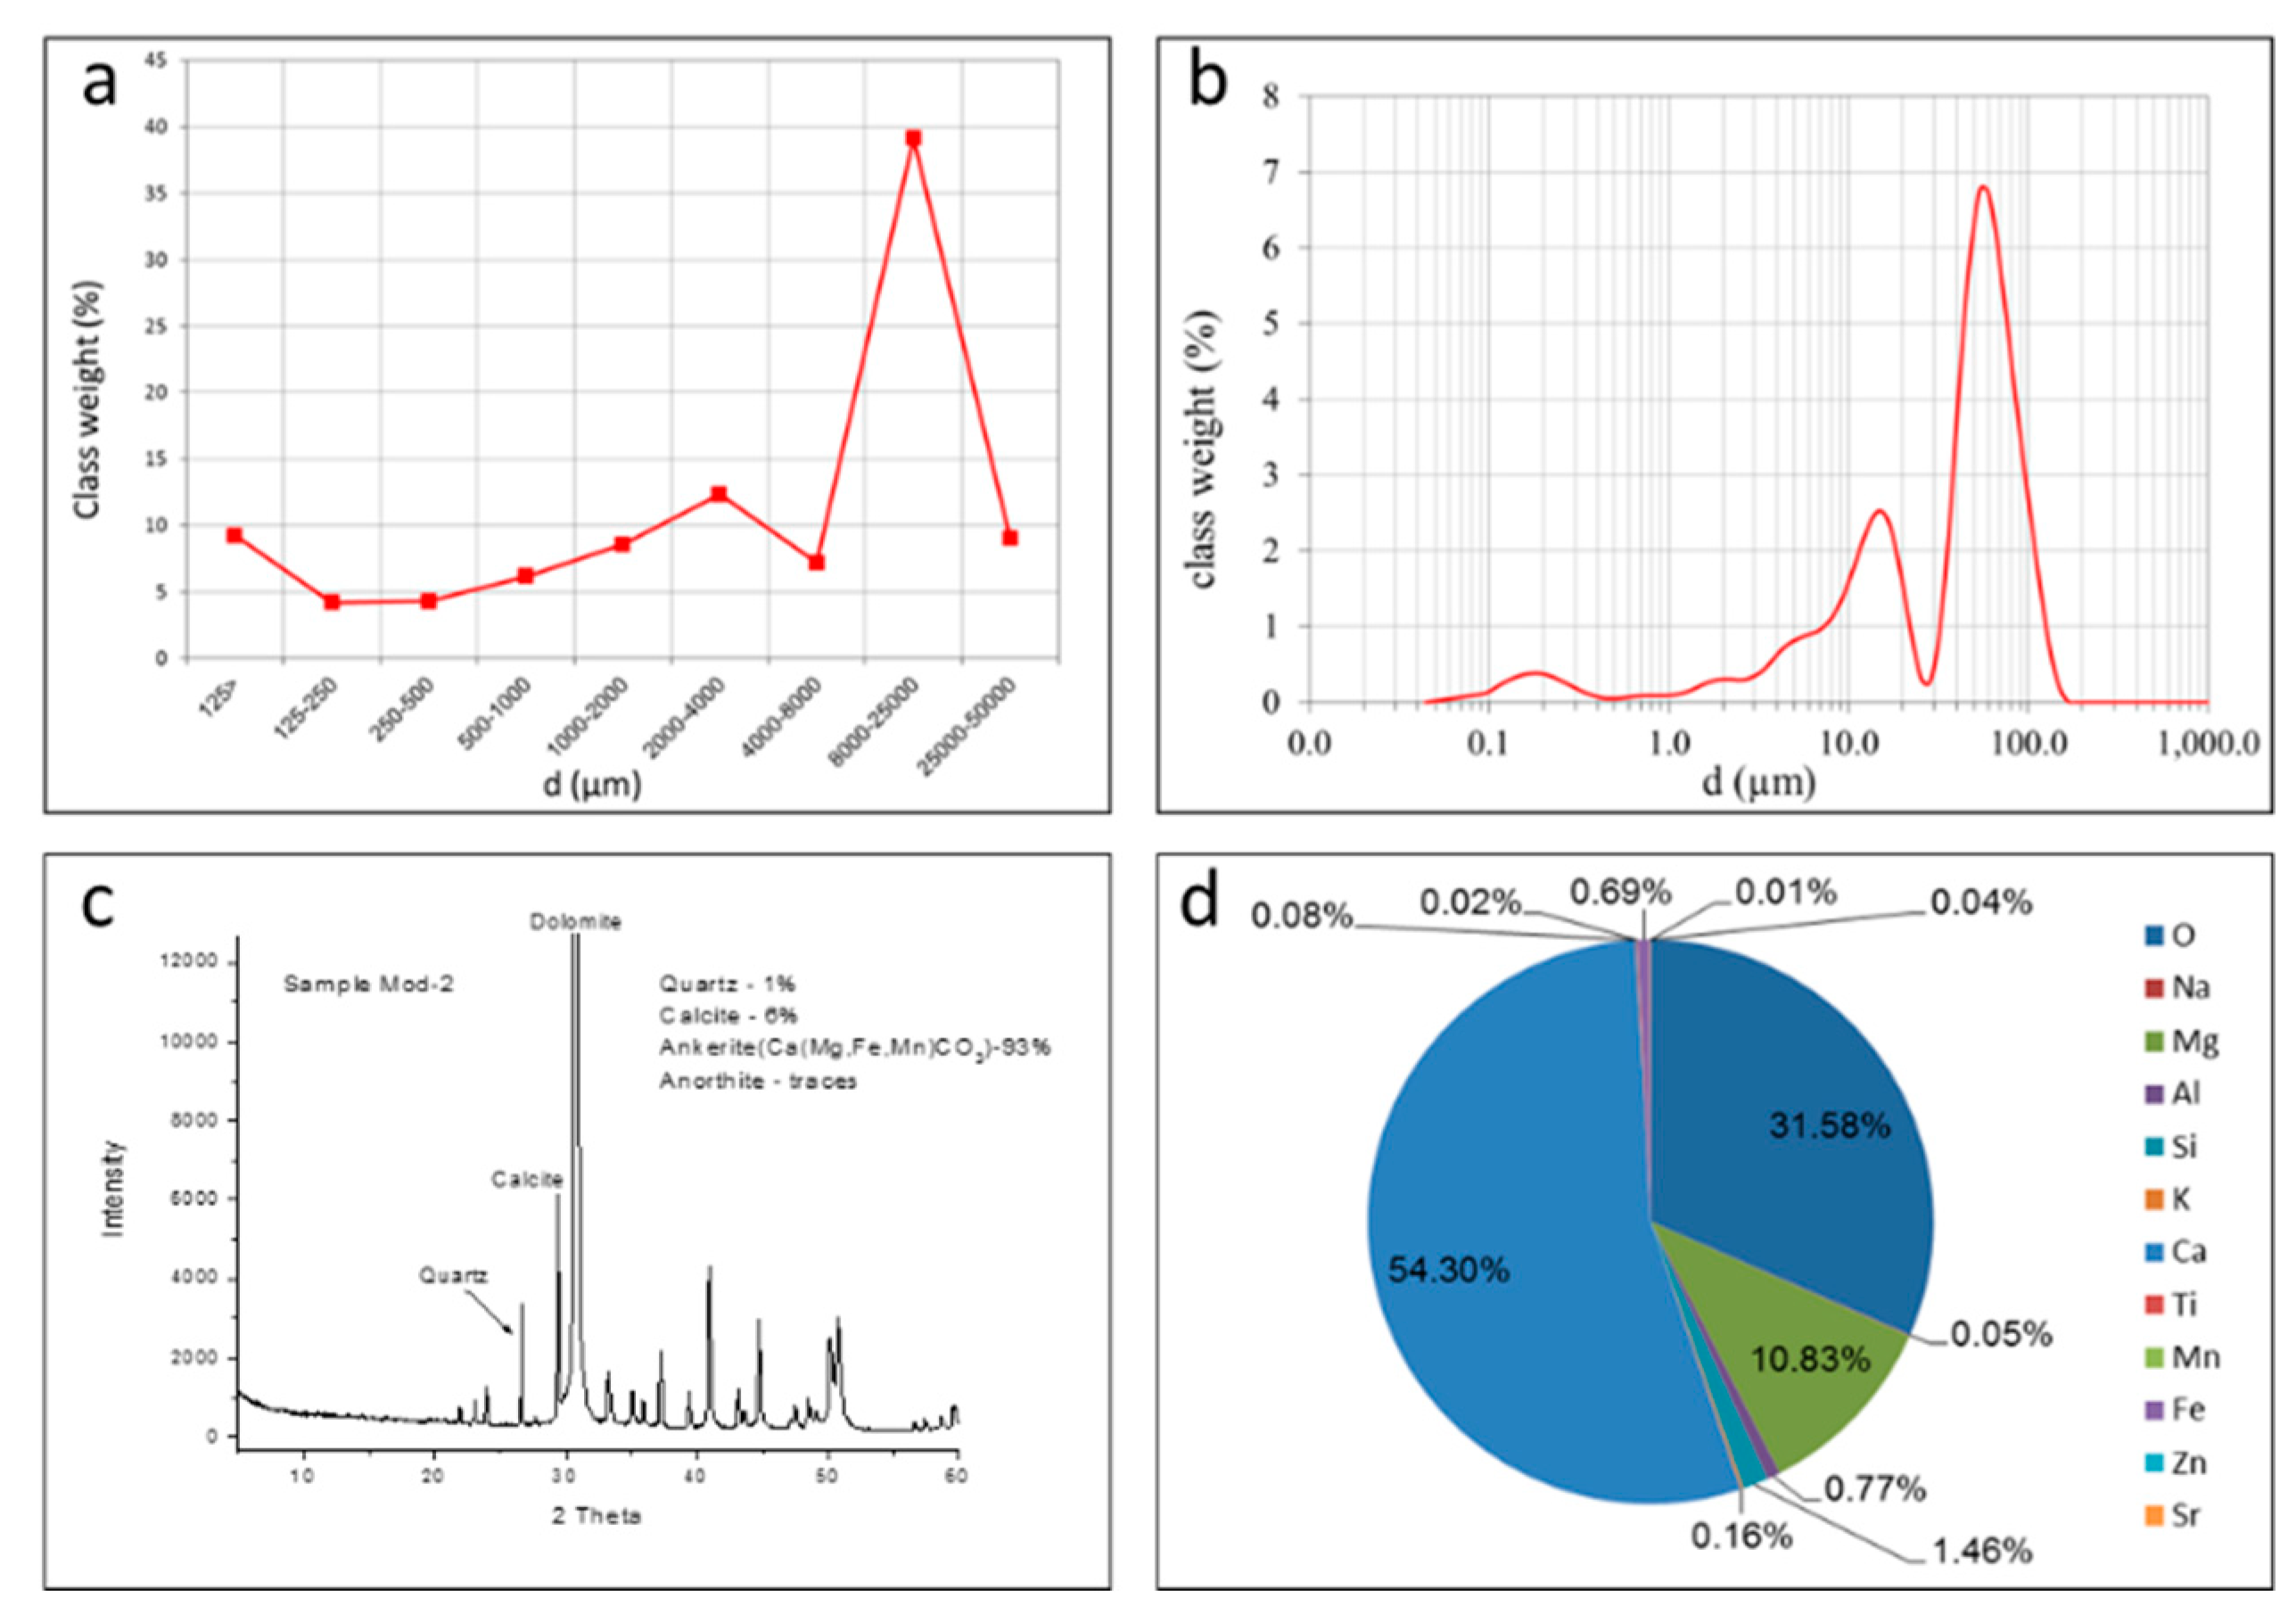
A soil from a typical calcareous quarry (Hartuv, Beit Shemesh, Israel), which produces calcareous materials for construction, was used for the experiment. This soil-material is a product of rock crushing and screening. It uses for bedding of the unpaved roads in the quarry. A soil sample was transported to the laboratory for experiment. The soil sample characterized by fine-earth material and rock fragments up to size of 50,000 µm in diameter (Figure 1a). The fine-earth material in the soil sample (after extraction of the rock fragments in the sample), which is potential of dust emission, was analyzed for particle size distribution (Figure 1b). It was done by the ANALYSETTE 22 MicroTec Plus (Fritsch, Idar-Oberstein, Germany) laser diffraction, which measures particles in the size range of 0.08–2000 μm [15,20]. Replicas (100 mg) were dispersed in Na-hexamvetaphosphate solution (0.5%) by sonication (38 kHz). The data was calculated using the Fraunhofer diffraction model with a size resolution of 1 μm using MasControl software. Mineralogical and elemental compositions show high content of Ca-based components (Figure 1c,d), which obtained by the X-ray power diffraction (XRPD) and X-ray fluorescence (XRF) methods, respectively [21].
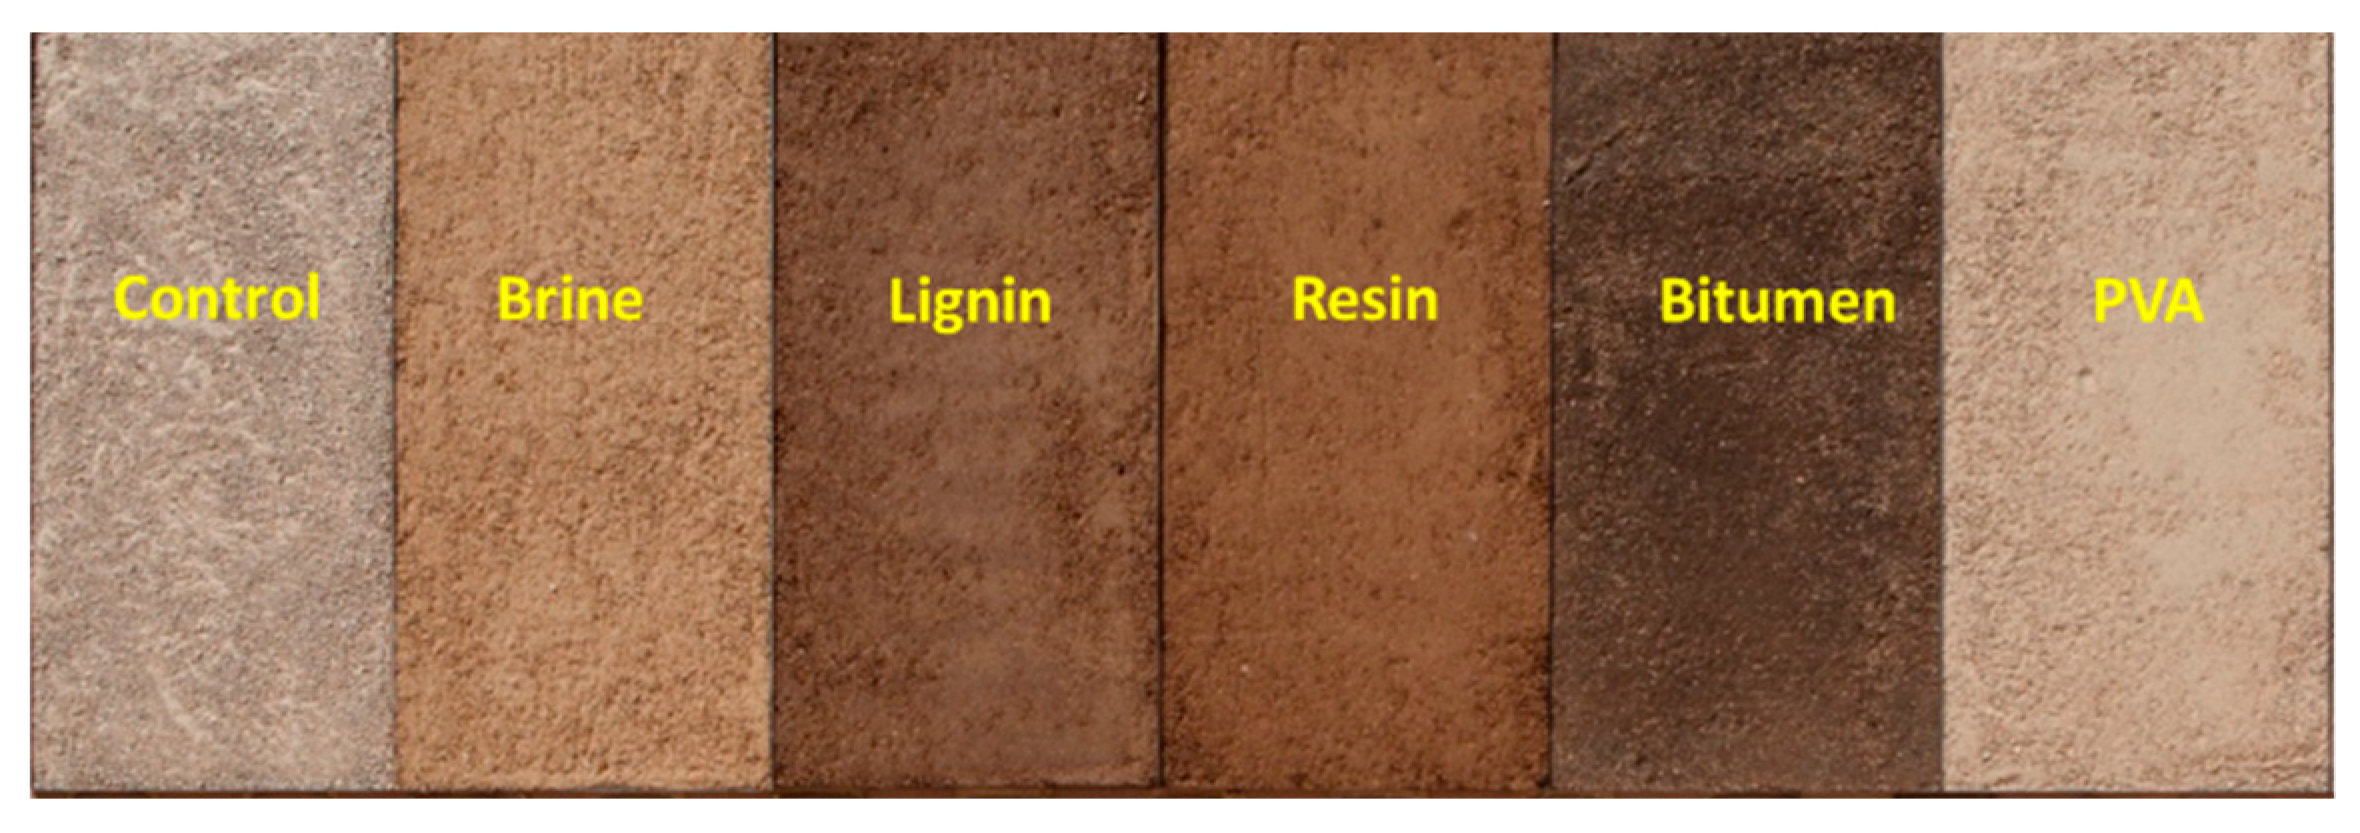
The soil that was brought to the lab from the quarry (Figure 1a) was sieved into size material size <8000 µm in diameter, including fine-earth materials (<2000 µm) and small rock fragments (2000–8000 µm). The soil was placed in specific trays that fit the wind tunnel dimensions (see next section). The area of each tray is 0.5 × 1.0 m with height of 0.02 m. Three trays (replicas) were prepared for each soil treatment/product (Figure 2). Table 1 presents the various products and their application on the soil used for the laboratory experiment. The composition of the solution of each substance and the concentration of the solution to be applied by spraying on the soil surface were provided by the suppliers of the products. Note that the brine was supplied as a solution already, in which the concentration applied on the soil (1.5 L m−2) is typical in dust control application of Brine. Following this process, the amount of the solution (water content) was vastly different between the soil samples/applications. However, the soil samples left outside for a drying process of several days before the experiment to avoid the impact of soil water content on wind erosion and dust emission.
The soils were tested in a wind tunnel for dust emission—overall 108 runs were performed by the wind tunnel (9 samples, 3 replicates, 4 wind velocities). These experiments were performed in the portable boundary-layer wind tunnel of the Aeolian Simulation Laboratory at BGU [3,22]. Boundary-layer wind tunnels enable simulations under standardized quasi-natural wind conditions and provide quantitative information on dust emission rates from the soils. The wind tunnel has a cross sectional area in the order of 0.5 × 0.5 m with open-floored working sections of up to 10 m length. Air push or air suction flow in the tunnel is generated by an axial fan up to maximum velocity of 18 m s−1. Instruments installed in the test section of the tunnel enable quantification of wind characteristics and dust (PM) concentrations.
The tunnel operated under four wind velocities, 4.0, 6.5, 8.0, and 9.5 m s−1, representing a range of common natural winds that are associated with dust emission [13]. Note that the frequency of a specific wind velocity should be considered for calculation of the total dust emission in a period of time (month, year). Each run of specific wind velocity lasted 30 s to record the trend of dust emission. Dust concentrations (µg m−3) PM10 were recorded by a light-scattering device, DustTrak DRX 8534 (ww.tsi.com), in the range of 0.001–150 µg m−3 (±0.1% of reading) at 1-s intervals, was placed at 25 cm above the tunnel bed. The recorded PM10 concentrations were converted into mass flux emitted from the soil surface (mg m−2 s−1) based on the wind tunnel dimensions, the area of the soil bed, and the wind velocity (for in depth description refer to Katra et al. 2016 [23]). The PM10 flux from the soil surface can be used in parameterization of dust emission and transport models [12,23].
2.2. Field Experiment
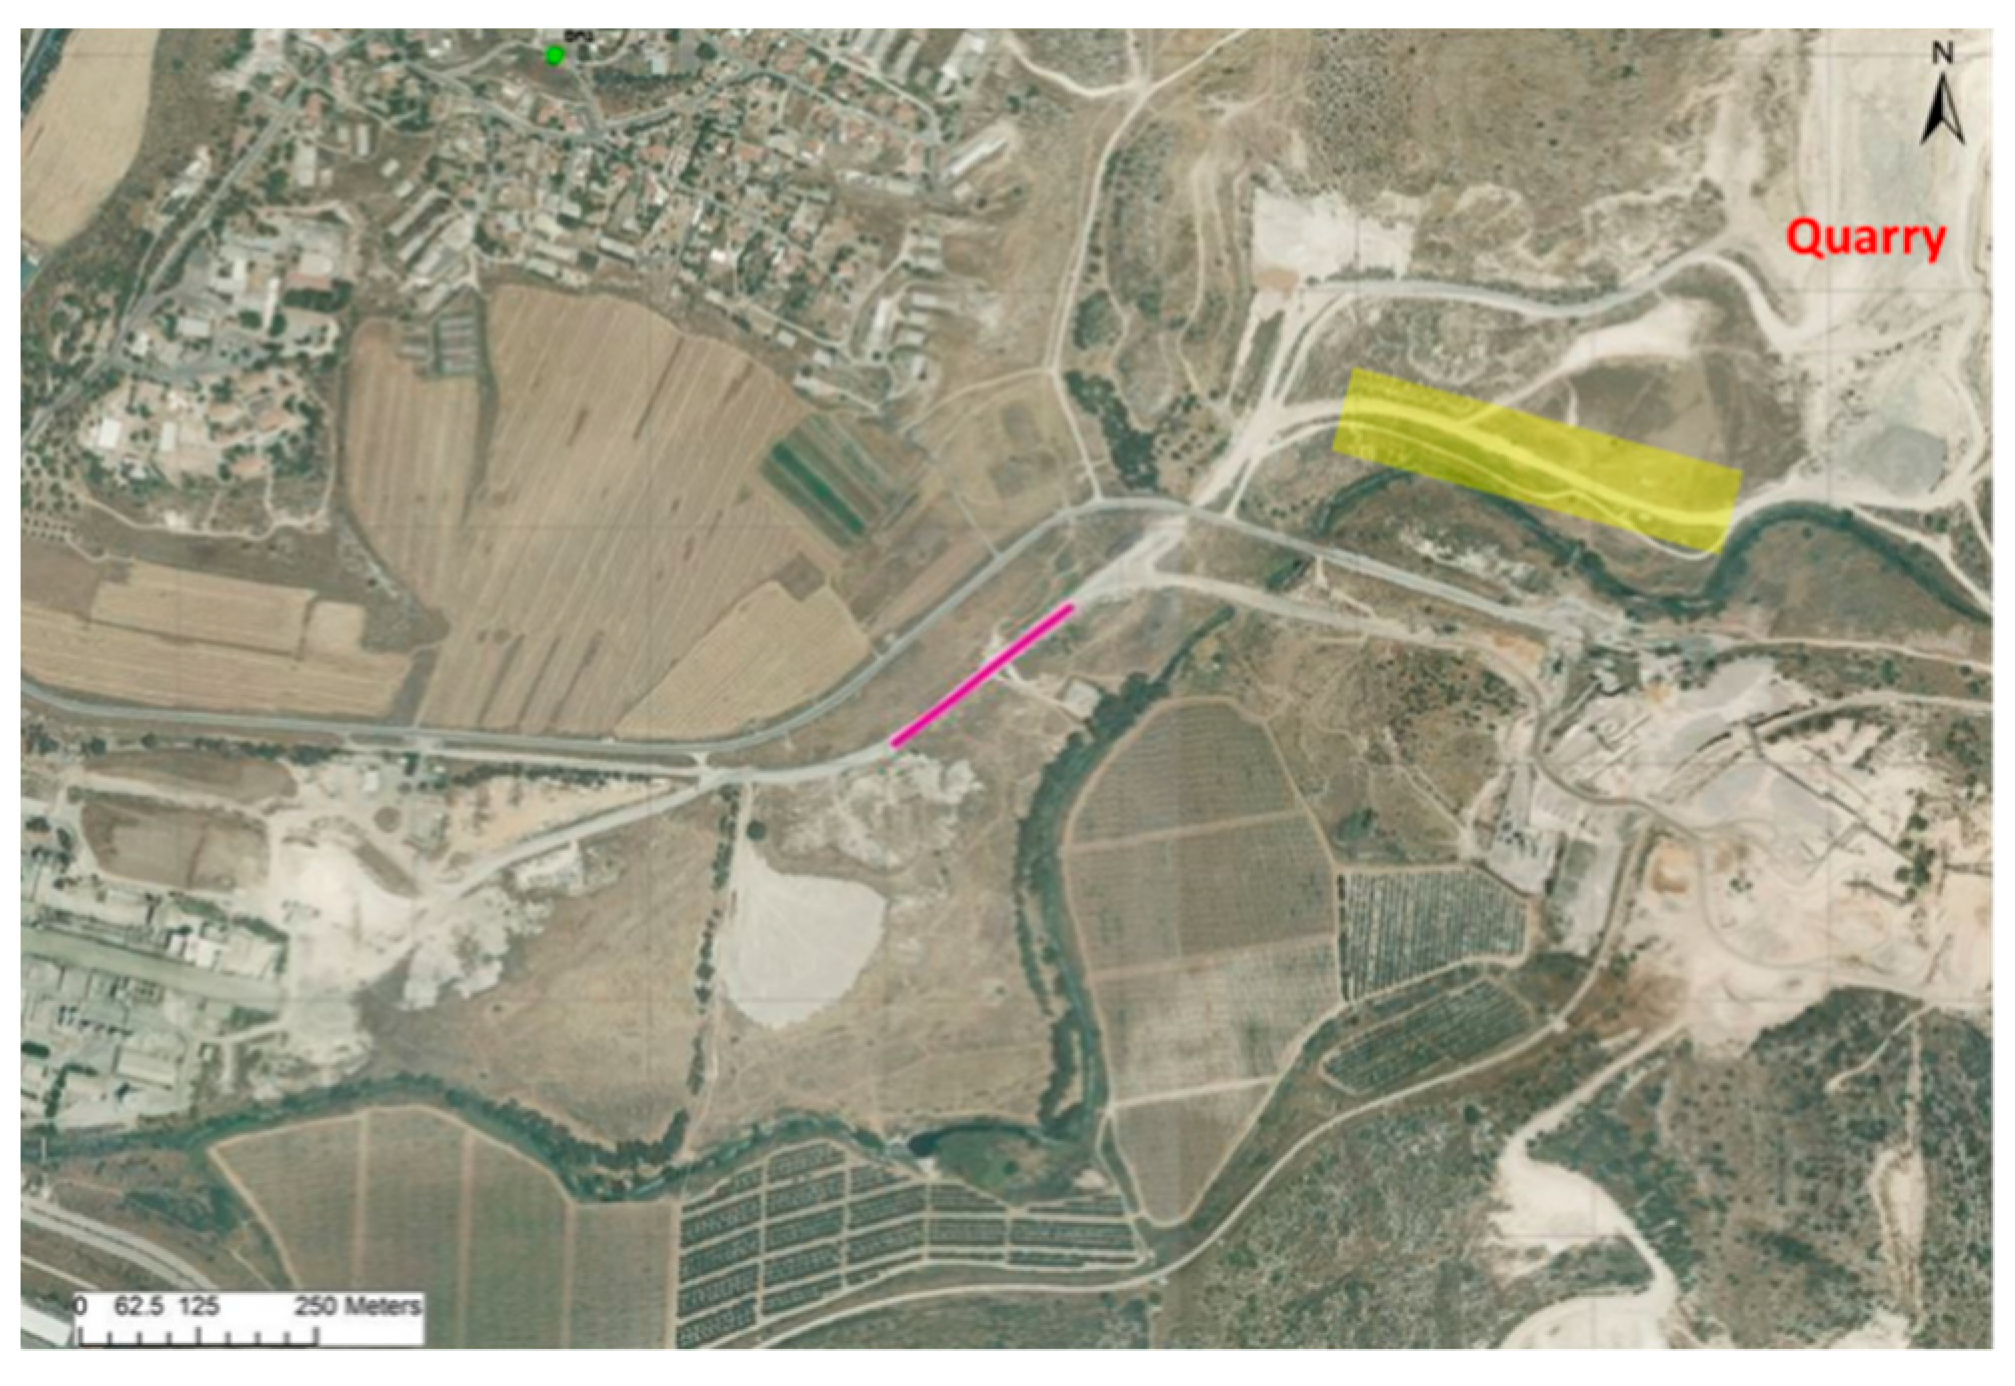
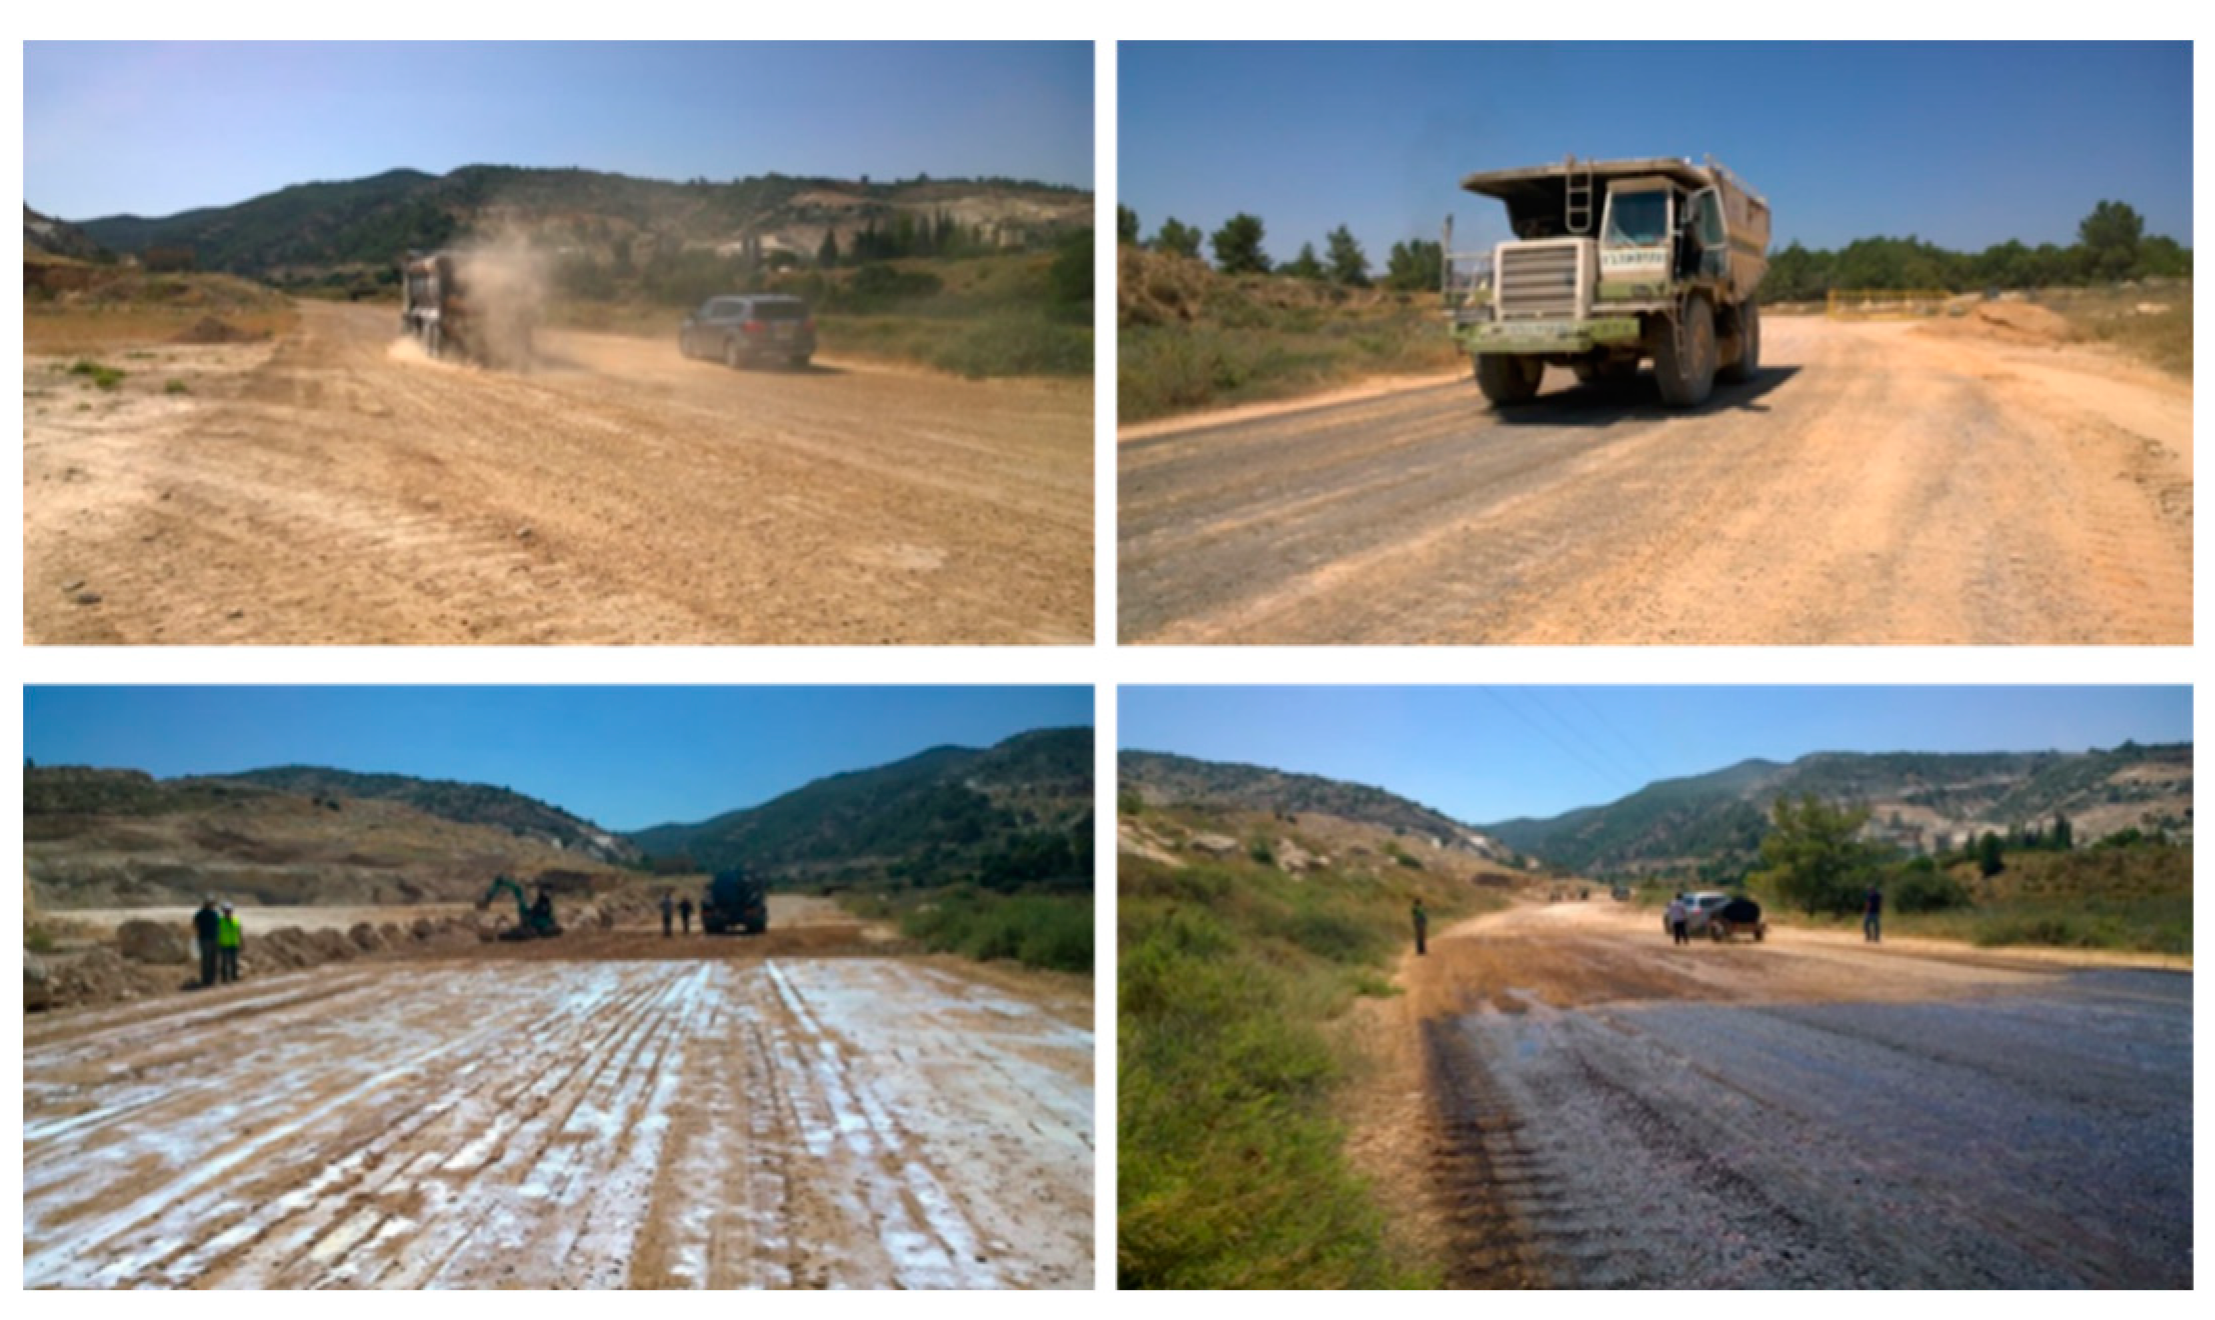
The field experiments aimed to test the efficiency of the dust control products under quarry conditions over time. The field experiments were conducted in an active quarry near the city of Beit Shemesh, Israel (Figure 3). A typical un unpaved haul road (~200 m long) of the quarry was used for the experiment of dust control. The road is used for the Euclid Trucks, which ride the road dozen times during the day, with empty (~100 ton) or full (~170 ton) container. The dust control products were applied on equal plots (20 m each) along the road. Each plot used for different product (Table 1). The product list for the field experiment included Brine. Lignin, Resin, Bitumen, PVA. The products were prepared and applied in the same procedure to the laboratory experiment (Section 2.1, Table 1). The solutions were sprayed on the soil using water-truck with taps at the back (Figure 4).
The road was closed for two days to allow the soil to dry (the experiment performed during July with average daily temperature of 30 °C). The experiment was conducted after transportation of the quarry-haul trucks in two time points: several days after the application of the products, in which 150 rides of Euclid Trucks were recorded, and two weeks after the application, in which additional 296 rides (total of 446) of Euclid Trucks were recorded. The measurements of dust emission were obtained by the portable wind tunnel, which was installed on the road at each soil plot/treatment (in three replicas for each plot). The operation procedure of the wind tunnel was the same to that of the laboratory experiment (see last paragraph in Section 2.1).
3. Results and Discussion
3.1. Product Efficiency under Laboratory Conditions
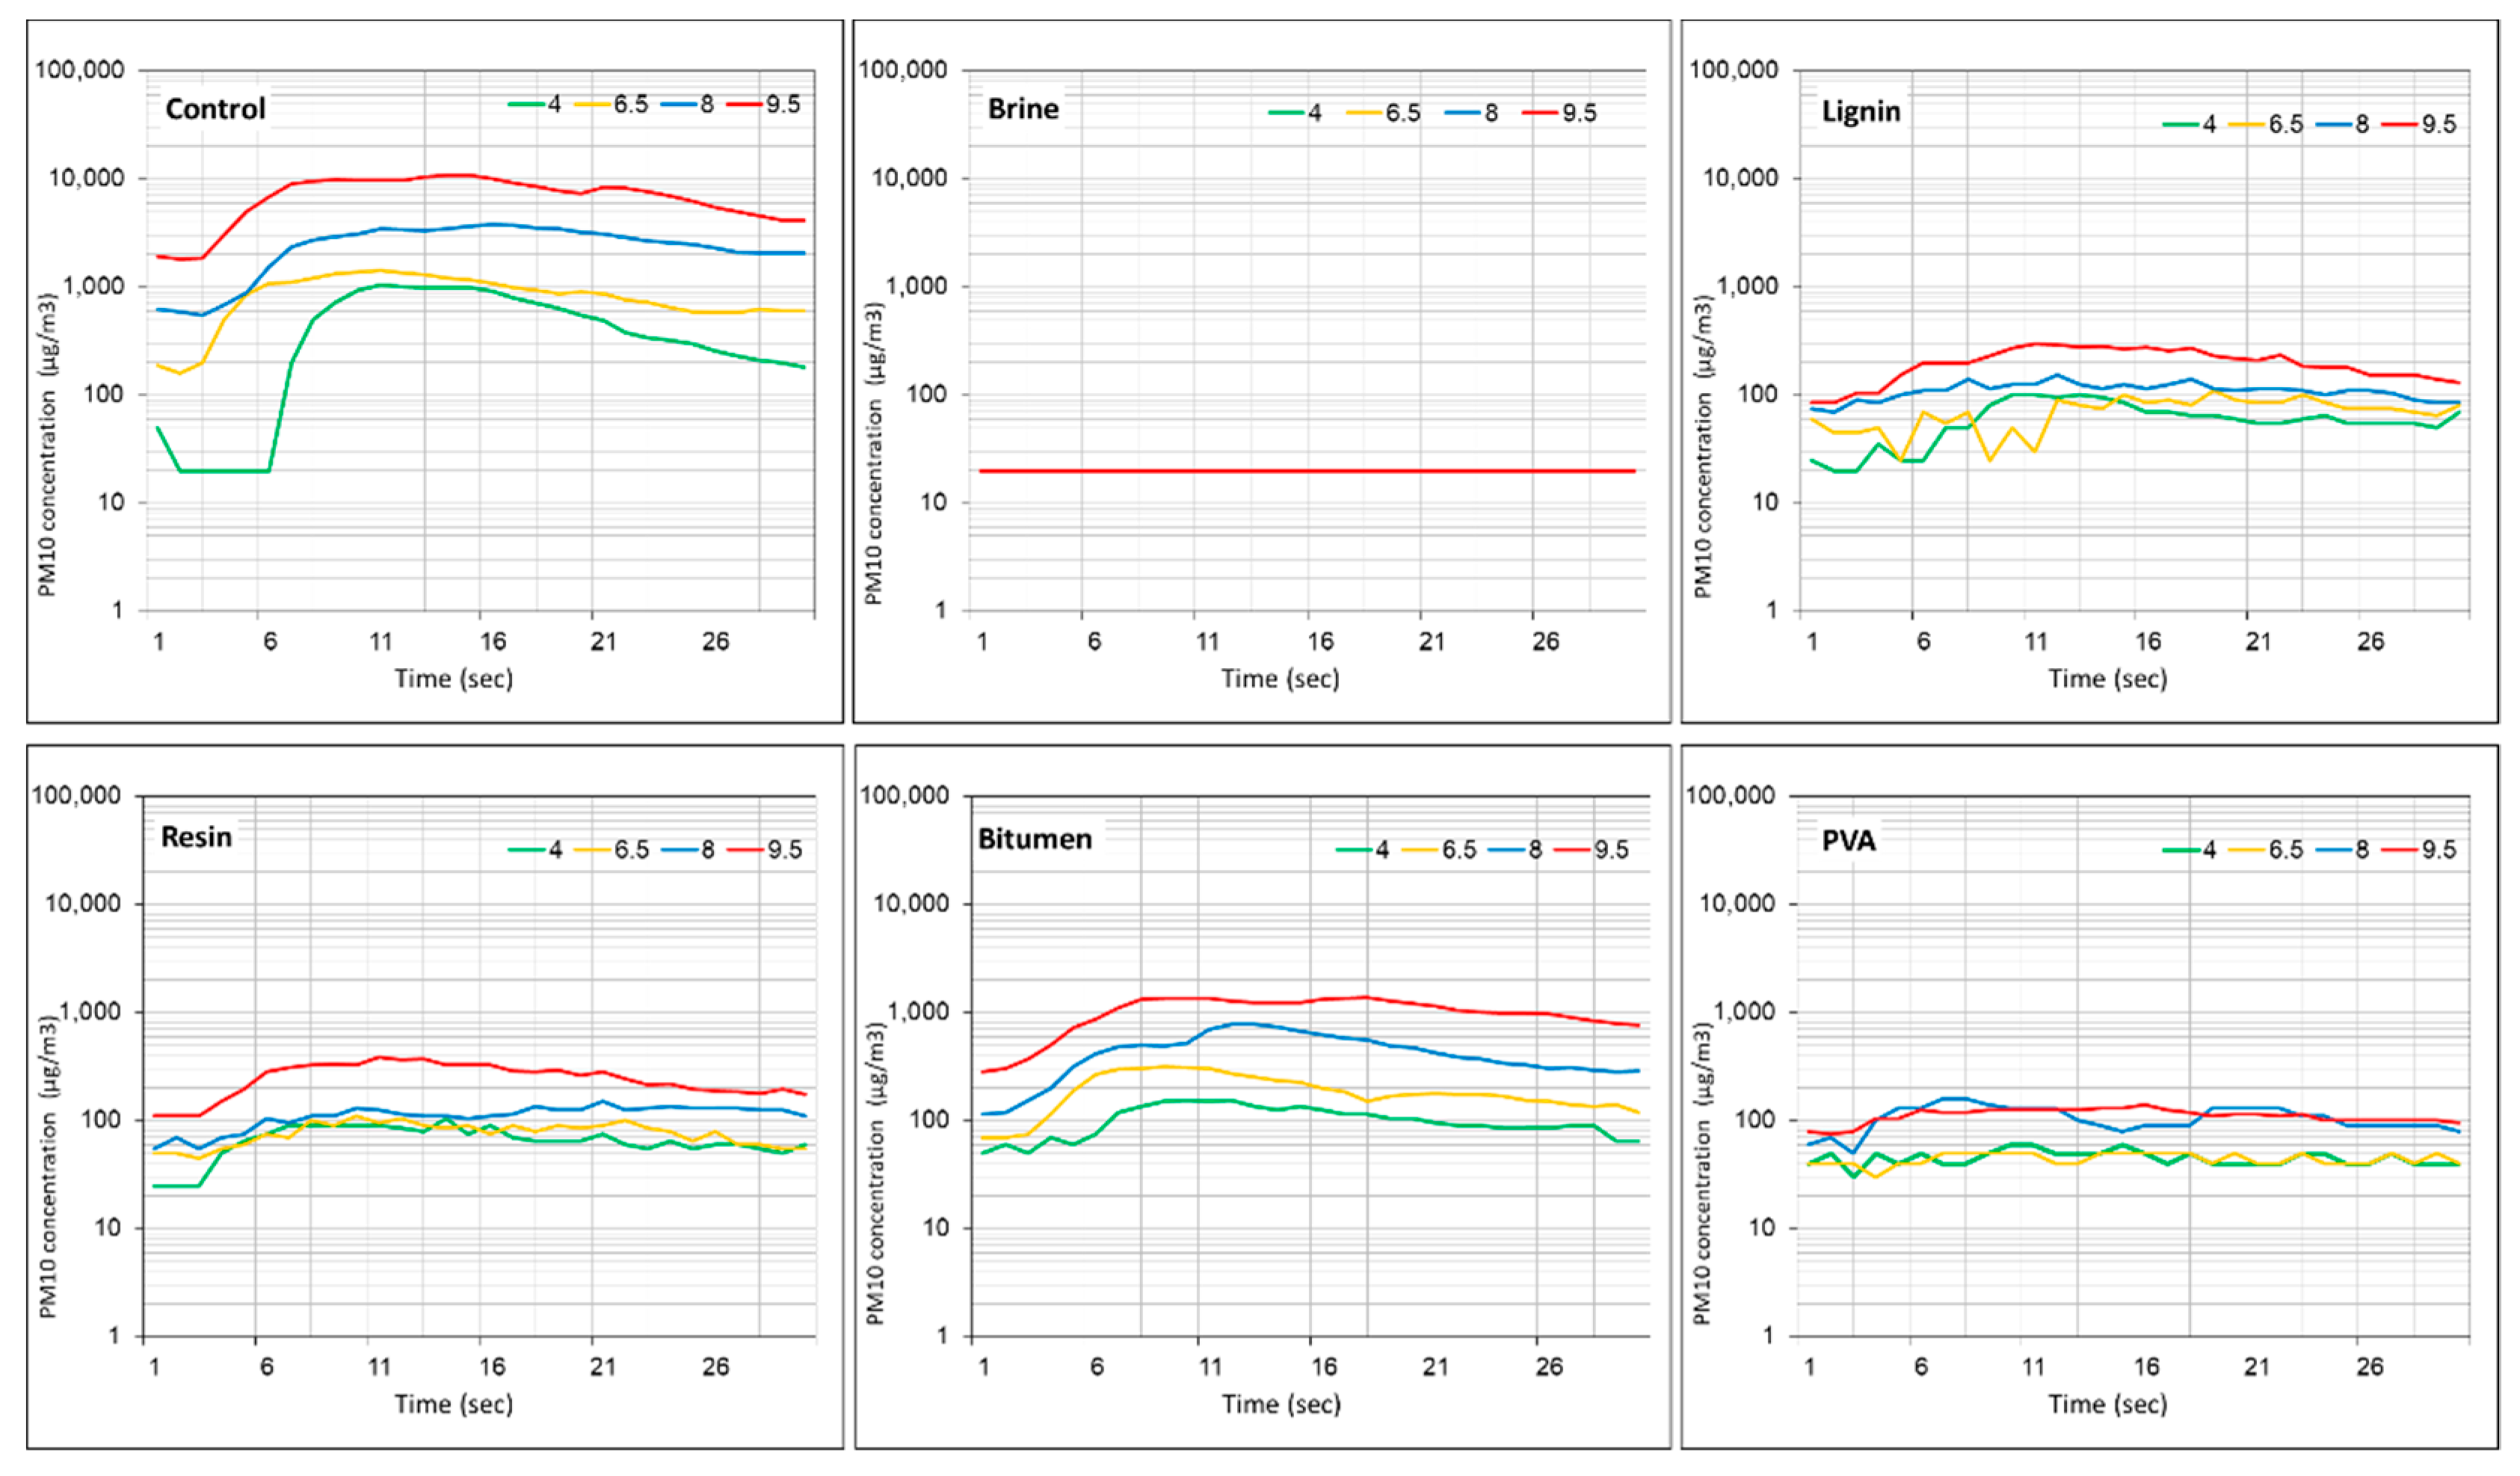
The wind tunnel experiments were aimed to test dust emission by wind after the applications of the dust control products. The PM10 concentration measured in the wind tunnel during the experiment is a result of dust emission from the soil surface. The results of the laboratory wind tunnel experiment are presented in Figure 5. Each soil sample was tested under four wind velocities. It is clearly shown that no dust emission and PM10 concertation was recorded in the application of Brine. The “straight” line that was similarly recorded for all wind velocities in the test of the brine application is a representation of the background level (~20 µg m−3) measured in the wind tunnel before the test. In all the other applications, the averaged PM10 concentrations were significantly (p < 0.05) higher than the background level, including in the lowest wind velocities, 4 and 6.5 m s−1, of the PVA test. At wind velocity of 4 m s−1, which represents a wind at which distinct dust emission started from loess soils, the resulted PM10 concentration was the lowest for all samples. However, no significant difference (p < 0.05) in PM10 between 4 and 6.5 m s−1 was received for Resin, Lignin, and PVA applications. The PM10 values of the control sample were significantly higher than those of all the other samples in all wind velocities. It means that all the applications suppressed dust emission but with different efficiency.
As mentioned before, the Brine was the best application, preventing any dust emission. The PVA was the second-best application, in which dust emission was significant only at the highest wind velocities (8 and 9.5 m s−1). Basically, the highest value of PM10 concentration in all soil samples was recorded in wind of 9.5 m s−1. However, the PM10 concentrations of the PVA at the highest wind velocity were significantly lower (p < 0.05) than those of the Resin, Bitumen, and Lignin. At wind velocity of 8 m s−1, no significant difference in PM10 concentration was received between the PVA and the organic polymers (Resin, Lignin). Note that because of the experimental procedure, in which the wind velocities of 6.5, 8, and 9.5 m s−1 were run promptly after the prior velocity (i.e., 6.5 m s−1 was run after 4 m s−1, and so on), and since the amount of dust particles in the soil samples is limited, the dust emission in those velocities could have been an underestimation for non-limited samples. Nonetheless, dust emission measurements in the laboratory present higher PM10 concentrations, compared to field measurements, under the same experimental conditions (soil type and wind velocity), because the relatively high disturbance of the soil structure during the preparation of the experimental samples in the laboratory [12,14].
The recorded PM10 concentrations were used to calculate the average dust-PM fluxes emitted from the soils (Table 2). The calculation was based on the wind tunnel dimensions and the area of the soil bed [23]. Using the mass flux can provide us quantitative information on soil loss by dust emission from the surface as well as parameterization in models of dust emission and atmospheric PM transport. Since the averaged dust fluxes presented in Table 2 were derived from the PM10 concentrations (Figure 5), they are in full correlation with the averaged PM10 concentrations and have the same differences (and significance level, p < 0.05) discussed above. This is relevant also for the convenience of presentation of the dust suppression efficacy of the diverse products presented in the lower part of Table 2. The dust suppression efficiency was derived as the ratio between the averaged dust flux (per wind velocity) of specific application (Brine, Lignin, Resin, Bitumen, PVA) and the averaged dust flux of the control sample (no-treatment). The values are presented in percentage. It clearly shown that the Brine is the most efficient product in dust suppression, reducing more than 95% of the PM10 dust emission. Nonetheless, the minimum efficiency was 77.7% (Bitumen at 6.5 m s−1) among all the products and wind velocities under the controlled conditions of the laboratory experiment.
3.2. Product Efficiency under Field Conditions
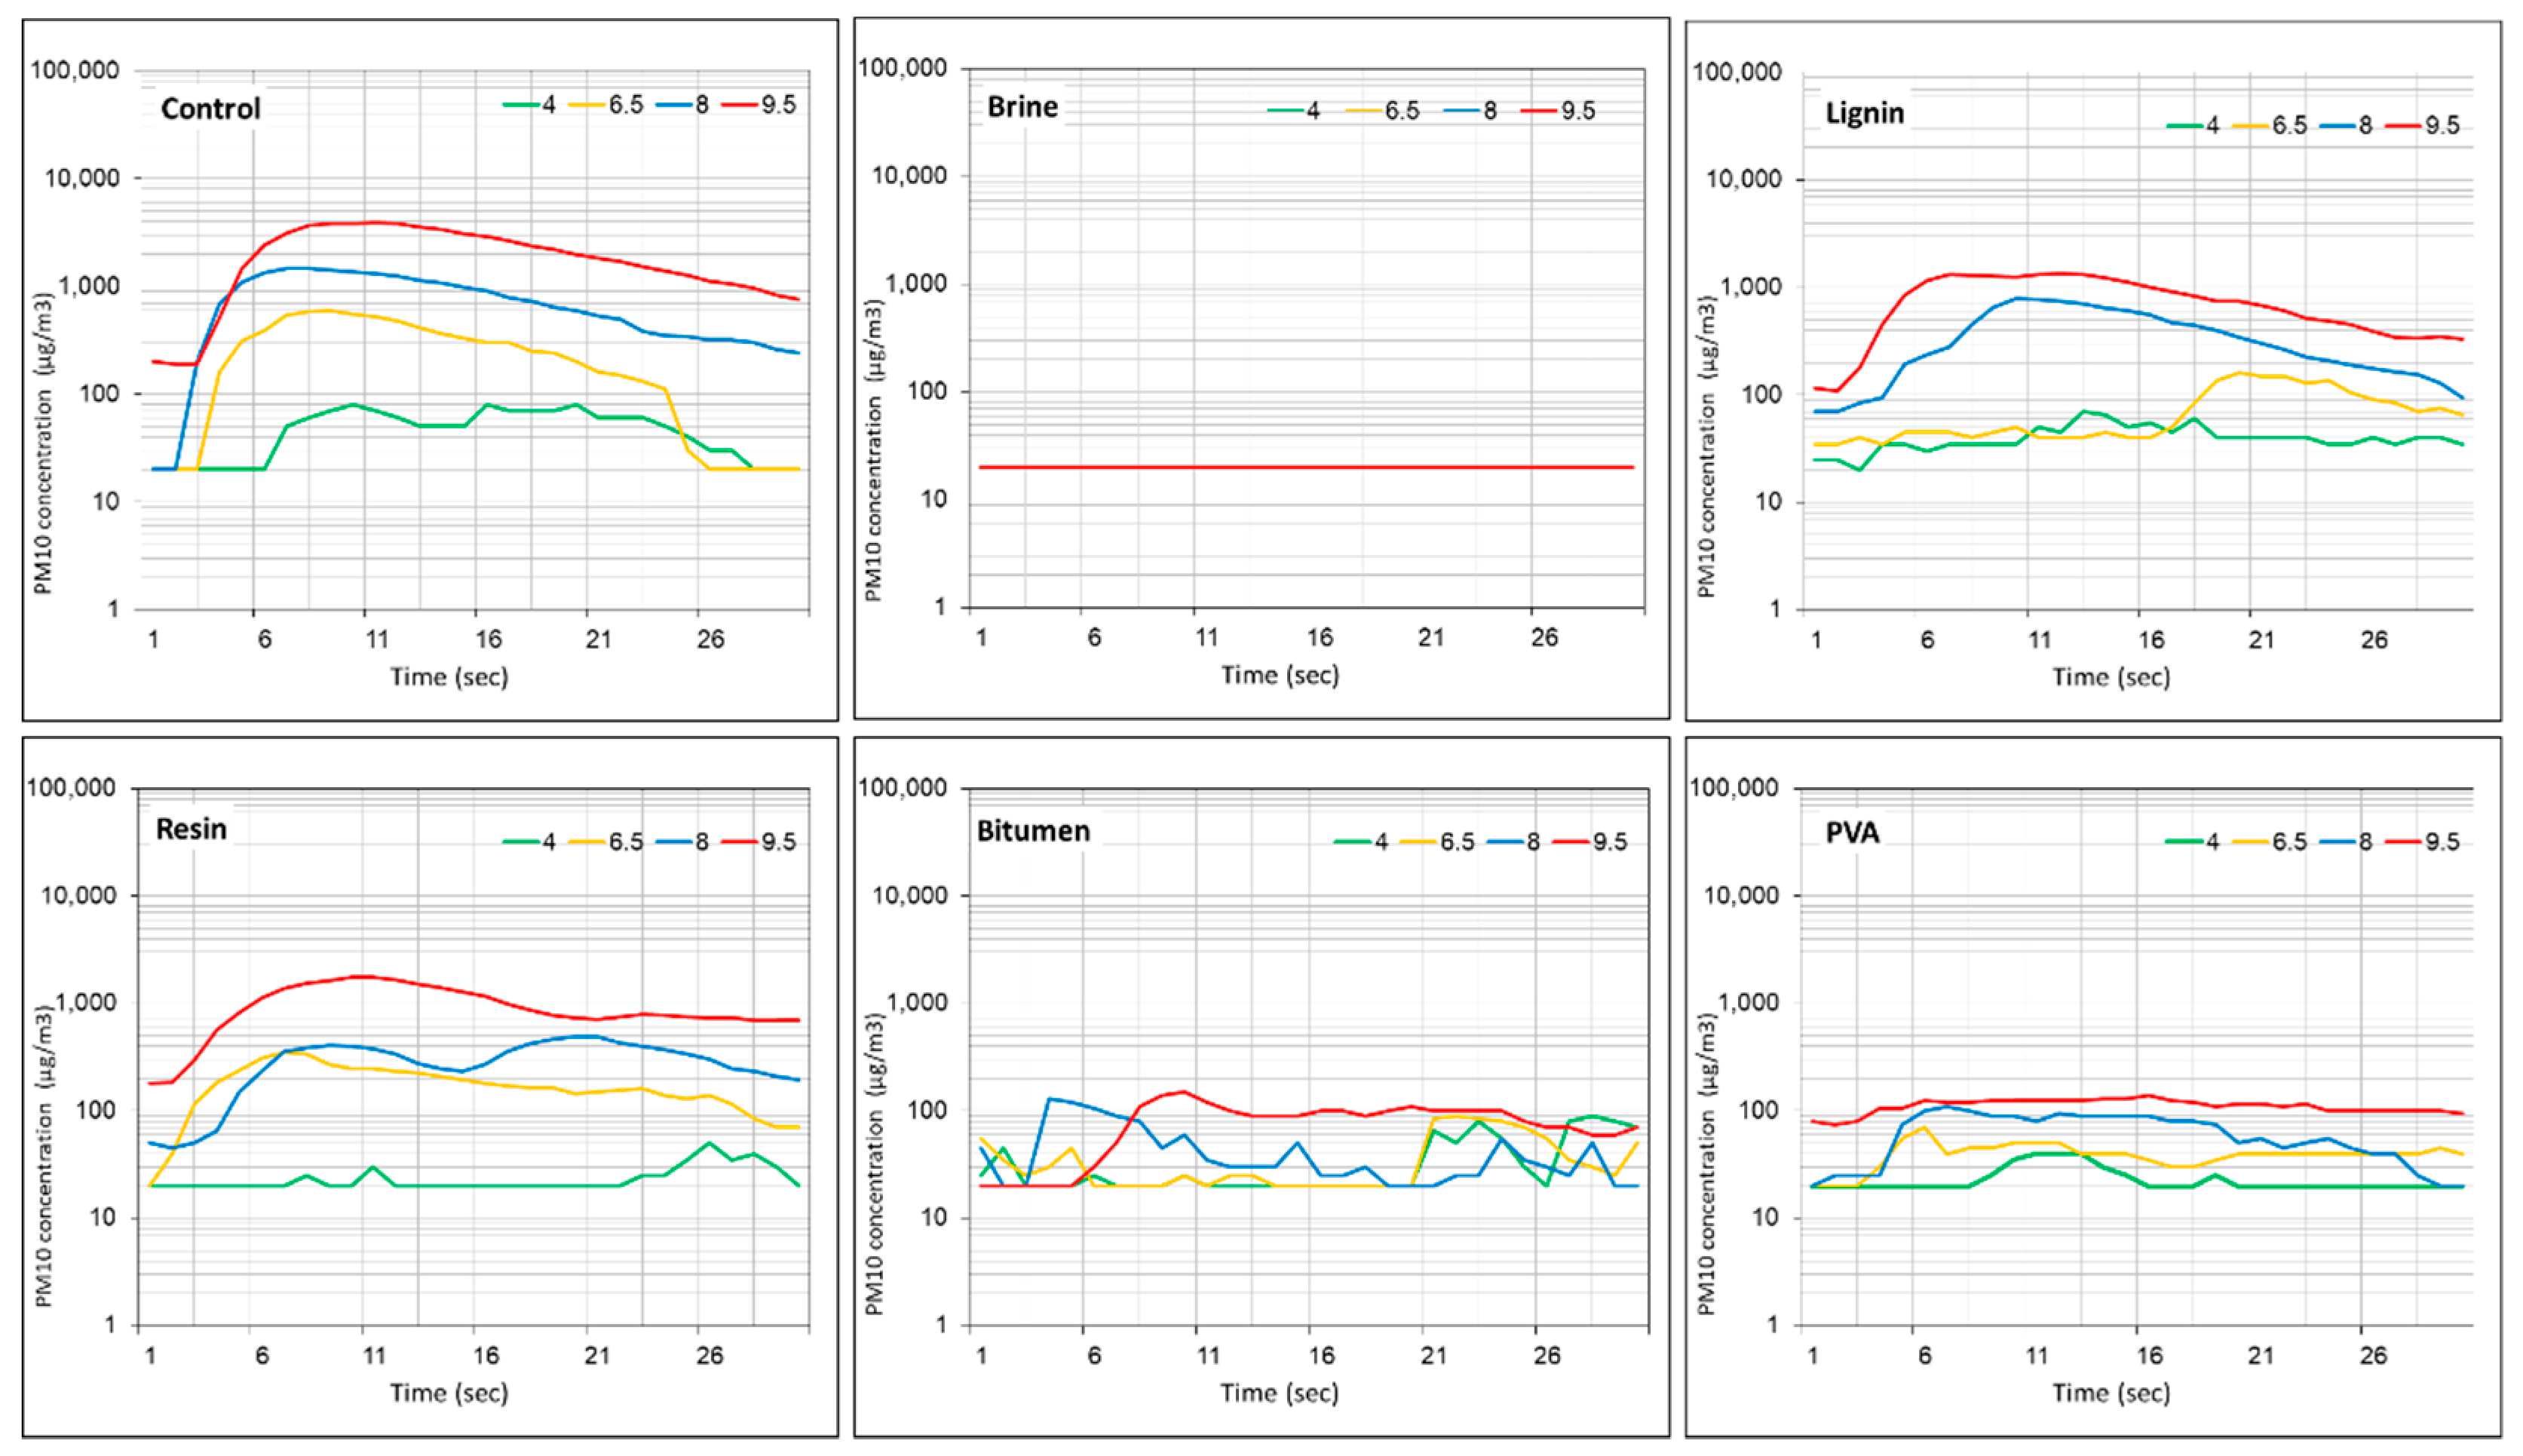
After the laboratory experiment and first characterization of the product efficiency in dust emission suppression, the products were applied in an unpaved road of the quarry for field experiment on dust emission by the portable wind tunnel in two stages. In the first stage, the experiment was conducted several days after the application of the products, in which 150 rides of Euclid Trucks were recorded. The results of the PM10 dust emission from the soil samples by the field experiment are presented in Figure 6. As recorded in the laboratory experiment, the Brine was the best application, preventing any dust emission also in the field conditions with PM10 concentration values at the level of the background (~20 µg m−3) measured in the wind tunnel before the test.
Nonetheless, the averaged PM10 concentrations at the lowest wind velocity (4 m s−1) in all the product applications were significantly lower (p < 0.05) than that of the control plot and close to the background value. The averaged PM10 concentrations of the synthetic polymer (PVA) and the Bitumen were significantly lower (p < 0.05) than those of the control plot also in the other wind velocities (6.5, 8, and 9.5 m s−1). A significant difference between the Bitumen and the PVA was received only at wind velocity of 8 m s−1, in which the averaged PM10 concentration of the Bitumen was the lower one. In the organic products (Lignin and Resin), the averaged PM10 concentrations at wind velocities above 4 m s−1 were close to those of the control plot with no significant differences, excluding the Resin at 6.5 m s−1 with significant lower value.
The averaged PM10 concentrations recorded in the field experiment for each product (Figure 6) were relatively lower than those of the laboratory experiment (Figure 5) because of the conditions of the soil surface structure before the experiment as explained in Section 3.1. This is less relevant for the soil plots with the application of organic products that present higher values in the field experiment at wind velocities of 8 and 9.5 m s−1. However, the PM10 emissions in both organic applications were not higher than that of the control plot. The calculated dust emission fluxes, presented in Table 3, were derived from the PM10 concentrations (Figure 6) and as such they are in full correlation with the averaged PM10 concentrations and have the same differences (and significance level, p < 0.05) discussed earlier. The dust suppression efficiency (%) is presented in the lower part of Table 3. It clearly shown that the Brine is the most efficient product in dust suppression, reducing more than 90% of the PM10 dust emission at the higher wind velocities 6.5, 8, and 9.5 m s−1. At these wind velocities, it revealed that the applications of the organic products were significantly less efficient in dust suppression under field conditions.
In the second stage, the experiment was conducted two weeks after the application, in which additional 296 rides (total of 446) of Euclid Trucks were recorded. The results of the dust suppression efficiency (%) are presented in Table 4. The organic products (Lignin and Resin) were found to be non-efficient applications for dust suppression by wind. The efficiency of the Bitumen and the PVA reduced dramatically compared to the first stage (Table 3) with only minor dust suppression at the higher wind velocity (14.3% and 3.9%, respectively). It revealed that all these product applications were destructed by the truck wheels after 150 rides, leading to dust emission at the same rate of the control (no treatment) road section. However, the application of magnesium-chloride solution (Brine) on the road surface kept on the same high-level of efficiency as in the first stage.
3.3. Improved Application of Brine
The high efficiency of the magnesium-chloride solution (Brine) in dust emission suppression because of vehicle transportation was already reported [18,24]. The results of this study indicate clearly on the high efficiency of the magnesium-chloride solution in dust suppression because of wind erosion in calcareous soil bed in arid climate. The magnesium-chloride solution (Table 1) provides soluble salts to the soil that act as a cementing material for the formation of soil aggregates and soil structure [25]. Moreover, its hygroscopic property allows absorbing water from the atmosphere, even in low atmospheric humidity, agglomerating the fines and holding the aggregate matrix together through suction forces [18]. The existence of water enables the cohesive forces between the soil particles, in particular the clay-sized particles [26]. In turn, the higher soil water content, the lower wind erosion and dust emission because of the inter-particles connections and larger aggregates that are more resistance to the wind shear stress [14]. Moreover, the Brine hydrous magnesium chloride can be a byproduct, a waste material, from industrial production. In Israel, this Brine is available by the production process of potassium (K) from the saline Dead Sea. The use of waste materials is important in sustainable environment perspective.
The recommended application of the Brine is wetting the soil surface at the rate of 1.5 L m−2, based on the very high efficiency of the Brine to suppress dust emission in the calcareous soil. It was assumed in this study that the application rate can be reduced and still keep on high efficiency. In order to test this, five samples with different rate of Brine concentration (amount of solution in the soil) were prepared for laboratory experiment: 1.5 L m−2, 1.2 L m−2 (that is 80% of the recommended rate), 0.8 L m−2 (60%), 0.5 L m−2 (40%), and 0.3 L m−2 (20%). After the application process, the soil samples were left outside for drying for several days. The wind tunnel experiment was performed in the same procedure described in Section 2.1 with two wind velocities: 6.5 and 9.5 m s−1. The dust-PM emission fluxes were derived from the PM10 concentration measured during the experiment. Then, emission coefficient was calculated as the ratio between the dust fluxes of the Brine sample (different concentration) and the control (no-treatment) sample, in which, the lower value, the higher dust emission suppression. The dependence of PM10 emission in the Brine concentration applied on the soil under two wind velocities, 6.5 and 9.5 m s−1, is presented in Figure 7. The results indicate that the Brine concentration can be reduced to 60% (use of 0.8 L m−2 instead 1.5 L m−2) and 40% (use of 0.5 L m−2 instead 1.5 L m−2) for winds of 9.5 m s−1 and 6.5 m s−1, respectively, and still keep on high efficiency of >90% in dust emission suppression. Although the high efficiency of the Brine to prevent dust emission by wind in both laboratory (Table 2) and field (Table 3 and Table 4) conditions, the exact level of reduced Brine concentration that is recommended to be applied in the field should be determined by a targeted experiment.
4. Conclusions
Previous works on dust control in unpaved roads have mainly focused on dust emission by vehicle (wheels) traveling. The results of the control soils (no-treatment) in this study clearly show that dust emission by wind from unpaved road can substantially contribute to the mass transfer, and thus should be considered. The experiment on dust control products in laboratory conditions with no vehicle transport on the soil revealed high efficiency in dust emission suppression for all the products (Brine, Lignin, Resin, Bitumen, PVA), reducing at least 77% of the dust emission by wind. However, the efficiency of most of the products was reduced significantly when applied and tested under field conditions in quarry-haul truck road. Two weeks later and after 446 rides of the quarry trucks, the products were not efficient to prevent dust emission by wind, except of the Brine.
The Brine enables to keep on very high efficiency (>90%) to suppress dust emission by wind over time. Additional experiments revealed that Brine can be applied with reduced amounts and still keeping on low emission. There are only few scientific articles on the application of hydrous magnesium chloride (Brine). Those studies showed the high efficiency of the Brine to reduce dust emission due to vehicle (wheels) traveling. In this study, the Brine was found to be very efficient also in wind erosion and may provide a good solution for product application in disturbed soils especially in the water-limited areas of the arid and semi-arid climates. Nevertheless, further study is needed to investigate the possible environmental impacts of the diverse dust suppression substances, including toxicity of atmospheric particulate matter when dust is emitted from the treated soils and/or soil-groundwater pollution because of vertical fluxes of the applied solutions on the surfaces.
Funding
This research was funded by the Ministry of Energy, Israel, grant number 212-17-021.
Conflicts of Interest
The author declares no conflict of interest.
References
- Kok, J.F.; Ridley, D.A.; Zhou, Q.; Miller, R.L.; Zhao, C.; Heald, C.L.; Ward, D.S.; Albani, S.; Haustein, K. Smaller desert dust cooling effect estimated from analysis of dust size and abundance. Nat. Geosci. 2017, 10, 274. [Google Scholar] [CrossRef]
- Maher, B.A.; Prospero, J.M.; Mackie, D.; Gaiero, D.; Hesse, P.; Balkanski, Y. Global connections between aeolian dust, climate and ocean biogeochemistry at the present day and at the last glacial maximum. Earth-Sci. Rev. 2010, 99, 61–97. [Google Scholar] [CrossRef]
- Katra, I.; Gross, A.; Swet, N.; Tanner, S.; Krasnov, H.; Angert, A. Substantial dust loss of bioavailable phosphorus from agricultural soils. Sci. Rep. 2016, 6, 24736. [Google Scholar] [CrossRef] [PubMed]
- Krasnov, H.; Katra, I.; Novack, V.; Vodonos, A.; Friger, M. Increased indoor PM concentrations controlled by atmospheric dust events and urban factors. Build. Environ. 2015, 87, 169–176. [Google Scholar] [CrossRef]
- Krasnov, H.; Katra, I.; Friger, M. Increase in dust storm related PM10 concentrations: A time series analysis of 2001–2015. Environ. Pollut. 2016, 213, 36–42. [Google Scholar] [CrossRef]
- Yitshak-Sade, M.; Novack, V.; Katra, I.; Gorodischer, R.; Tal, A.; Novack, L. Non-anthropogenic dust exposure and asthma medications purchase in children. Eur. Respir. J. 2014, 45, 652–660. [Google Scholar] [CrossRef]
- Vodonos, A.; Friger, M.; Katra, I.; Krasnov, H.; Zager, D.; Schwartz, J.; Novack, V. Individual effect modifiers of dust exposure effect on cardiovascular morbidity. PLoS ONE 2015. [Google Scholar] [CrossRef]
- USEPA. Miscellaneous Sources. In AP-42, 6th ed.; US Environmental Protection Agency: Research Triangle Park, NC, USA, 2006; Chapter 13. [Google Scholar]
- Goossens, D.; Buck, B. Dynamics of dust clouds produced by off-road vehicle driving. J. Earth Sci. Geotech. Eng. 2014, 4, 1–21. [Google Scholar]
- Etyemezian, V.; Kuhns, H.; Gillies, J.; Green, M.; Pitchford, M.; Watson, J. Vehicle-based road dust emission measurement: I—Methods and calibration. Atmos. Environ. 2003, 37, 4559–4571. [Google Scholar] [CrossRef]
- Watson, J.G.; Chow, J.C.; Pace, T.G. Fugitive Dust Emissions; Desert Research Institute: Reno, NV, USA, 2000; Crops 3, 7. [Google Scholar]
- Yulevitch, G.; Danon, M.; Krasovitov, B.; Fominykh, A.; Tsesarsky, M.; Swet, N.; Katra, I. Evaluation of wind-induced dust-PM emission from unpaved roads varying in silt content by experimental results. Atmos. Pollut. Res. 2019. [Google Scholar] [CrossRef]
- Kok, J.F.; Parteli, E.J.; Michaels, T.I.; Karam, D.B. The physics of wind-blown sand and dust. Rep. Prog. Phys. 2012, 75, 106901. [Google Scholar] [CrossRef] [PubMed]
- Swet, N.; Katra, I. Reduction in soil aggregation in response to dust emission processes. Geomorphology 2016, 268, 177–183. [Google Scholar] [CrossRef]
- Roskin, J.; Katra, I.; Blumberg, D.G. Particle-size fractionation of eolian sand along the Sinai–Negev erg of Egypt and Israel. GSA Bull. 2014, 126, 47–65. [Google Scholar] [CrossRef]
- Yizhaq, H.; Katra, I.; Isenberg, O.; Tsoar, H. Evolution megaripples from a flat bed. Aeolian Res. 2012, 6, 1–12. [Google Scholar] [CrossRef]
- Nicholson, K.; Branson, J.; Giess, P.; Cannell, R. The effects of vehicle activity on particle resuspension. J. Aerosol Sci. 1989, 20, 1425–1428. [Google Scholar] [CrossRef]
- Bustos, M.; Cordo, O.; Girardi, P.; Pereyra, M. Evaluation of the Use of Magnesium Chloride for Surface Stabilization and Dust Control on Unpaved Roads. Transp. Res. Rec. 2015, 2473, 13–22. [Google Scholar] [CrossRef]
- Gulia, S.; Goyal1, P.; Goyal, S.K.; Kumar, R. Re‑suspension of road dust: Contribution, assessment and control through dust suppressants—A review. Int. J. Environ. Sci. Technol. 2019, 16, 1717–1728. [Google Scholar] [CrossRef]
- Katra, I.; Yizhaq, H. Intensity and degree of segregation in bimodal and multimodal grain size distributions. Aeolian Res. 2017, 27, 23–34. [Google Scholar] [CrossRef]
- Swet, N.; Elperin, T.; Kok, J.; Martin, R.; Yizhaq, H.; Katra, I. Can active sands generate dust particles by wind-induced processes? Earth Planet. Sci. Lett. 2019, 506, 371–380. [Google Scholar] [CrossRef]
- Tanner, S.; Katra, I.; Haim, A.; Zaady, E. Short-term soil loss by eolian erosion in response to different rain-fed agricultural practices. Soil Tillage Res. 2016, 155, 149–156. [Google Scholar] [CrossRef]
- Katra, I.; Elperin, T.; Fominykh, A.; Krasovitov, B.; Yizhaq, H. Modeling of particulate matter transport in atmospheric boundary layer following dust emission from source areas. Aeolian Res. 2016, 20, 147–156. [Google Scholar] [CrossRef]
- Gonzalez, A.; Aitken, D.; Heitzer, C.; Lopez, C.; Gonzalez, M. Reducing mine water use in arid areas through the use of a byproduct road dust suppressant. J. Clean. Prod. 2019, 230, 46–54. [Google Scholar] [CrossRef]
- Castellanos, A. The relationship between attractive interparticle forces and bulk behavior in dry and uncharged fine powders. Adv. Phys. 2005, 54, 263–376. [Google Scholar] [CrossRef]
- Ben-Hur, M.; Yolcu, G.; Uysa, H.; Lado, M.; Paz, A. Soil structure changes: Aggregate size and soil texture effects on hydraulic conductivity under different saline and sodic conditions. Aust. J. Soil Res. 2009, 47, 688–696. [Google Scholar] [CrossRef]
Figure 1.
Characteristics of the soil sample used for the experiments: (a) size distribution of the soil product in the quarry obtained by mechanical sieving. (b) Particle size distribution of the fine-earth material (after extraction of the rock fragments in the sample) obtained by the laser diffractometer technique. (c) Mineralogical composition of the fine-earth material by the X-ray power diffraction (XRPD). (d) Elemental composition of the fine-earth material by the X-ray fluorescence (XRF).

Figure 2.
The soil samples in trays after the application of the dust control product used for the laboratory wind tunnel experiment. The size of each tray is 0.5 × 1.0 m with height of 0.02 m. each soil sample was prepared in three replicas.
Figure 2.
The soil samples in trays after the application of the dust control product used for the laboratory wind tunnel experiment. The size of each tray is 0.5 × 1.0 m with height of 0.02 m. each soil sample was prepared in three replicas.

Figure 3.
The active quarry near the city of Beit Shemesh, Israel (31°45′54.62” N, 35°1′5.15” E) is shown at the top right side of the aerial photo. The field experiment was conducted on an unpaved haul road (~200 m long) of the quarry, which is within the yellow rectangular.
Figure 3.
The active quarry near the city of Beit Shemesh, Israel (31°45′54.62” N, 35°1′5.15” E) is shown at the top right side of the aerial photo. The field experiment was conducted on an unpaved haul road (~200 m long) of the quarry, which is within the yellow rectangular.

Figure 4.
Application of the dust control product on the unpaved haul road before the dust emission experiment.
Figure 4.
Application of the dust control product on the unpaved haul road before the dust emission experiment.

Figure 5.
PM10 concentrations recorded during the laboratory wind tunnel experiment on the diverse dust control products under wind velocities 4.0, 6.5, 8.0, and 9.5 m s−1. Note, the “control” is a soil sample with no treatment. The background level measured in the wind tunnel before the test was ~20 µg m−3.

Figure 6.
PM10 concentrations recorded during the first field wind tunnel experiment on the diverse dust control products under wind velocities 4.0, 6.5, 8.0, and 9.5 m s−1. The experiment was performed several days after the dust control application on the unpaved road with 150 rides of the quarry Euclid Trucks. Note, the “control” is an unpaved road section with no treatment. The background level measured in the wind tunnel before the test was ~20 µg m−3.

Figure 7.
The dependence of PM10 emission in the Brine concentration applied on the soil under two wind 6.5 and 9.5 m s−1. The efficiency is represented by the emission coefficient (Y axis) that is the ratio between the dust fluxes of the Brine sample (different concentration) and the control (no-treatment) sample, in which, the lower value, the higher dust emission suppression.


Table 1.
List of products for dust control used in the laboratory and field experiments. Note that the composition of the solution of each substance and the concentrations of the solution to be applied by spraying on the soil surface were provided by the suppliers.
Table 1.
List of products for dust control used in the laboratory and field experiments. Note that the composition of the solution of each substance and the concentrations of the solution to be applied by spraying on the soil surface were provided by the suppliers.
| Product/Sample | Type of Material | Application |
|---|---|---|
| Control | None | None |
| Brine | Hydrous magnesium chloride (MgCl2 + CaCl2 + NaCl + KCl) | Sprayed 1.5 L m−2 |
| Lignin | Organic polymer (Calcium lignosulfonat) | Concentration 0.25 L m−2 Solution 1(lignin):2(water) |
| Resin | Organic polymer (Emulsified tree resin) | Concentration 0.25 L m−2 Solution 1(resin):4(water) |
| Bitumen | Petroleum bitumen (Asphalt) emulsion | Concentration 0.40 L m−2 Solution 1(bitumen):5(water) |
| PVA | Synthetic polymer (Polyvinyl acetate and acrylic polymers) | Concentration 0.11 L m−2 Solution 1(PVA):9(water) |
Table 2.
The calculated PM10 emission fluxes from the soils tested in the laboratory wind tunnel experiment are presented in the upper part of the table. In the lower part of the table, the dust suppression efficiency (%) calculated as a ratio in dust flux between the treated road section and the control (no-treatment) road.
| Wind Velocity (m s−1) | Dust-PM10 Emission Flux (mg m−2 s−1) | |||||
|---|---|---|---|---|---|---|
| Control | Brine | Lignin | Resin | Bitumen | PVA | |
| 4.0 | 3.51 | 0.15 | 0.45 | 0.50 | 0.76 | 0.34 |
| 6.5 | 10.47 | 0.24 | 0.86 | 0.94 | 2.33 | 0.54 |
| 8.0 | 37.68 | 0.30 | 1.65 | 1.67 | 6.53 | 1.60 |
| 9.5 | 126.97 | 0.36 | 3.58 | 4.51 | 18.17 | 1.98 |
| Wind Velocity (m s−1) | Dust Suppression Efficiency (%) | |||||
| Control | Brine | Lignin | Resin | Bitumen | PVA | |
| 4.0 | N/A | 95.7 | 87.1 | 85.7 | 78.4 | 90.2 |
| 6.5 | N/A | 97.7 | 91.8 | 91.0 | 77.7 | 94.8 |
| 8.0 | N/A | 99.2 | 95.6 | 95.6 | 82.7 | 95.8 |
| 9.5 | N/A | 99.7 | 97.2 | 96.4 | 85.7 | 98.4 |
Table 3.
The calculated PM10 emission fluxes from the unpaved roads in the first field wind tunnel experiment are presented in the upper part of the table. In the lower part of the table, the dust suppression efficiency (%) calculated as a ratio in dust flux between the treated road section and the control (no-treatment) road.
| Wind Velocity (m s−1) | Dust-PM10 Emission Flux (mg m−2 s−1) | |||||
|---|---|---|---|---|---|---|
| Control | Brine | Lignin | Resin | Bitumen | PVA | |
| 4.0 | 0.36 | 0.15 | 0.30 | 0.18 | 0.27 | 0.18 |
| 6.5 | 2.95 | 0.24 | 0.87 | 2.14 | 0.45 | 0.48 |
| 8.0 | 10.98 | 0.30 | 5.26 | 4.42 | 0.66 | 0.94 |
| 9.5 | 36.54 | 0.36 | 13.71 | 17.16 | 1.41 | 1.98 |
| Wind Velocity (m s−1) | Dust Suppression Efficiency (%) | |||||
| Control | Brine | Lignin | Resin | Bitumen | PVA | |
| 4.0 | N/A | 57.7 | 14.8 | 49.6 | 25.4 | 50.7 |
| 6.5 | N/A | 91.7 | 70.4 | 27.4 | 84.7 | 83.6 |
| 8.0 | N/A | 97.3 | 52.1 | 59.8 | 94.0 | 91.5 |
| 9.5 | N/A | 99.0 | 62.5 | 53.0 | 96.1 | 94.6 |
Table 4.
The efficiency (%) in dust-PM10 emission recorded two weeks after the dust control application on the unpaved road with 446 rides of the quarry Euclid Trucks. The dust suppression efficiency (%) was calculated as a ratio in dust flux between the treated road section and the control (no-treatment) road.
| Wind Velocity (m s−1) | Control | Brine | Lignin | Resin | Bitumen | PVA |
|---|---|---|---|---|---|---|
| 4.0 | N/A | 57.7 | 0.0 | 0.0 | 0.0 | 0.0 |
| 6.5 | N/A | 91.7 | 0.0 | 0.0 | 0.0 | 0.0 |
| 8.0 | N/A | 97.3 | 0.0 | 0.0 | 0.0 | 0.0 |
| 9.5 | N/A | 99.0 | 0.0 | 0.0 | 14.3 | 3.9 |
© 2019 by the author. Licensee MDPI, Basel, Switzerland. This article is an open access article distributed under the terms and conditions of the Creative Commons Attribution (CC BY) license (http://creativecommons.org/licenses/by/4.0/).
Share and Cite
MDPI and ACS Style
Katra, I. Comparison of Diverse Dust Control Products in Wind-Induced Dust Emission from Unpaved Roads. Appl. Sci. 2019, 9, 5204. https://doi.org/10.3390/app9235204
AMA Style
Katra I. Comparison of Diverse Dust Control Products in Wind-Induced Dust Emission from Unpaved Roads. Applied Sciences. 2019; 9(23):5204. https://doi.org/10.3390/app9235204
Chicago/Turabian StyleKatra, Itzhak. 2019. "Comparison of Diverse Dust Control Products in Wind-Induced Dust Emission from Unpaved Roads" Applied Sciences 9, no. 23: 5204. https://doi.org/10.3390/app9235204
Note that from the first issue of 2016, this journal uses article numbers instead of page numbers. See further details here.