Article

Raman Spectroscopic Study of Coal Samples during Heating

1
State Key Laboratory of Advanced Special Steel & Shanghai Key Laboratory of Advanced Ferrometallurgy & School of Materials Science and Engineering, Shanghai University, Shanghai 200444, China
2
CSIRO Mineral Resources, Pullenvale, PO Box 883, Kenmore Qld 4069, Australia
*
Author to whom correspondence should be addressed.
Appl. Sci. 2019, 9(21), 4699; https://doi.org/10.3390/app9214699
Submission received: 23 September 2019 / Revised: 21 October 2019 / Accepted: 29 October 2019 / Published: 4 November 2019
(This article belongs to the Section Energy Science and Technology)

Abstract

:

Featured Application

Temperature dependent in-situ Raman spectroscopy was applied to study the structure of coals at high temperature.

Abstract

Raman spectroscopy can be used to record the characteristic spectra of carbonaceous materials. The D and G bands are the most popular and most important spectral characteristics when discussing carbonaceous materials. In this paper, a Raman spectroscopic study of different coals was first carried out using a 355 nm wavelength laser beam as an excitation source. The spectral parameters of the resultant spectra were evaluated and analyzed. Raman spectral characteristics of different kinds of coals were explored. The high temperature-dependent Raman spectra of the coals were further collected in a temperature range from 298 to 1473 K in order to investigate the transformations of the internal structure of the coals during the pyrolysis process. An abnormal blue shift of the G band occurred at moderate temperature (600–900 K), and the intensity of the G band became weaker at high temperatures, indicating pyrolysis and graphitization of the sample at moderate and high temperature, respectively.

1. Introduction

Raman spectroscopy has been used to study carbonaceous materials since the 1970s [1]. As a unique type of spectroscopy, Raman spectroscopy has many advantages in coal structure analysis over other techniques [2]. Raman spectroscopy can provide fast, simple, repeatable, and lossless qualitative and quantitative analysis of defects, and has been widely used in the coal chemical industry. Raman spectroscopy can be used to analyze the structure of coal and the quality of organic matter in order to characterize the catalysts in the coal chemical process and to detect heavy fraction leaching [3].
Green et al. [4] have studied the identification of minerals in coals, one of the principal areas of the field, and identified calcite, pyrite, and dolomite by using a micro-Raman spectrometer. Tuinstra and Koenig [5] and Friedel and Carlson [6] have published the first Raman spectrum of coal and reported G (1575–1620 cm−1) and D-bands (1355–1380 cm−1). Tuinstra and Koenig have suggested that the 1575 cm−1 band can be assigned to the graphite E2g mode with D46h crystal symmetry, that the band at 1370 cm−1 can be assigned to the A1g mode, and that the ratio ID/IG relates to the average graphite domain dimension. La. Friedel and Carlson have debated the origin of the band at 1580 cm−1 by investigating IR absorption and the Raman scattering of very finely ground graphite (C–C bonds broken), coal, and carbon black. They have suggested that the band at 1350 cm−1 most likely arises from graphitic structures, and not from aromatic or conjugated carbonyls, as had been suggested earlier. Johnson and Thomas [7] have found that the width of the D-band for chars originates from various ranks of coals and decreases with increasing heat treatment temperature (from 240 cm−1 at 500 °C, with La = 2 nm, to 40 cm−1 at 1900 °C, with La = 7 nm). On the other hand, Benny-Bassez and Rouzaud [8] have found that the G+D’ band of different coals decreases with increasing coal rank, although they did not observe a trend (the D’ peak located around 1620 cm−1 is due to irregular carbon and often appears with the G peaks). Angoni [9] has postulated a simple qualitative analysis in order to distinguish carbonaceous materials with low, medium, and high structural organization by analyzing 15 samples that included graphite, coke, coal and anthracite. He has found that the width of the D band relates to the degree of its disorder, but that neither the D nor the G bands can explain the degree of this disorder.
After analyzing chars generated from the pyrolysis and gasification of Australian brown coal by Raman spectroscopy, Chunzhu Li et al. [10] have identified 10 characteristic bands that they believe are attributable to the highly disordered carbon structure of coal [11]. Sheng [12] has studied the relationship between the microstructure and the combustion reactivity of coal char by Raman spectroscopy [13].
Recently, much research has been carried out on the application of Raman spectroscopy to coal. Raman spectroscopy has been applied to rapidly determine organic matter maturity and value the chemical structure and thermal maturity of vitrinite [14,15]. The relationship between coal structures and combustion characteristics has been investigated by micro-Raman spectroscopy, which can provide a new approach to rapidly predicting the coal properties by observing the reasonable correlations between the Raman spectral parameters and Vdaf [2]. In addition, Raman spectroscopy has been used to distinguish components of graphitized coals and quantitatively evaluate vitrinite reflectance in shale [16,17].
An in-situ study at high temperature [18] can provide valuable information concerning structural evolution for fundamental research on coal pyrolysis. The changes in chemical bonds identified by in-situ infrared spectroscopy studies of coal pyrolysis [19,20] provided useful information on chemical bond dissociation. An in-situ high temperature Raman technique can also offer a unique tool for observing different characteristics of coal. In-situ Raman spectroscopy [21] has been widely used in many fields. However, research on temperature-dependent in-situ Raman spectroscopy of carbon materials is lacking. This paper describes an in-situ high temperature Raman spectroscopy study on selected coals and the evolution of the internal structural of coal during heating.

2. Experimental

2.1. Raman Spectrometer

Temperature-dependent Raman spectra were collected using a Horiba Jobin Y’von LabRam 800 HR Raman spectrometer. In comparison to inorganic materials such as alumino-silicates, carbonaceous materials or other organic components behave less sensitively when subjected to a laser beam of a short wavenumber and therefore have less cross-sectional penetration. The test sample was heated in an Ar atmosphere by a Linkam 1500 heating stage with a temperature deviation of less than +/−1 K in order to investigate the microstructure evolution of the samples. A charge-coupled-device (CCD) detection system was used to record the Raman scattering light at an accumulated mode of 20 × 20 (20 times, each of 20 s). The samples were held at the targeted temperature for 60 min before collecting Raman spectra in order to ensure they reached the targeted.
At first, 532 nm and 355 nm were selected as the excitation laser wavelengths for temperature-dependent in-situ Raman spectra tests. Figure 1 shows the in-situ Raman spectra of the coal samples using a 532 nm excitation laser. The spectra in the higher wavenumber range experienced interference from the overwhelming fluorescence, which became more severe over time. The fluorescence appeared dramatically when the temperature was higher than 1073 K and remained for a period of time. All coal samples had similar fluorescence interference. Under the circumstances, D and G bands would be difficult to detect. As a result, 355 nm was selected as the excitation laser for the temperature-dependent in-situ Raman spectra test. A 355 nm ultraviolet laser beam of about 20 mW was focused on the sample as an excitation source through a 4× objective lens. A 355 nm laser excitation wavelength was used to ensure a smaller penetration depth in order to collect relative structure information. It was estimated that the penetration depth was several hundred nanometers within the coal samples under the 355 nm laser radiation.

2.2. Coal Samples and Preparation

Six coal samples of varying ranks and with different carbon contents were selected. These samples are shown in Table 1. The elemental content of the coal samples was measured by Elementar vario ELⅢ (Germany) and listed in Table 1. The coal samples were first ground to the size of 0.2 mm and then dried at 40 °C for 12 h. The dry coal powders were stored for further characterization by high temperature Raman spectrometry.
The spectral parameters (e.g., PG, PD, ID/IG, WD, and WG) were calculated from the deconvoluted D and G bands and are discussed as below. All Raman spectra were fitted three times, and the data shown above indicate the average value. The curve-fitting procedure was deconvoluted by Origin 8.0.

3. Results and Discussion

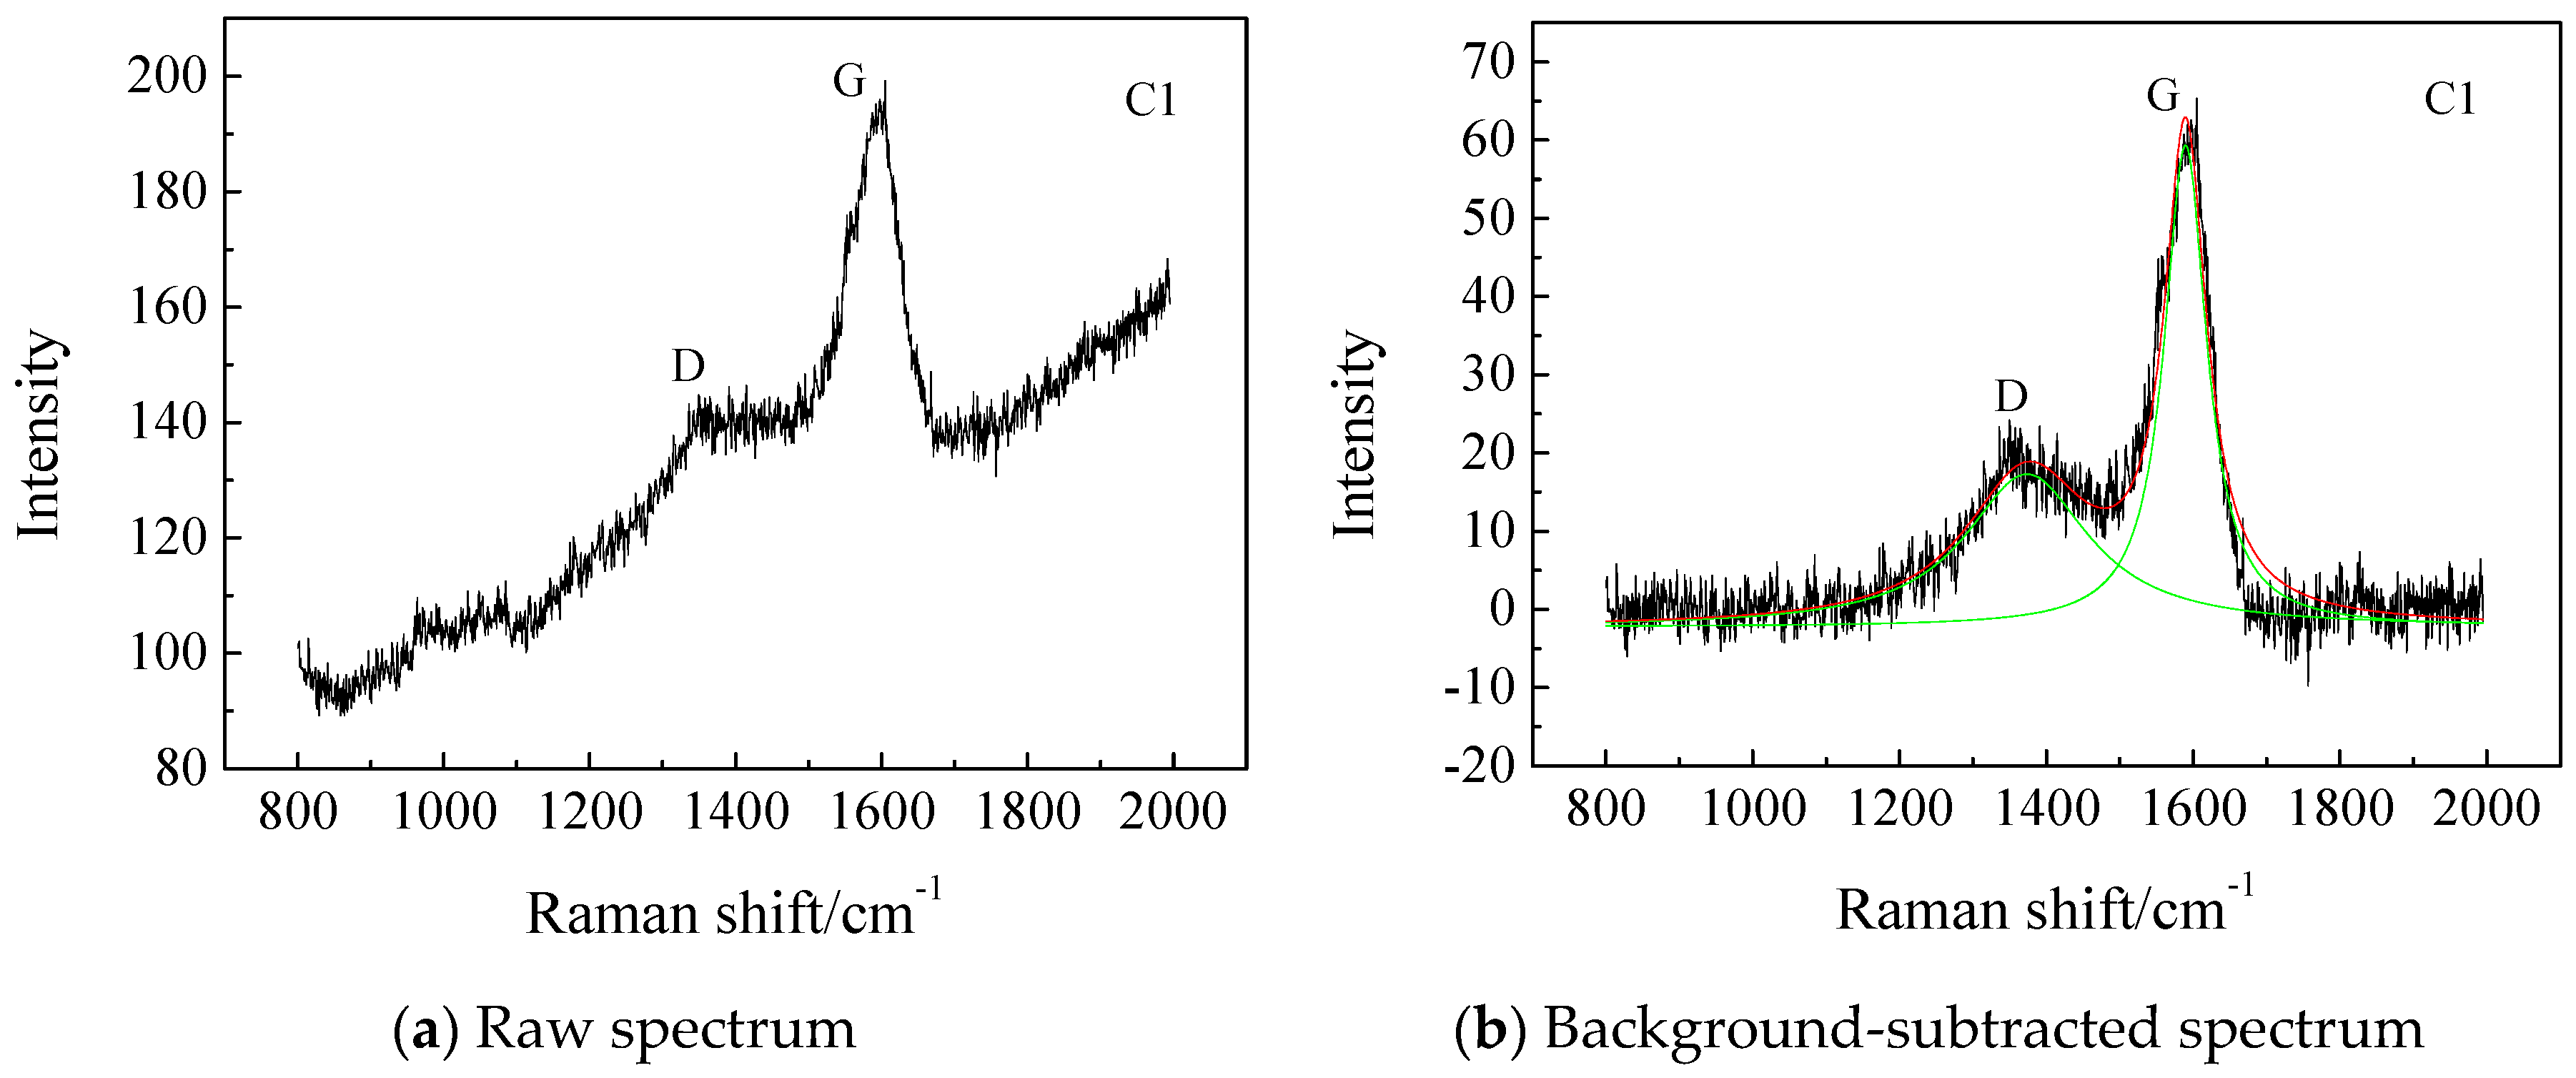
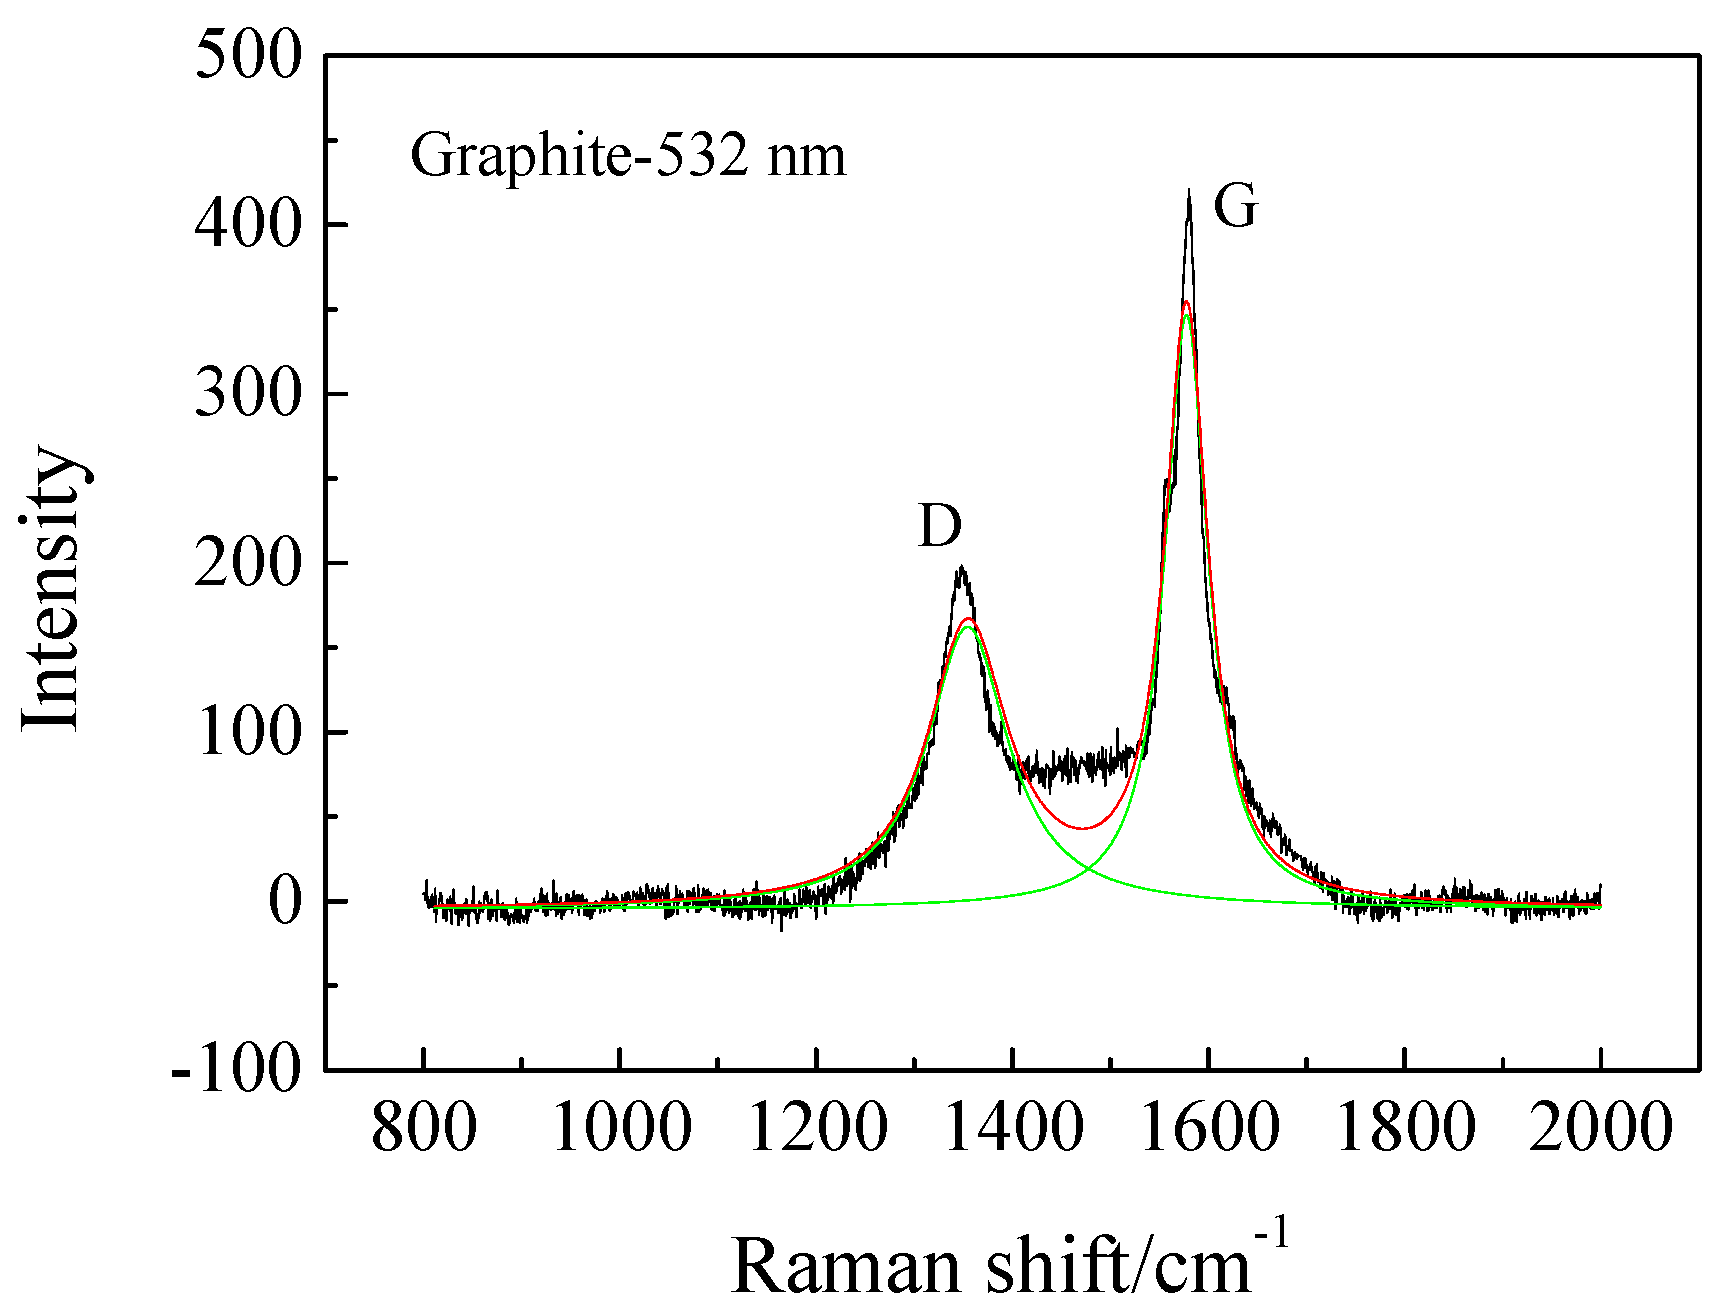
3.1. Room Temperature Raman Spectra of a Typical Coal Sample

Figure 2a shows a typical room temperature Raman spectrum obtained from one of the tested coals (Coal C1). Due to the low transmission efficiency of the ultraviolet light used in the spectrometer at 355 nm, a strong fluorescence interference, as evidenced by the sloping background with the Raman shift, was observed. To avoid the interference from the background, the background was subtracted using the baseline method. The background-subtracted spectrum is shown in Figure 2b.
Two bands are discernible at approximately 1360 and 1590 cm−1. These bands correspond to the D and G bands for graphite in Figure 2. Due to a disordered and defective diamond band or an sp3 hybridization carbon, the D band was assigned to the A1g mode, which relates to the average graphite domain dimension, while the G band was assigned to the graphite E2g mode with D46h crystal symmetry and resulted from a graphitic, tangential band or sp2 hybridization [22]. However, unlike what observed for graphite, the bands were very diffuse and therefore overlapped, most likely due to the fluorescent background. In order to determine the wavenumber position, the relative peak intensity, and the width or full width at half maximum (FWHM), the overlapped Raman bands were further deconvoluted into two well-defined peaks using origin 8.0. (Lorentz function), as shown in Figure 2b. The deconvoluted peaks were then discussed to reveal the structural difference and structural evolution of the coals during pyrolysis. A typical room temperature Raman spectrum of the graphite is shown in Figure 3. In comparison to Figure 3, the coal in Figure 2b showed that both D and G bands had shifted slightly towards the red spectral range.
Furthermore, the difference in the band position of PG, PD, WD, and WG and the area ratio (ID/IG) of the G and D bands were calculated.

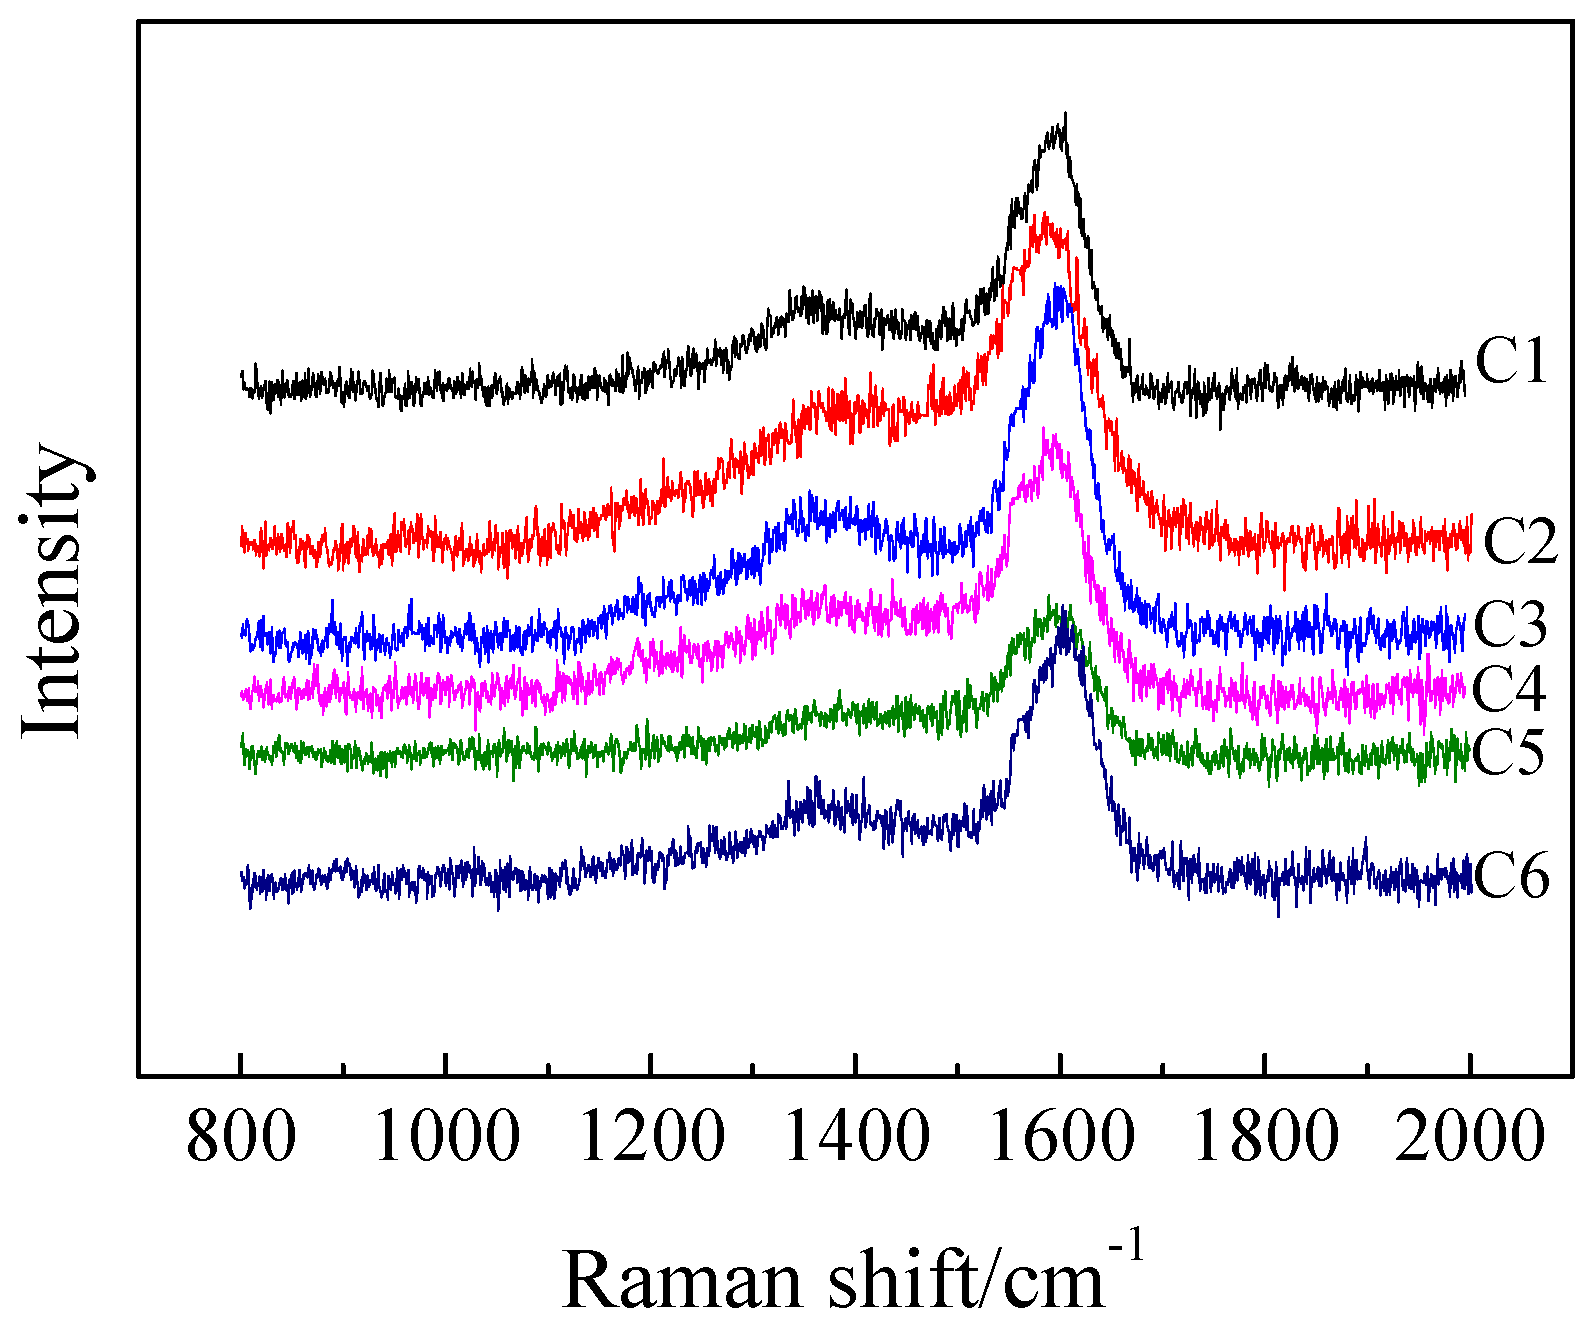
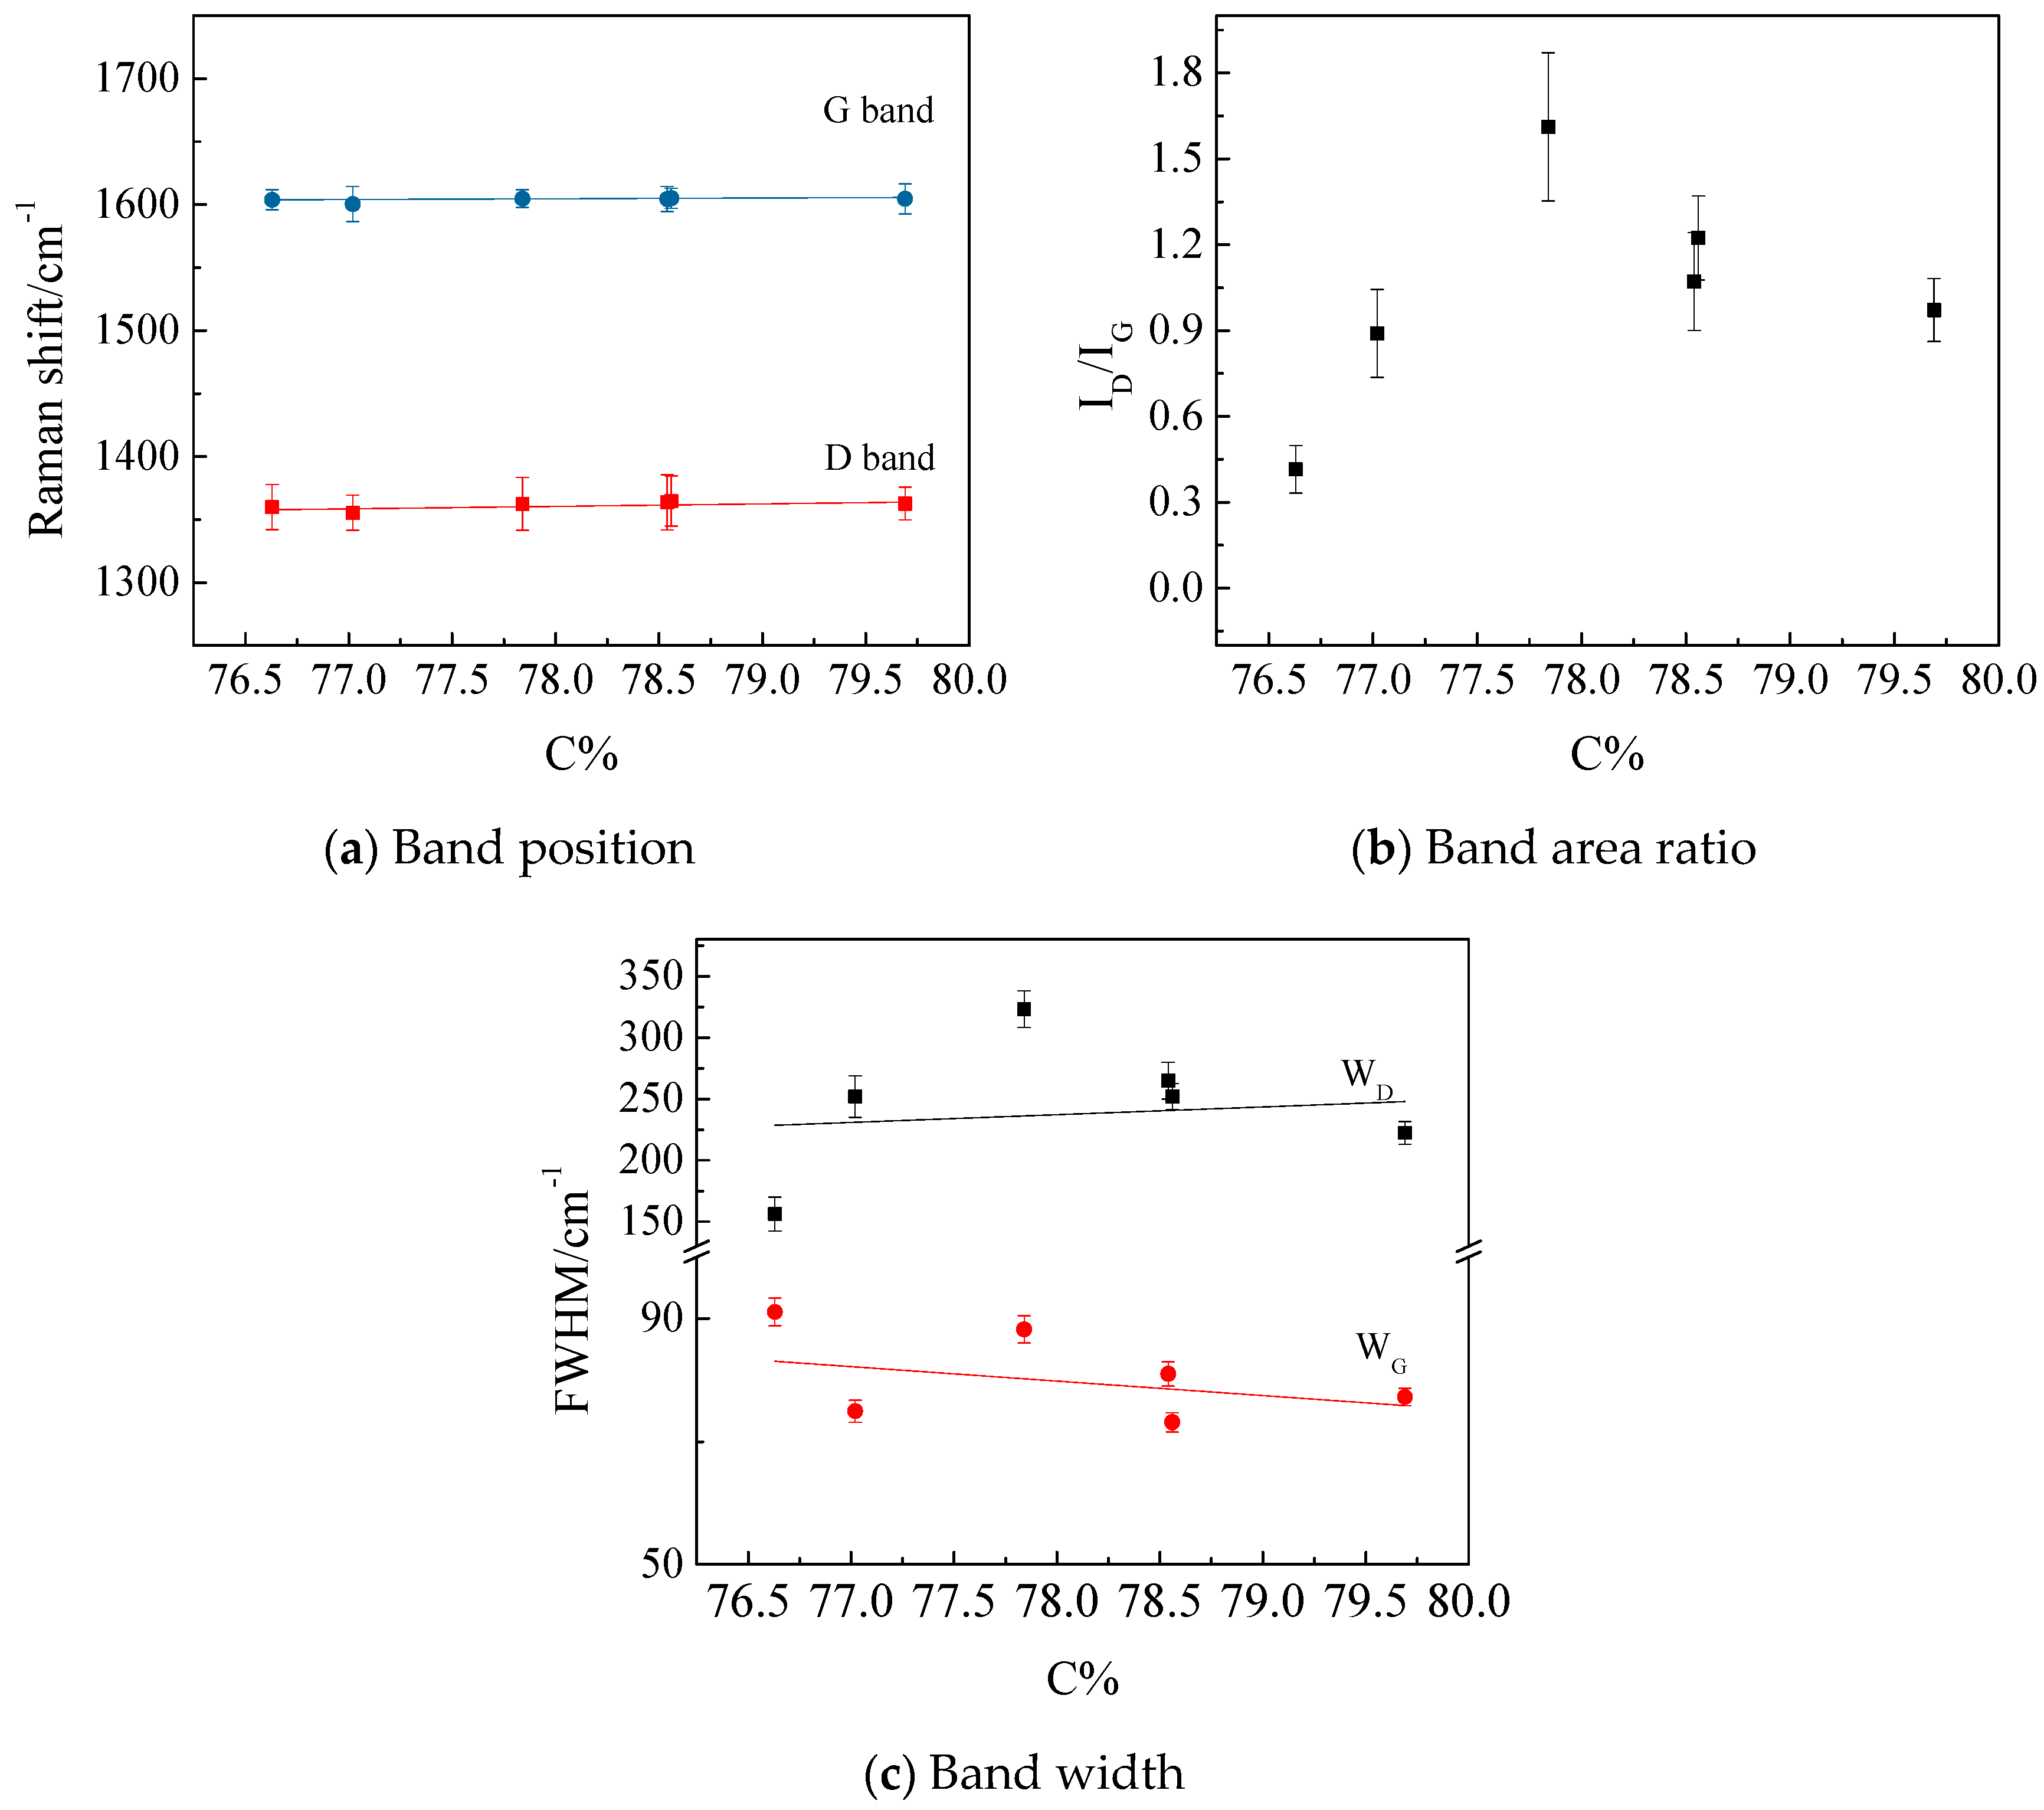
3.2. Microstructure of Coals of Varying Ranks

Figure 4 shows the background subtracted Raman spectra of the tested coal samples. The coal samples clearly showed similar spectral profiles, having two distinct diffuse and overlapped D and G bands.
As shown in Figure 5a, as the carbon content of the coals increased, the deconvoluted D and G bands shifted little. Within a certain range, the D and G bands of the coals seemed independent of the carbon content. However, compared with the G band, the D band shifted more noticeably, suggesting that the carbon content had a greater effect on the D band than on the G band. The D band represents the defects in the lattice of the C atom, while the G band represents the in-plane stretching vibration of the sp2 hybridization of the C atom. With the increase in carbon content, the C=C in the coal samples increases, but the number of disordered substances decreases [23].
Figure 5b shows the effect of carbon content on the area ratio ID/IG of the deconvoluted D and G bands. As shown in Figure 5b, ID/IG increased linearly with the carbon content in the coals. The higher the value of ID/IG, the greater the number of defects that appeared in the C atom. As a result, the defects of the C atom increased with an increase of the carbon content [24].
The effect of the carbon content on the width (FWHM) of the deconvoluted G and D bands is presented in Figure 5c. The D band became broader as the carbon content of the coals increased. By contrast, the G band showed a negligible change. WG can reflect the degree of ordering of carbon materials.
The parameters affected each other. ID/IG is used to quantitatively evaluate the degree of disorder of carbon materials. All parameters of the peaks G and D were affected by the first coalification jump.

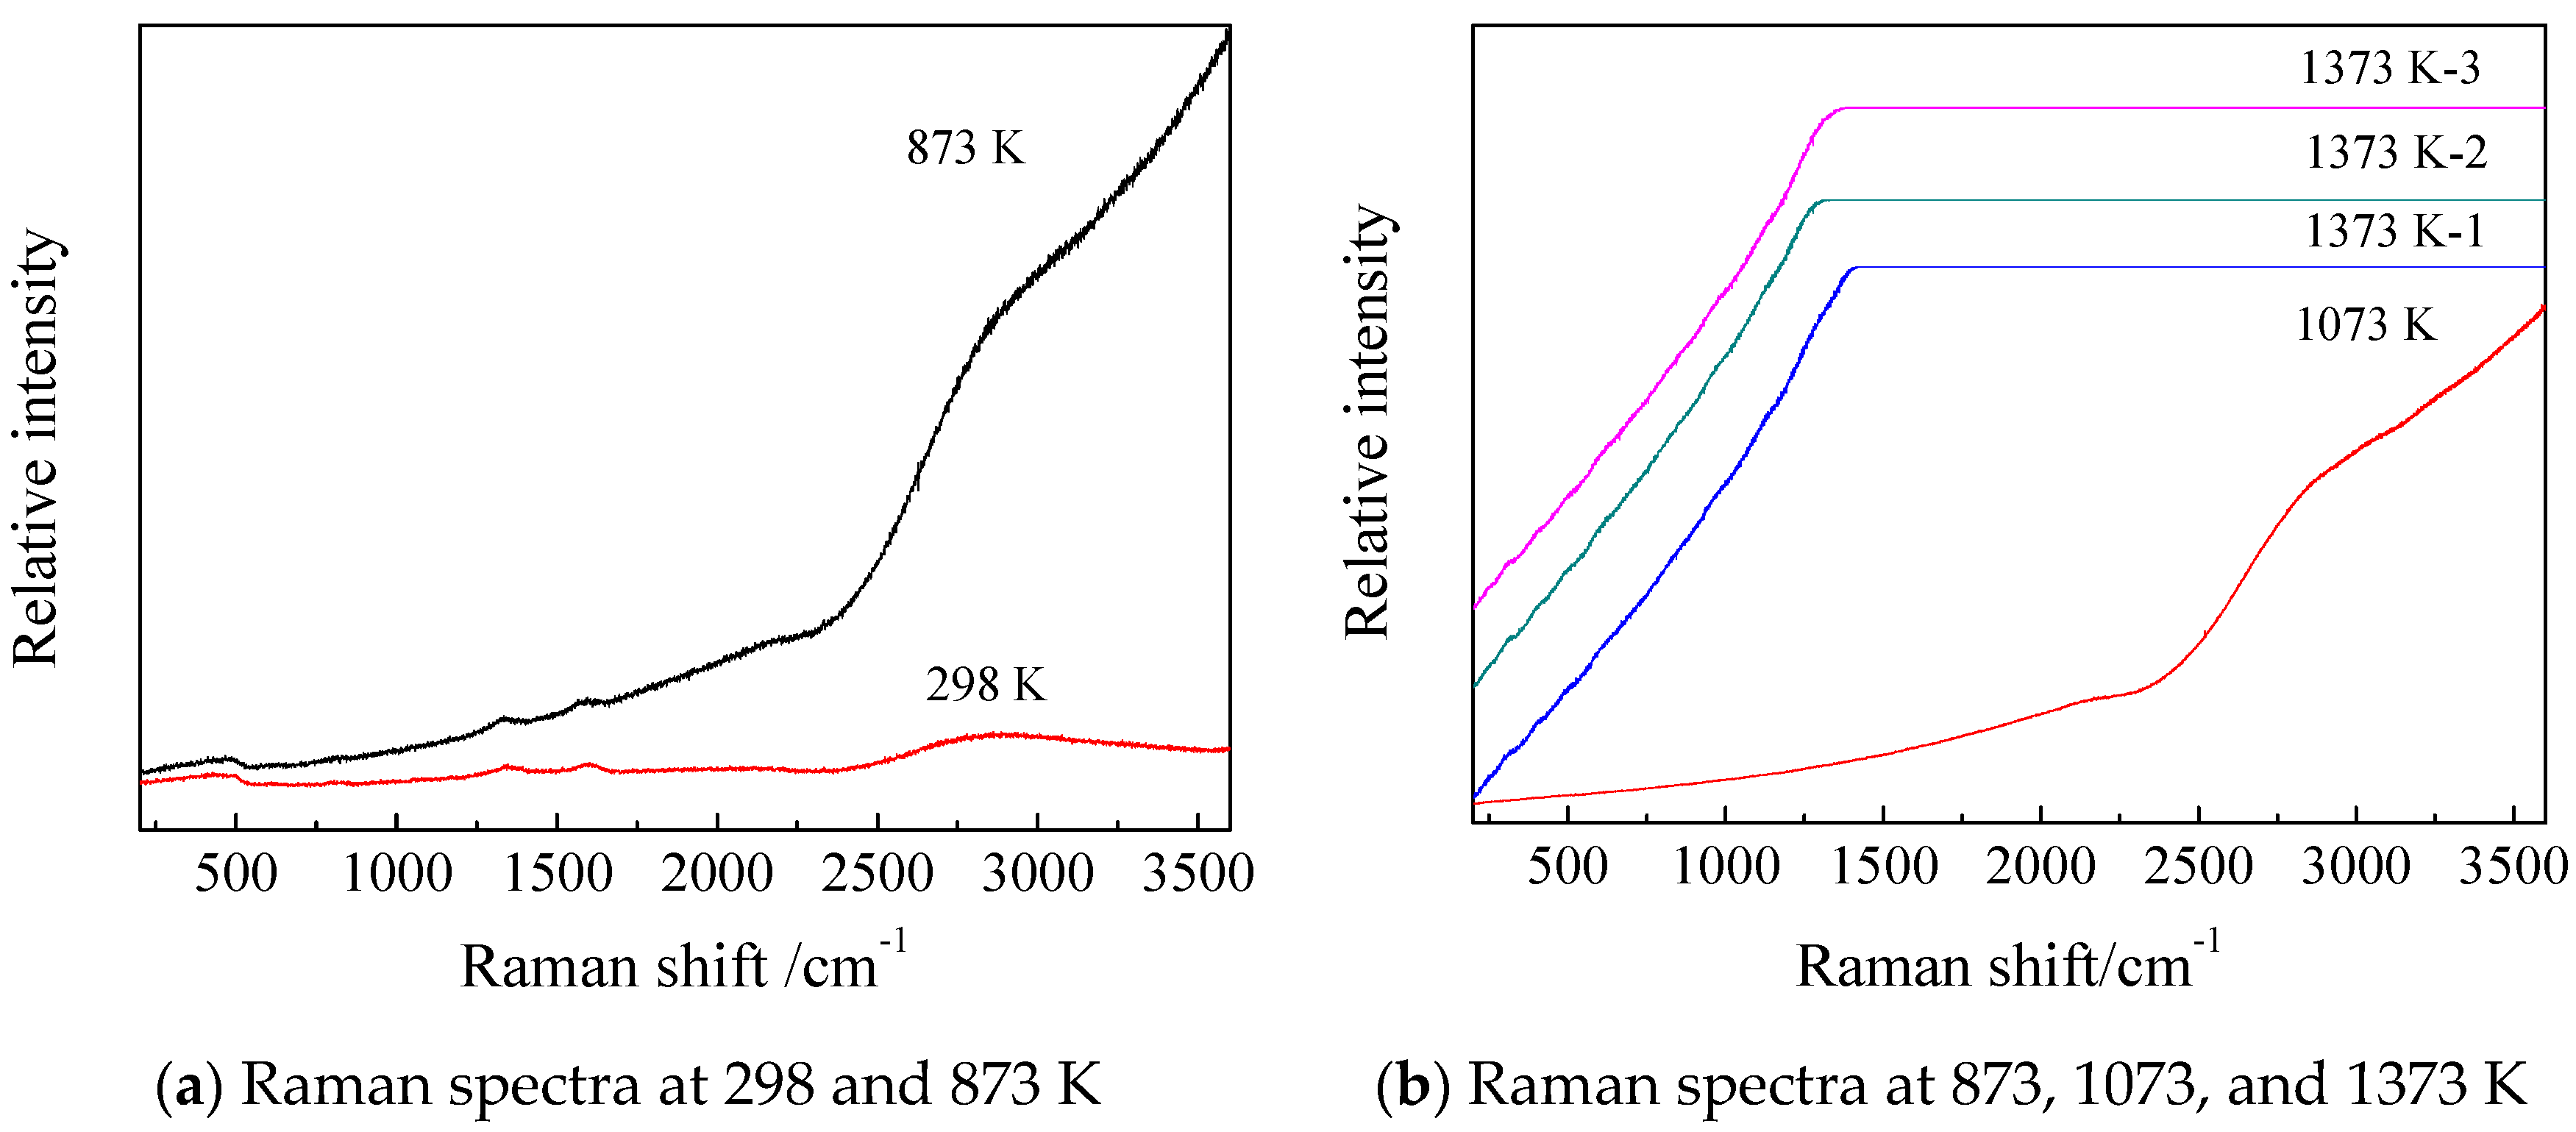
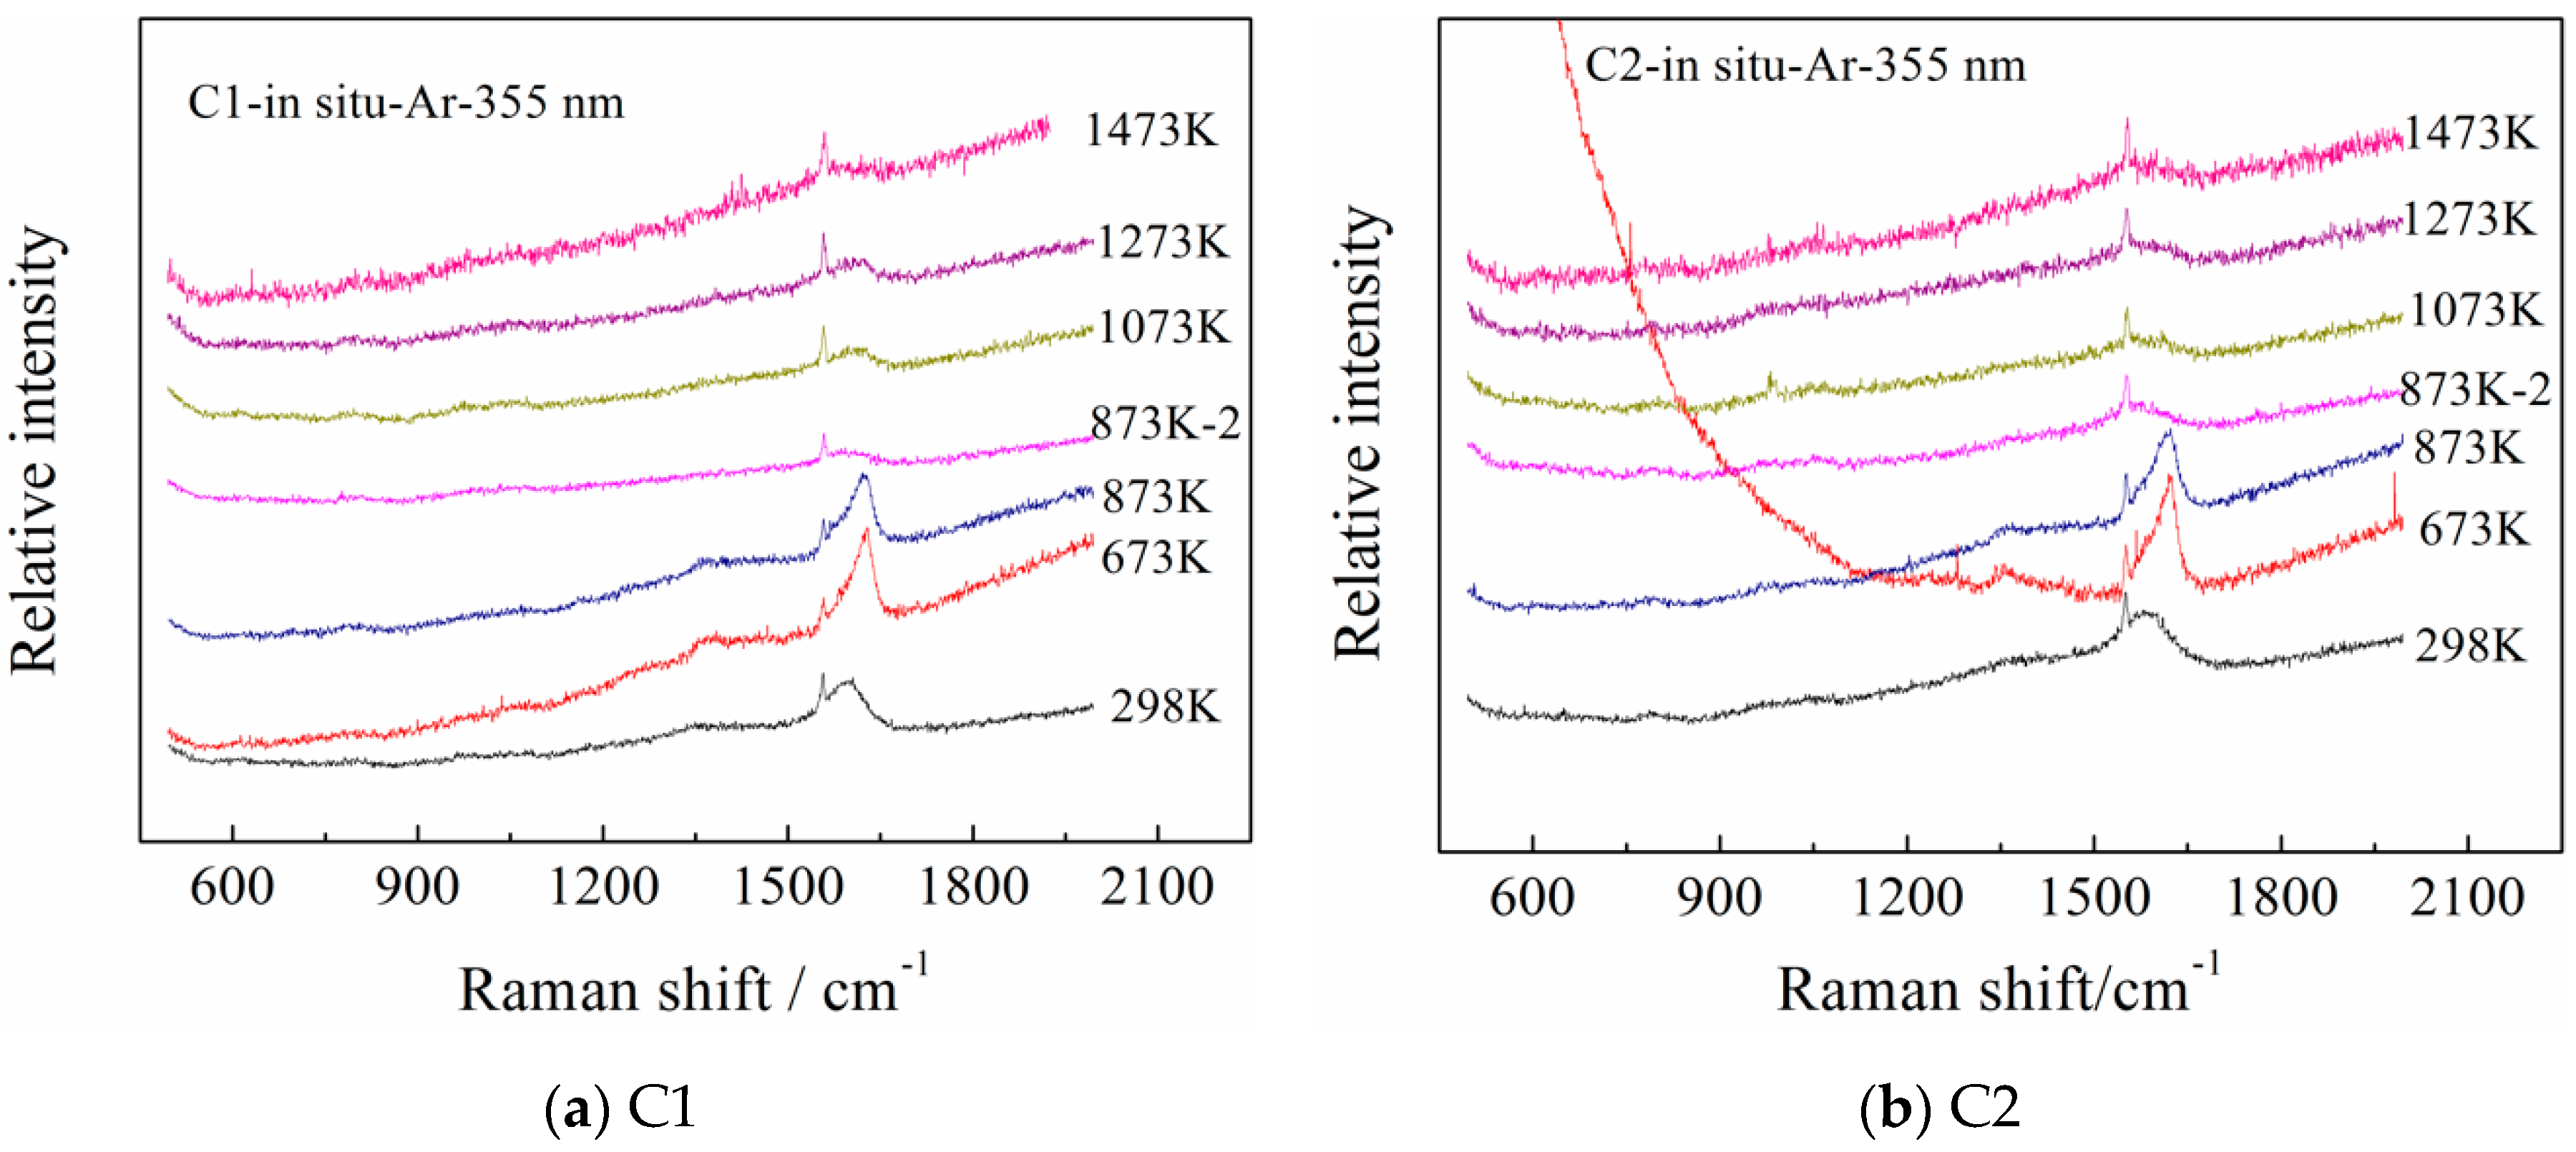
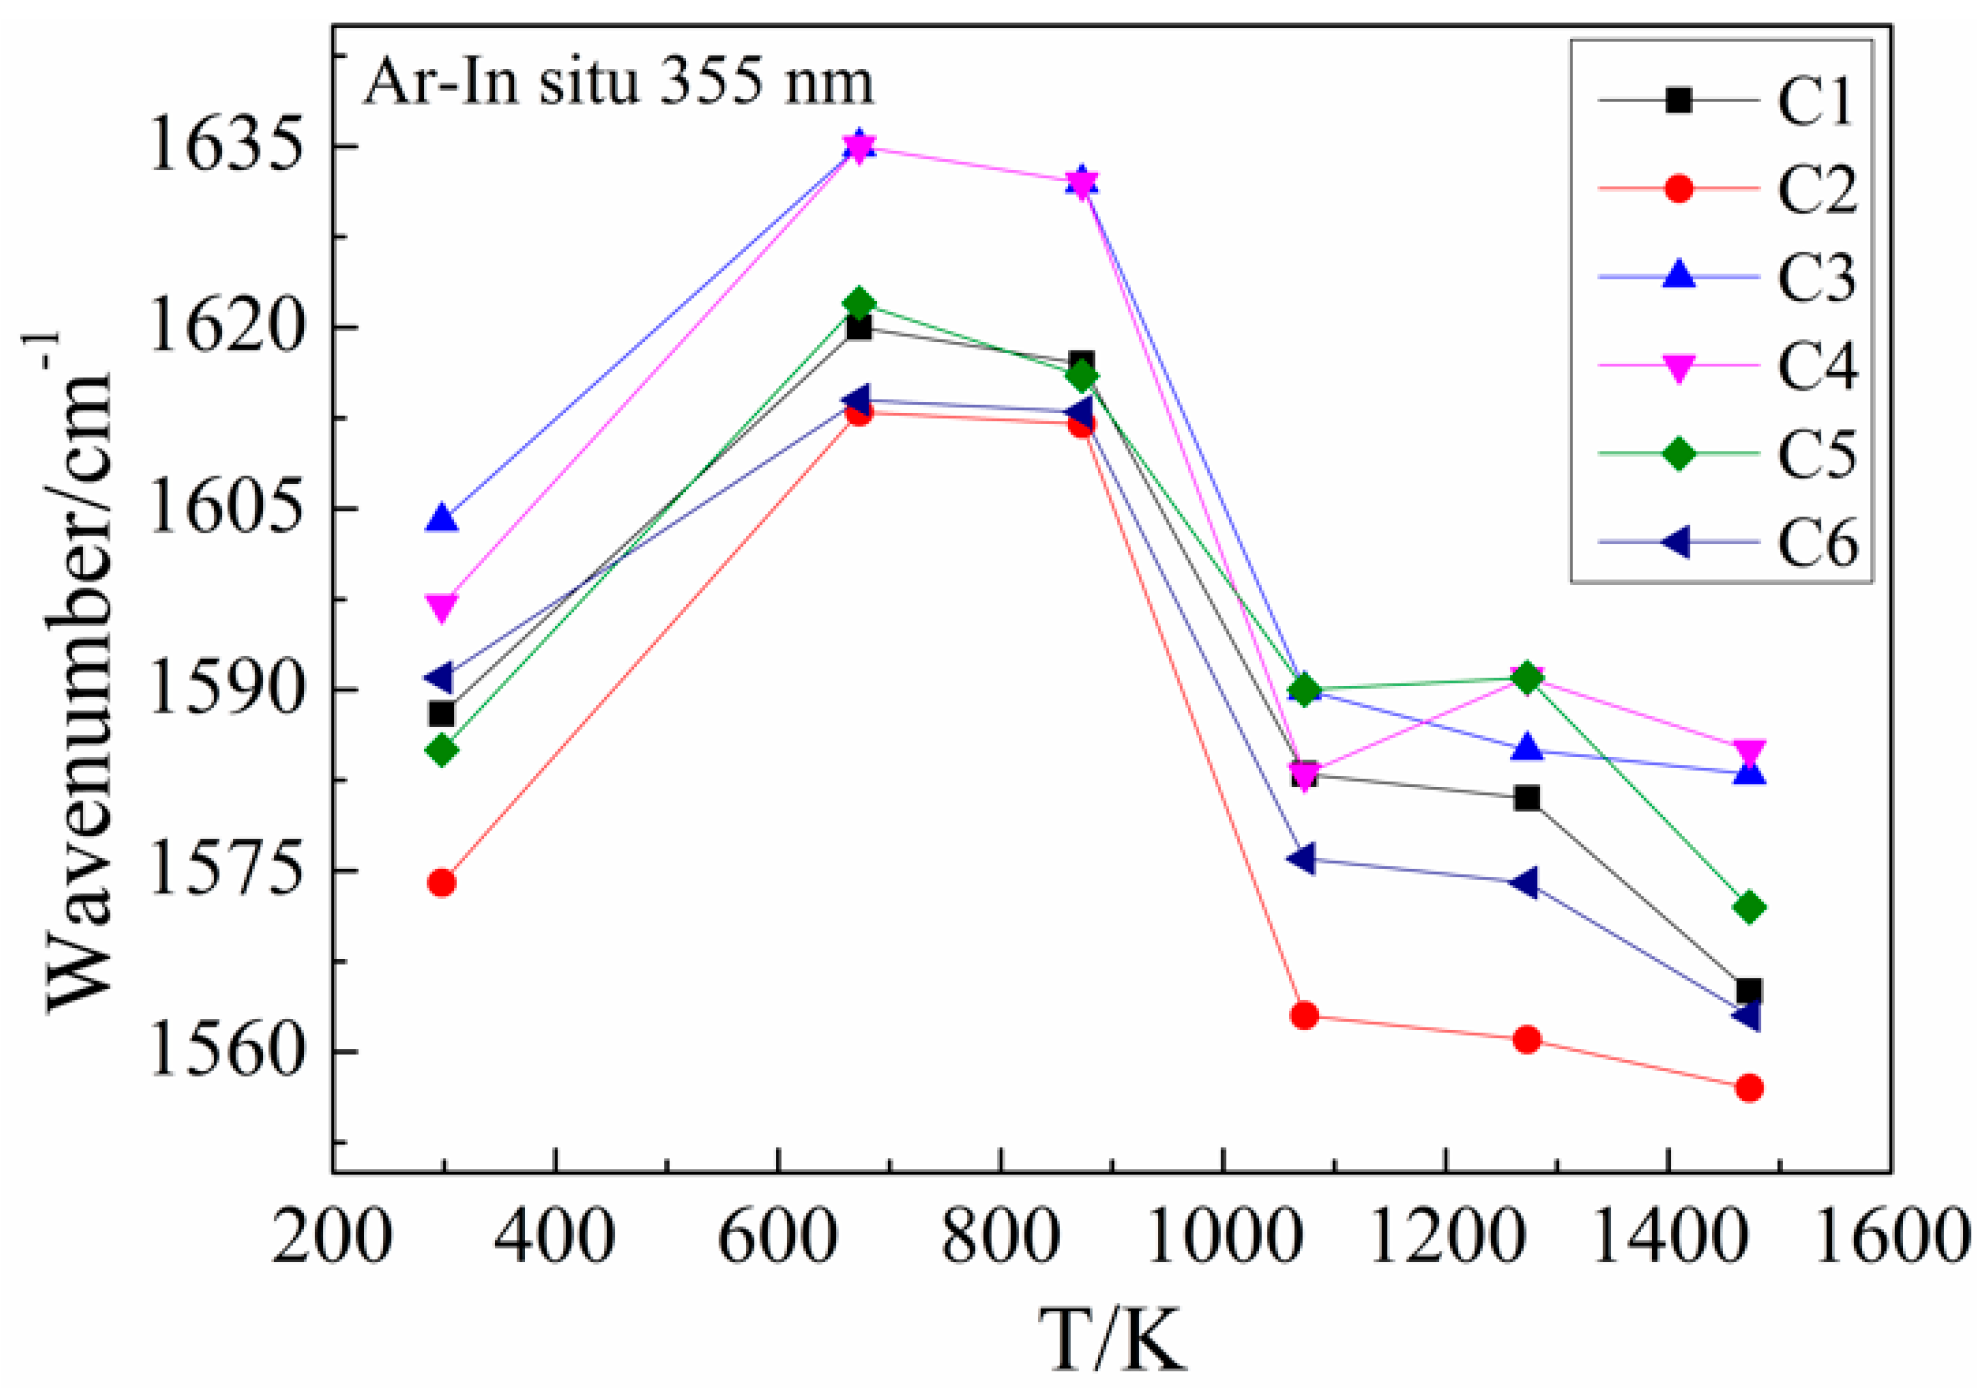
3.3. In Situ High-Temperature Study of Different Coals by RAMAN

Figure 6a shows the in-situ temperature-dependent Raman spectra of coal C1 under an Ar atmosphere. The gas flow was monitored and controlled by the amount of bubbles from water—approximately 160 bubbles per minute. When the sample temperature was lower than 473 K, the sample was heated at a rate of 30 K per min. The heating rate was increased to 50 K per min when the sample temperature was higher than 473 K. The integral time and frequency were 20 × 20 and were increased to 30 × 30 at a temperature of 873 K. A yellow substance was observed at a temperature of approximately 673 K. This substance was believed to be tar oil [25]. The spectrum labeled as 873 K-2 appeared during the second recording, when the sample was reheated to 873 K after it was held at 873 K for 40 min. The sample was then cooled down at 50 K/min to room temperature. This cooling allowed for the cleaning of the silica glass prior to measurement.
Figure 6b shows the in-situ temperature-dependent Raman spectra of coal C2 under an Ar atmosphere. The integral time and frequency were set at 30 × 30 s in the entire heating process. From Figure 6, it is clear that the peak position of the D band related to the low molecular weight carbon organics, while the intensity of the D band changed negligibly with the increasing temperature [26,27]. This implies an increase in the graphitization degree along with the increase in temperature. The low molecular weight carbon organics condensed considerably, starting to devolatilize at 673 K. Some of these organics stayed on the coal samples in a liquid state for some time. Most heavy molecular weight carbon organics seemed to condense and devolatilize starting at a temperature of 873 K. This suggests that there could be more heavy molecular weight carbon organics condensing and devolatilizing or moving from the coal samples in the range of 873 K to 1273 K, disappearing rapidly at 1473 K. By contrast, the G peak position showed a blue shift with an increase in temperature, and its intensity became weaker due to the decreasing devolatilized content in the samples. This demonstrated that the G peak position was affected by the devolatilization of the coal samples.
Generally, the Raman band would shift to a lower wavenumber and become smaller in intensity with an increase in temperature if no phase transformation takes place.
From Figure 6b, it is clear that the spectrum at 673 K seemed quite different from the corresponding spectrum of C1 in Figure 6a. This difference was the result of the appearance and extension of the Rayleigh line. During pyrolysis, small liquid molecules on the surface where the sampling point is focused can occasionally enhance Rayleigh scattering, but this phenomenon occurs differently each time.
This finding may imply the presence of a liquid substance on the coal samples. A gas, liquid, and solid three-phase coexistence was reported during coal pyrolysis from 673 to 873 K [15,28]. When the temperature exceeded the curing temperature of 873 K, an adhesion phenomenon seemed to occurr, resulting in the formation of tar oil or char [29,30], which covered the silica glass. The samples then needed to be cooled down at 50 K per min, from 873 K to room temperature, which allowed the silica glass to be cleaned. Finally, the samples were reheated to 873 K for further observation.
The effect of temperature on the peak position variations of the G band of the samples pyrolyzed under an Ar atmosphere is shown in Figure 7. Generally, the spectral lines show a linear decline trend as the temperature increases in the in-situ temperature-dependent Raman spectra [31,32]. As a result of the condensation of the low molecular weight carbon organics that was discovered to be coal tar [33], this variation in the peak position of the G band was complex and consisted of the coalification processes of condensation, crystallization, coking, and devolatilization during the entire pyrolysis process. As shown in Figure 7, from room temperature to 673 K, a blue shift was observed for the G band as more coal tar that was generated and adhered to the coal samples evaporated. A critical point was also observed at a temperature of 873 K. A red shift was observed, which was most likely due to the normal displacement and the devolatilization of coal tar generated in large quantities on the surface of the coal samples. This was followed by the coking stage from 873 to 1073 K and the devolatilization stage from 1073 to 1473 K. At the same time, the peak positions of the G band at 1073 and 1273 K were quite different from the peak position of the second value at 873 K. This finding confirms the results of the previous discussion [34].

4. Conclusions

The carbon content has little effect on the positions of the D band and G band. The parameters (PG, PD, ID/IG, WD, and WG) of the D and G bands were discussed. The parameters affected each other. Among them, ID/IG is used to quantitatively evaluate the degree of disorder of carbon materials.
During an in-situ high temperature-dependent pyrolysis process, the peak position of the D band seems related to the low molecular weight carbon organics. Since the low molecular weight carbon organics condensed and devolatilized, the intensity of the D band changed negligibly with an increase in temperature. Meanwhile, the position of the G band was shifted to blue, and its intensity became weaker with an increase in temperature, which was the result of aa decrease in devolatilized contents in the samples. The G peak position variation was affected by condensation and devolatilization of the low molecular weight carbon organics and the heavy molecular weight carbon organics inside the coal samples. This variation in the peak position of the G band reflects the coalification processes of condensation, crystallization, coking, and devolatilization during the entire pyrolysis process.
Raman spectroscopy has clear potential for the diagnostic identification of coal and for coking optimization.

Author Contributions

Experiment and writing and original draft preparation, Y.X.; writing, review, and editing, J.Y. and L.L.; data curation, M.W. and J.W.

Funding

This research was funded by the National Natural Science Foundation of China, grant number 21773152; the national 111 project (the Programme of Introducing Talents of Discipline to Universities), grant number D17002; the Shanghai Committee of Science and Technology Fund, China, grant number 12520709200; the Open Project Program of the State Key Laboratory of Advanced Special Steel, Shanghai University, China, grant number SKLASS2015-01; and the Special Fund Project of Shanghai Municipality for Science and Technology Development, grant number YDZX20173100001316.

Conflicts of Interest

The authors declare no conflict of interest.

References

  1. Potgietero-Vermaak, S.; Maledi, N.; Wagner, N.; Van Heerden, J.H.P.; Van Grieken, R.; Potgieter, J.H. Raman spectroscopy for the analysis of coal: A review. J. Raman Spectrosc. 2011, 42, 123–129. [Google Scholar] [CrossRef]
  2. Xu, J.; Tang, H.; Su, S.; Liu, J.W.; Xu, K.; Qian, K.; Wang, Y.; Zhou, Y.B.; Hu, S.; Zhang, A.C.; et al. A study of the relationships between coal structures and combustion characteristics: The insights from micro-Raman spectroscopy based on 32 kinds of Chinese coals. Appl. Energy 2018, 212, 46–56. [Google Scholar] [CrossRef]
  3. Zhou, X.-B.; Long, Z.; Liang, S.; He, Y.; Yi, L.Z.; Li, D.L.; Liang, D.Q. In situ Raman analysis on the dissociation behavior of mixed CH4-CO2 hydrates. Energy Fuels 2016, 30, 1279–1286. [Google Scholar]
  4. Green, P.D.; Johnson, C.A.; Thomas, K.M. Application of laser Raman microprobe spectroscopy to the chaaracterization of coals and cokes. Fuel 1983, 62, 1013–1023. [Google Scholar] [CrossRef]
  5. Tuinstra, F.; Koenig, J.L. Raman spectrum of graphite. J. Chem. Phys. 1970, 53, 1126–1130. [Google Scholar] [CrossRef]
  6. Friedel, R.A.; Carlson, G.L. Difficult carbonaceous materials and their infra-red and Raman spectra. Reassignments for coal spectra. Fuel 1972, 51, 194–198. [Google Scholar] [CrossRef]
  7. Johnson, C.A.; Patrick, J.W.; Thomas, K.M. Characterization of coal chars by Raman spectroscopy, X-ray diffraction and reflectance measurements. Fuel 1986, 65, 1284–1290. [Google Scholar] [CrossRef]
  8. Rouzaud, J.N.; Oberlin, A.; Beny-Bassez, C. Carbon films: Structure and microtexture (optical and electron microscopy, Raman spectroscopy). Thin Solid Films 1983, 105, 75–96. [Google Scholar] [CrossRef]
  9. Angoni, K. Remarks on the structure of carbon materials on the basis of Raman spectra. Carbon 1993, 31, 537–547. [Google Scholar] [CrossRef]
  10. Zhang, S.; Luo, Y.G.; Li, C.Z.; Wang, Y.G. Changes in char reactivity due to char-oxygen and char-steam reactions using victorian brown coal in a fixed-bed reactor. Chin. J. Chem. Eng. 2015, 33, 385–390. [Google Scholar] [CrossRef]
  11. Morga, R.; Jelonek, I.; Kruszewska, K. Relationship between coking coal quality and its micro-Raman spectral characteristics. Int. J. Coal Geol. 2014, 134–135, 17–23. [Google Scholar] [CrossRef]
  12. Sheng, C.D. Char structure characterised by Raman spectroscopy and its correlations with combustion reactivity. Fuel 2007, 86, 2316–2324. [Google Scholar] [CrossRef]
  13. Zhu, H.-L.; Yu, G.-S.; Guo, Q.-H.; Wang, X.-J. In Situ Raman spectroscopy study on catalytic pyrolysis of a bituminous coal. Energy Fuels 2017, 31, 5817–5827. [Google Scholar] [CrossRef]
  14. Henry, D.G.; Jarvis, I.; Gillmore, G.; Stephenson, M. A rapid method for determining organic matter maturity using Raman spectroscopy: Application to Carboniferous organic-rich mudstones and coals. Int. J. Coal Geol. 2019, 203, 87–98. [Google Scholar] [CrossRef]
  15. Zhang, Y.L.; Li, Z.S. Raman spectroscopic study of chemical structure and thermal maturity of vitrinite from a suite of Australia coals. Fuel 2019, 241, 188–198. [Google Scholar] [CrossRef]
  16. Li, K.; Rimmer, S.M.; Liu, Q.F.; Zhang, Y.M. Micro-Raman spectroscopy of microscopically distinguishable components of naturally graphitized coals from Central Hunan Province, China. Energy Fuels 2019, 33, 1037–1048. [Google Scholar] [CrossRef]
  17. Lupoi, J.S.; Hackley, P.C.; Birsic, E.; Fritz, L.P.; Solotky, L.; Weislogel, A.; Schlaegle, S. Quantitative evaluation of vitrinite reflectance in shale using Raman spectroscopy and multivariate analysis. Fuel 2019, 254, 115573. [Google Scholar] [CrossRef]
  18. Liu, X.H.; Zheng, Y.; Liu, Z.H.; Ding, H.R.; Huang, X.H.; Zheng, C.G. Study on the evolution of the char structure during hydrogasification process using Raman spectroscopy. Fuel 2015, 157, 97–106. [Google Scholar] [CrossRef]
  19. Xin, H.H.; Wang, D.M.; Qi, X.Y.; Qi, G.S.; Dou, G.L. Structural characteristics of coal functional groups using quantum chemistry for quantification of infrared spectra. Fuel Process. Technol. 2014, 118, 287–295. [Google Scholar] [CrossRef]
  20. Bogdanowicz, K.A.; Pirone, D.; Prats-Reig, J.; Ambrogi, V.; Reina, J.A.; Giamberini, M. In situ Raman spectroscopy as a tool for structural insight into Cation Non-Ionomeric polymer interactions during Ion transport. Polymers 2018, 10, 416. [Google Scholar] [CrossRef]
  21. Tselev, A.; Ivanov, I.N.; Lavrik, N.V.; Belianinov, A.; Jesse, S.; Mathews, J.P.; Mitchell, G.D.; Kalinin, S.V. Mapping internal structure of coal by confocal micro-Raman spectroscopy and scanning microwave microscopy. Fuel 2014, 126, 32–37. [Google Scholar] [CrossRef]
  22. Baysal, M.; Yürüm, A.; Yıldız, B.; Yürüm, Y. Structure of some western Anatolia coals investigated by FTIR, Raman, 13C solid state NMR spectroscopy and X-ray diffraction. Int. J. Coal Geol. 2016, 163, 166–176. [Google Scholar] [CrossRef]
  23. Wang, S.; Li, T.-T.; Wu, L.P.; Zhang, L.; Dong, L.; Hu, X.; Li, C.Z. Second -order Raman spectroscopy of char during gasification. Fuel Process. Technol. 2015, 135, 105–111. [Google Scholar] [CrossRef]
  24. Liu, L.; Cao, Y.; Liu, Q.C. Kinetics studies and structure characteristics of coal char under pressurized CO2 gasification conditions. Fuel 2015, 146, 103–110. [Google Scholar] [CrossRef]
  25. Lu, L.; Sahajwalla, V.; Kong, C.; Harris, D. Quantitative X-ray diffraction analysis and its application to various coals. Carbon 2001, 39, 1821–1833. [Google Scholar] [CrossRef]
  26. Wang, J.; You, J.L.; Sobol, A.A.; Lu, L.M.; Wang, M.; Wu, J.; Lv, X.W.; Wan, S.m. In-situ high temperature Raman spectroscopic study on the structural evolutions of Na2W2O7 from the crystalline to molten states. and its correlations with combustion reactivity. J. Raman Spectrosc. 2016, 48, 298–304. [Google Scholar] [CrossRef]
  27. Wang, M.; You, J.L.; Sobol, A.A.; Lu, L.M.; Wang, J.; Xie, Y.F. In-situ studies of structure transformation and Al coordination of KAl(MoO4)(2) during heating by high temperature Raman and Al-27 NMR spectroscopies. Materials 2017, 10, 310. [Google Scholar] [CrossRef]
  28. Ulyanova, E.V.; Molchanov, A.N.; Prokhorov, I.Y.; Grinyov, V.G. Fine structure of Raman spectra in coals of different rank. Int. J. Coal Geol. 2014, 121, 37–43. [Google Scholar] [CrossRef]
  29. Shui, H.F.; Wu, Y.; Wang, Z.C.; Lei, Z.P.; Lin, C.H.; Ren, S.B.; Pan, C.X.; Kang, S.G. Hydrothermal treatment of a sub-bituminous coal and its use in coking blends. Energy Fuels 2013, 27, 138–144. [Google Scholar] [CrossRef]
  30. Lu, L.M.; Kong, C.H.; Sahajwlla, V.; Harris, D. Char structural ordering during pyrolysis and combustion and its influence on char reactivity. Fuel 2002, 81, 1215–1225. [Google Scholar] [CrossRef]
  31. Zhang, S.; Chen, Z.D.; Zhang, H.Y.; Wang, Y.G.; Xu, X.-Q.; Cheng, L.; Zhang, Y.-M. The catalytic reforming of tar from pyrolysis and gasification of brown coal: Effects of parental carbon materials on the performance of char catalysts. Fuel Process. Technol. 2018, 174, 142–148. [Google Scholar] [CrossRef]
  32. Maslva, O.A.; Mikheikin, A.S.; Leontiev, I.N. Raman spectra of Taunit carbon nanomaterial. Nanotechnol. Russ. 2010, 5, 641–646. [Google Scholar] [CrossRef]
  33. Yu, L.W.; You, J.L.; Wang, Y.Y.; Lu, L.M.; Xie, Y.F.; Liu, X.F. Characterization of coal tar and components identification by Raman spectroscopy. J. Fuel Chem. Technol. 2015, 43, 530–536. [Google Scholar]
  34. Liu, X.F.; You, J.L.; Wang, Y.Y.; Lu, L.M.; Xie, Y.F.; Yu, L.W.; F, Q. Raman spectroscopic study on the pyrolysis of Australian bituminous coal. J. Fuel Chem. Technol. 2014, 42, 270–276. [Google Scholar] [CrossRef]
Figure 1. In-situ Raman spectra of coal samples in Ar atmosphere by using a 532 nm excitation laser.
Applsci 09 04699 g001
Figure 2. A typical room-temperature Raman spectrum of one of the tested coals, C1.
Applsci 09 04699 g002
Figure 3. A typical room temperature Raman spectrum of the tested graphite.
Applsci 09 04699 g003
Figure 4. Background subtracted spectra of coals of different ranks.
Applsci 09 04699 g004
Figure 5. Effect of coal rank on (a) the band position (PG and PD), (b) area ratio (ID/IG), and (c) width of the coal samples.
Applsci 09 04699 g005
Figure 6. Temperature dependence of in-situ Raman spectra of C1 and C2 under an Ar atmosphere using a 355 nm excitation laser.
Applsci 09 04699 g006
Figure 7. In-situ temperature dependence of the peak position of the G band for the samples pyrolyzed under an Ar atmosphere.
Applsci 09 04699 g007
Table 1. Elemental composition of coal samples.
Sample IDN (%)C (%)H (%)S (%)O (%)
C11.8479.694.670.2711.50
C21.9277.844.720.417.23
C31.8178.564.500.5811.00
C41.8878.544.260.7510.70
C52.1276.635.360.649.76
C61.8477.024.620.4411.80

